-

Figure 1.
Simulated (lines) and measured (data points) values of dry matter of (a) early- and (b) late-maturity cultivars.
-

Figure 2.
Simulated (lines) and measured values (data points) of leaf area index (LAI) of (a) early- and (b) late-maturity cultivars.
-

Figure 3.
(a) Simulated vs measured grain yield, (b) dry matter and (c) maximum LAI of common bean in different treatments (2020 and 2021 field experiments). Continuous line : 1 to 1 line.
-

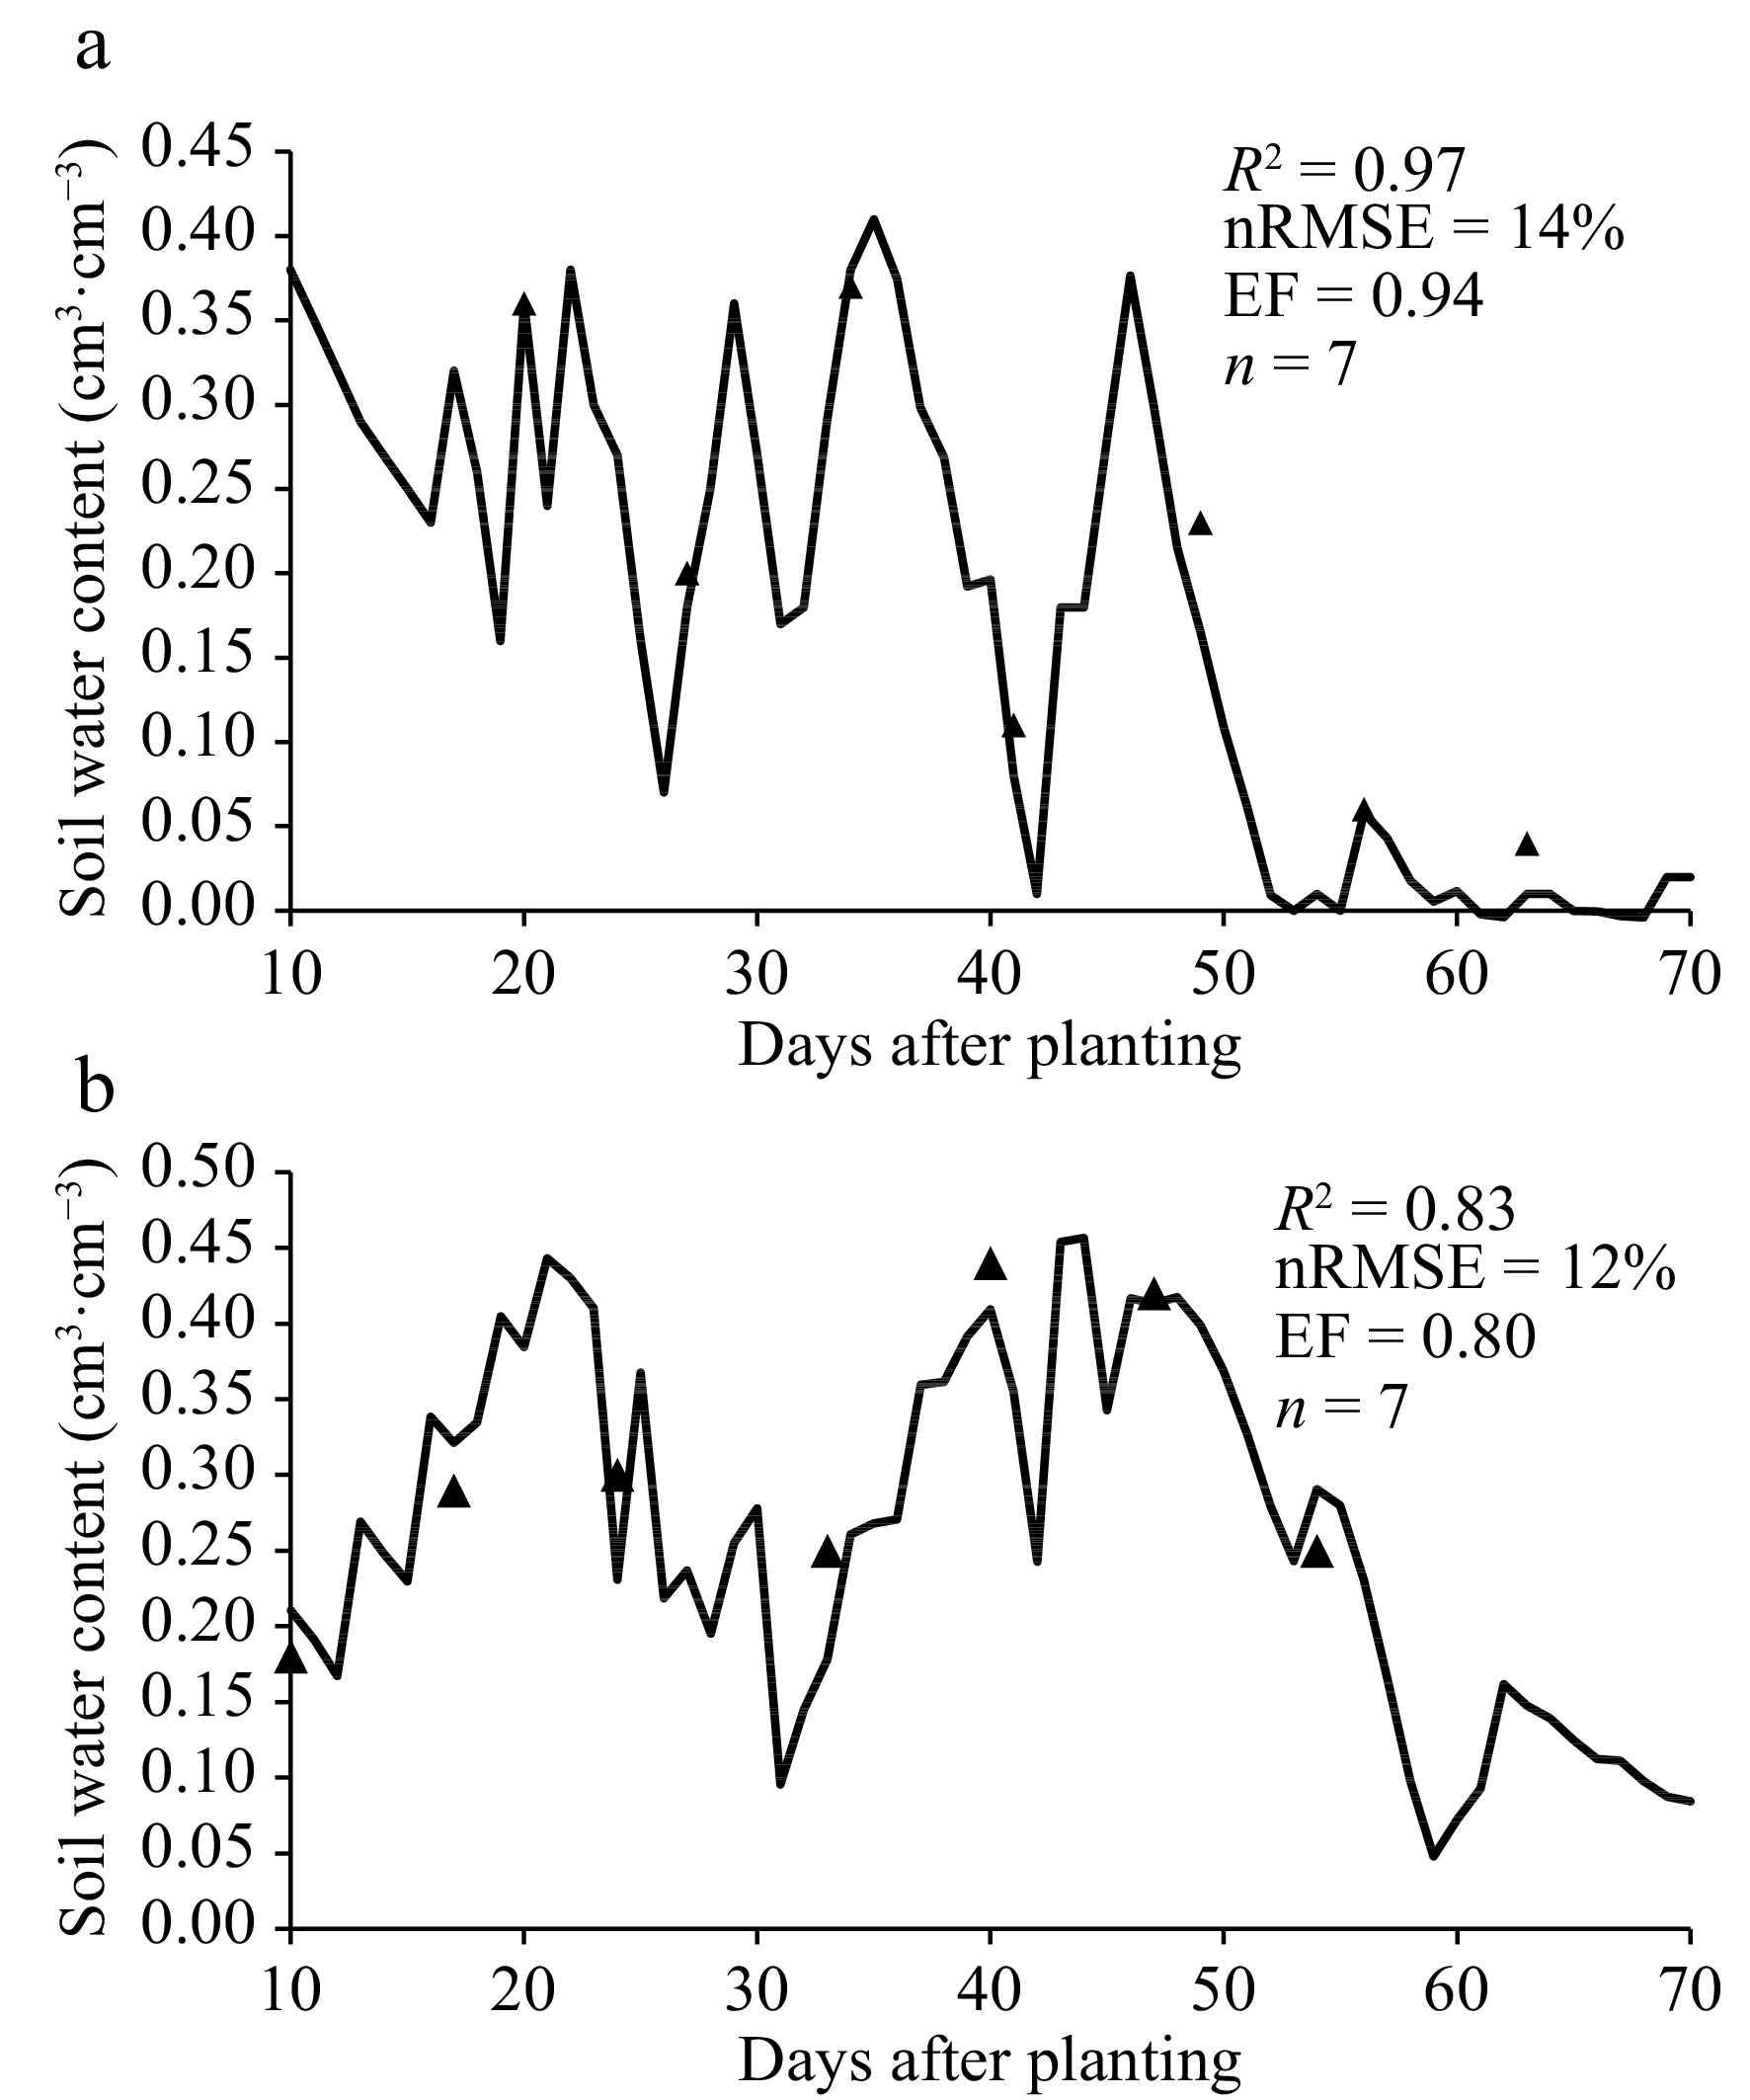
Figure 4.
Comparison of simulated (lines) and observed (data points) soil moisture content at the top soil layer (0–20 cm) in two growing seasons: (a) 2020 and (b) 2021.
-
Parameter Units Parameter description Late-maturity
cultivarEarly-maturity
cultivarCardinal temperatures for thermal time calculation °C Base temperature 7.5 7.5 Optimum temperature 30 30 Maximum temperature 40 40 Shoot_rate Degree-days/mm Thermal time required per mm elongation by young shoot before emergence 0.6 0.56 node_app_rate Degree-days Thermal time required for node appearance on main stem 100 92 Leaves_per_node lf/node No. of leaves per plant per main stem node 2 2 Extinction_coef Extinction coefficient (at default row spacing) 0.40 0.40 Rue g/MJ Radiation-use efficiency 0.94 0.94 frac_leaf_pre_flower Fraction allocated to leaves pre-flowering 0.55 0.60 frac_leaf_grain_fill Fraction allocated to leaves in grain fill 0.30 0.35 frac_stem2 pod Fraction allocated to pod before grain fill 0.46 0.49 frac_pod2 grain Fraction allocated to pod relative to grain during grain fill 0.28 0.28 n_conc_crit g/g Critical nitrogen concentration of grain 0.045 0.045 Specific_root_length mm/g Specific root length 65000 65000 Trans_eff_coef Pa Transpiration efficiency coefficient 0.0055 0.0055 Table 1.
Cultivar-specific parameters for a early- and late-maturity common bean cultivars.
Figures
(4)
Tables
(1)