-
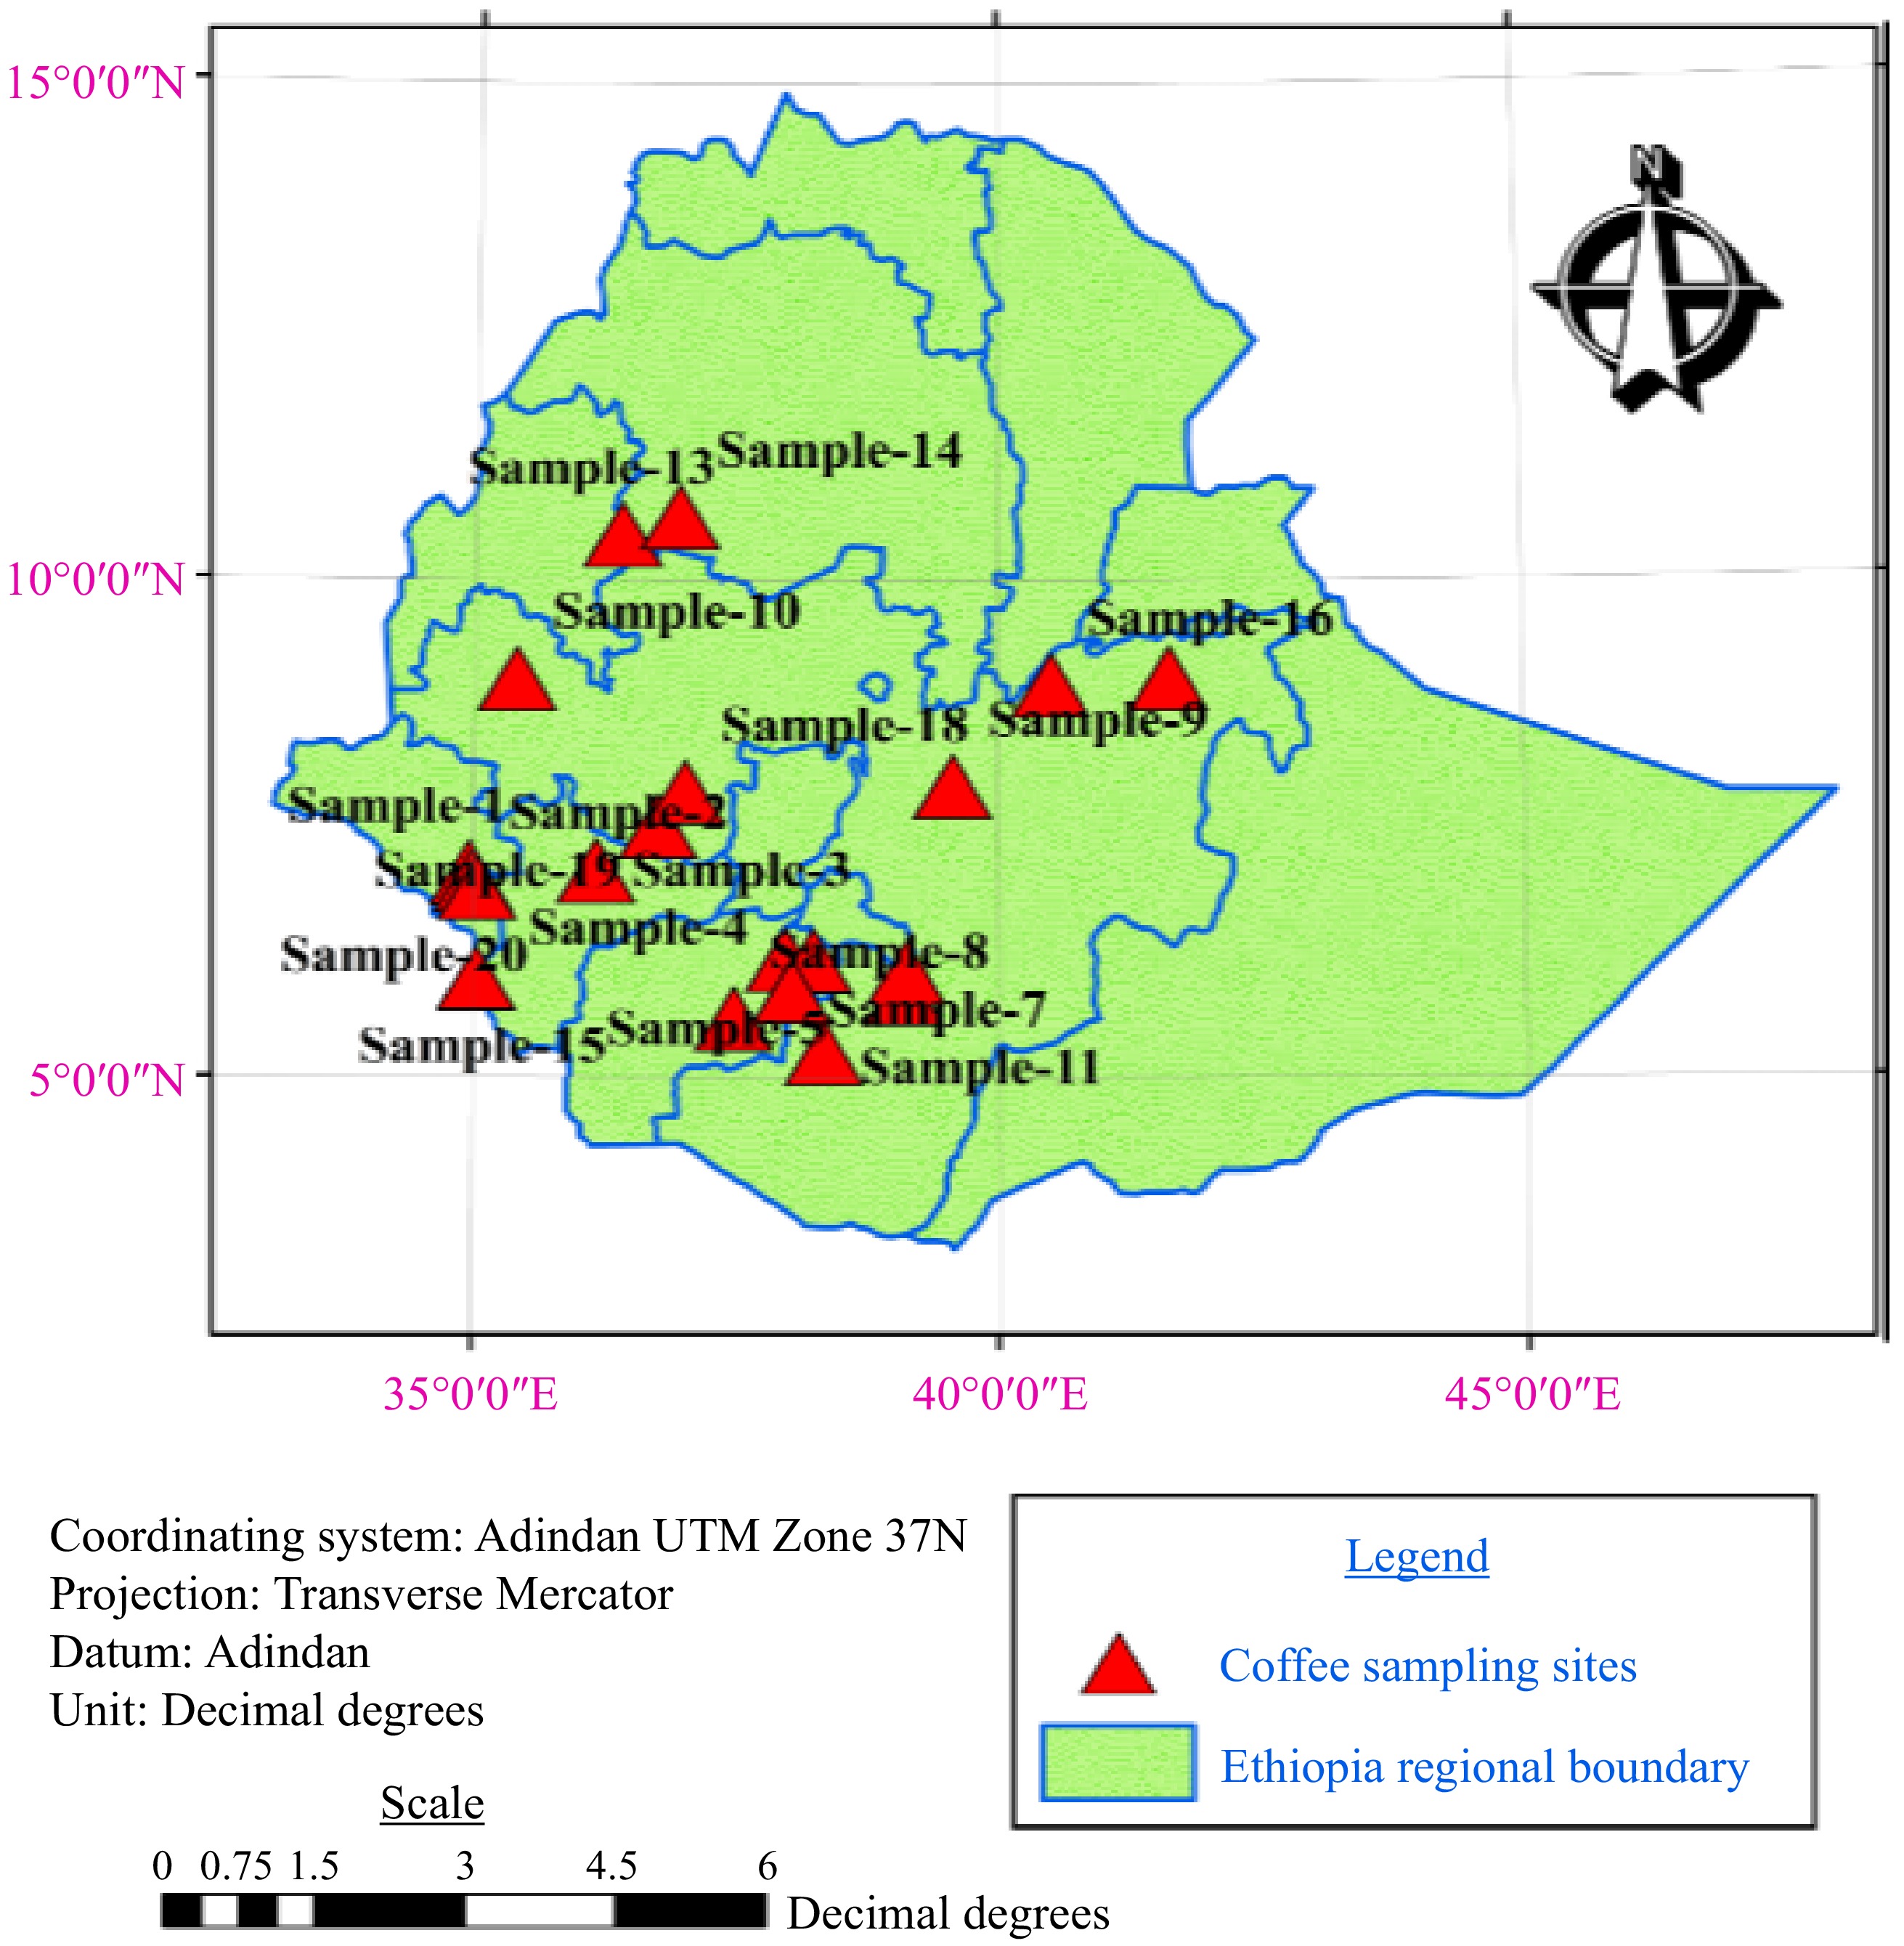
Figure 1.
Map of green Arabica coffee sampling sites.
-
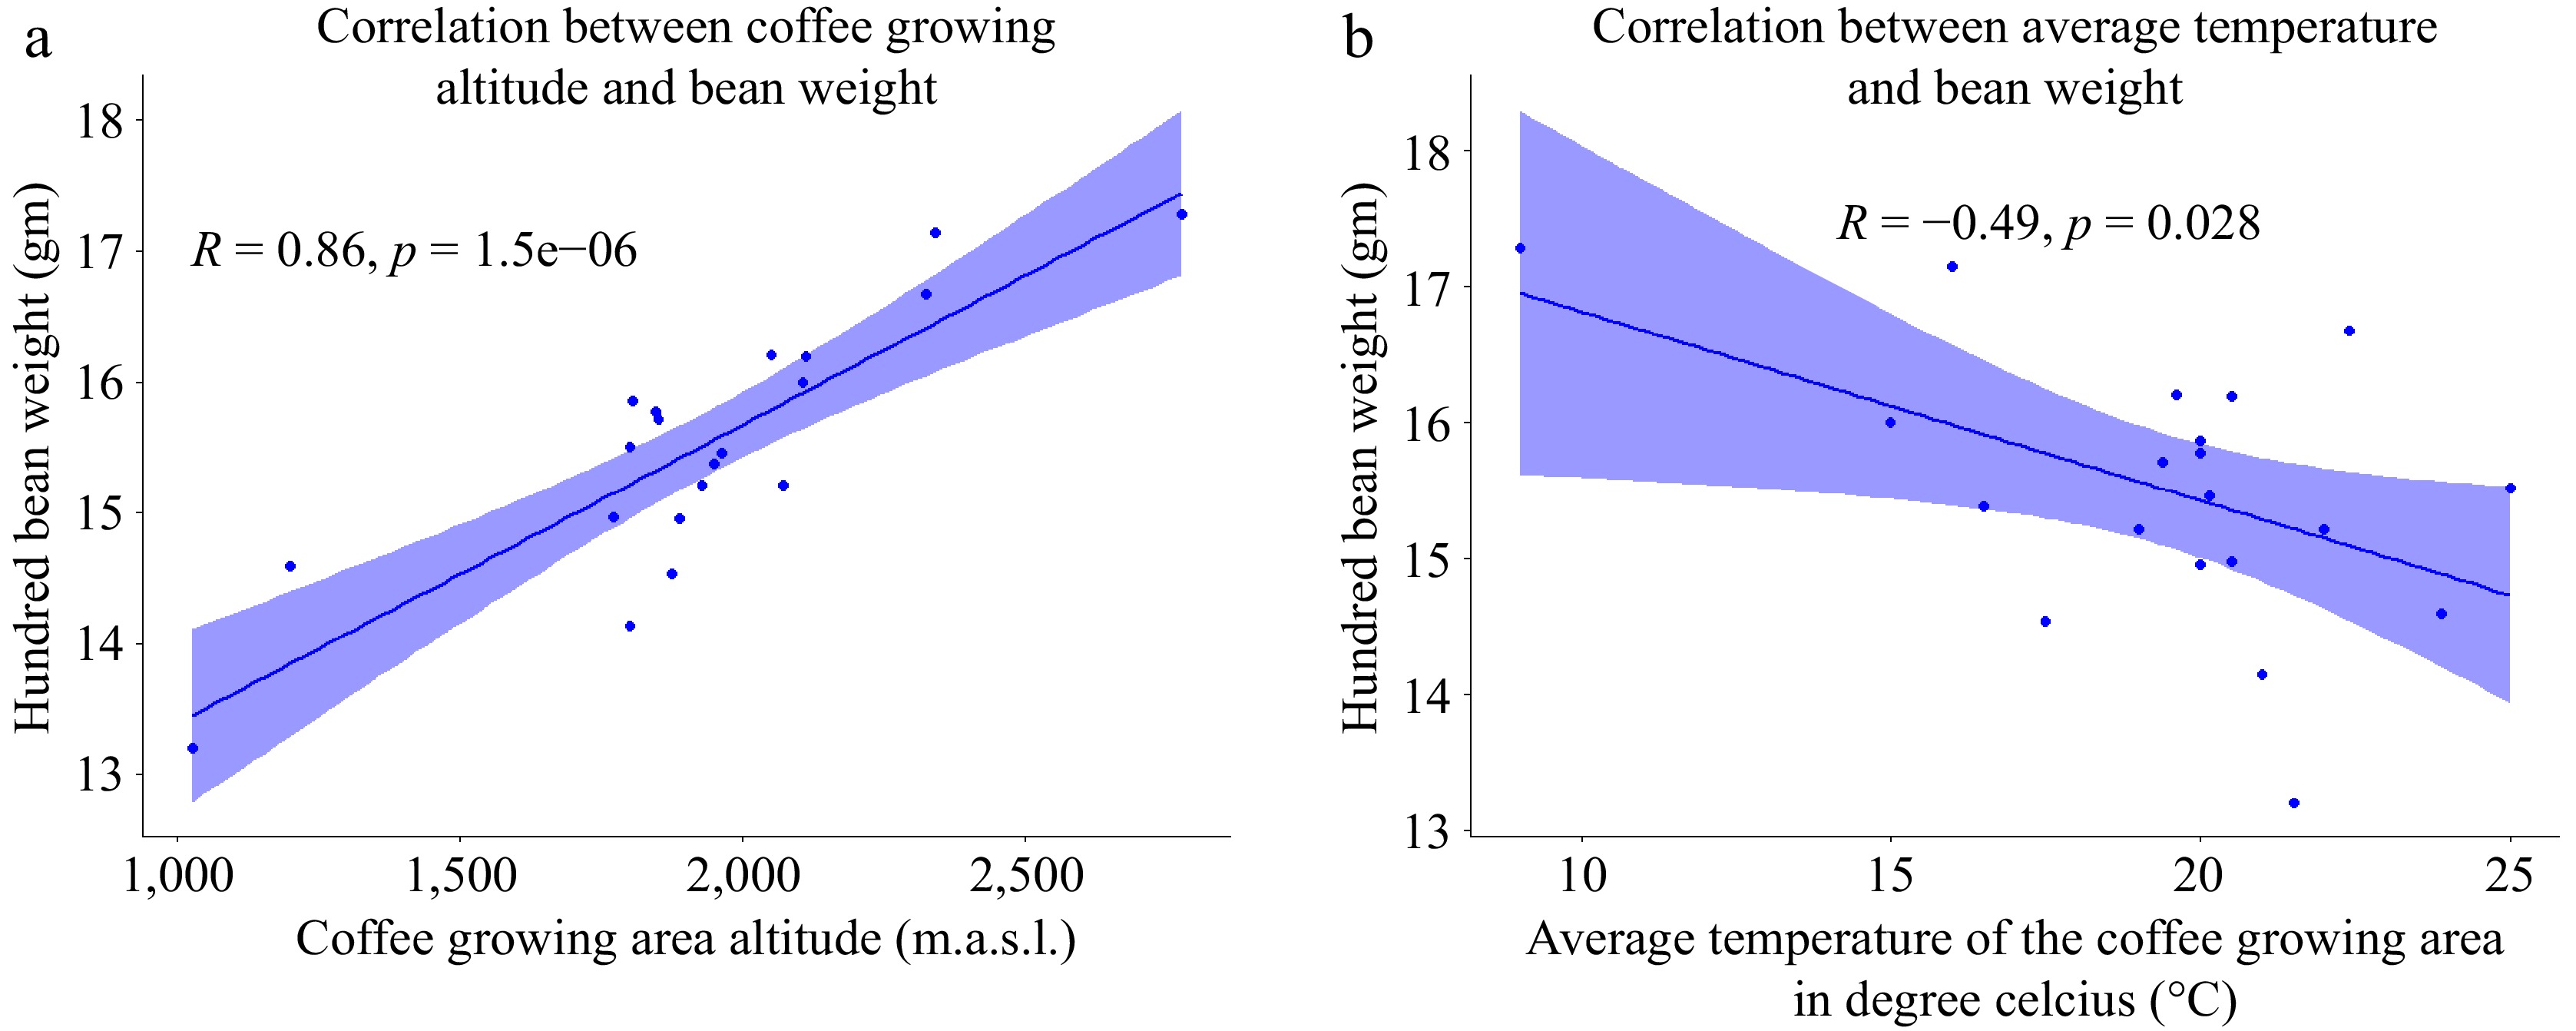
Figure 2.
(a) Scatter plot of coffee growing altitude correlation with hundred bean weight. (b) Scatter plot of the correlation average temperature with hundred-bean weight (n = 20).
-
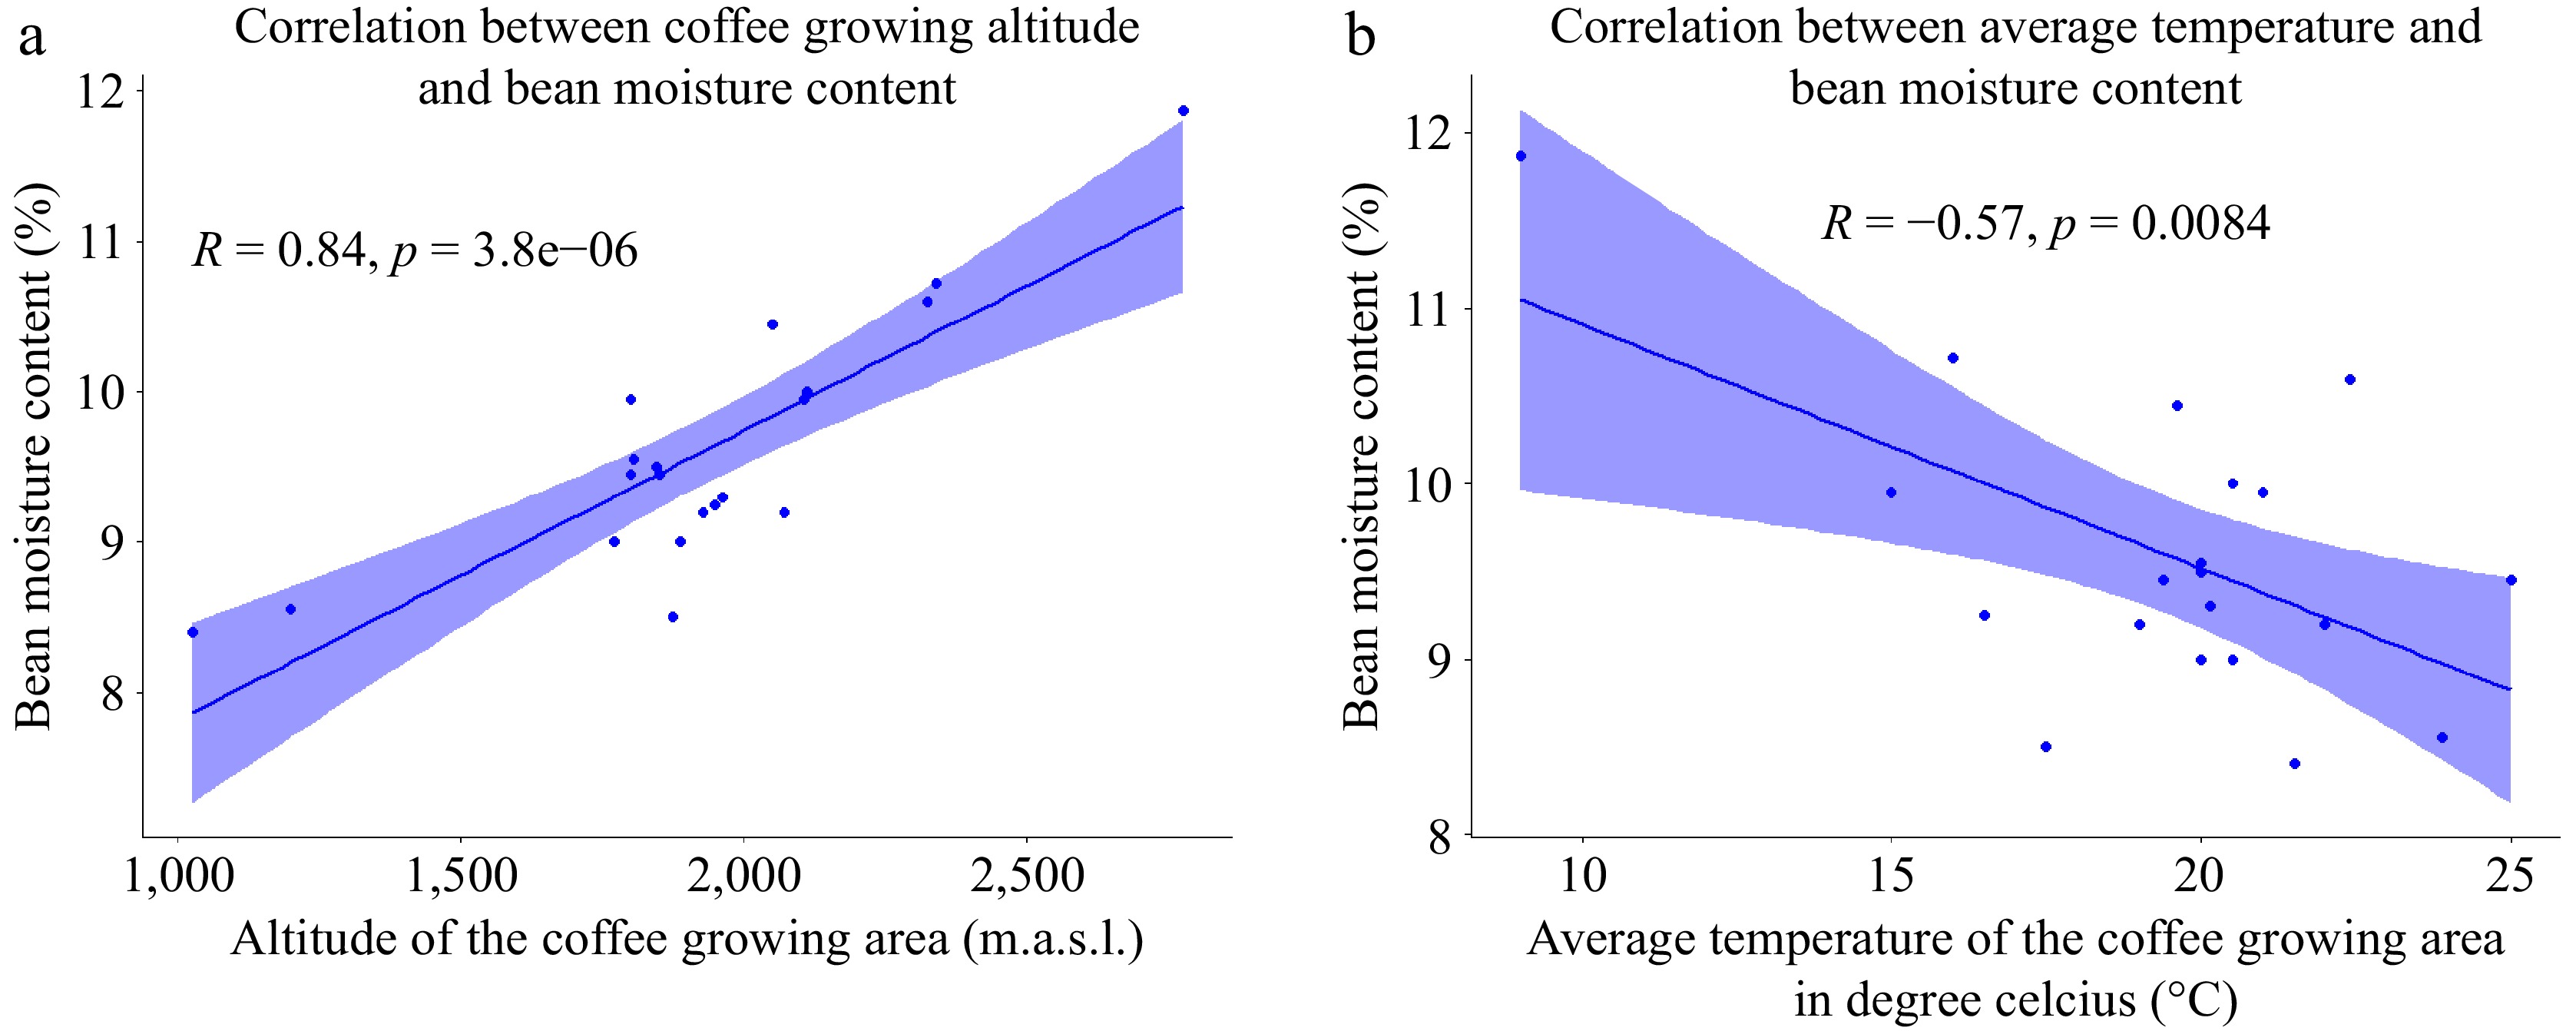
Figure 3.
(a) Scatter plot of the correlation between altitude and bean moisture content. (b) Scatter plot of the correlation between temperature and bean moisture content (n = 20)
-
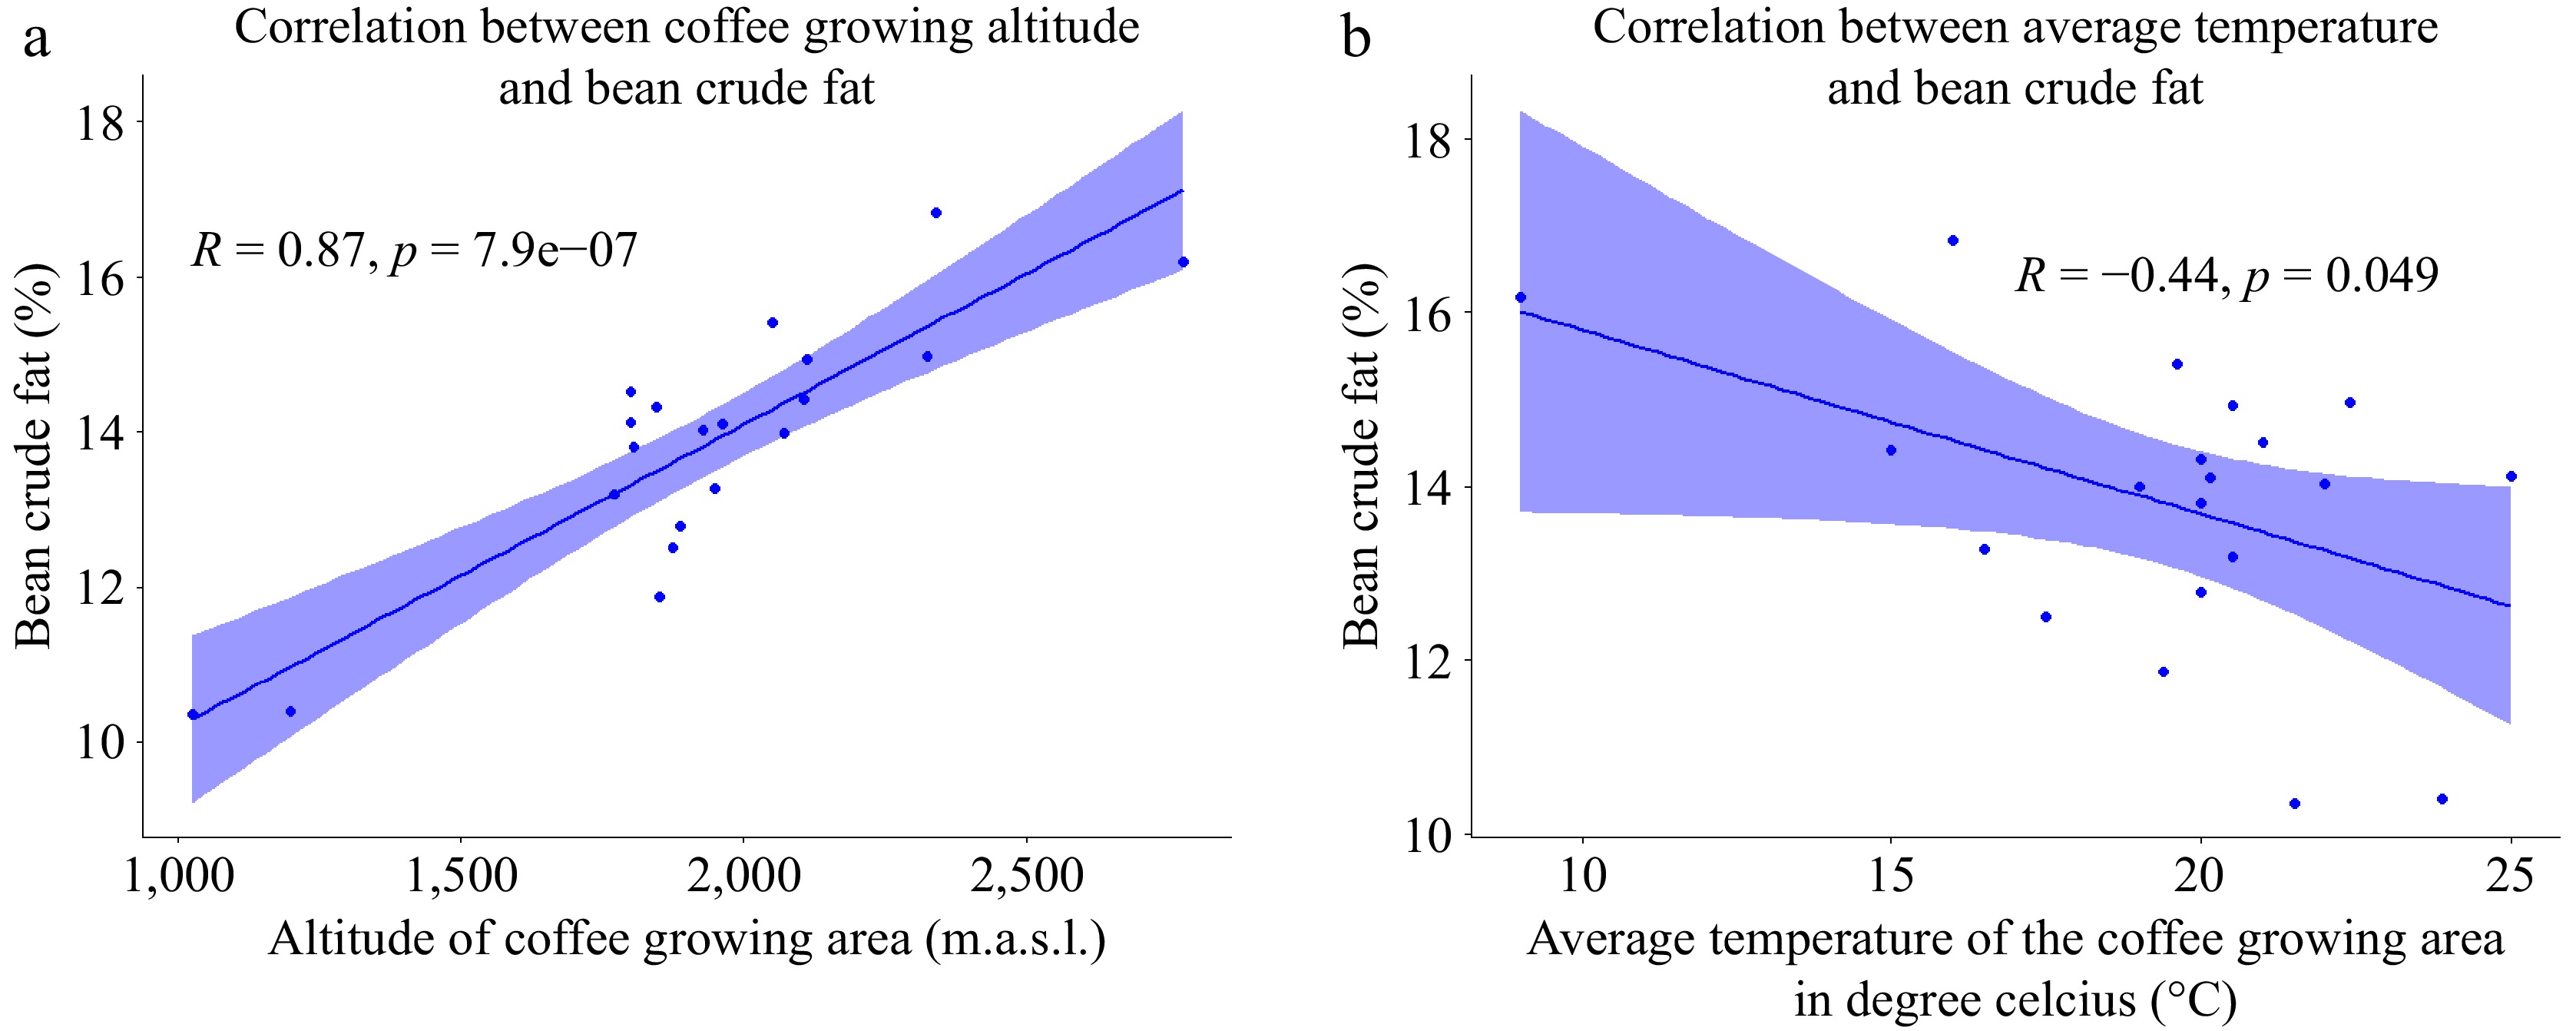
Figure 4.
(a) Scatter plot of the correlation between altitude and coffee bean crude fat content; (b) Scatter plot of the correlation between environmental temperature and green Arabica bean crude fat content (n=20).
-
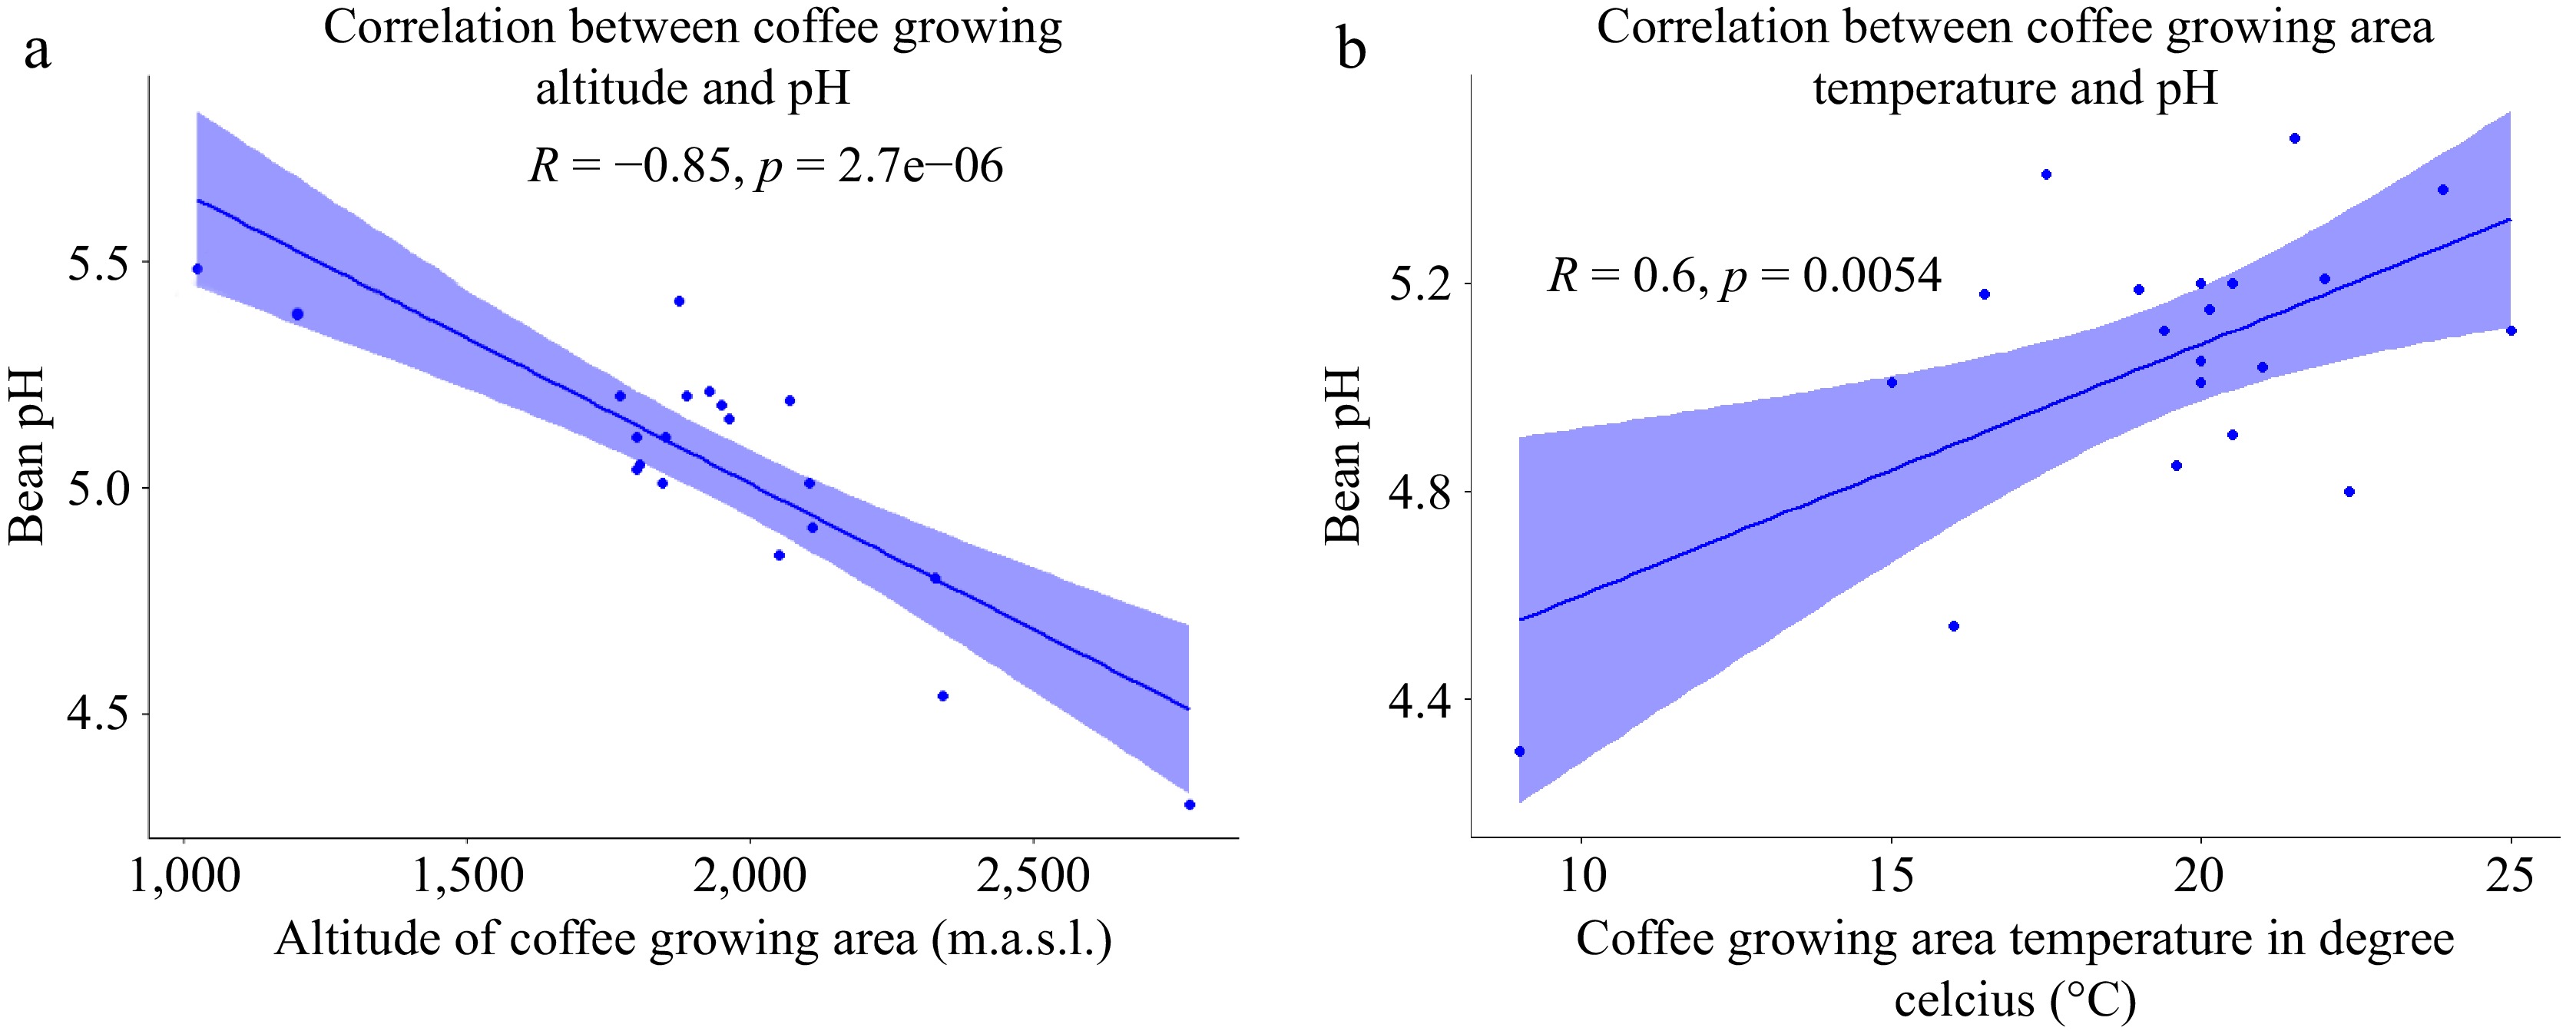
Figure 5.
(a) Scatter plot of the correlation between altitude and coffee bean pH. (b) Scatter plot of the correlation between average temperature and coffee bean pH (n = 20).
-
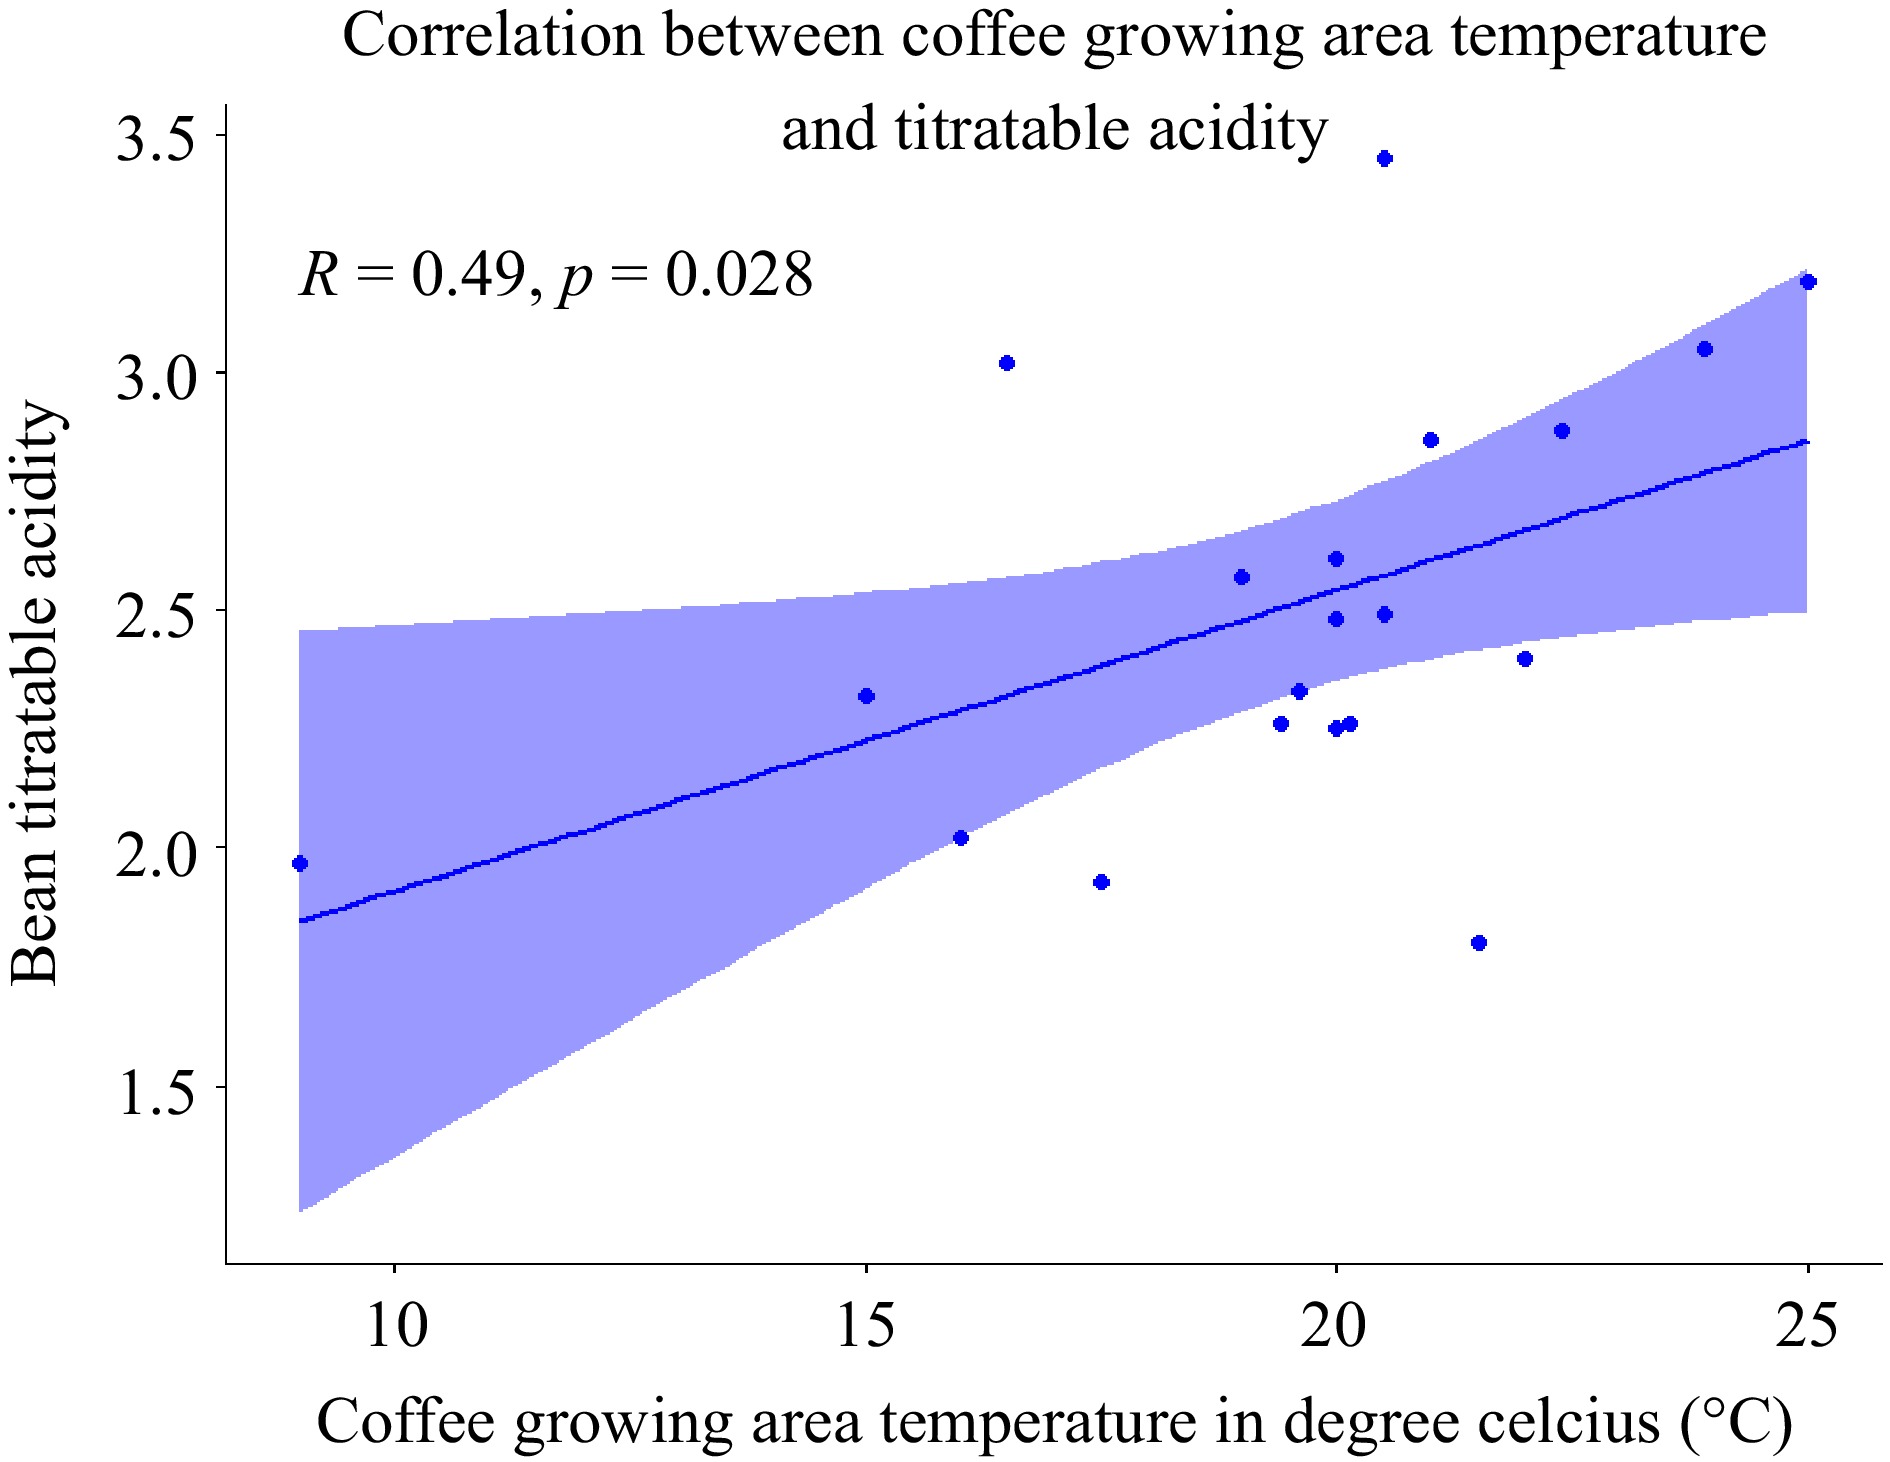
Figure 6.
Scatter plot of the correlation between coffee growing area temperature and titratable acidity of the bean (n = 20).
-
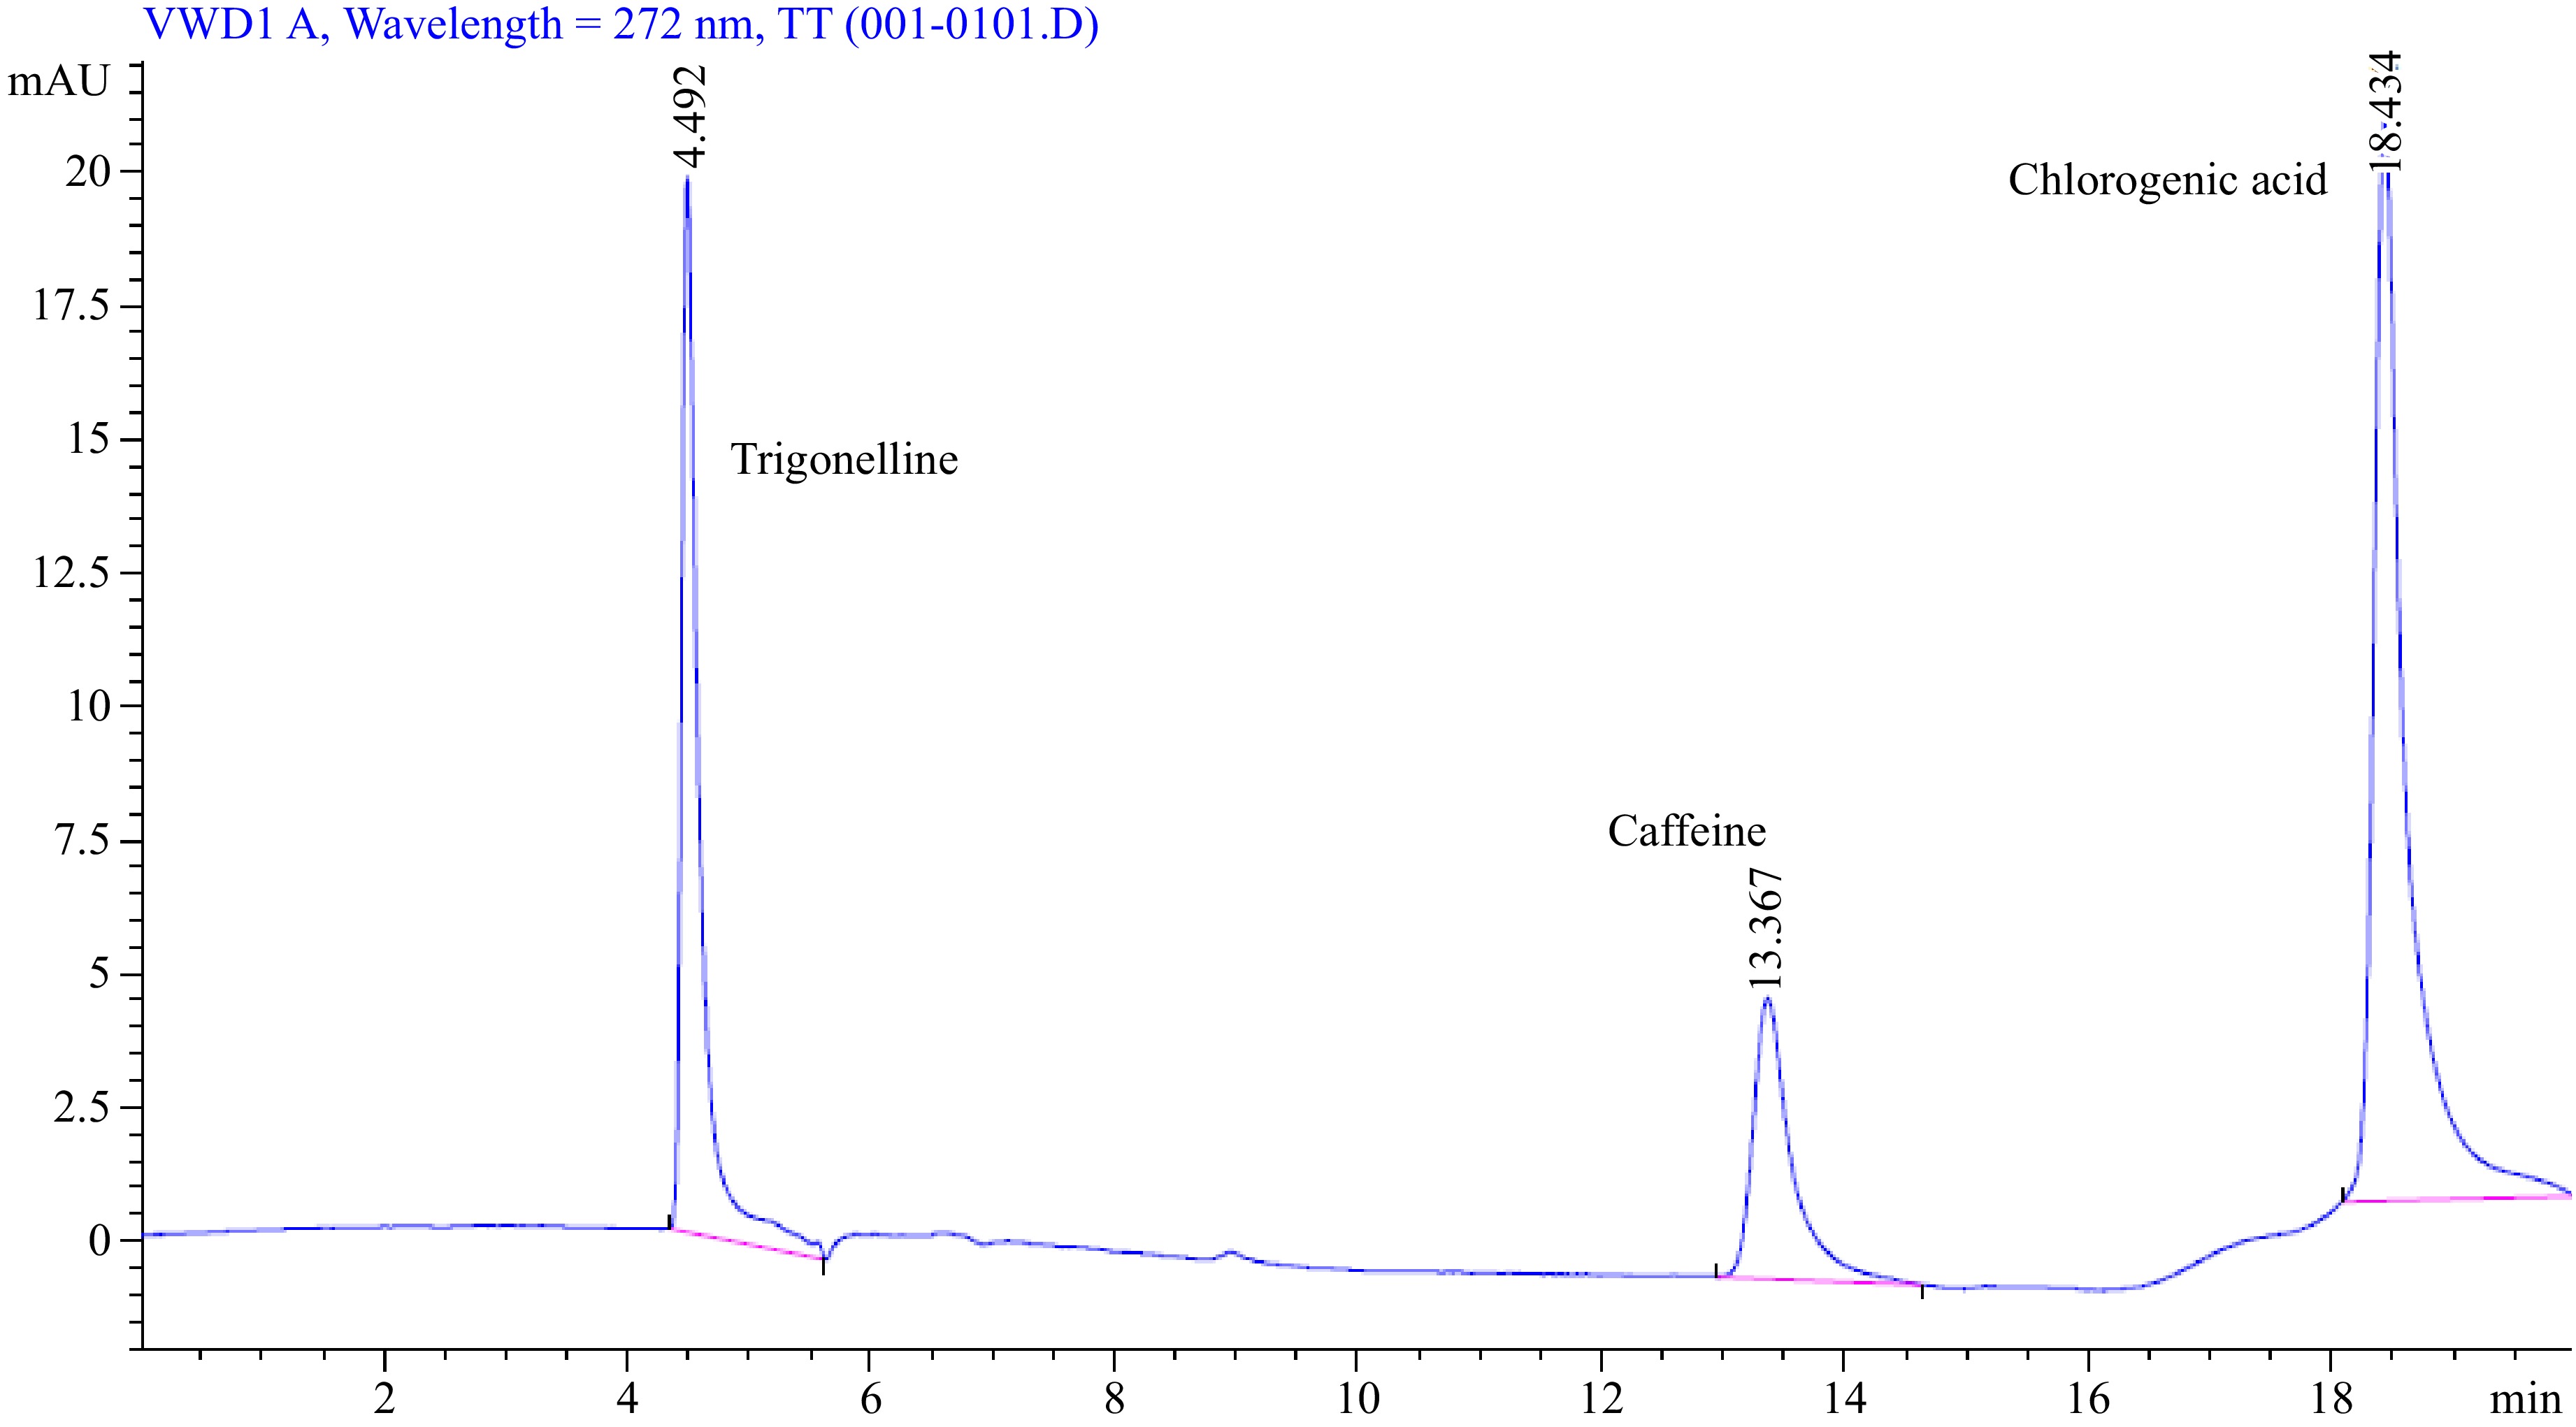
Figure 7.
Trigonelline, caffeine, and chlorogenic acid standard chromatogram.
-
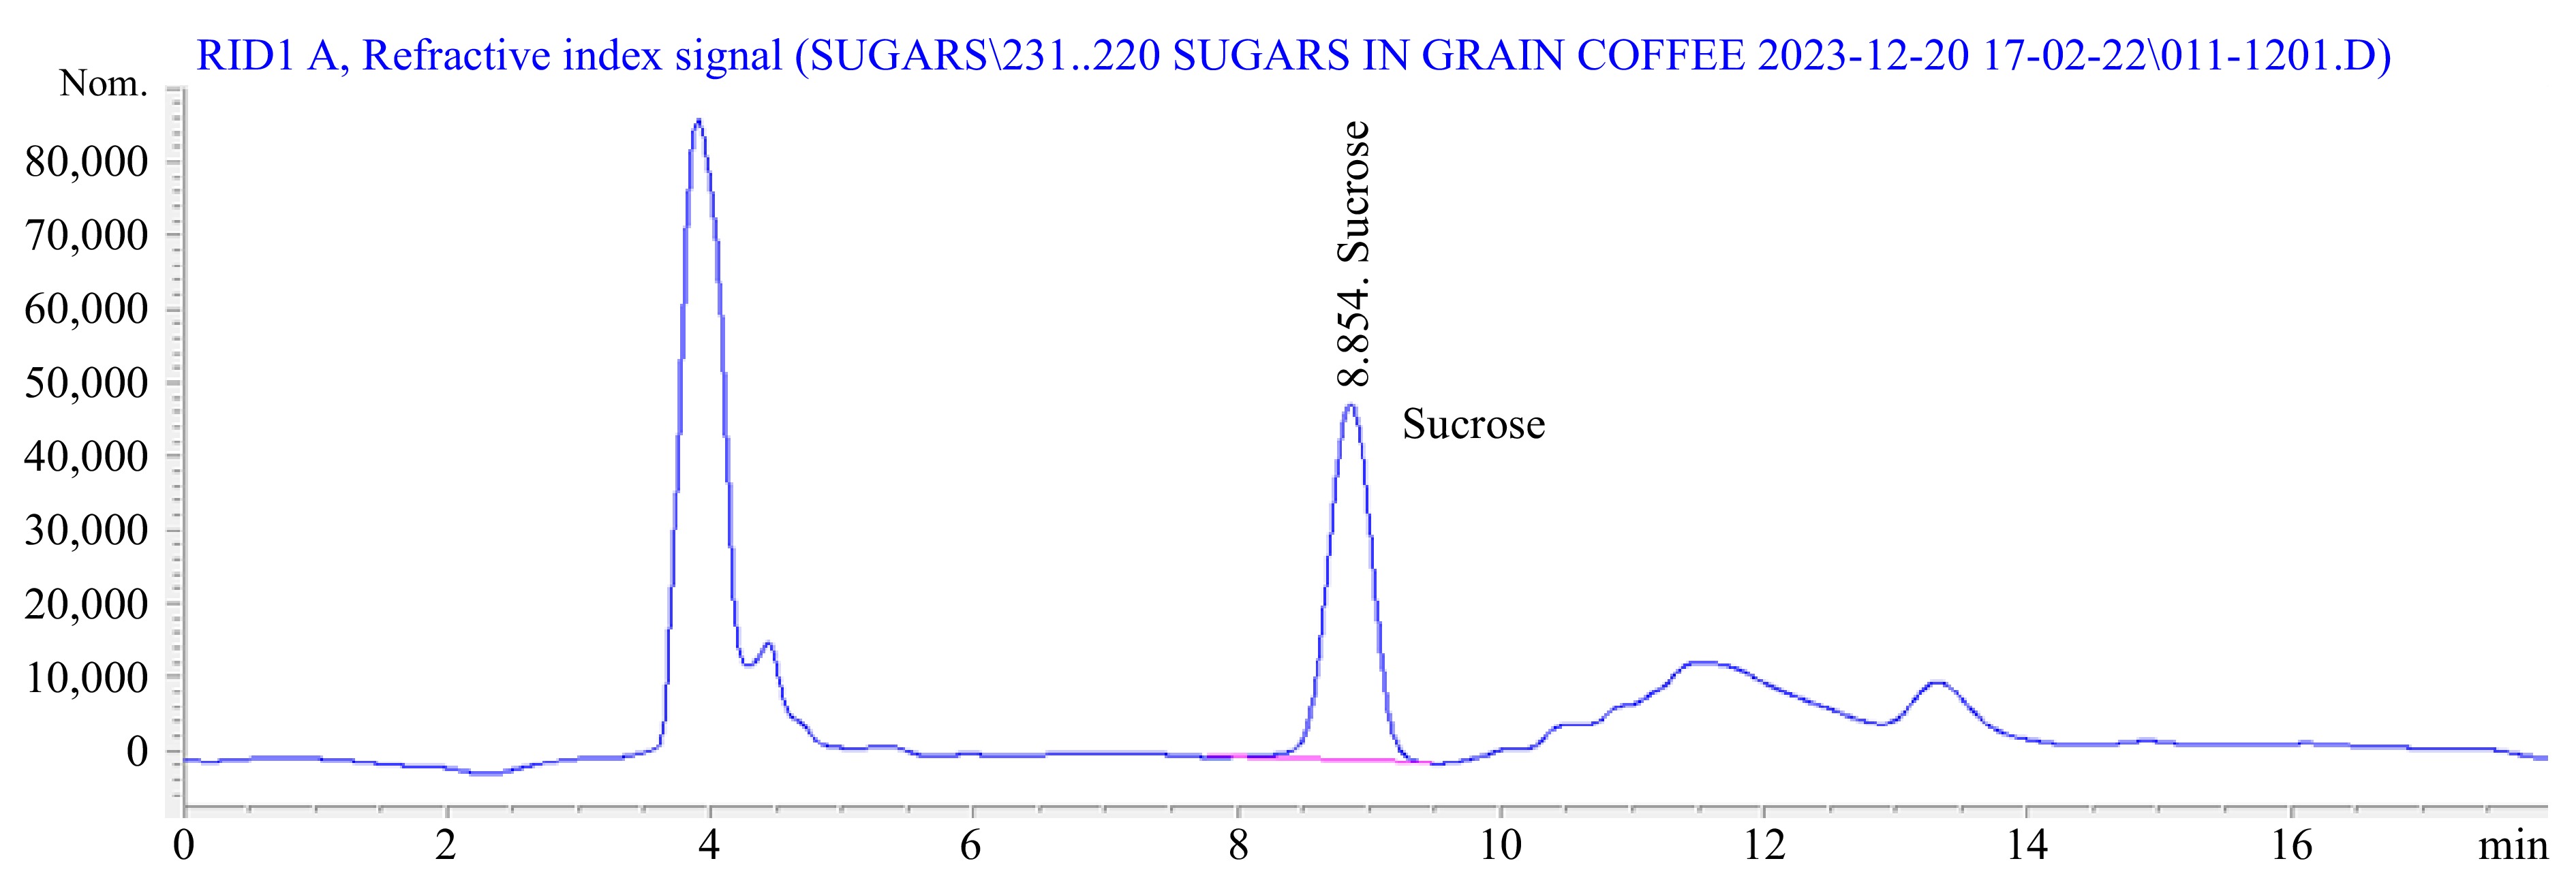
Figure 8.
Sucrose standard chromatogram.
-
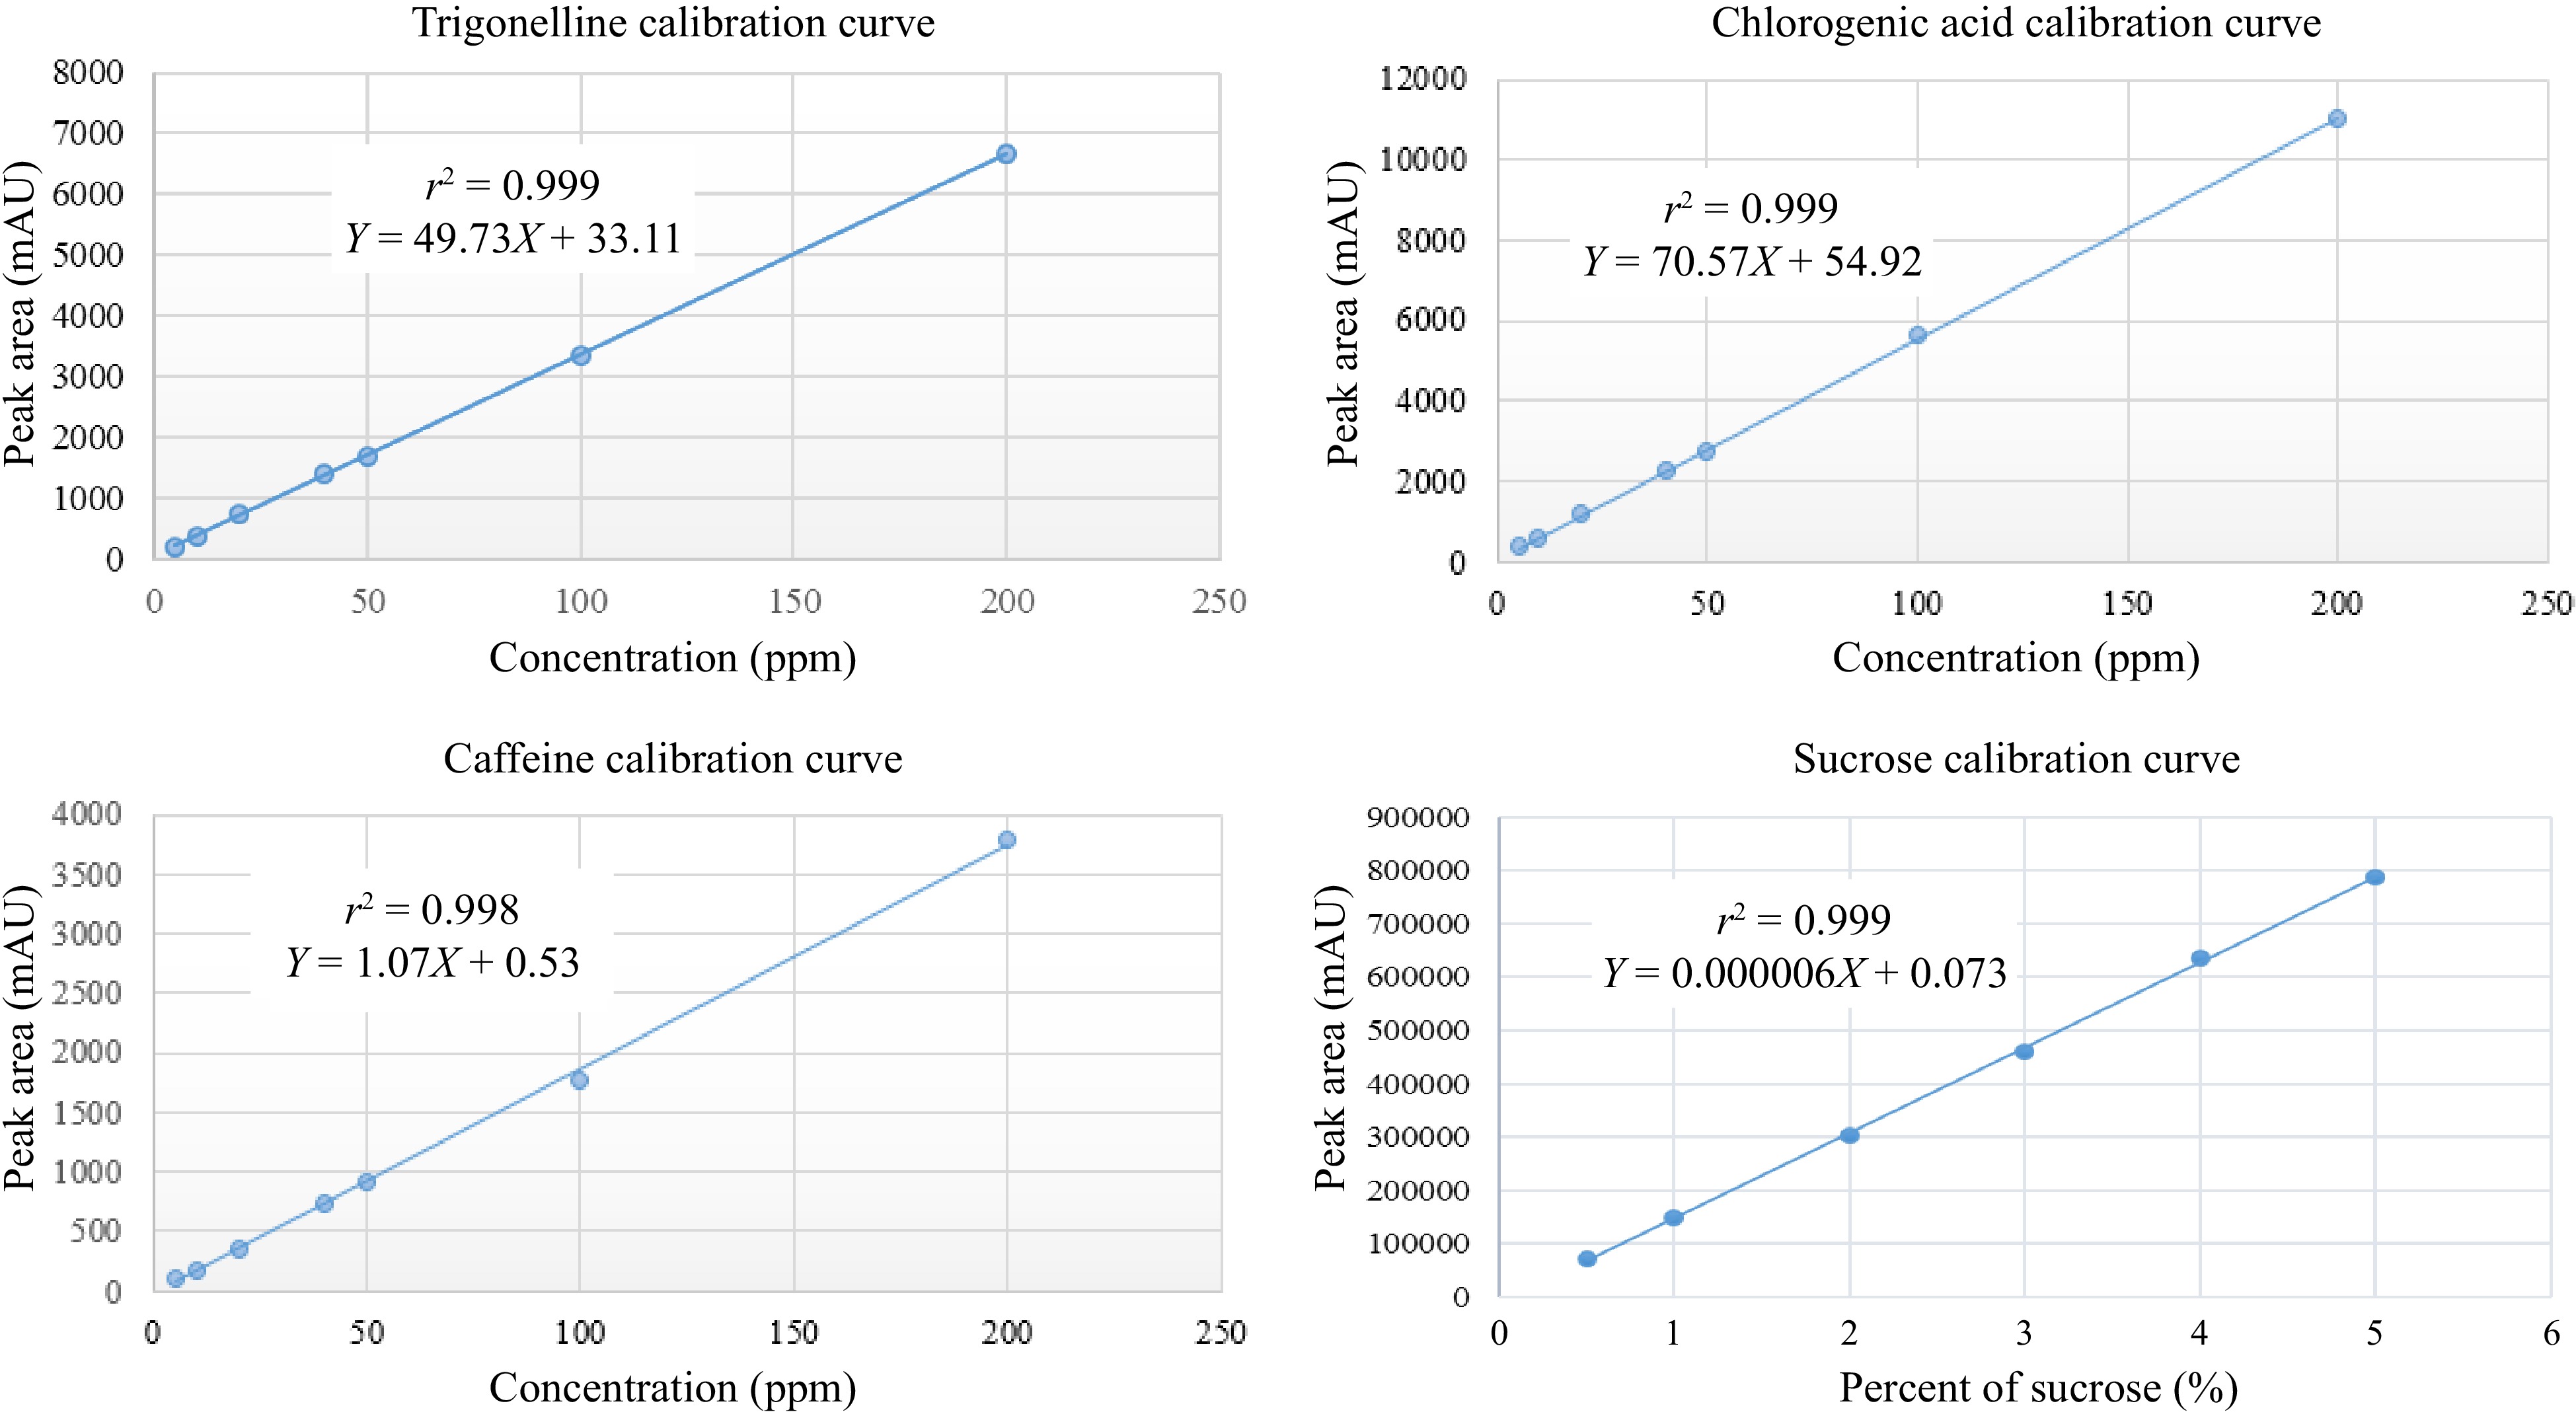
Figure 9.
The calibration curve of trigonelline, caffeine, chlorogenic acid, and sucrose.
-
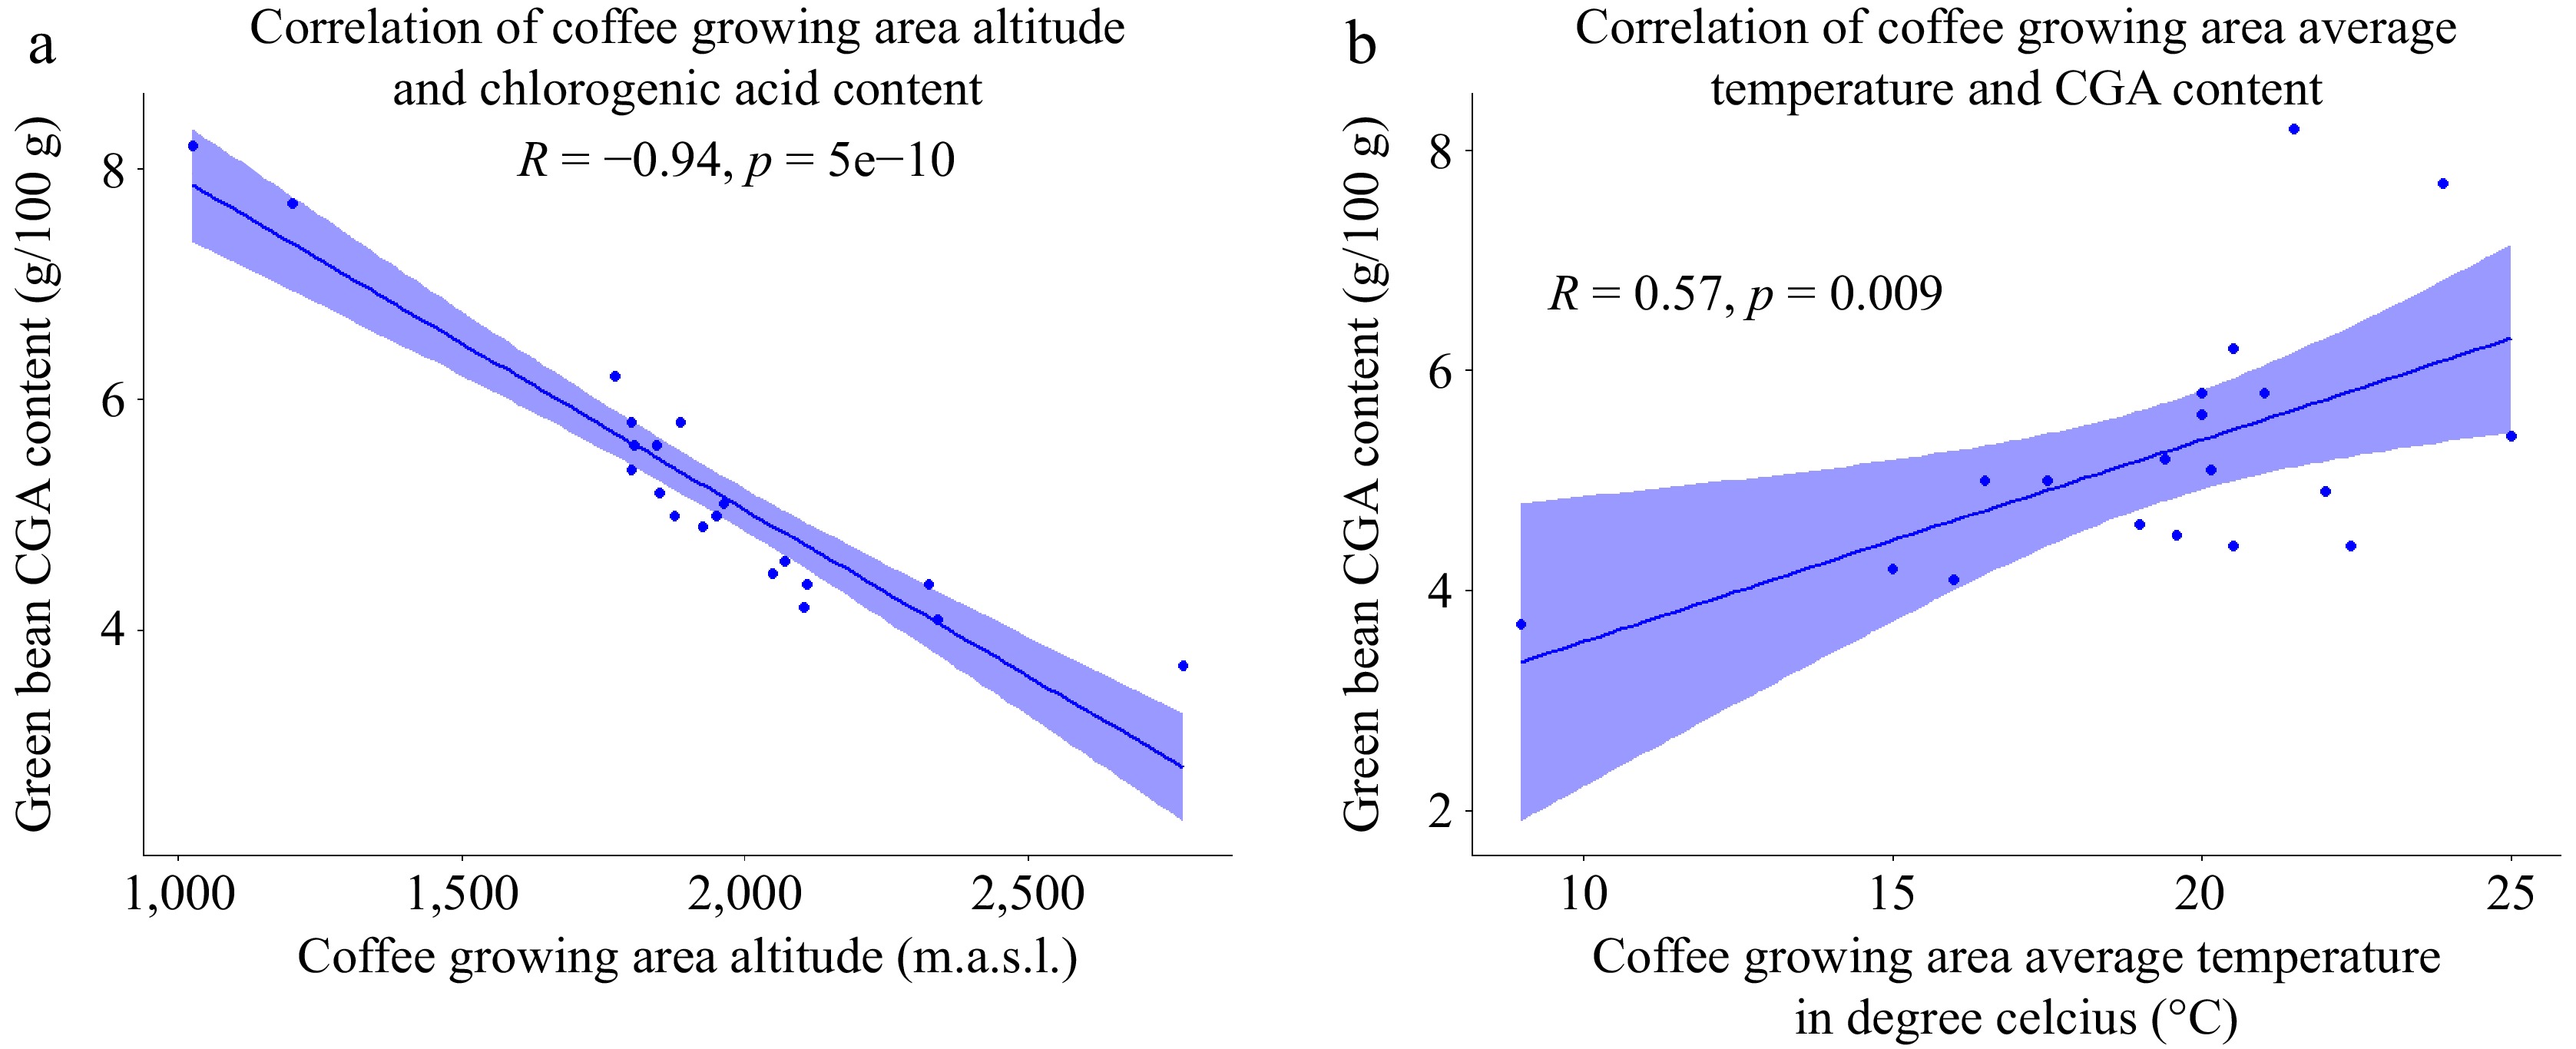
Figure 10.
(a) Scatter plot of correlation between altitude and CGA of coffee bean. (b) Scatter plot of the correlation between average temperature and green bean CGA content (n = 20).
-
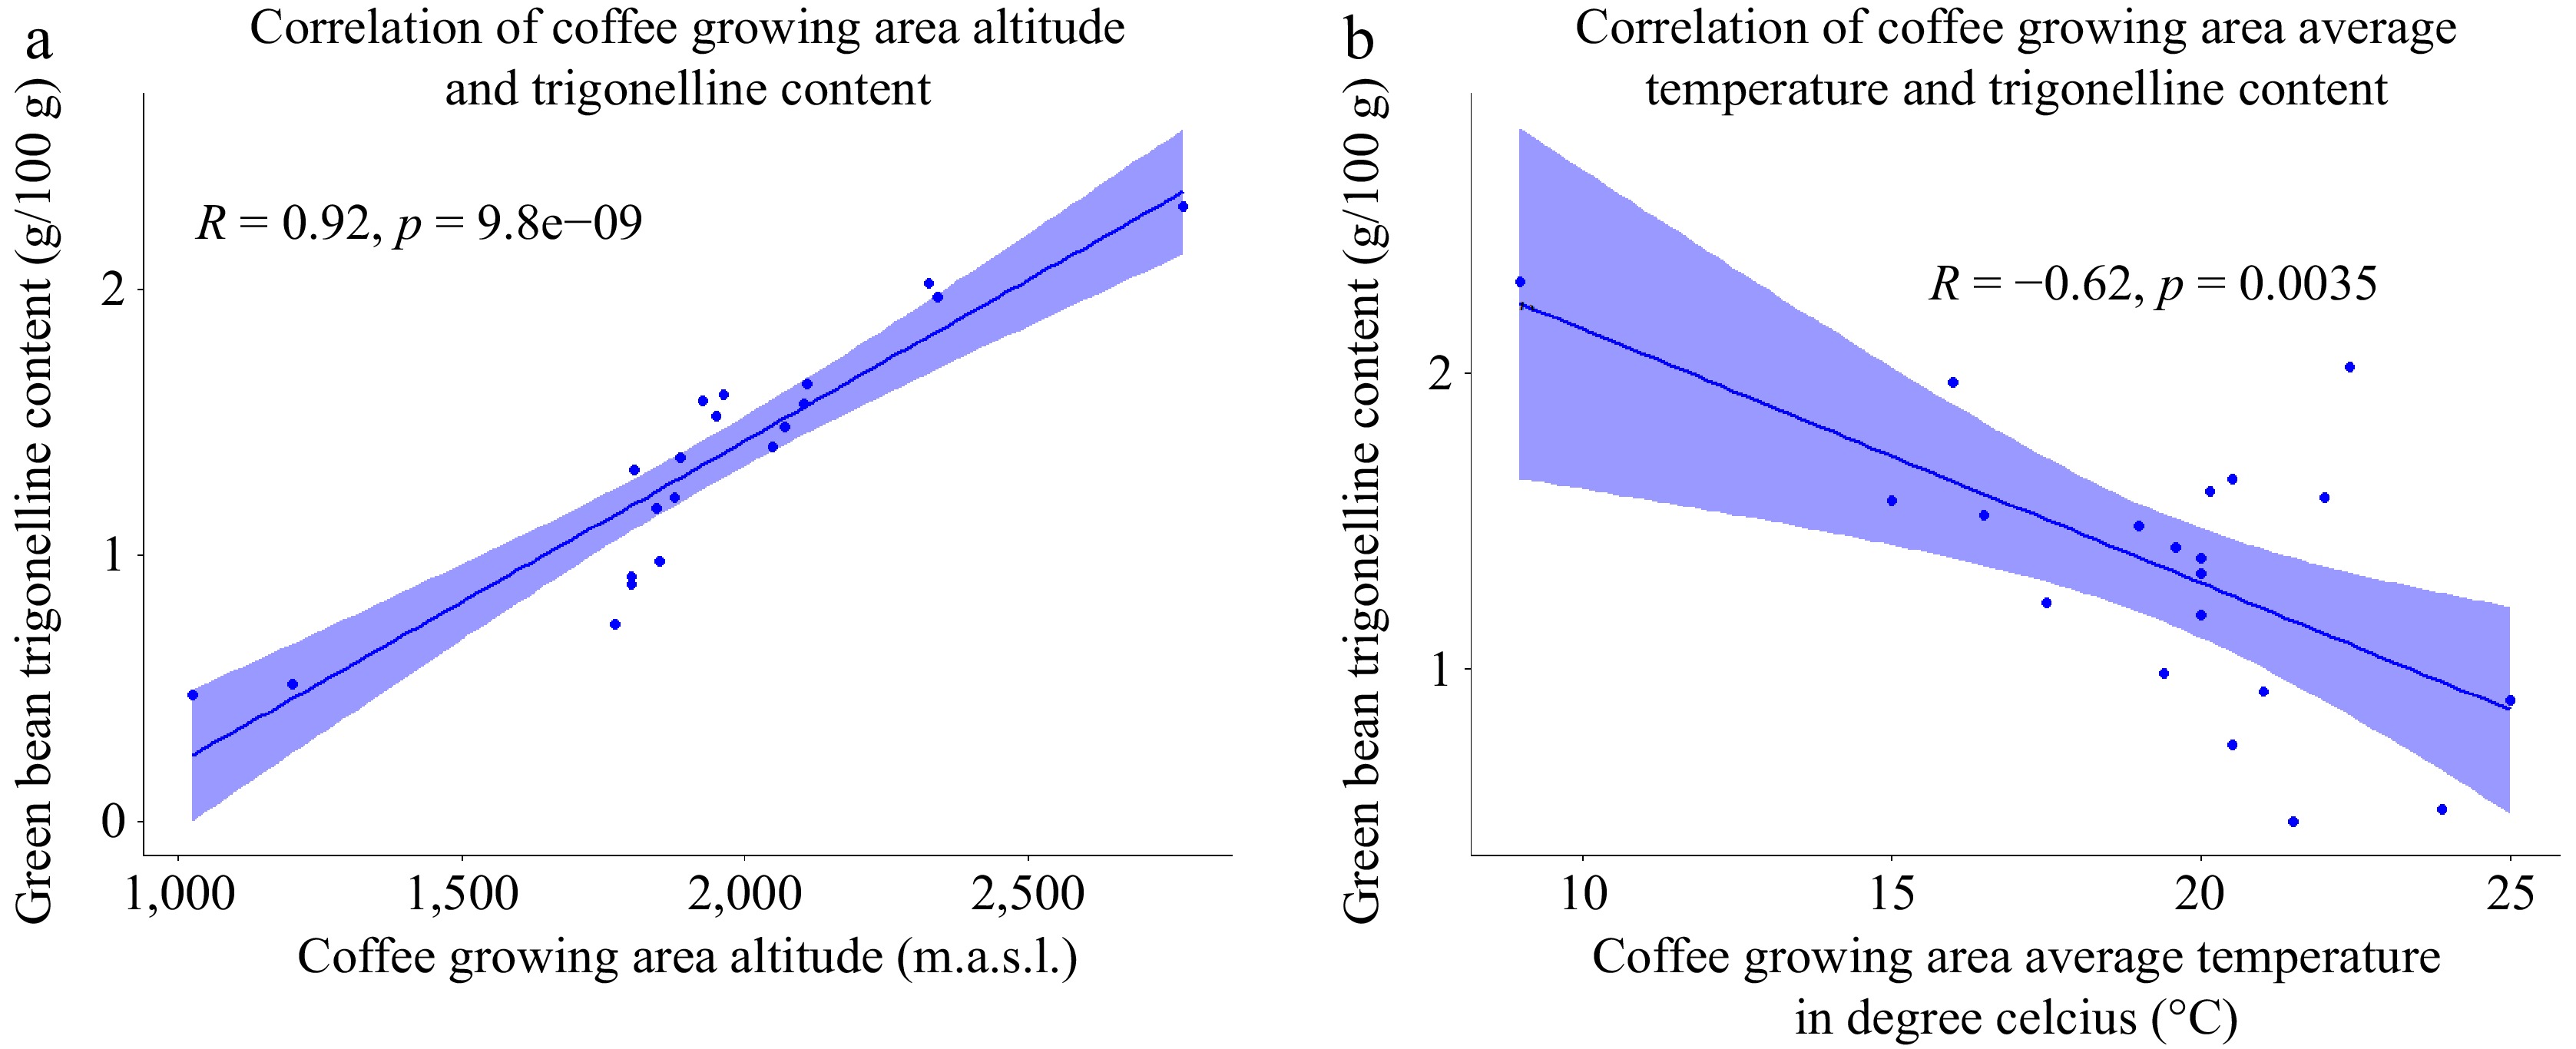
Figure 11.
(a) Scatter plot of the correlation between coffee growing altitude and green bean trigonelline content. (b) Scatter plot of the correlation between coffee growing temperature and green bean trigonelline content (n = 20).
-
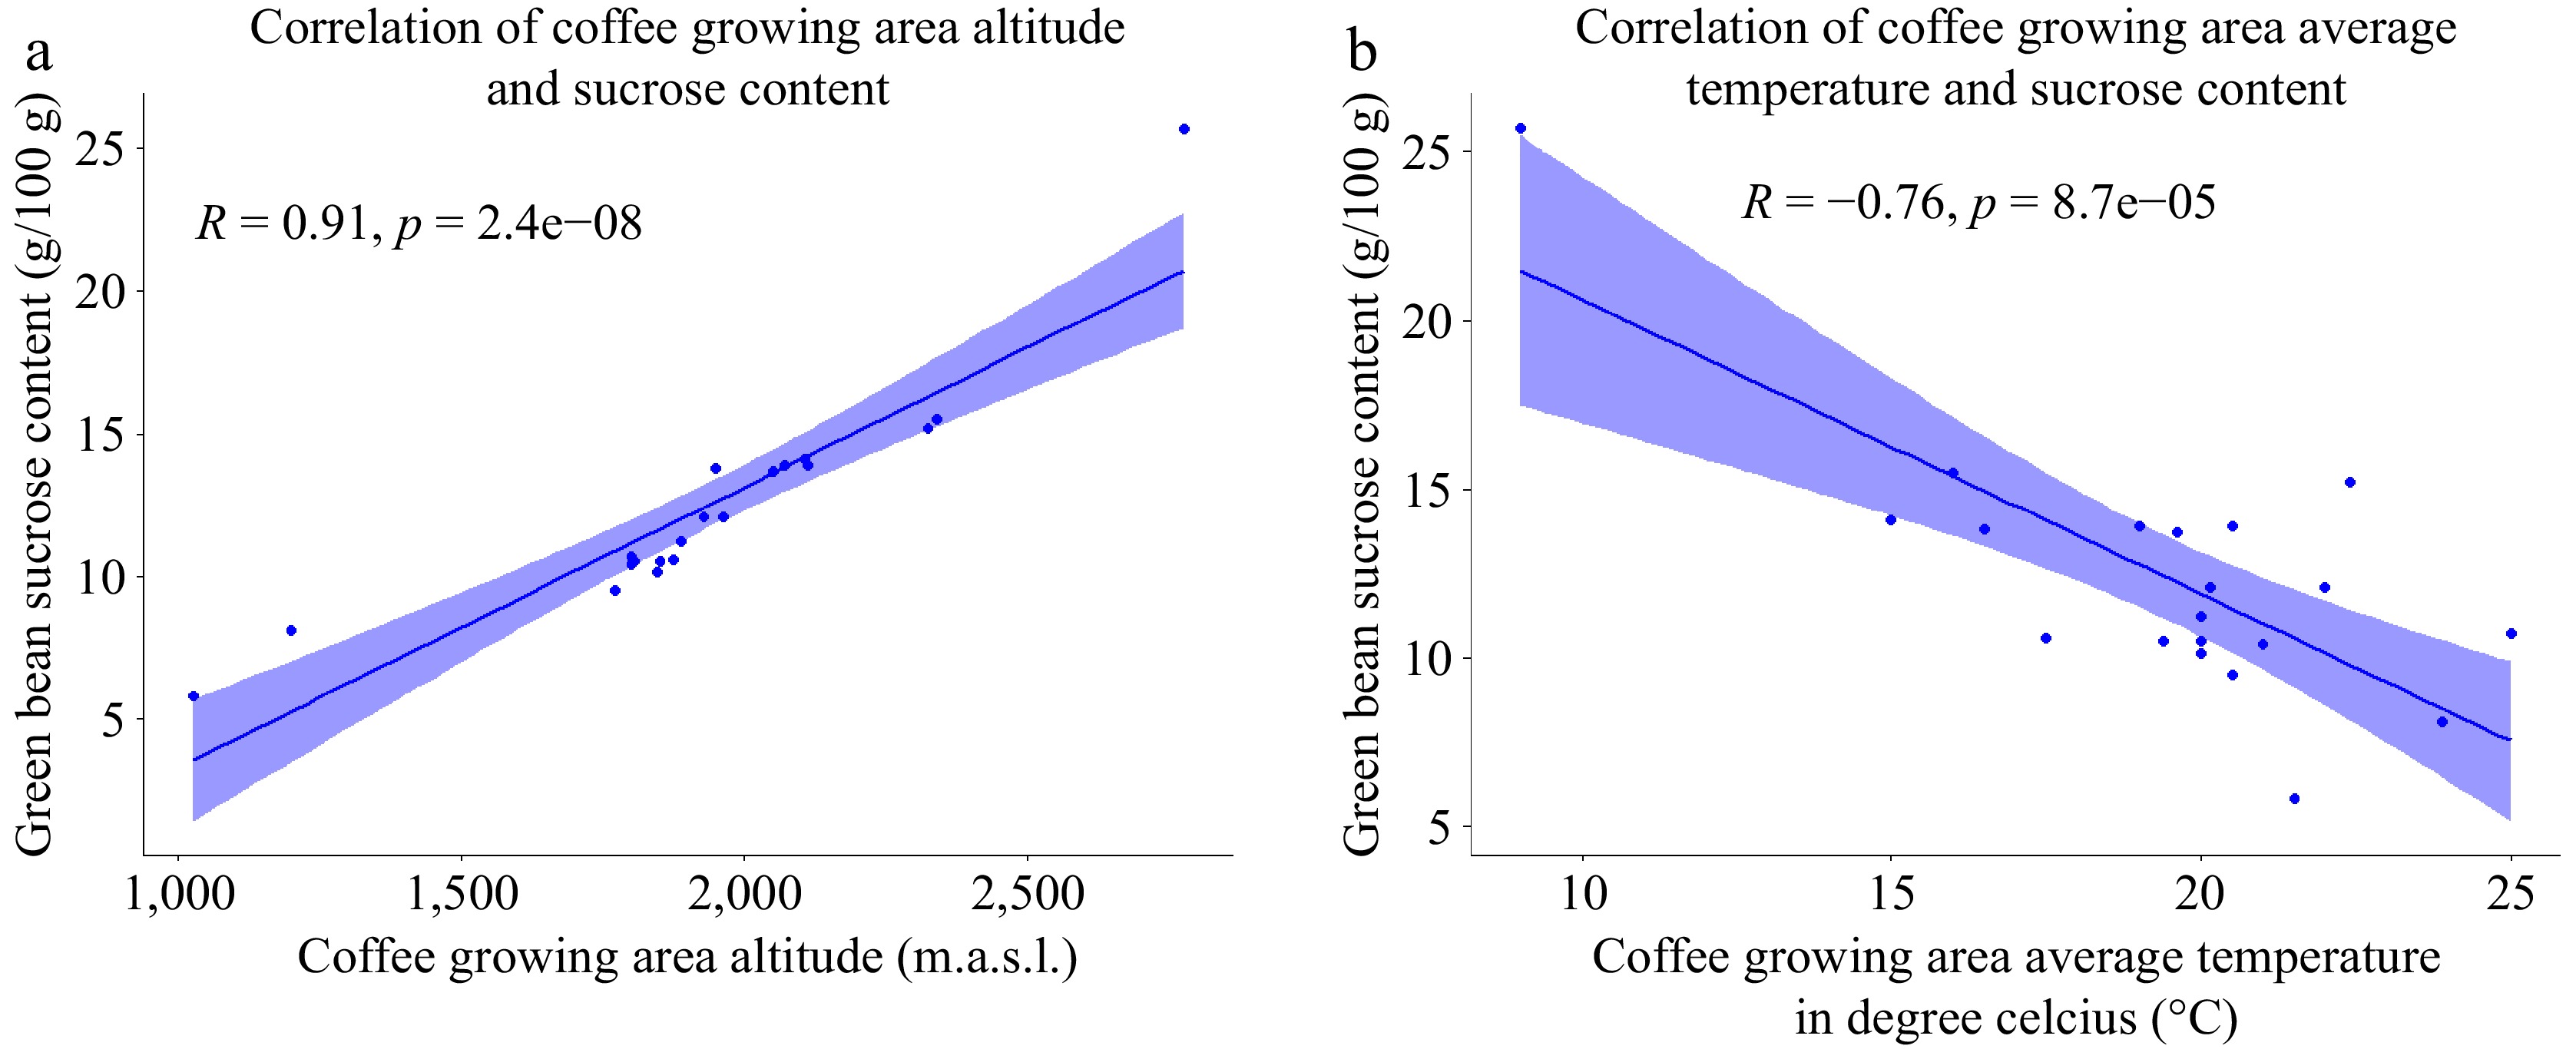
Figure 12.
(a) Scatter plot of the correlation between coffee growing altitude and green bean sucrose content. (b) Scatter plot of the correlation between coffee growing temperature and green bean sucrose content (n = 20).
-
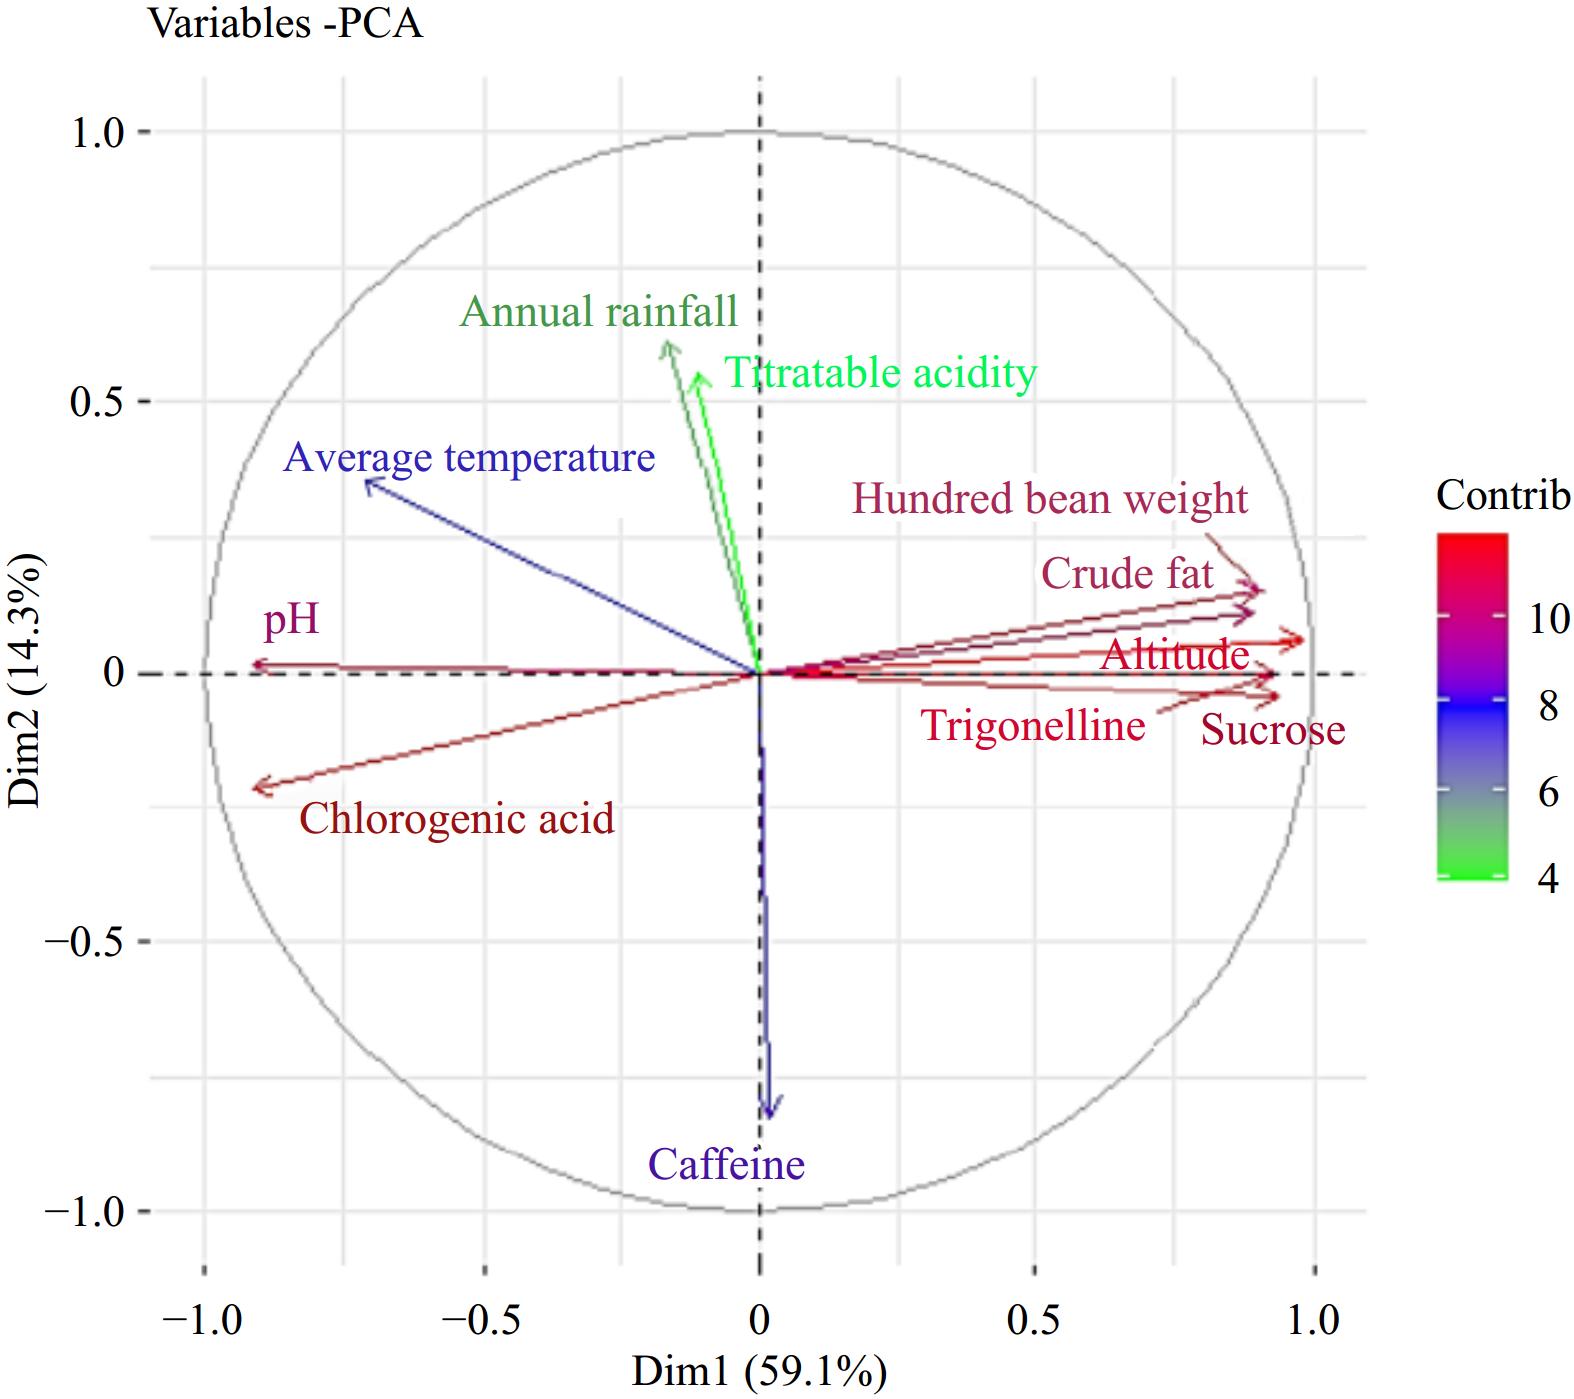
Figure 13.
PCA of variables (coffee growing environmental variables, physicochemical and biochemical compositions).
-
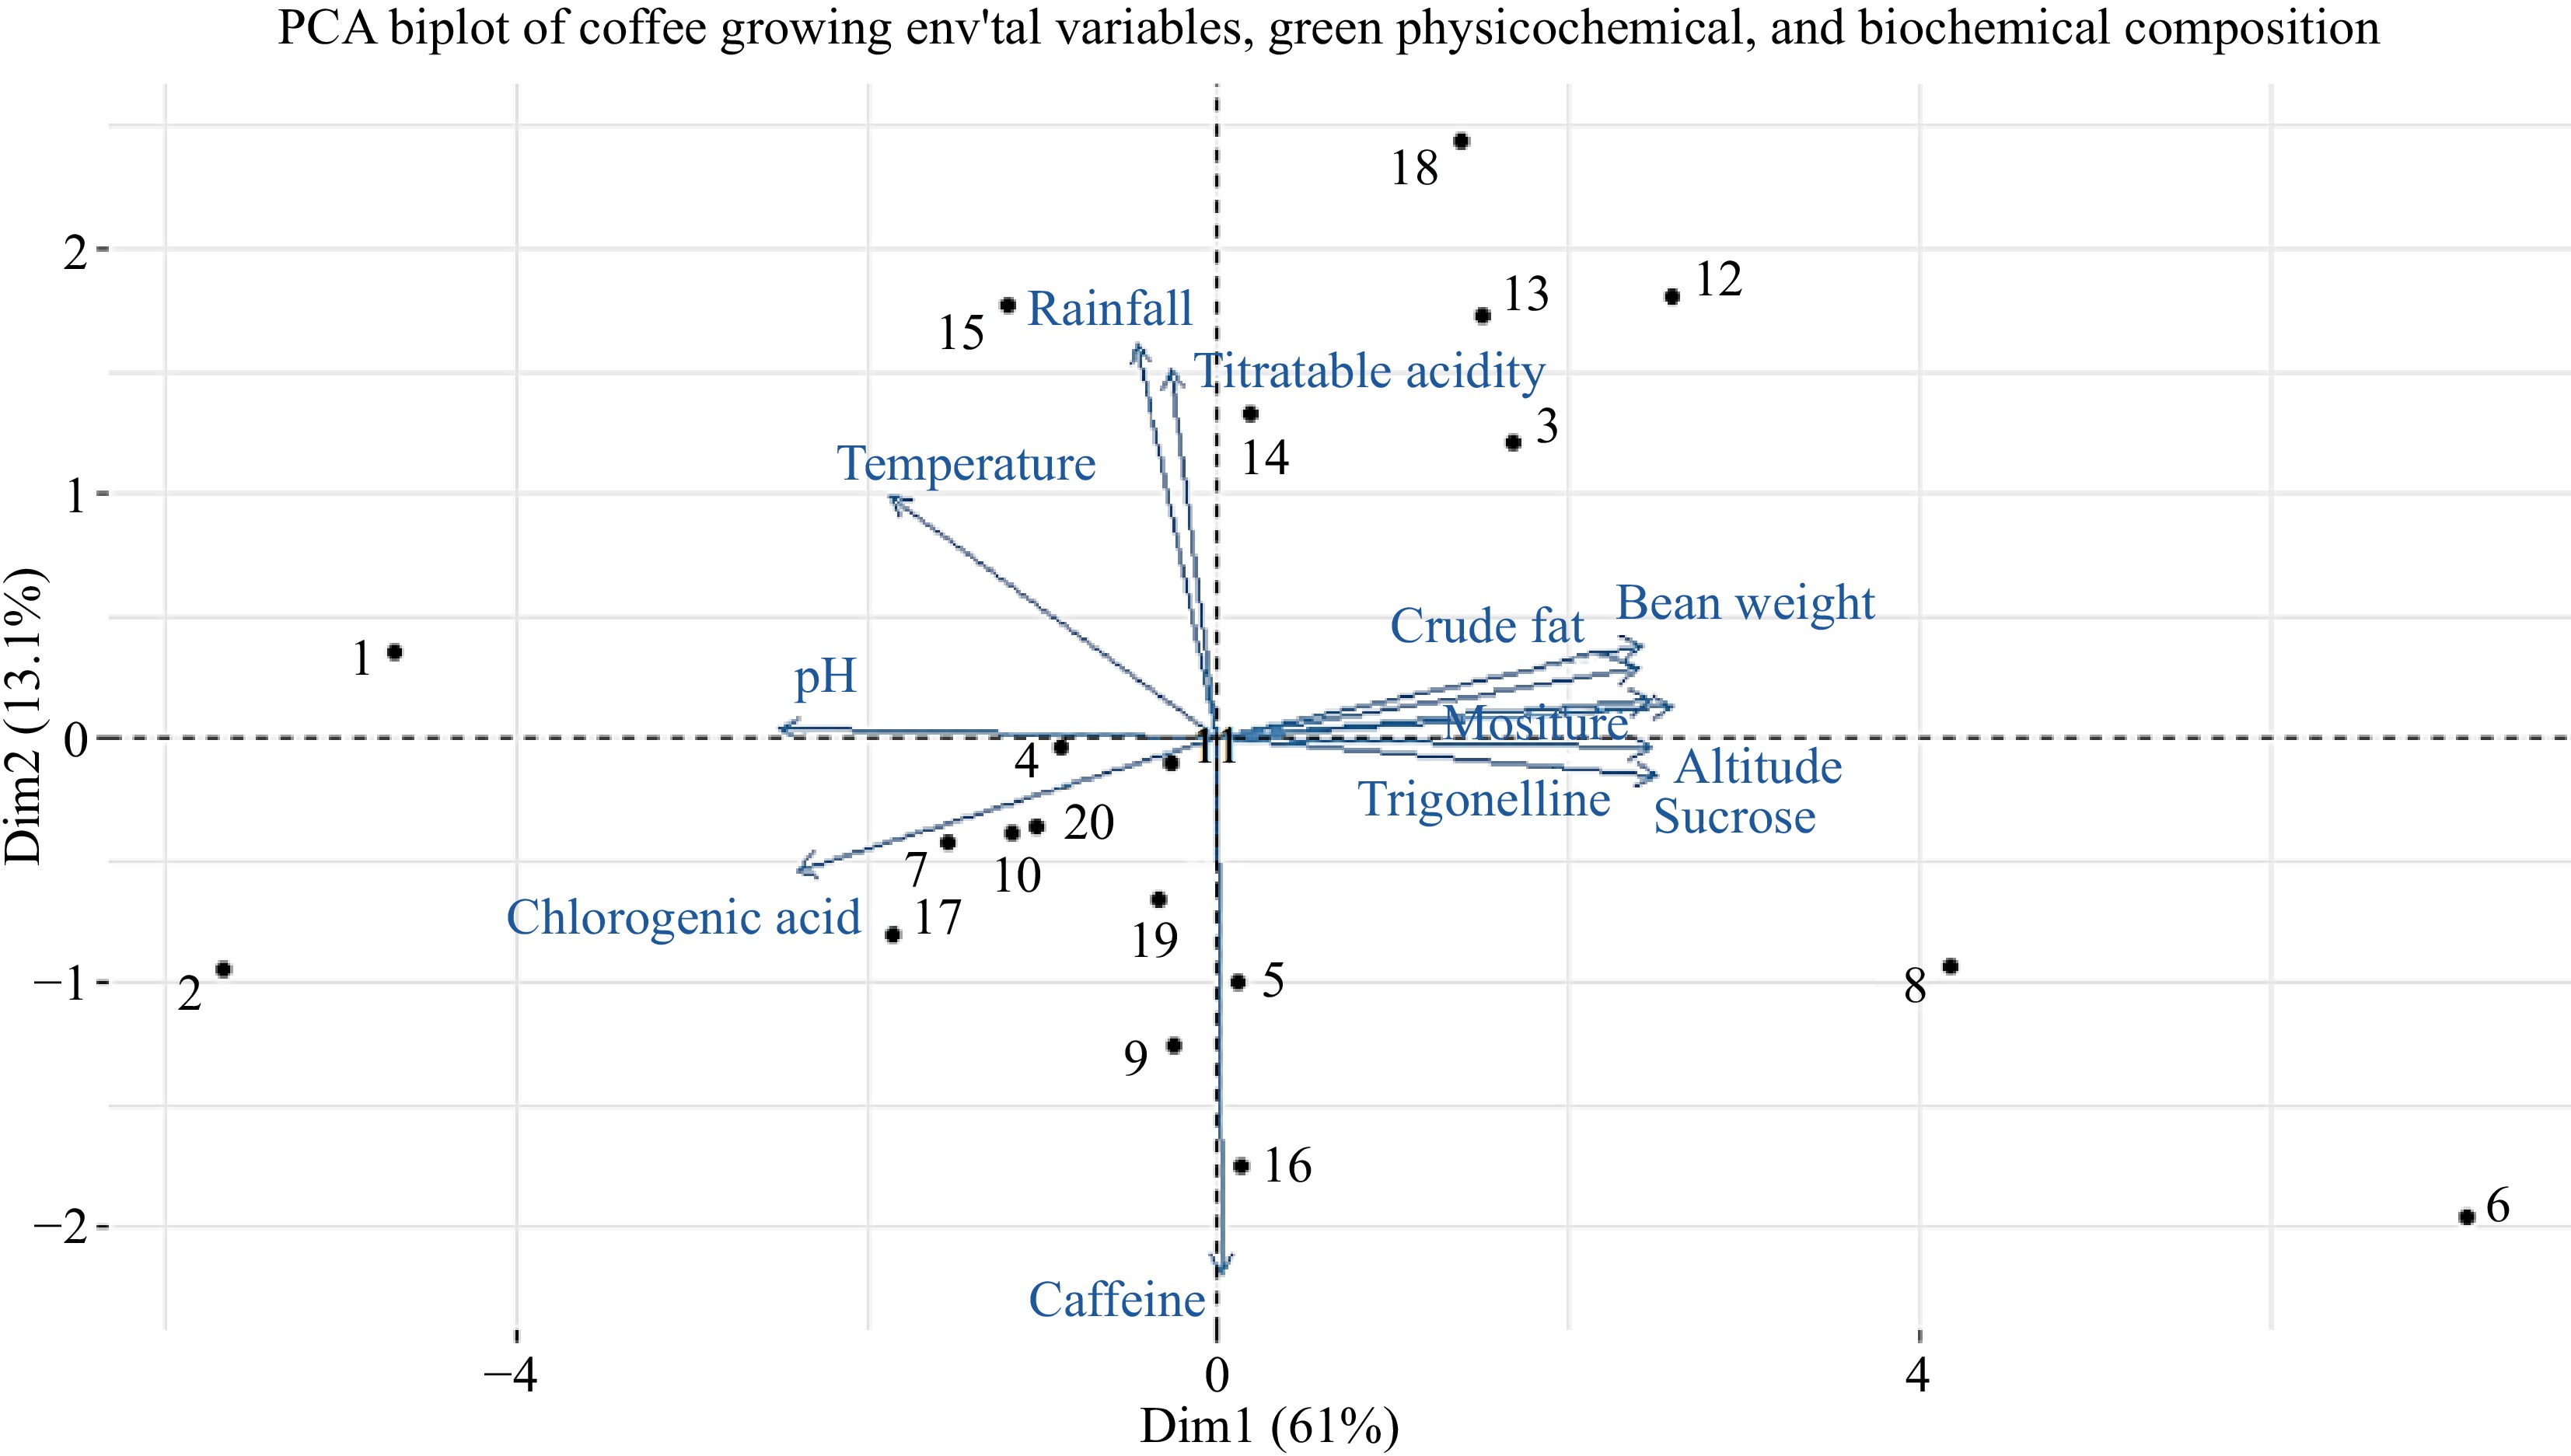
Figure 14.
Projection of variables and samples in the plane formed by first two principal components.
-
Sample Altitude (m.a.s.l.) Latitude (° N) Longitude (° E) Annual rainfall (mm) Tmax (°C) Tmin (°C) Region Sample-1 1,100−1,300 7.1215 35.2711 1,300−1,700 29.8 18 Southwest Ethiopia Sample-2 850−1,200 7.0142 35.3512 1,542−1,760 28 15 Southwest Ethiopia Sample-3 800−3,300 7.2727 36.2427 1,475−1,525 26.8 12.4 Southwest Ethiopia Sample-4 1,800−1,900 6.3045 38.0124 1,100−1,580 29.2 9.6 Southern Ethiopia Sample-5 1,900−2,000 6.3611 38.2514 1,200−1,400 23 10 Southern Ethiopia Sample-6 1,450−4,100 6.2431 39.1500 822−1,447 12 6 Southeast Ethiopia Sample-7 1,800−1,950 6.1003 38.1201 1,200−1,800 20 15 Southern Ethiopia Sample-8 1,080−3,600 5.7747 37.5564 735−1,400 20 12 Southeast Ethiopia Sample-9 1,537−2,075 8.0433 39.5915 800−1,200 25 15 Southeast Ethiopia Sample-10 1,845−1,930 9.1015 35.5012 1,400−1,800 30 10 Western Ethiopia Sample-11 1,350−2,340 5.4010 38.4011 500−1,800 25 15 Southeast Ethiopia Sample-12 1,450−3,200 6.0145 39.1515 822−1,447 34.4 10.4 Southeast Ethiopia Sample-13 1,650−2,560 10.580 36.5250 1,800−2,800 22 8 Northwest Ethiopia Sample-14 2,050−2,091 10.700 37.0668 1,386−1,757 24 14 Northwest Ethiopia Sample-15 1,500−2,100 6.1460 35. 0960 780−2,110 34 16 Southwest Ethiopia Sample-16 1,826−2,100 9.0501 40.5221 780−1,074 27.8 12.5 Eastern Ethiopia Sample-17 1,540−2,000 9.1144 41.6335 650−1,250 28 13 Eastern Ethiopia Sample-18 1,200−3,020 8.0960 37.0960 1,300−2,300 23 18 Southwest Ethiopia Sample-19 1,770−2,085 7.6788 36.8385 1,138−1690 30 14 Southwest Ethiopia Sample-20 900−2,700 7.2415 35.1317 400−2,000 27 15 Southwest Ethiopia Table 1.
Coffee sample collected areas and their agro-ecologies (n = 20).
-
Samples Hundred bean weight (g) Bean moisture content (%) Bean crude
fat content
(%)pH Titratable acidity mL of NaOH g−1 Sample-1 14.59 8.55 10.39 5.38 3.05 Sample-2 13.2 8.4 10.35 5.48 1.8 Sample-3 16.2 10.45 15.4 4.85 2.33 Sample-4 15.71 9.45 11.87 5.11 2.26 Sample-5 15.38 9.25 13.27 5.18 3.02 Sample-6 17.28 11.87 16.19 4.3 1.97 Sample-7 14.53 8.5 12.5 5.41 1.93 Sample-8 17.14 10.72 16.83 4.54 2.02 Sample-9 15.86 9.55 13.81 5.05 2.61 Sample-10 14.95 9 12.78 5.2 2.25 Sample-11 15.77 9.5 14.32 5.01 2.48 Sample-12 16.67 10.6 14.97 4.8 2.88 Sample-13 16 9.95 14.42 5.01 2.32 Sample-14 15.21 9.2 13.99 5.19 2.57 Sample-15 15.51 9.45 14.12 5.11 3.19 Sample-16 15.46 9.3 14.1 5.15 2.26 Sample-17 14.97 9 13.19 5.2 2.49 Sample-18 16.19 10 14.93 4.91 3.45 Sample-19 15.21 9.2 14.03 5.21 2.4 Sample-20 14.14 9.95 14.51 5.04 2.86 Mean 15.4985 9.5945 13.7985 5.0565 2.507 SD 0.983 0.845 1.657 0.2804 0.448 CV % 6.343 8.816 12 5.54 17.87 Table 2.
Green coffee samples physicochemical characteristics (n= 20).
-
Analyte Retention
timeS/N
ratioLOD
(mg·L−1)LOQ
(mg·L−1)R2 Trigonelline 4.58 0.43 1.30 4.3 0.999 Caffeine 13.46 0.29 0.89 2.9 0.999 Chlorogenic acid 18.38 0.25 0.77 2.5 0.998 Sucrose 8.86 0.016 0.05 0.16 0.999 Table 3.
Linearity, accuracy, LOD, and LOQ parameters of the chromatographic system.
-
Samples Altitude
(m.a.s.l.)Annual rainfall
(mm)Average
temperature (°C)Caffeine
(g/100g)Chlorogenic acid
(g/100g)Trigonelline
(g/100g)Sucrose
(g/100g)Sample-1 1,200 1,500 23.9 0.92 7.7 0.52 8.1 Sample-2 1,025 1,651 21.5 0.89 8.2 0.48 5.8 Sample-3 2,050 1,500 19.6 0.78 4.5 1.41 13.7 Sample-4 1,850 1,340 19.4 0.86 5.2 0.98 10.5 Sample-5 1,950 1,300 16.5 1.07 5 1.52 13.8 Sample-6 2,775 1,134 9 1.01 3.7 2.31 25.7 Sample-7 1,875 1,500 17.5 0.86 5 1.22 10.6 Sample-8 2,340 1,067 16 0.94 4.1 1.97 15.5 Sample-9 1,806 1,000 20 1.03 5.6 1.32 10.5 Sample-10 1,887 1,600 20 0.95 5.8 1.37 11.2 Sample-11 1,845 1,150 20 0.88 5.6 1.18 10.12 Sample-12 2,325 1,134 22.4 0.74 4.4 2.02 15.2 Sample-13 2,105 2,300 15 0.81 4.2 1.57 14.1 Sample-14 2,070 1,571 19 0.77 4.6 1.48 13.9 Sample-15 1,800 1,445 25 0.84 5.4 0.89 10.7 Sample-16 1,963 927 20.15 1.04 5.1 1.60 12.1 Sample-17 1,770 950 20.5 0.91 6.2 0.74 9.5 Sample-18 2,110 1,800 20.5 0.84 4.4 1.64 13.9 Sample-19 1,927 1,414 22 1.03 4.9 1.58 12.1 Sample-20 1,800 1,200 21 0.97 5.8 0.92 10.4 Mean 0.907 5.27 1.336 12.371 SD 0.097 1.123 0.483 3.973 CV % 10.69 21.32 36.21 32.11 Table 4.
Green coffee Arabica biochemical composition (n = 20).
Figures
(14)
Tables
(4)