-
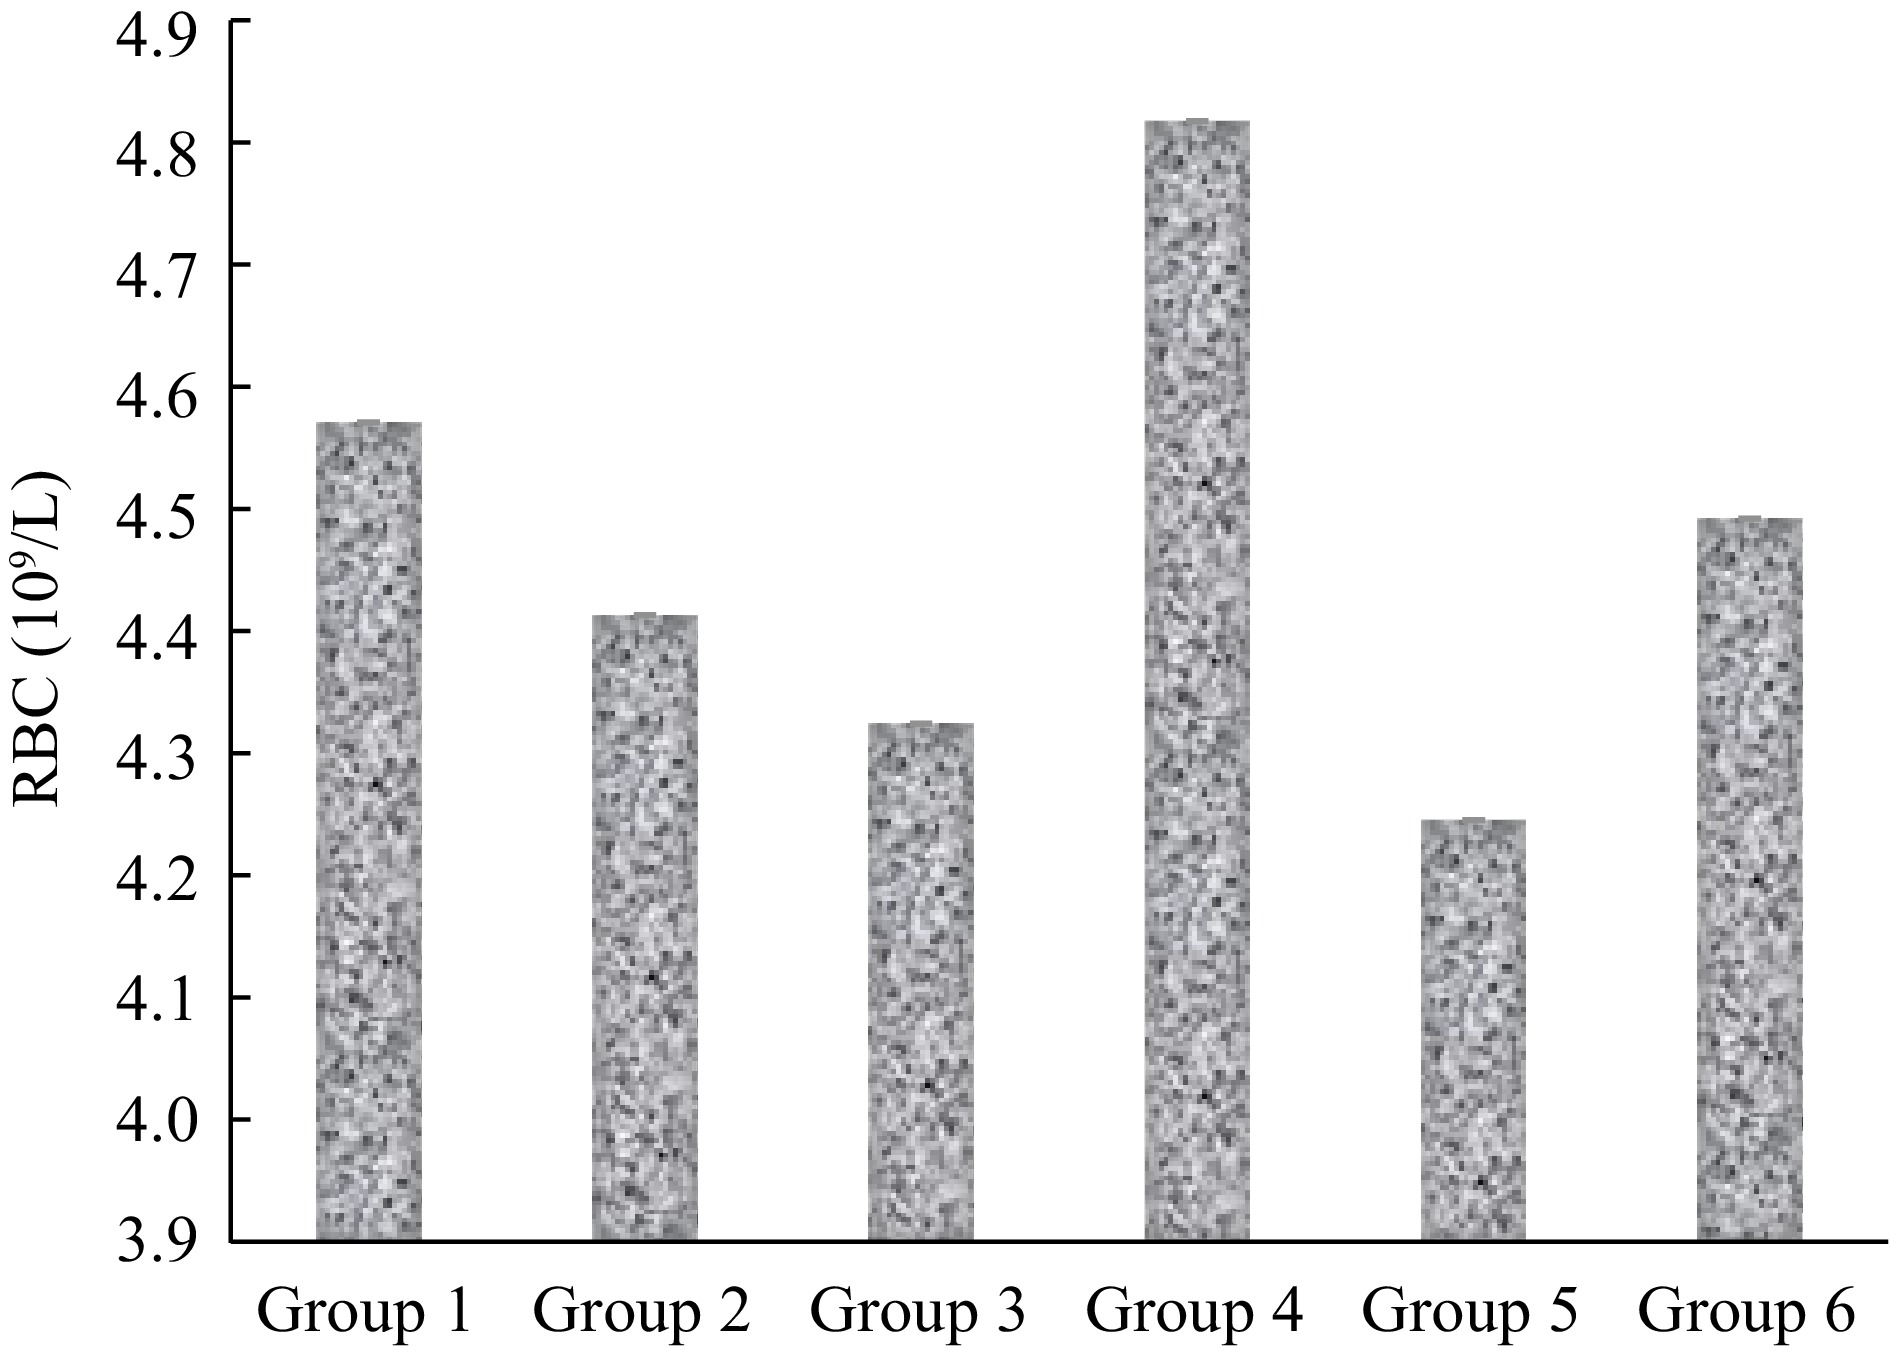
Figure 1.
RBC count of mice infected with malaria and treated with extract of S. linifolia.
-
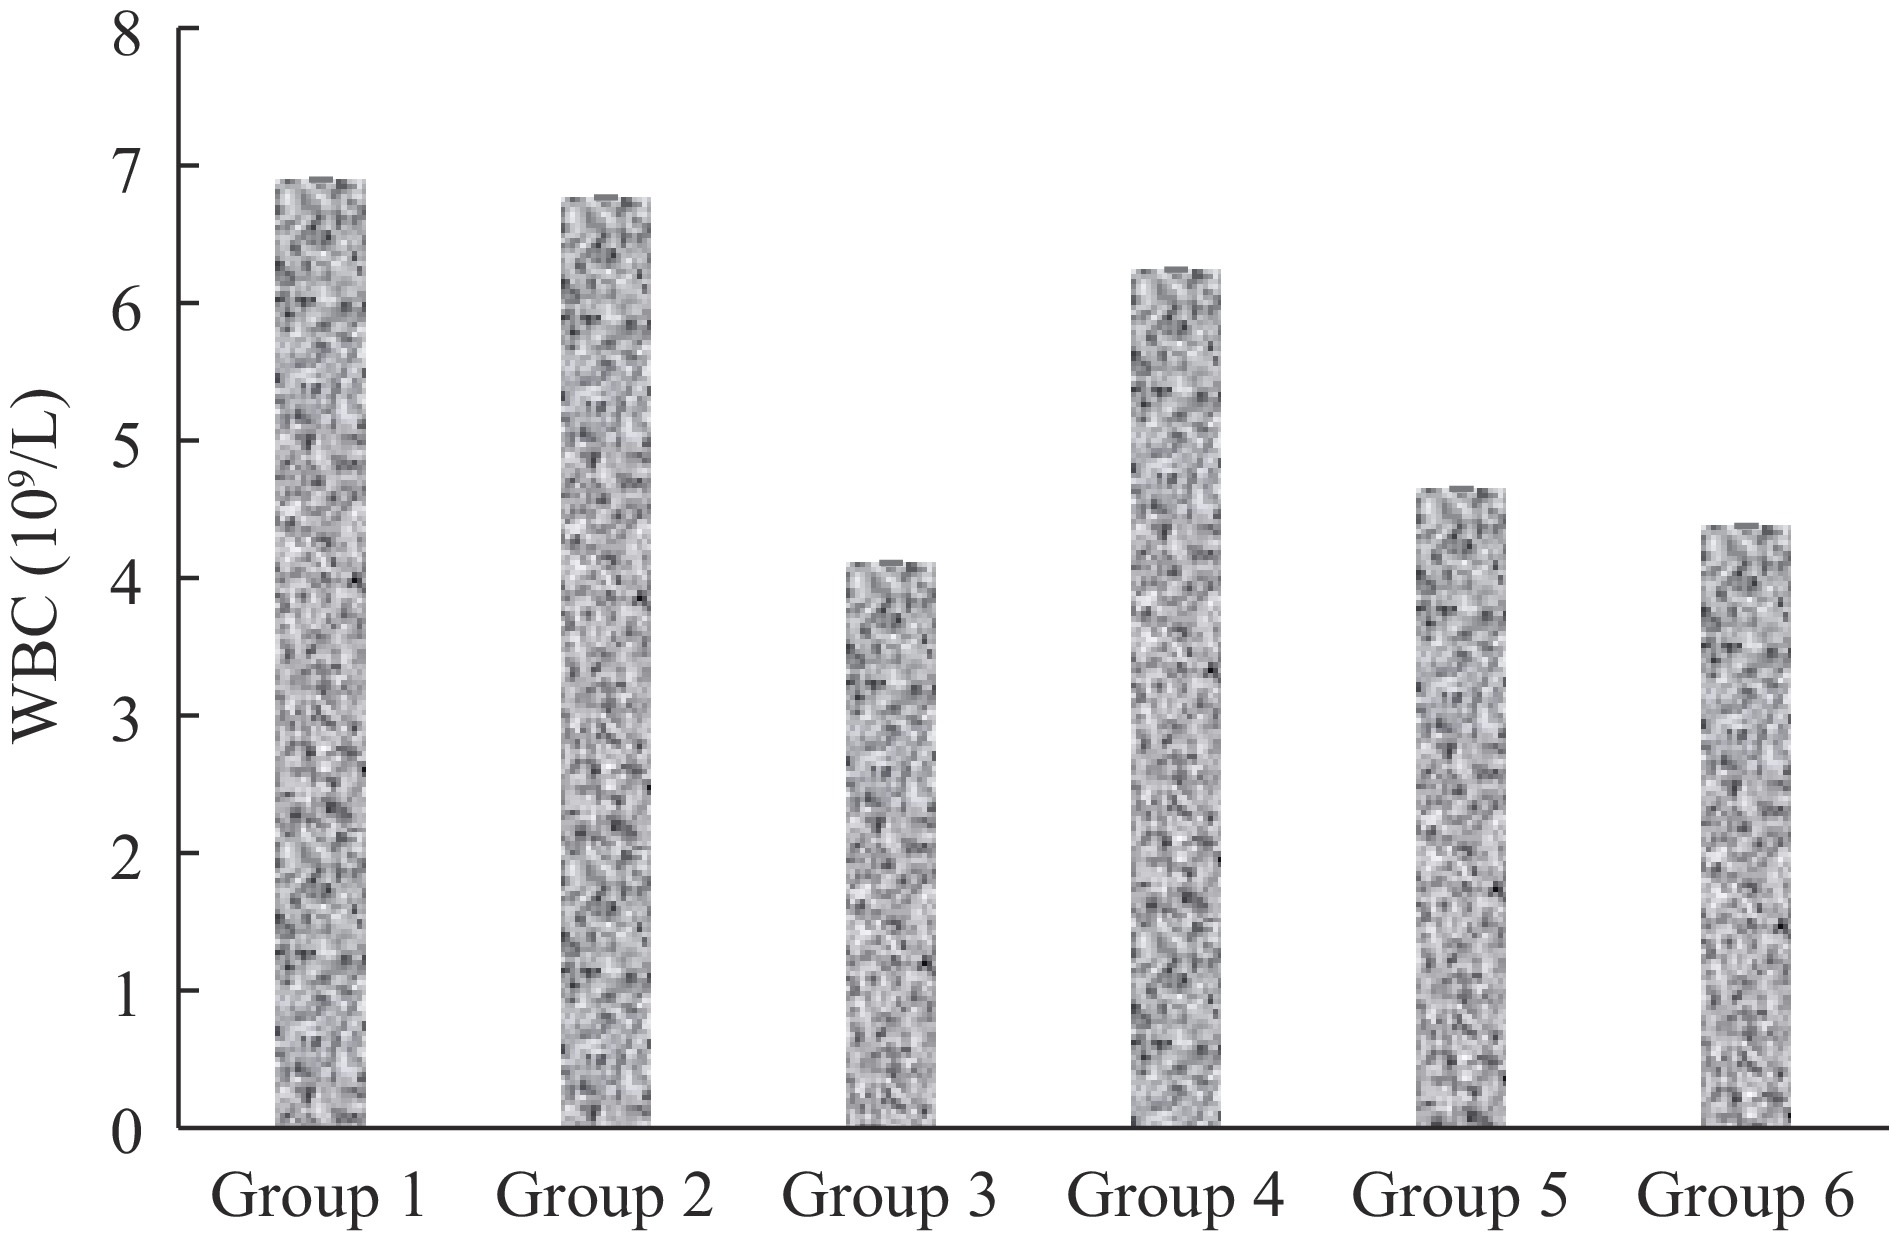
Figure 2.
WBC count of mice infected with malaria and treated with extract of S. linifolia.
-
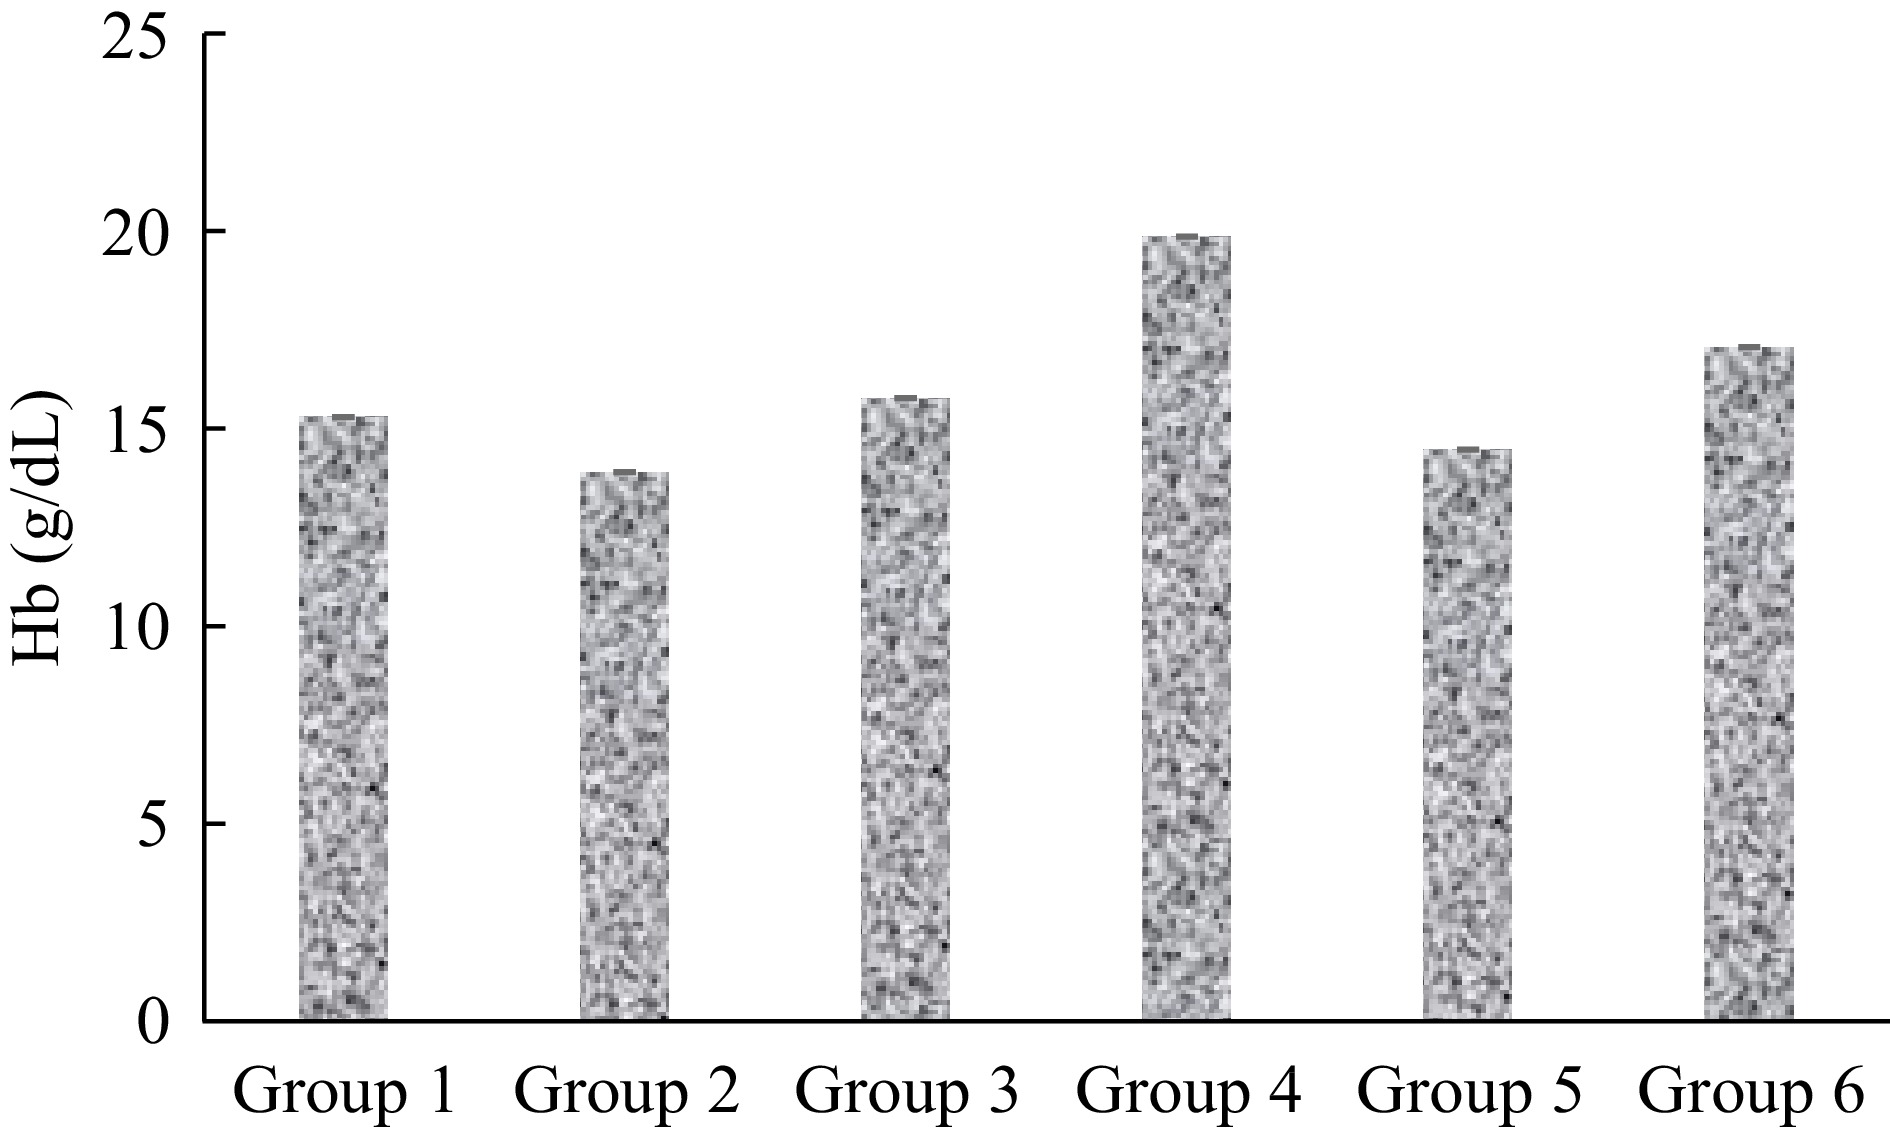
Figure 4.
Hb concentration of mice infected with malaria and treated with extract of S. linifolia.
-
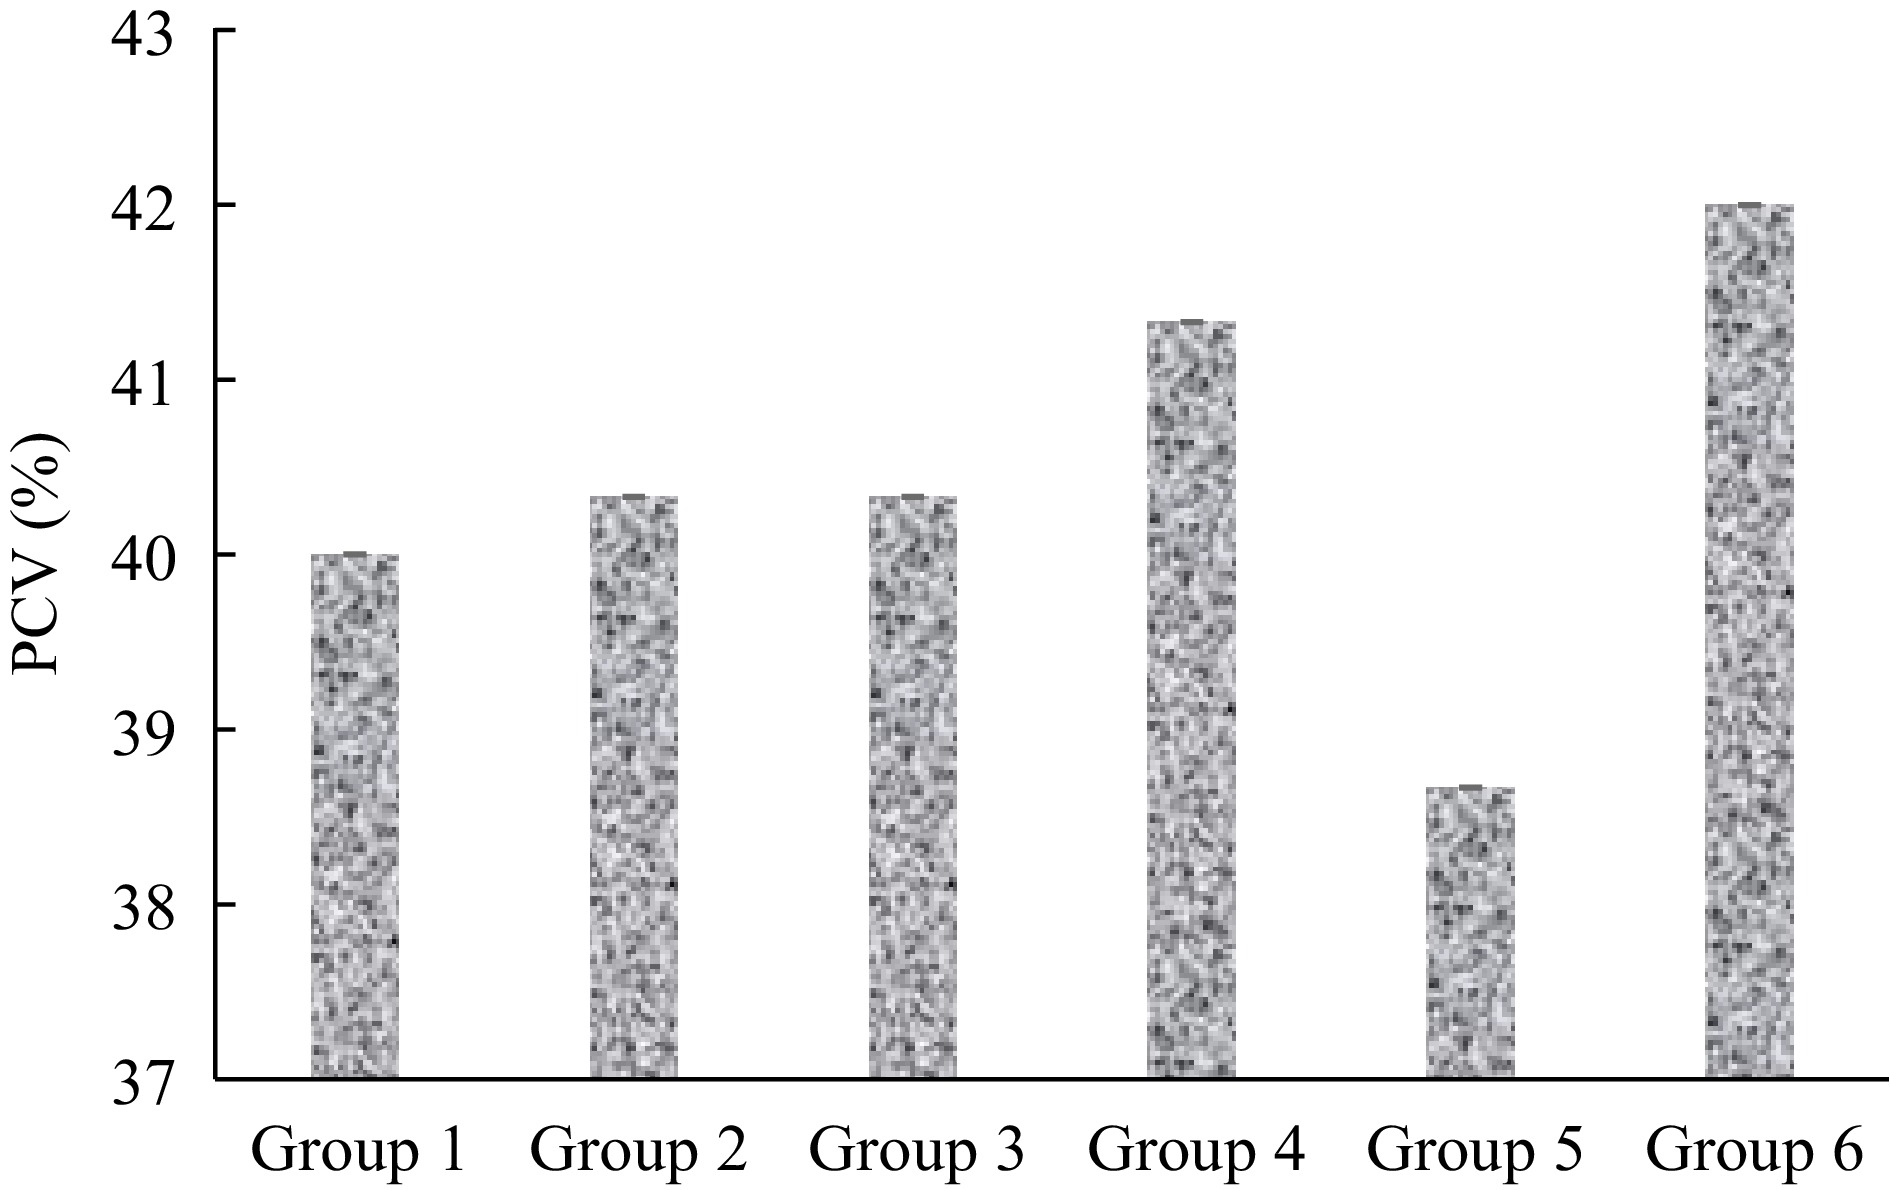
Figure 3.
PCV of mice infected with malaria and treated with extract of S. linifolia.
-
Treatments
(mg/kg bw, po, ELES)No. of animals used No. of deaths recorded 10 3 0 100 3 0 1,000 3 0 1,700 3 0 3,000 3 0 5,000 3 0 n = 3; po = per oral treatment; bw = body weight. Table 1.
Acute toxicity study.
-
Groups Before treatment 3 d post-treatment Normal control 0.00 ± 0.00a 0.00 ± 0.00a Positive control 80.00 ± 5.77b 70.00 ± 5.77e 80 mg/kg bw Arthesunate 73.33 ± 13.33b 30.00 ± 3.33c 100 mg/kg bw ELES 63.33 ± 8.82b 46.67 ± 3.33d 200 mg/kg bw ELES 63.33 ± 12.02b 26.67 ± 3.33bc 400 mg/kg bw ELES 56.67 ± 2.02b 16.67 ± 5.56b n = 3. Results are presented as Means ± SEM. Mean values that differ in superscripted alphabets down the columns are deemed significant (p < 0.05). Table 2.
Effect of ELES on malaria-infected mice parasitemia.
-
Concentrations
(µg/mL)FRF TRF ARF Hypotonicity-induced hemolysis (% inhibition) 50 43.15 ± 2.45a 51.50 ± 399.40a 61.20 ± 1.20b 100 78.45 ± 8.15b 89.734 ± 194.04b 88.50 ± 201.50a 200 80.65 ± 3.45c 64.10 ± 5.40c 75.30 ± 12.30c 400 67.45 ± 6.45d 69.70 ± 124.88d 73.45 ± 26.75d 800 70.10 ± 174.10e 53.80 ± 260.80e 68.15 ± 2.15e Aspirin (50 µg/mL) 79.76 ± 8.72b 79.76 ± 8.72f 79.76 ± 8.72f Protein denaturation (% inhibition) 50 32.44 ± 41.10a 35.12 ± 52.40a 22.99 ± 3.66a 100 94.64 ± 1.86b 77.02 ± 10.57b 80.95 ± 4.04a 200 85.12 ± 1.81c 53.27 ± 8.87c 84.00 ± 18.09c 400 62.50 ± 2.73d 66.07 ± 2.73d 71.73 ± 23.90d 800 79.82 ± 7.80e 76.84±21.60b 88.02 ± 18.04e Aspirin (50 µg/mL) 79.76 ± 8.72e 79.76 ± 8.72e 79.76 ± 8.72f Values are presented as mean ± standard error of the mean (SEM). Values with different letter superscripts are significantly (p < 0.05) different. Table 3.
Membrane stabilization capacity of FRF, TRF, and ARF of S. linifolia on hypotonicity-induced hemolysis and protein denaturation.
-
Concentrations
(µg/mL)FRF TRF ARF Proteinase (% inhibition) 50 20.80 ± 0.42c 14.40 ± 0.29b 15.84 ± 2.30b 100 23.71 ± 0.79b 18.75 ± 1.56a 18.13 ± 2.20a 200 30.46 ± 8.34a 20.78 ± 3.14c 20.92 ± 1.81c 400 33.27 ± 6.25d 27.09 ± 8.00d 33.44 ± 3.09d 800 39.96 ± 9.37e 32.04 ± 5.63e 39.85 ± 2.93e Aspirin (50 µg/mL) 62.64 ± 3.84f 62.64 ± 3.84f 62.64 ± 3.84f Phospholipase A2 (% inhibition) 50 59.85 ± 24.63b 41.00 ± 3.12a 42.25 ± 5.69b 100 82.57 ± 5.89c 58.87 ± 2.41b 61.78 ± 0.72a 200 84.61 ± 2.51a 69.69 ± 4.767c 62.00 ± 6.86c 400 73.77 ± 8.96d 70.63 ± 4.03d 62.47 ± 10.47c 800 85.90 ± 2.67a 60.08 ± 6.44e 69.82 ± 7.14d Prednisolone (50 µg/mL) 76.01 ± 1.52e 76.01 ± 1.52f 76.01 ± 1.52e Values are presented as mean ± standard error of the mean (SEM). Values with different letter superscripts are significantly (p < 0.05) different. Table 4.
Effect of FRF, TRF, and ARF of S. linifolia on proteinase and phospholipase A2 activities.
Figures
(4)
Tables
(4)