-
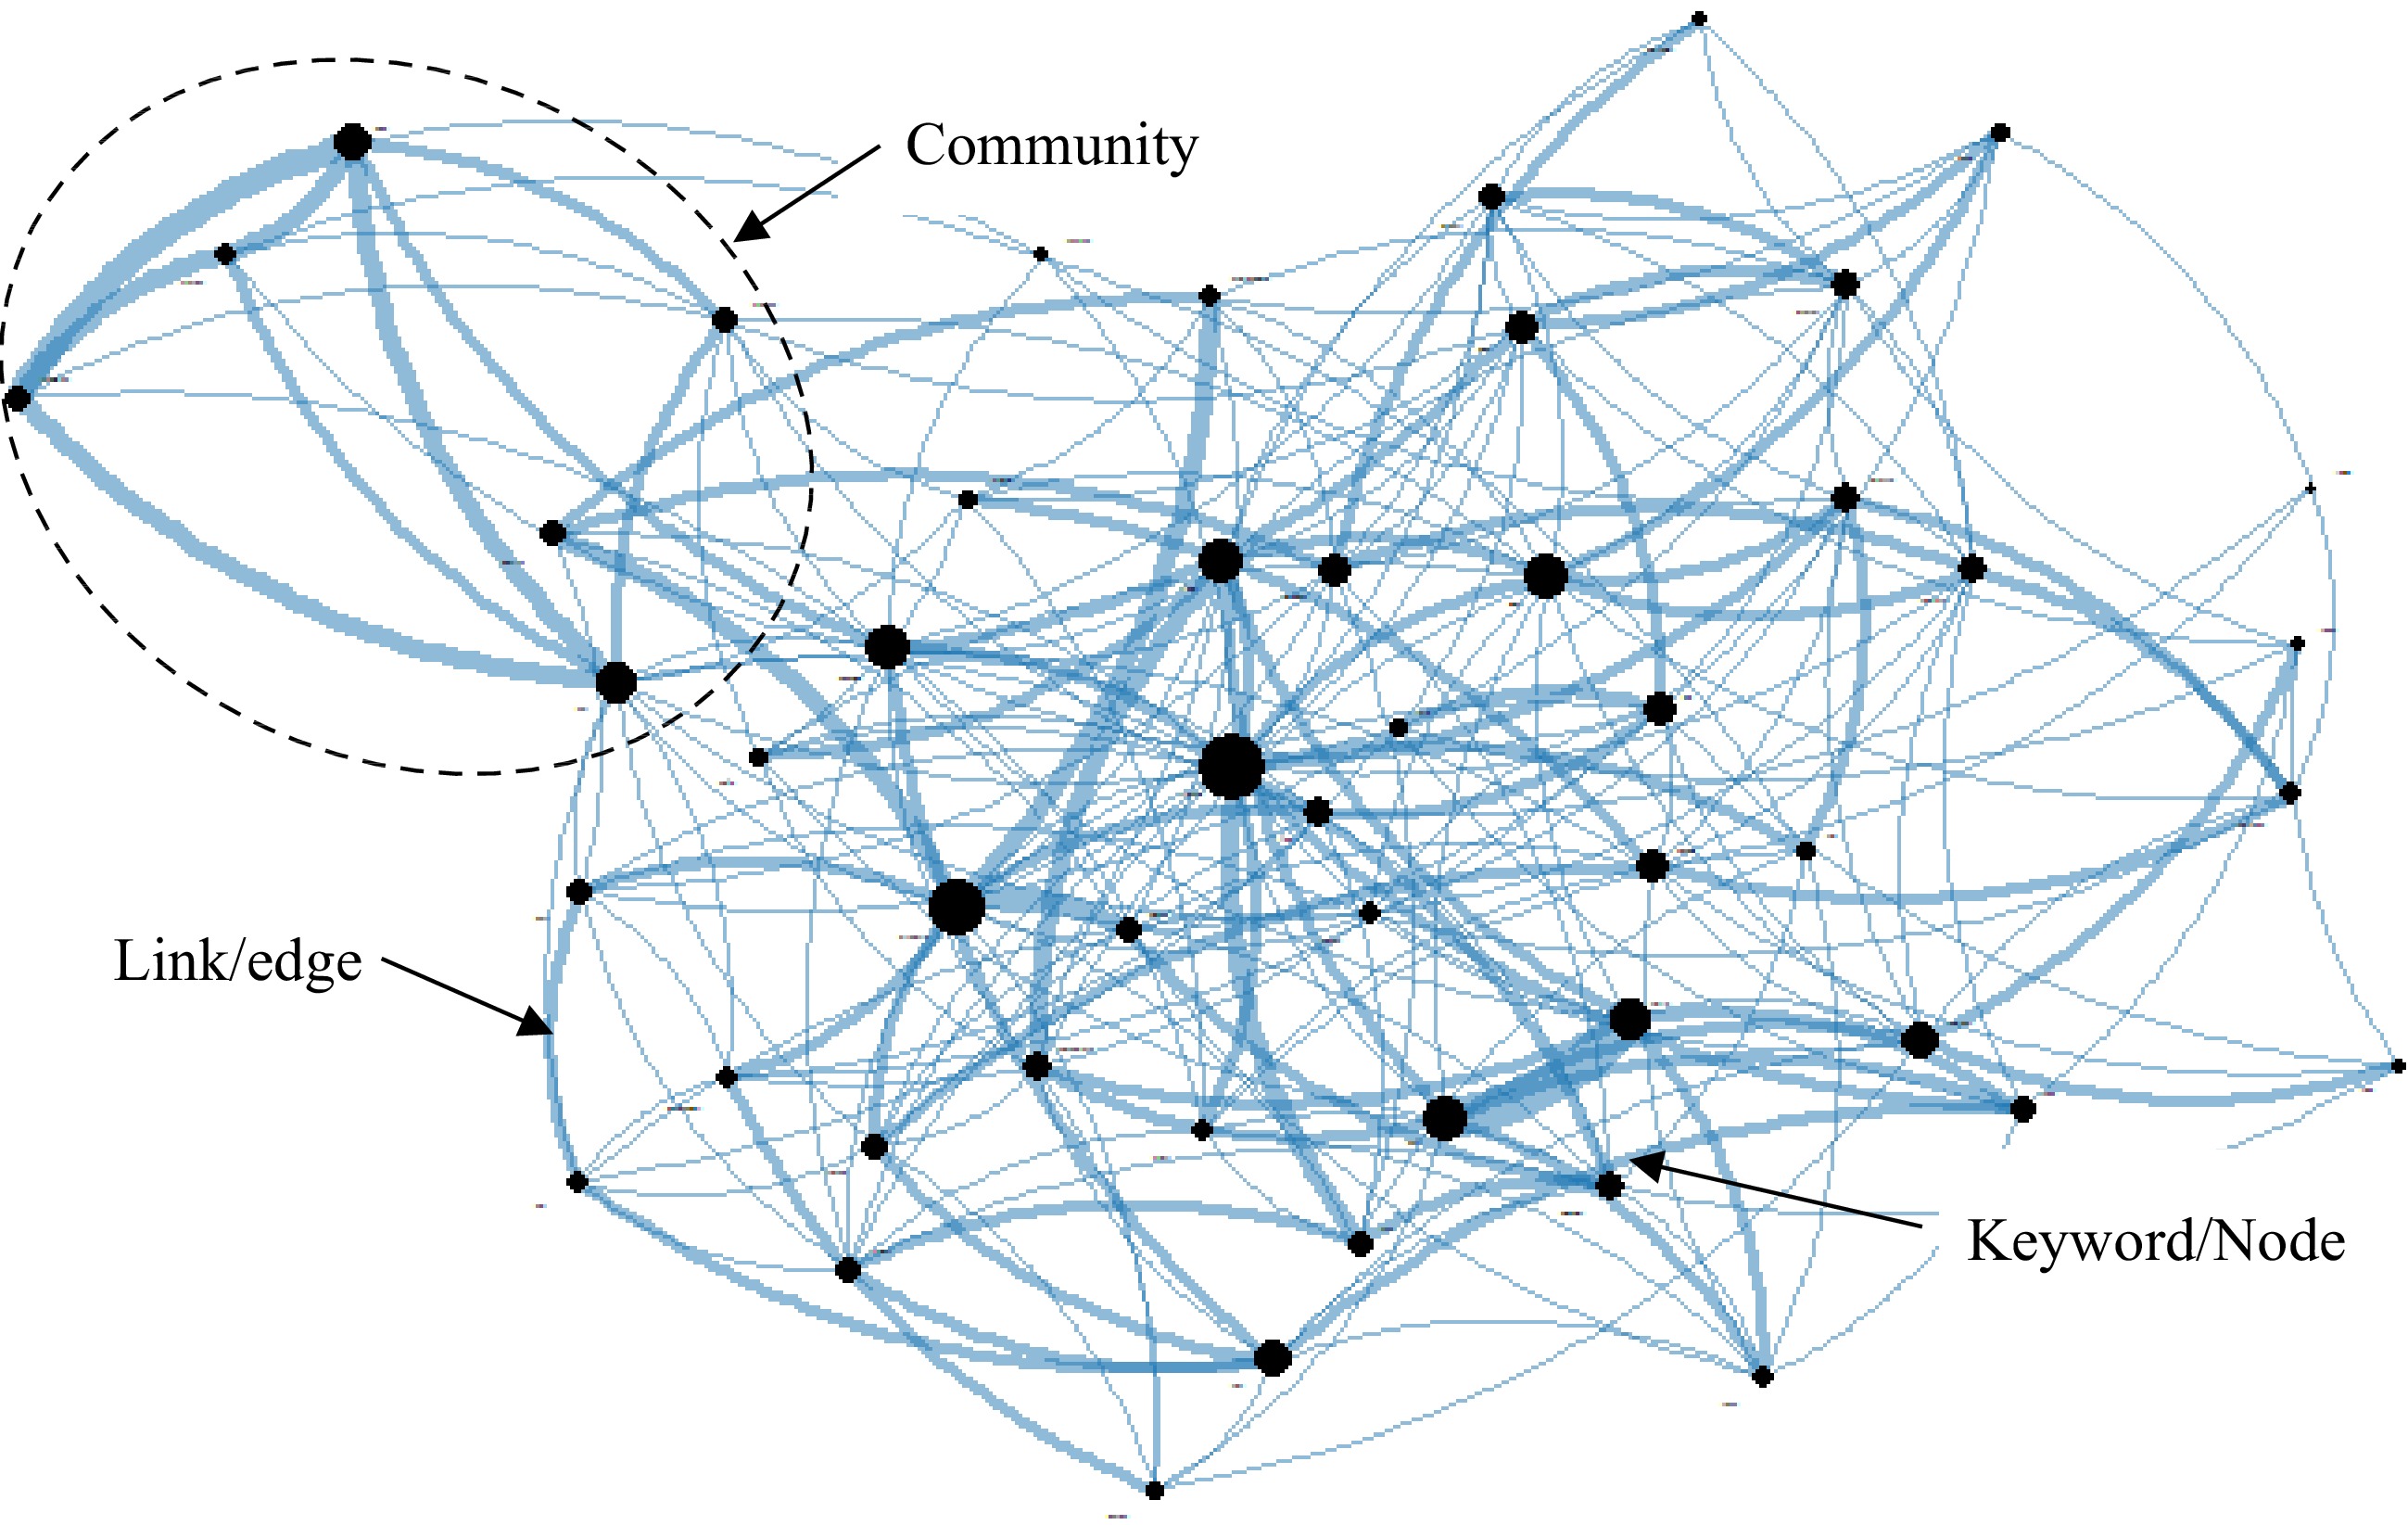
Figure 1.
A typical example of a text network.
-
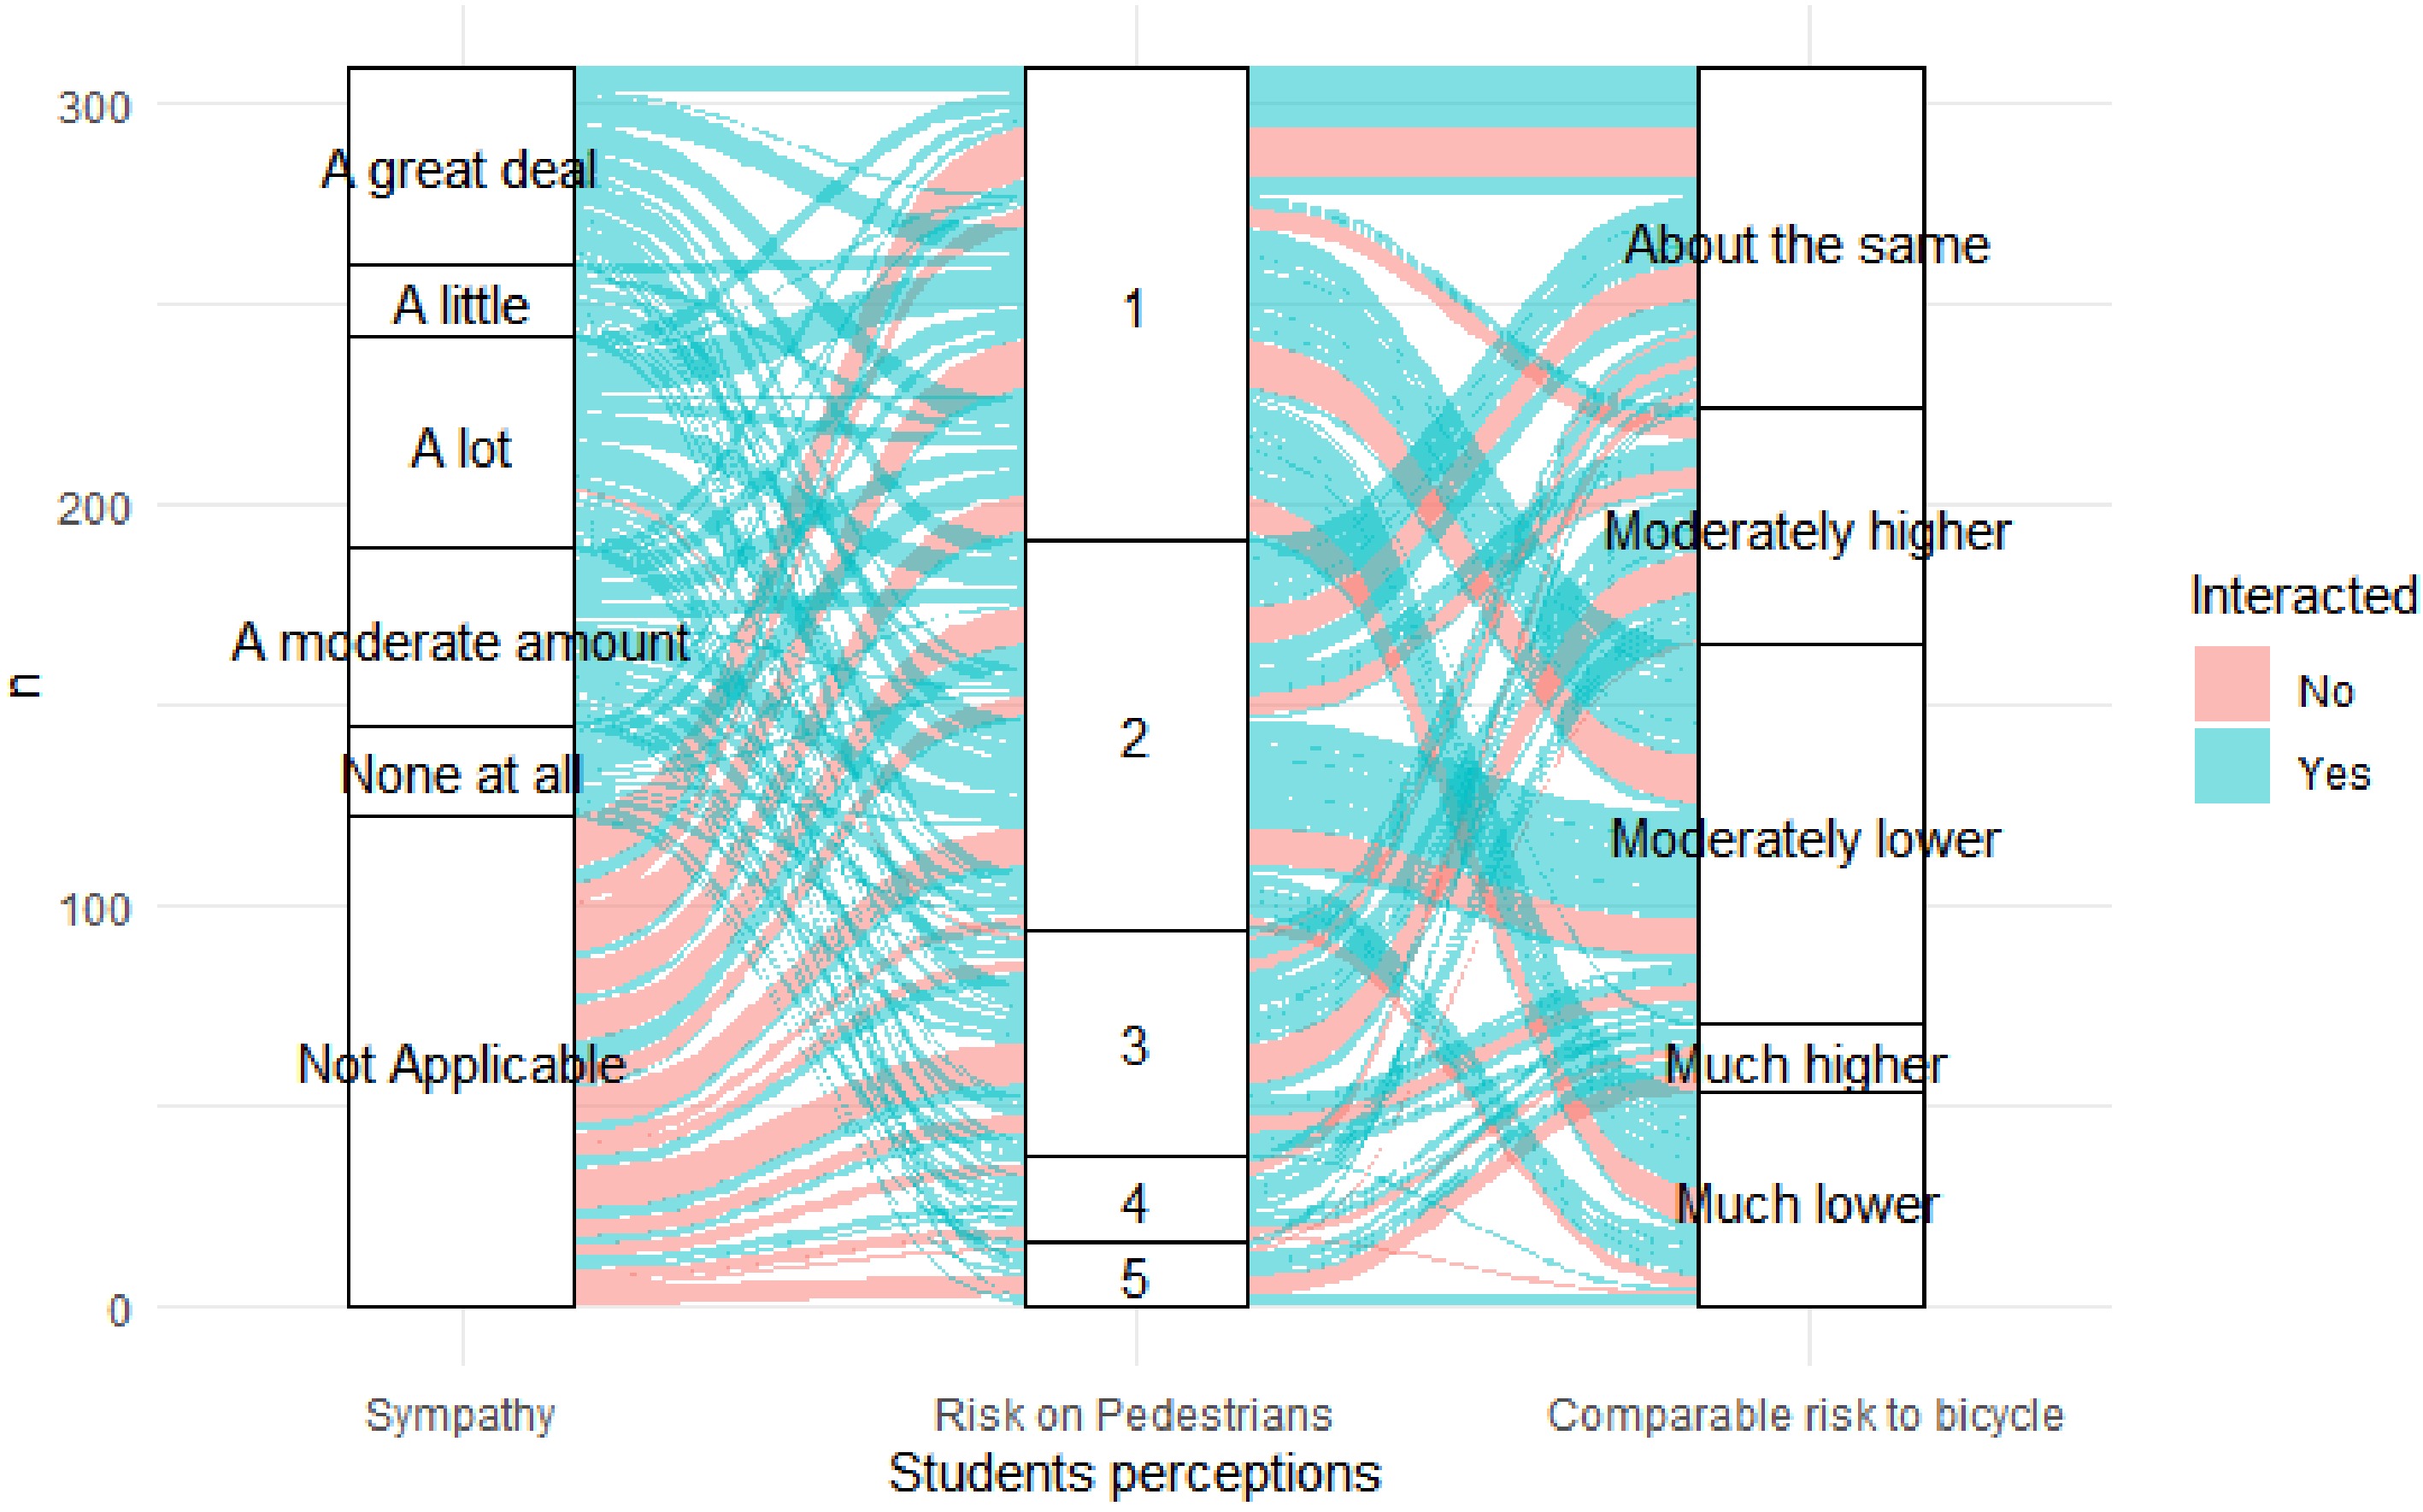
Figure 2.
Ratings of the sympathy and ratings by shuttle interaction.
-
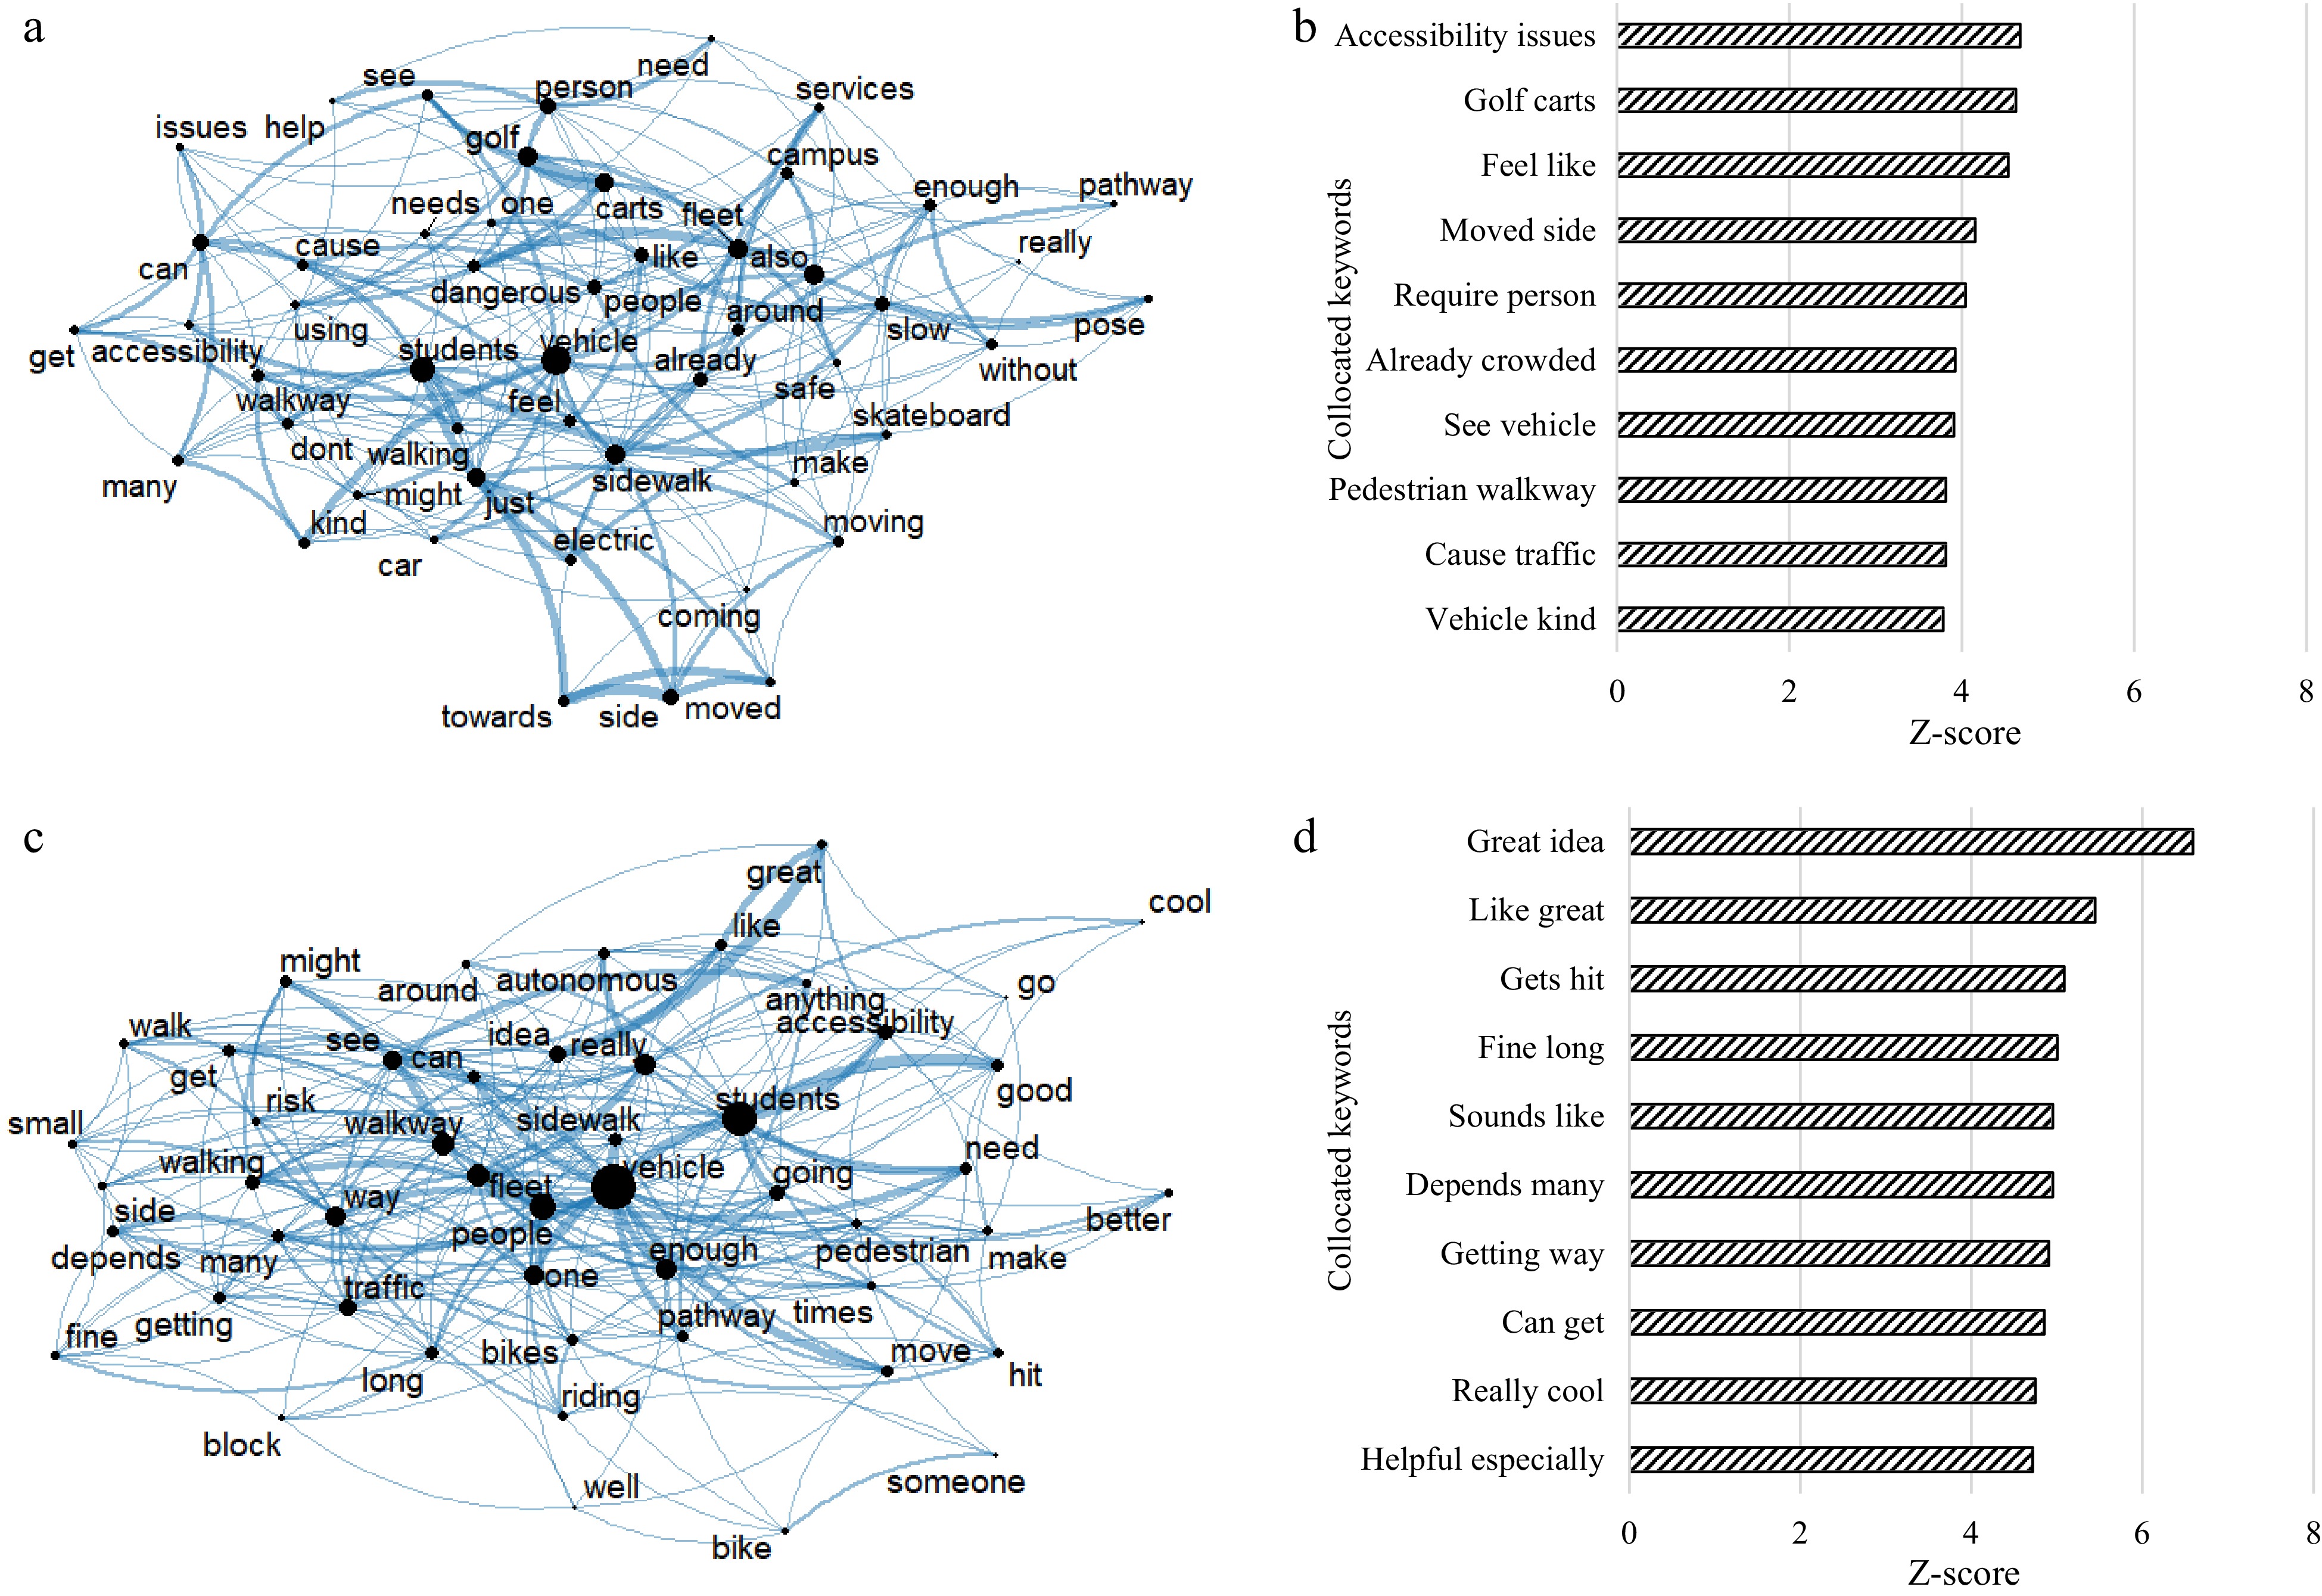
Figure 3.
Text networks and collocated keywords for perceived risk to pedestrians. (a) Text network for AV as risky to pedestrians, (b) collocated keywords for AV as risky to pedestrians, (c) text Network for AV as not risky to pedestrians, (d) collocated keywords for AV as not risky to pedestrians.
-
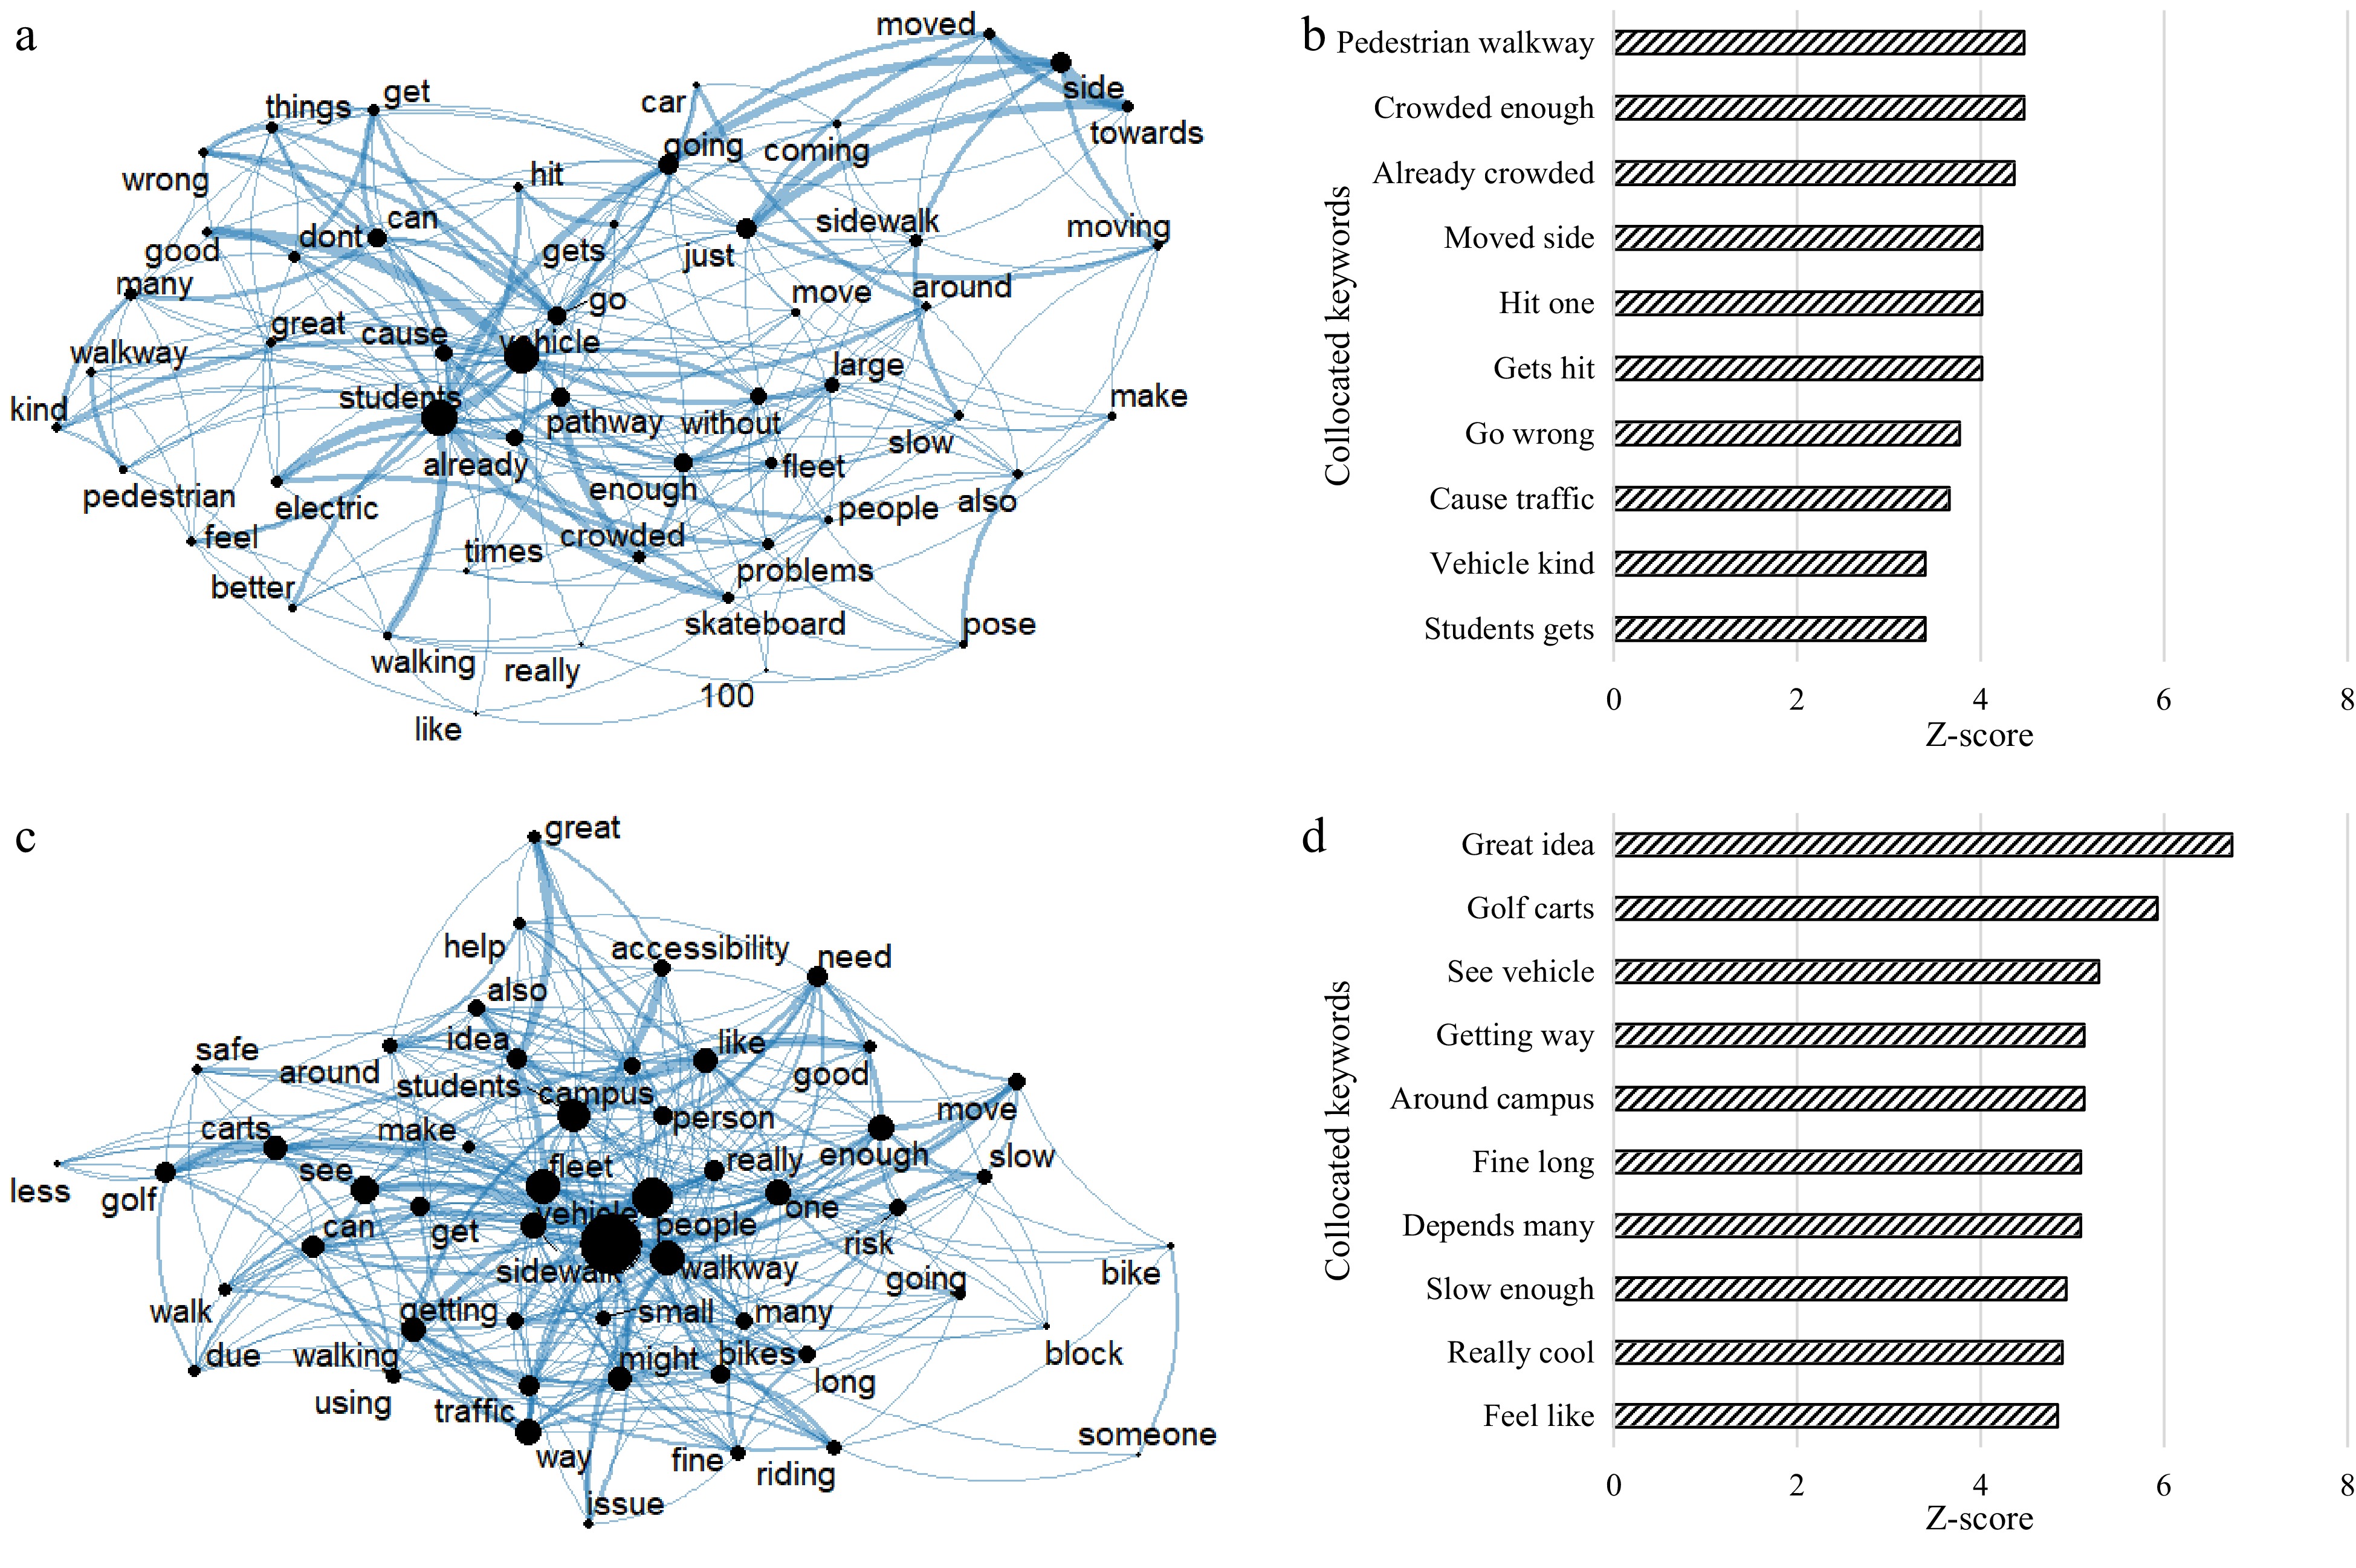
Figure 4.
Text networks and collocated keywords for perceived risk of AV compared to bicycles. (a) Text network for AV as risky compared to bicycles, (b) collocated keywords for AV were found to be risky compared to bicycles, (c) text network for AV is not risky compared to bicycles, (d) collocated keywords for AV are not risky compared to bicycles.
-
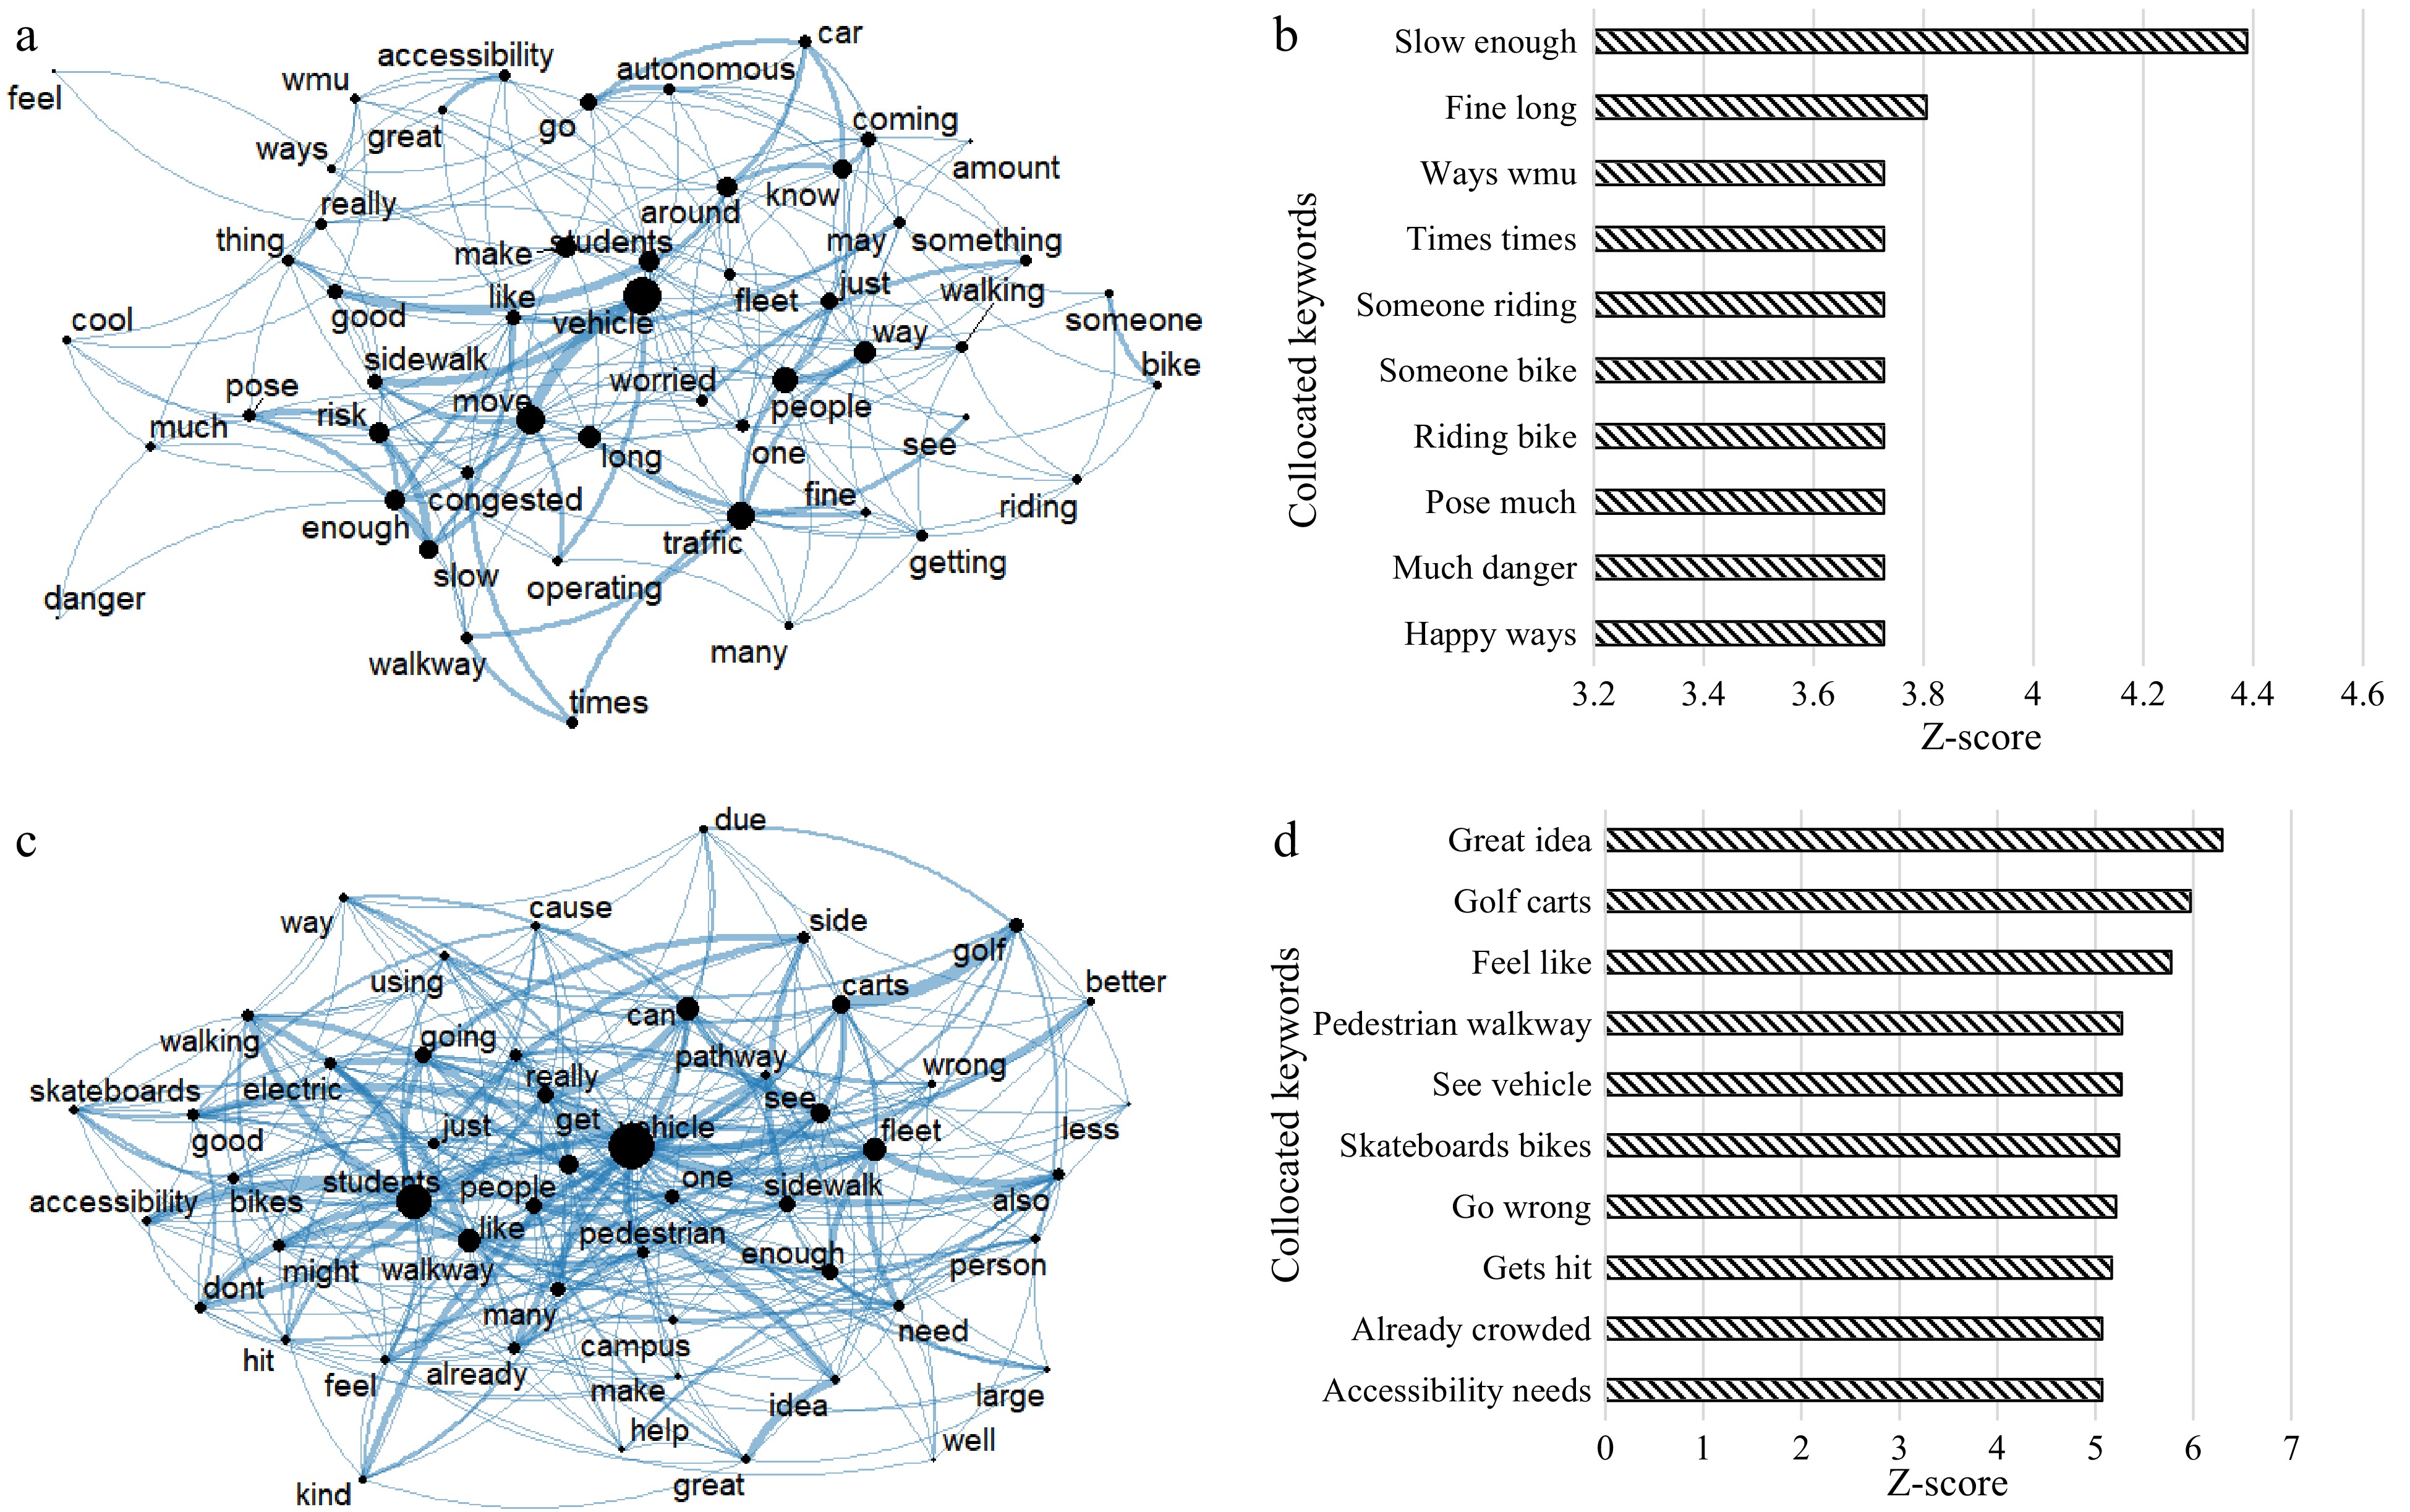
Figure 5.
Text networks and collocated keywords for perceived sympathy level. (a) Text network for high sympathy level, (b) top collocated keywords for high sympathy level, (c) text network for low sympathy level, (d) top collocated keywords for low sympathy level.
-
Variable Category Sympathy
(N = 187)Risk to pedestrian
(N = 310)Risk (shuttle vs bicycle
(N = 310)Gender Male 103 146 146 Female 69 111 111 Didn't respond 15 53 53 Ethnicity Caucasian 133 192 192 Others 38 63 63 Didn't respond 16 55 55 Age 18–26 years 174 244 244 Others 10 34 34 Didn't respond 3 32 32 Table 1.
Descriptive analysis results.
-
Variable Estimate OR Est.
Error[95% CI] Estimate OR Est.
Error[95% CI] Estimate OR Est.
Error[95% CI] Sympathy Risk to pedestrian Risk (shuttle vs bicycle) Gender Female Male −0.53 0.59 0.29 −1.1 0.04 −0.45 0.64 0.23 −0.91 −0.01 −0.41 0.66 0.23 −0.87 0.05 Age group (years) 18–25 > 25 −1.59 0.20 0.82 −3.28 −0.04 0.11 1.12 0.39 −0.65 0.88 0.42 1.52 0.41 −0.36 1.24 Ethnicity Caucasian Non-Caucasian 0.7 2.01 0.35 0.03 1.39 −0.56 0.57 0.28 −1.13 −0.02 −0.54 0.58 0.27 −1.07 −0.01 Model summary /cut1 −3.37 0.03 0.89 −5.15 −1.66 −0.96 0.38 0.43 −1.8 −0.11 −1.73 0.18 0.46 −2.64 −0.82 /cut2 −2.59 0.08 0.89 −4.4 −0.89 0.42 1.52 0.43 −0.41 1.27 −0.19 0.83 0.45 −1.05 0.7 /cut3 −1.41 0.24 0.88 −3.19 0.27 1.49 4.44 0.44 0.65 2.37 1.02 2.77 0.45 0.15 1.92 /cut4 −0.13 0.88 0.87 −1.89 1.54 2.58 13.20 0.51 1.6 3.59 2.88 17.81 0.52 1.89 3.97 CI = Credible interval, OR = Odds Ratio, Est Error = Estimated error. Table 2.
Bayesian ordered regression model results.
Figures
(5)
Tables
(2)