-
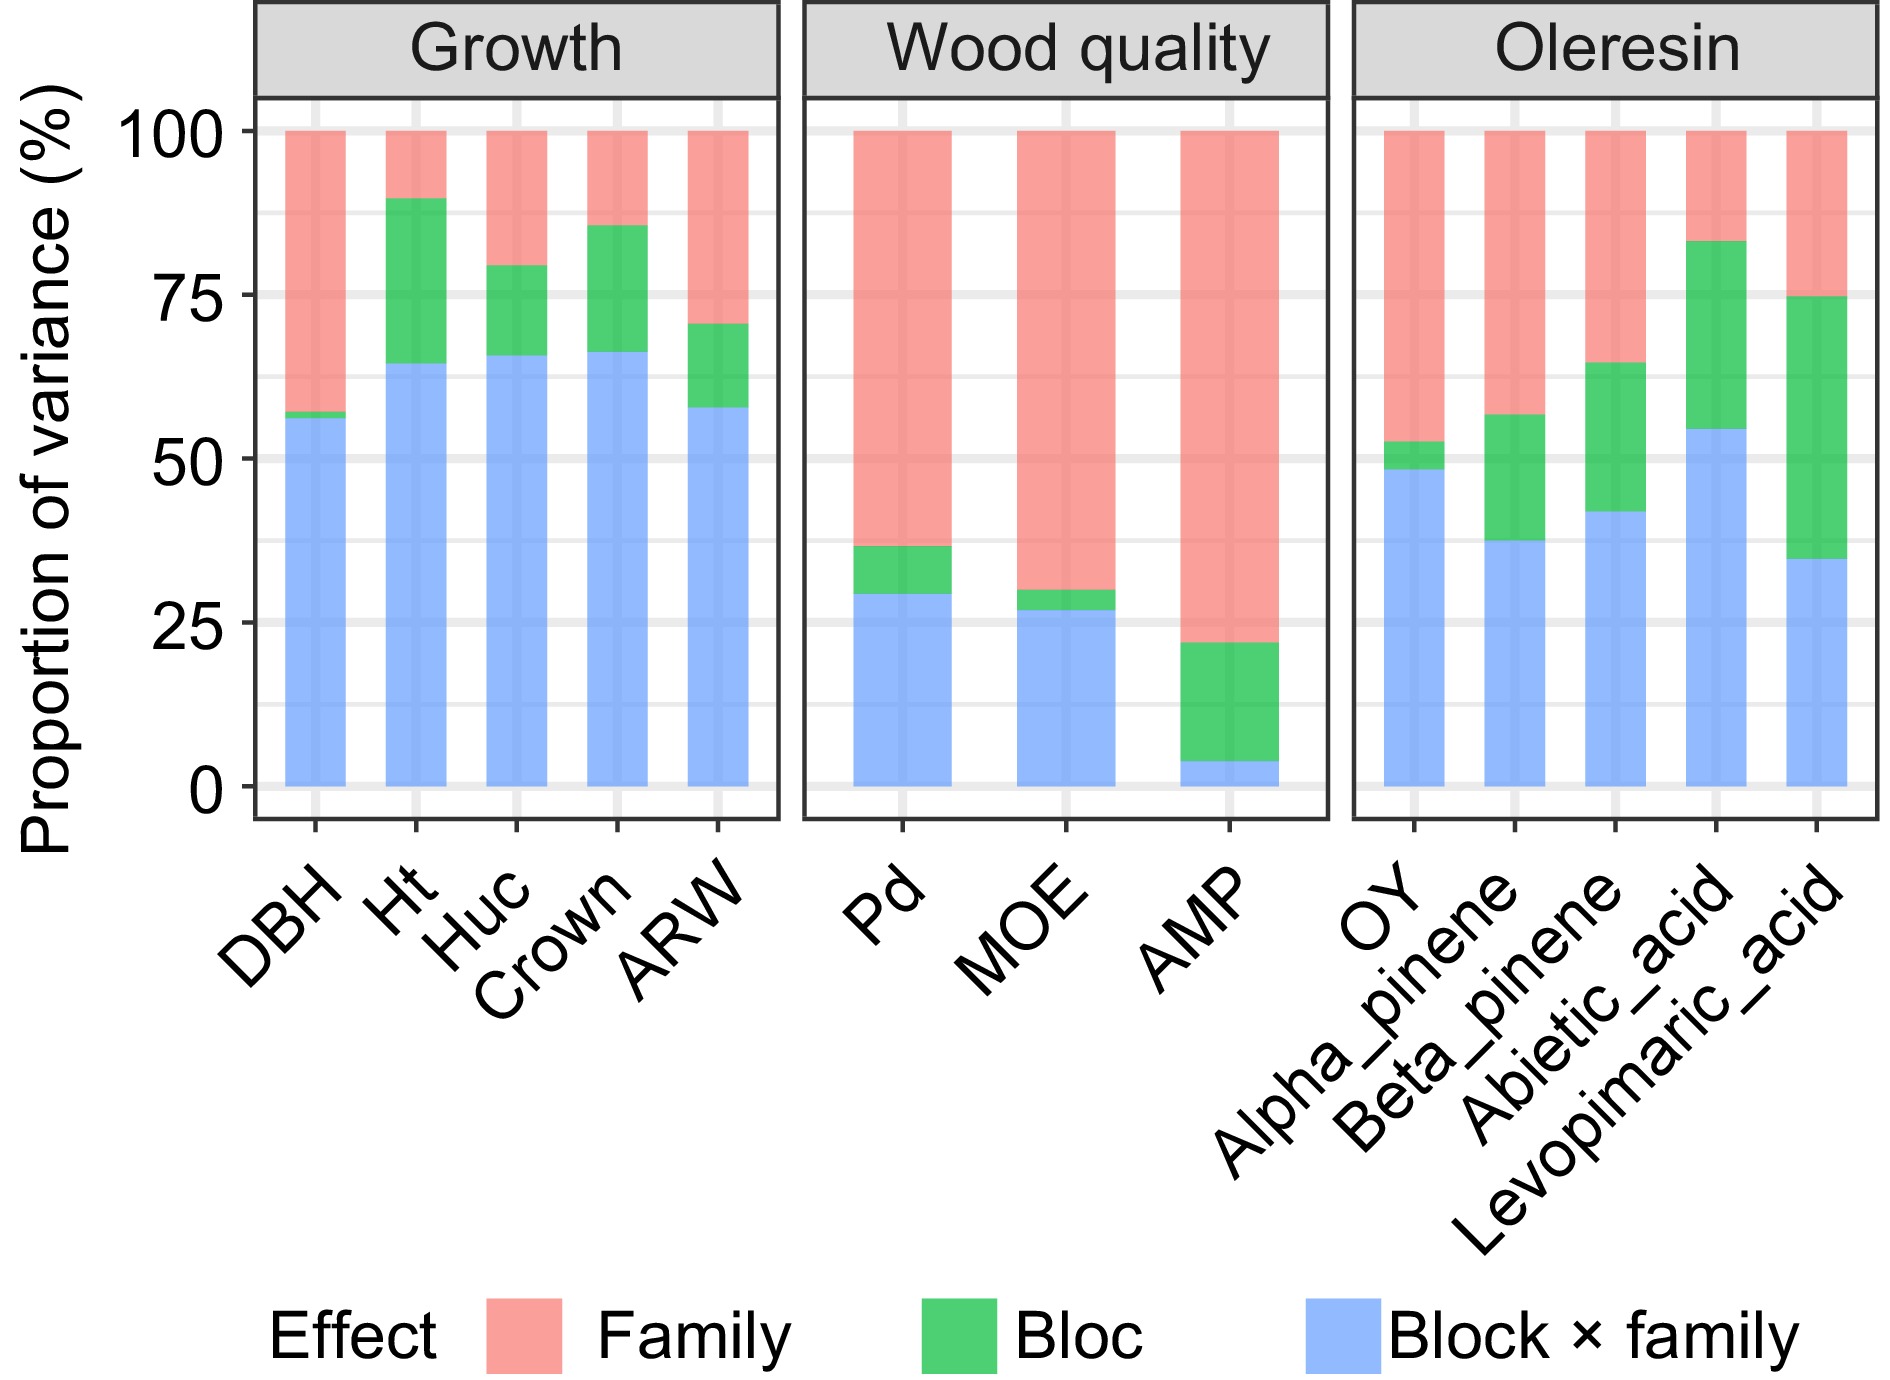
Figure 1.
The proportion of variance components of different effects for each trait.
-
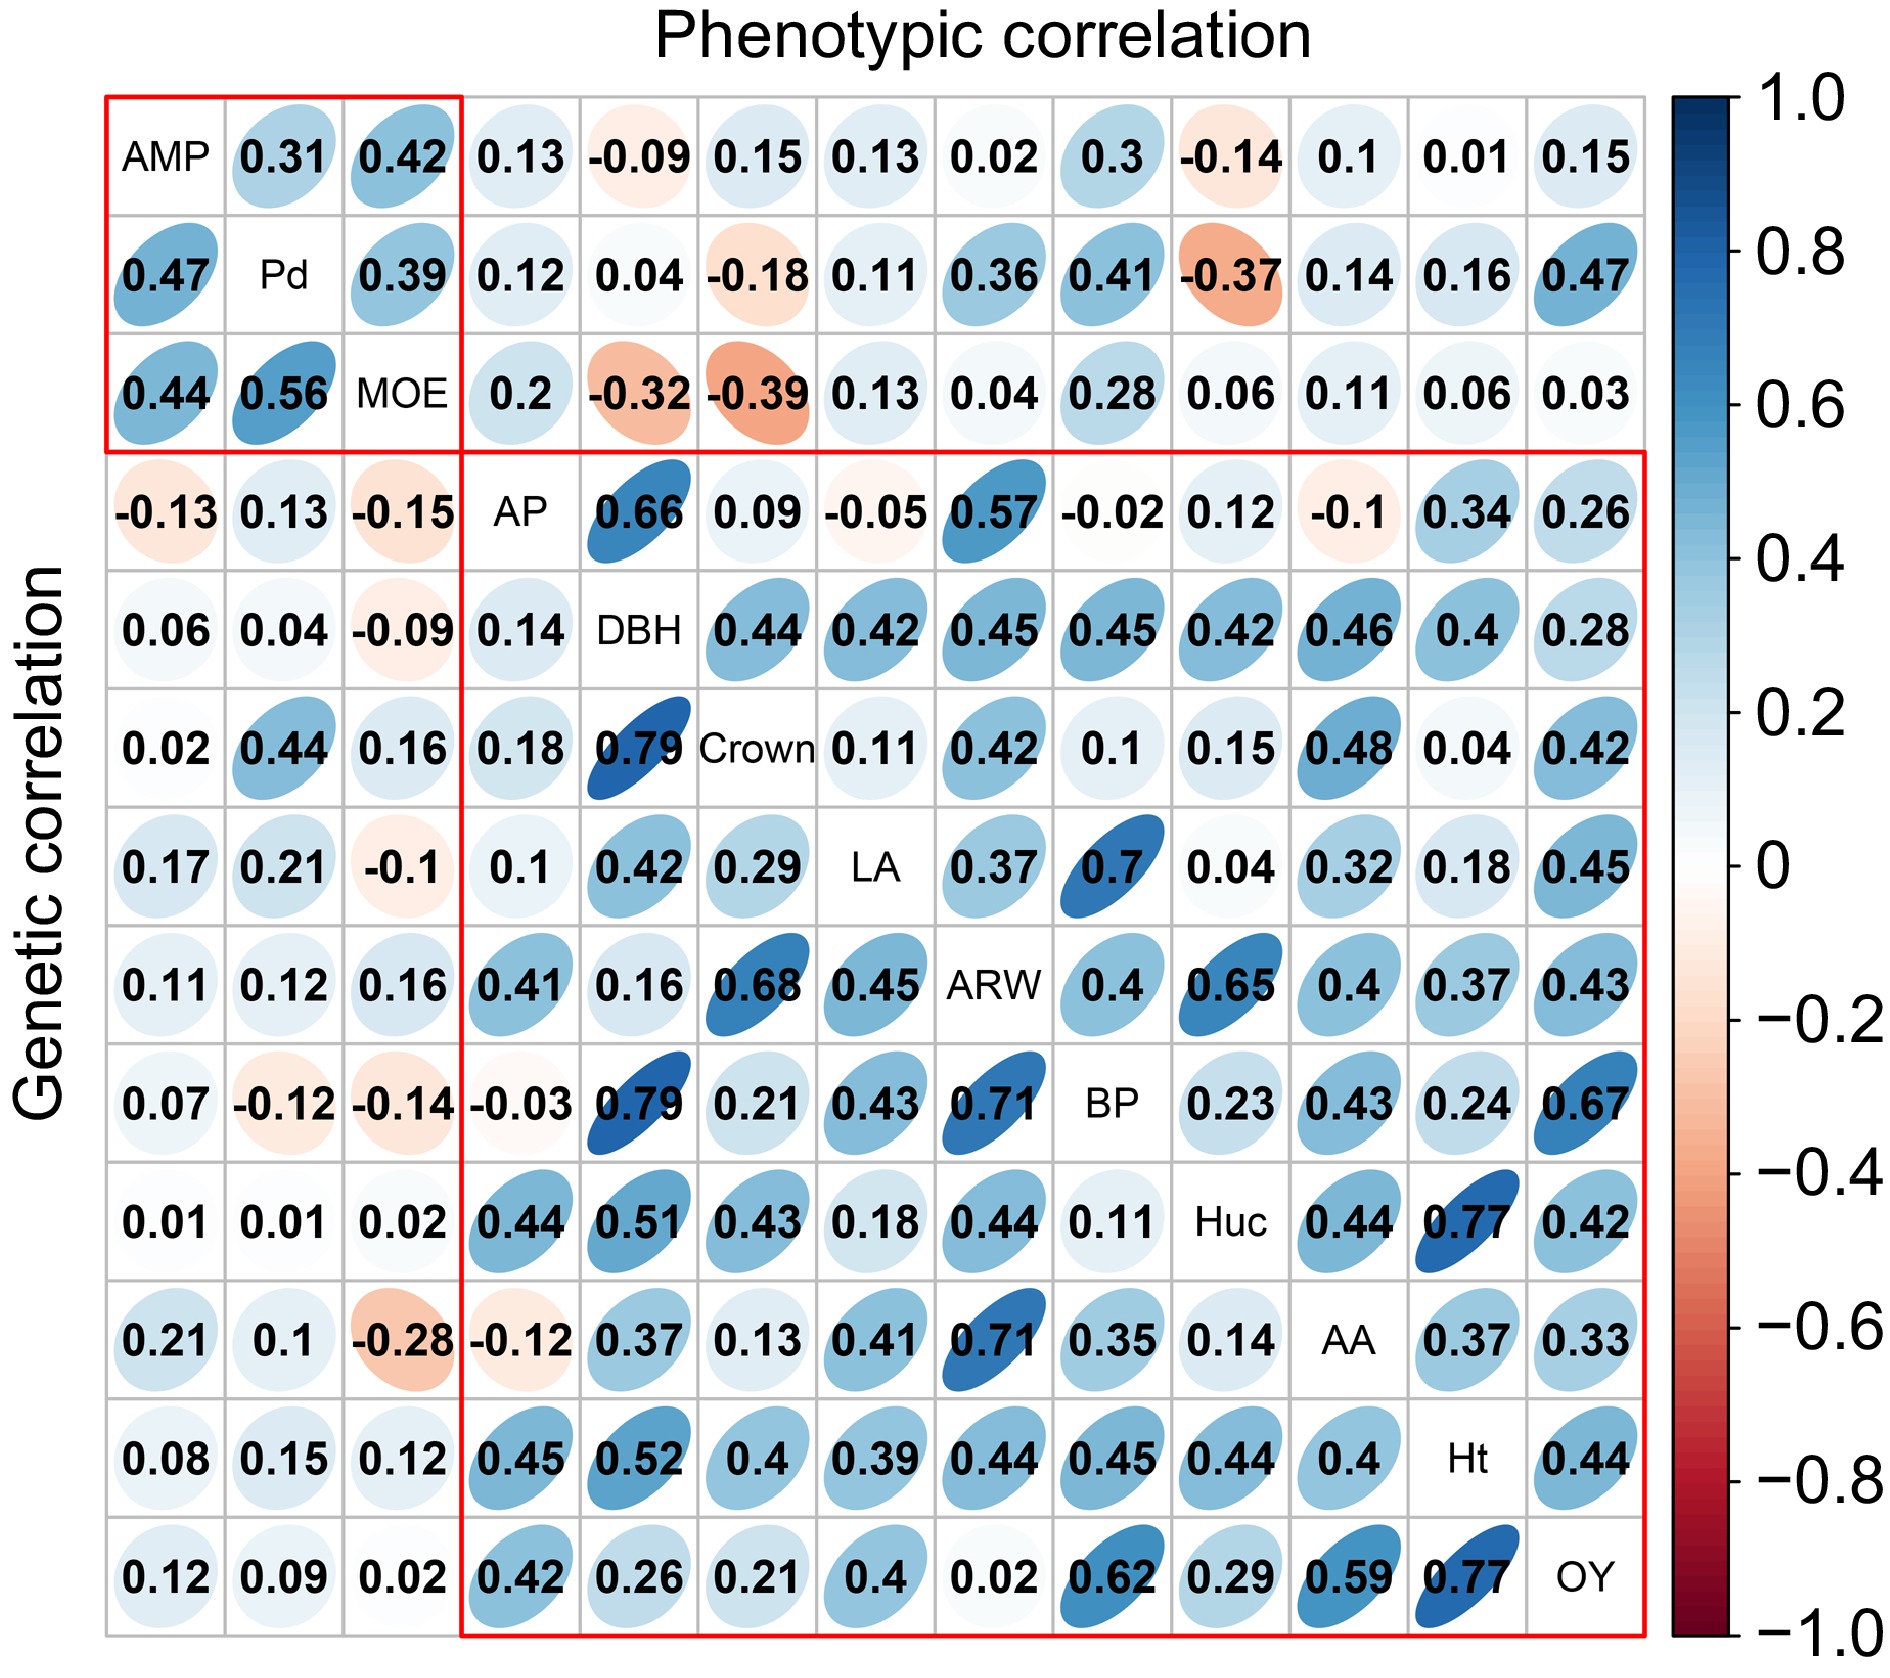
Figure 2.
The analysis of phenotypic and genetic correlation within and among various traits. The upper triangular matrix displays phenotypic correlation, while the lower triangular matrix represents the genetic correlation results. AP, BP, AA, and LA represent Alpha-pinene, Beta-pinene, Abietic acid, and Levopimaric acid, respectively.
-
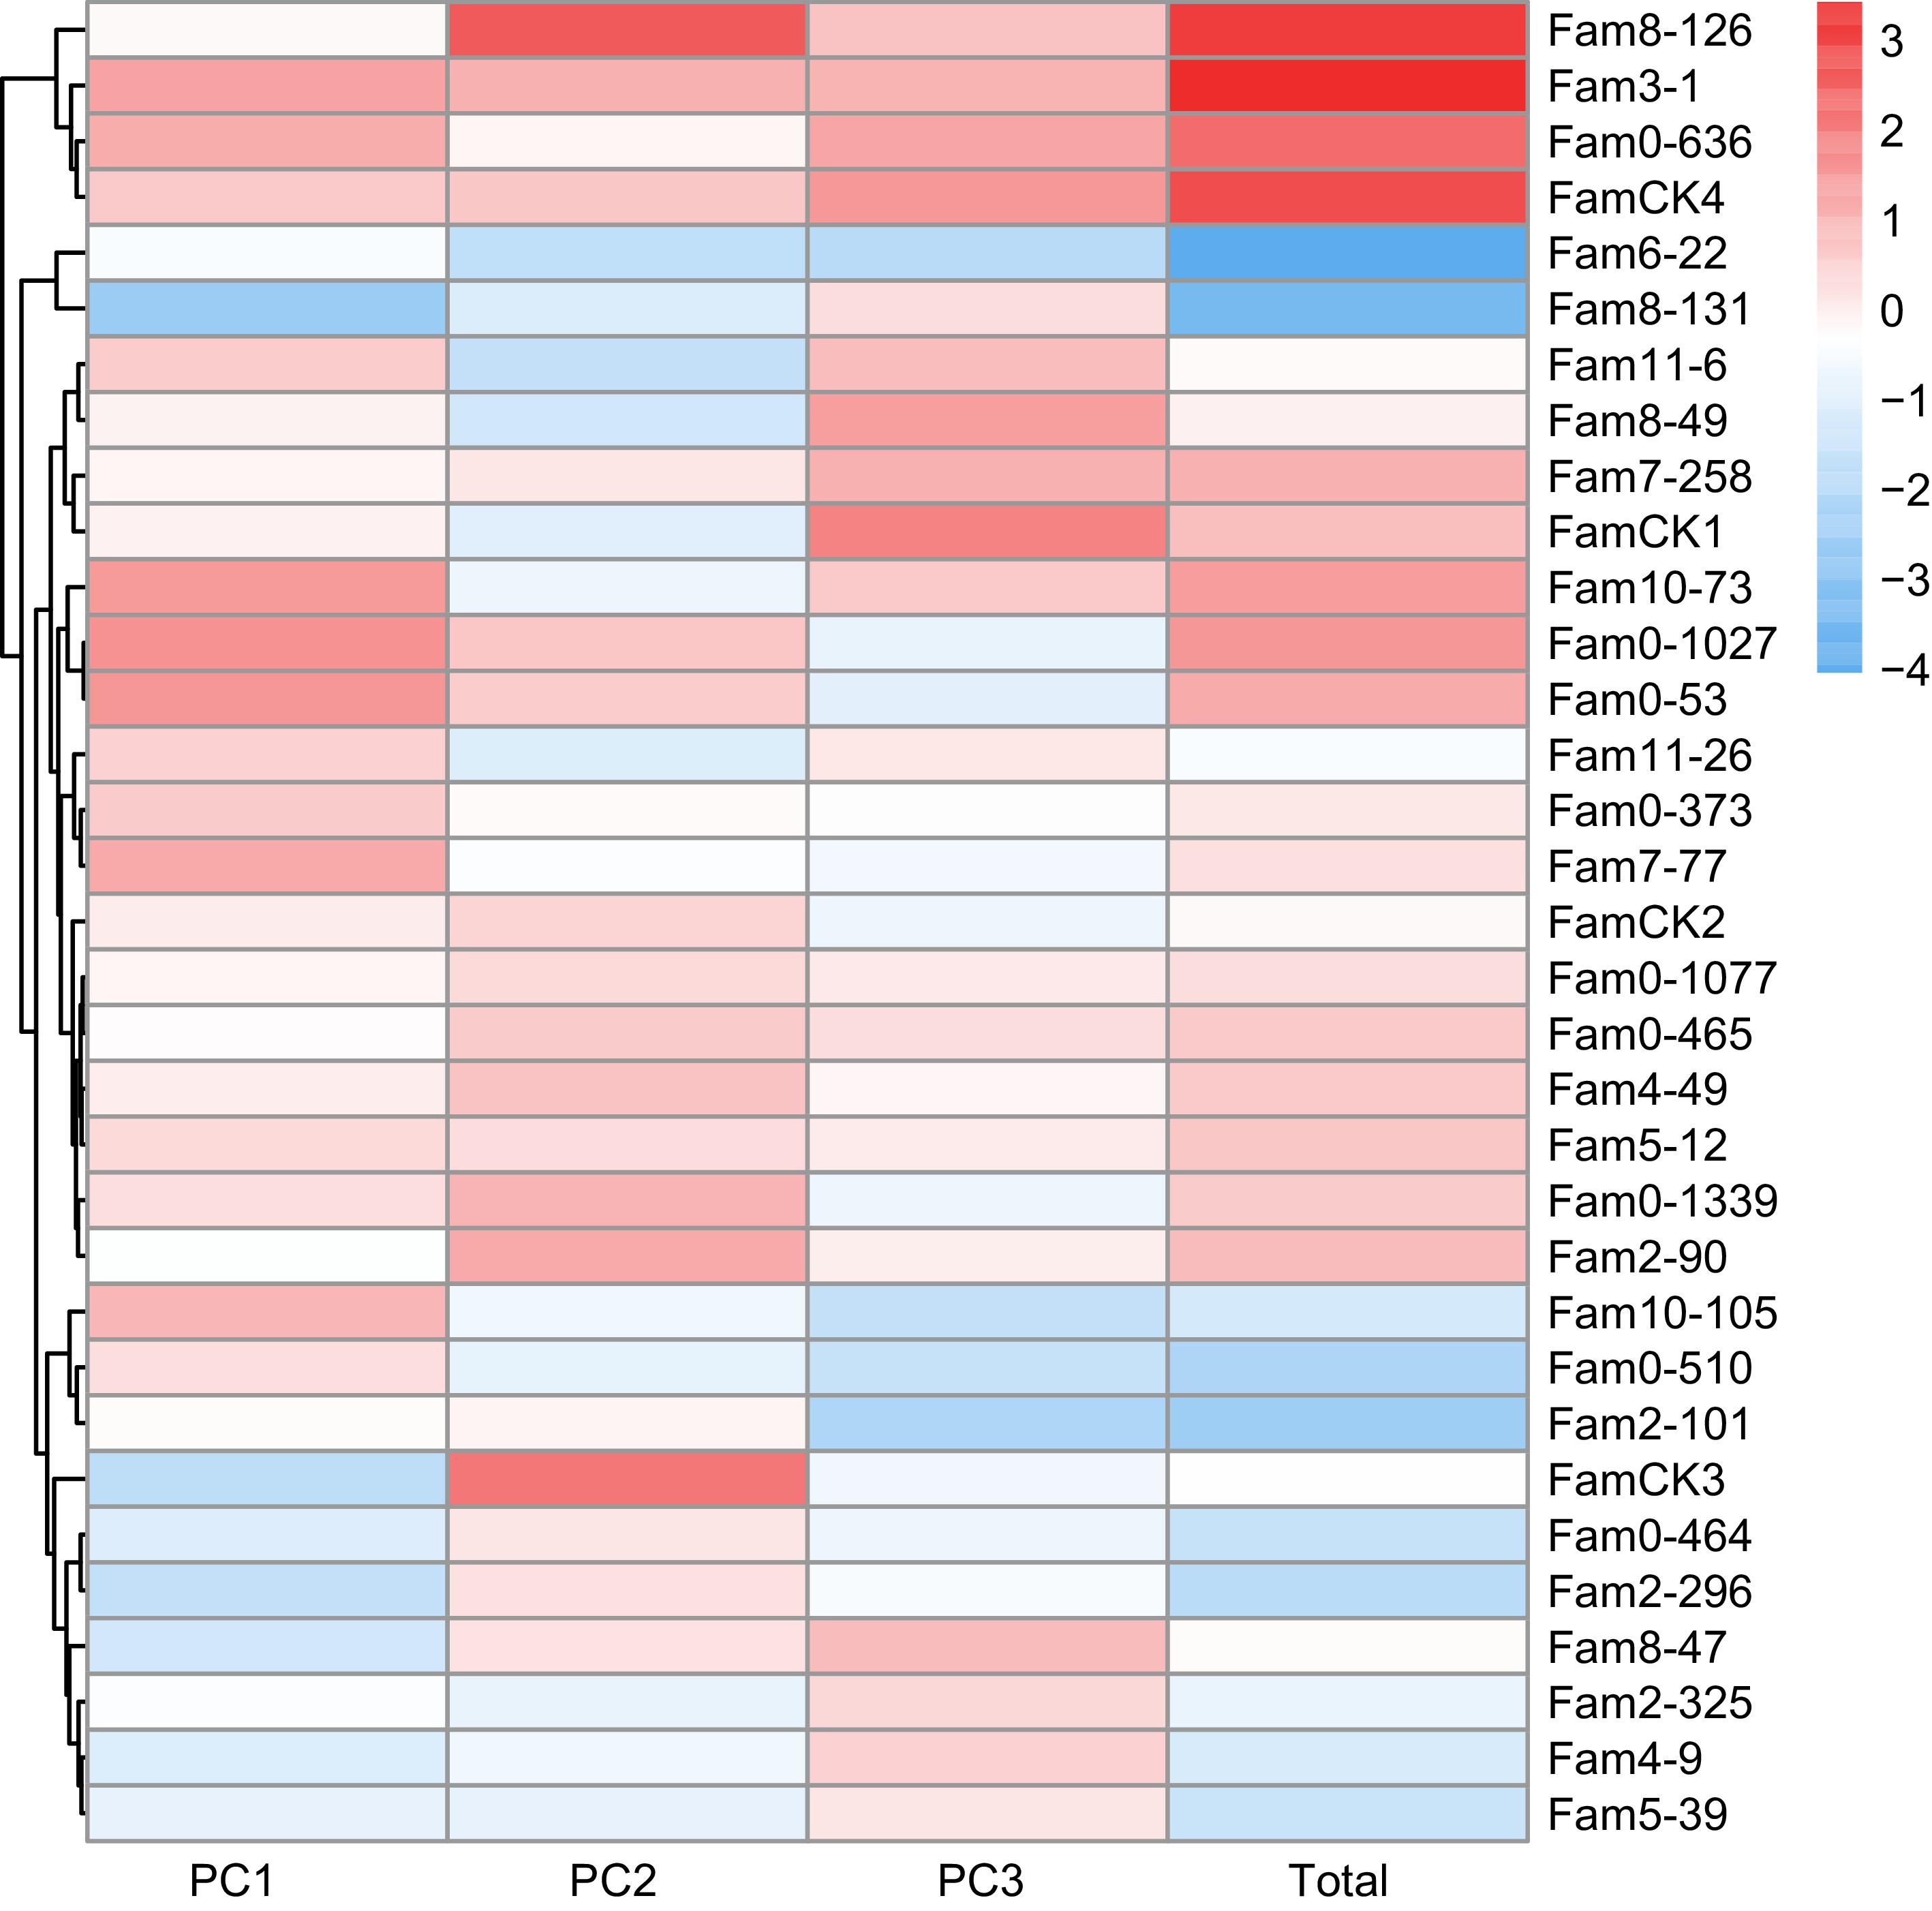
Figure 3.
PC factor scores of growth traits in P. elliottii 33 half-sib families. The color of the squares transitions from blue to red, indicating increasing PC scores.
-
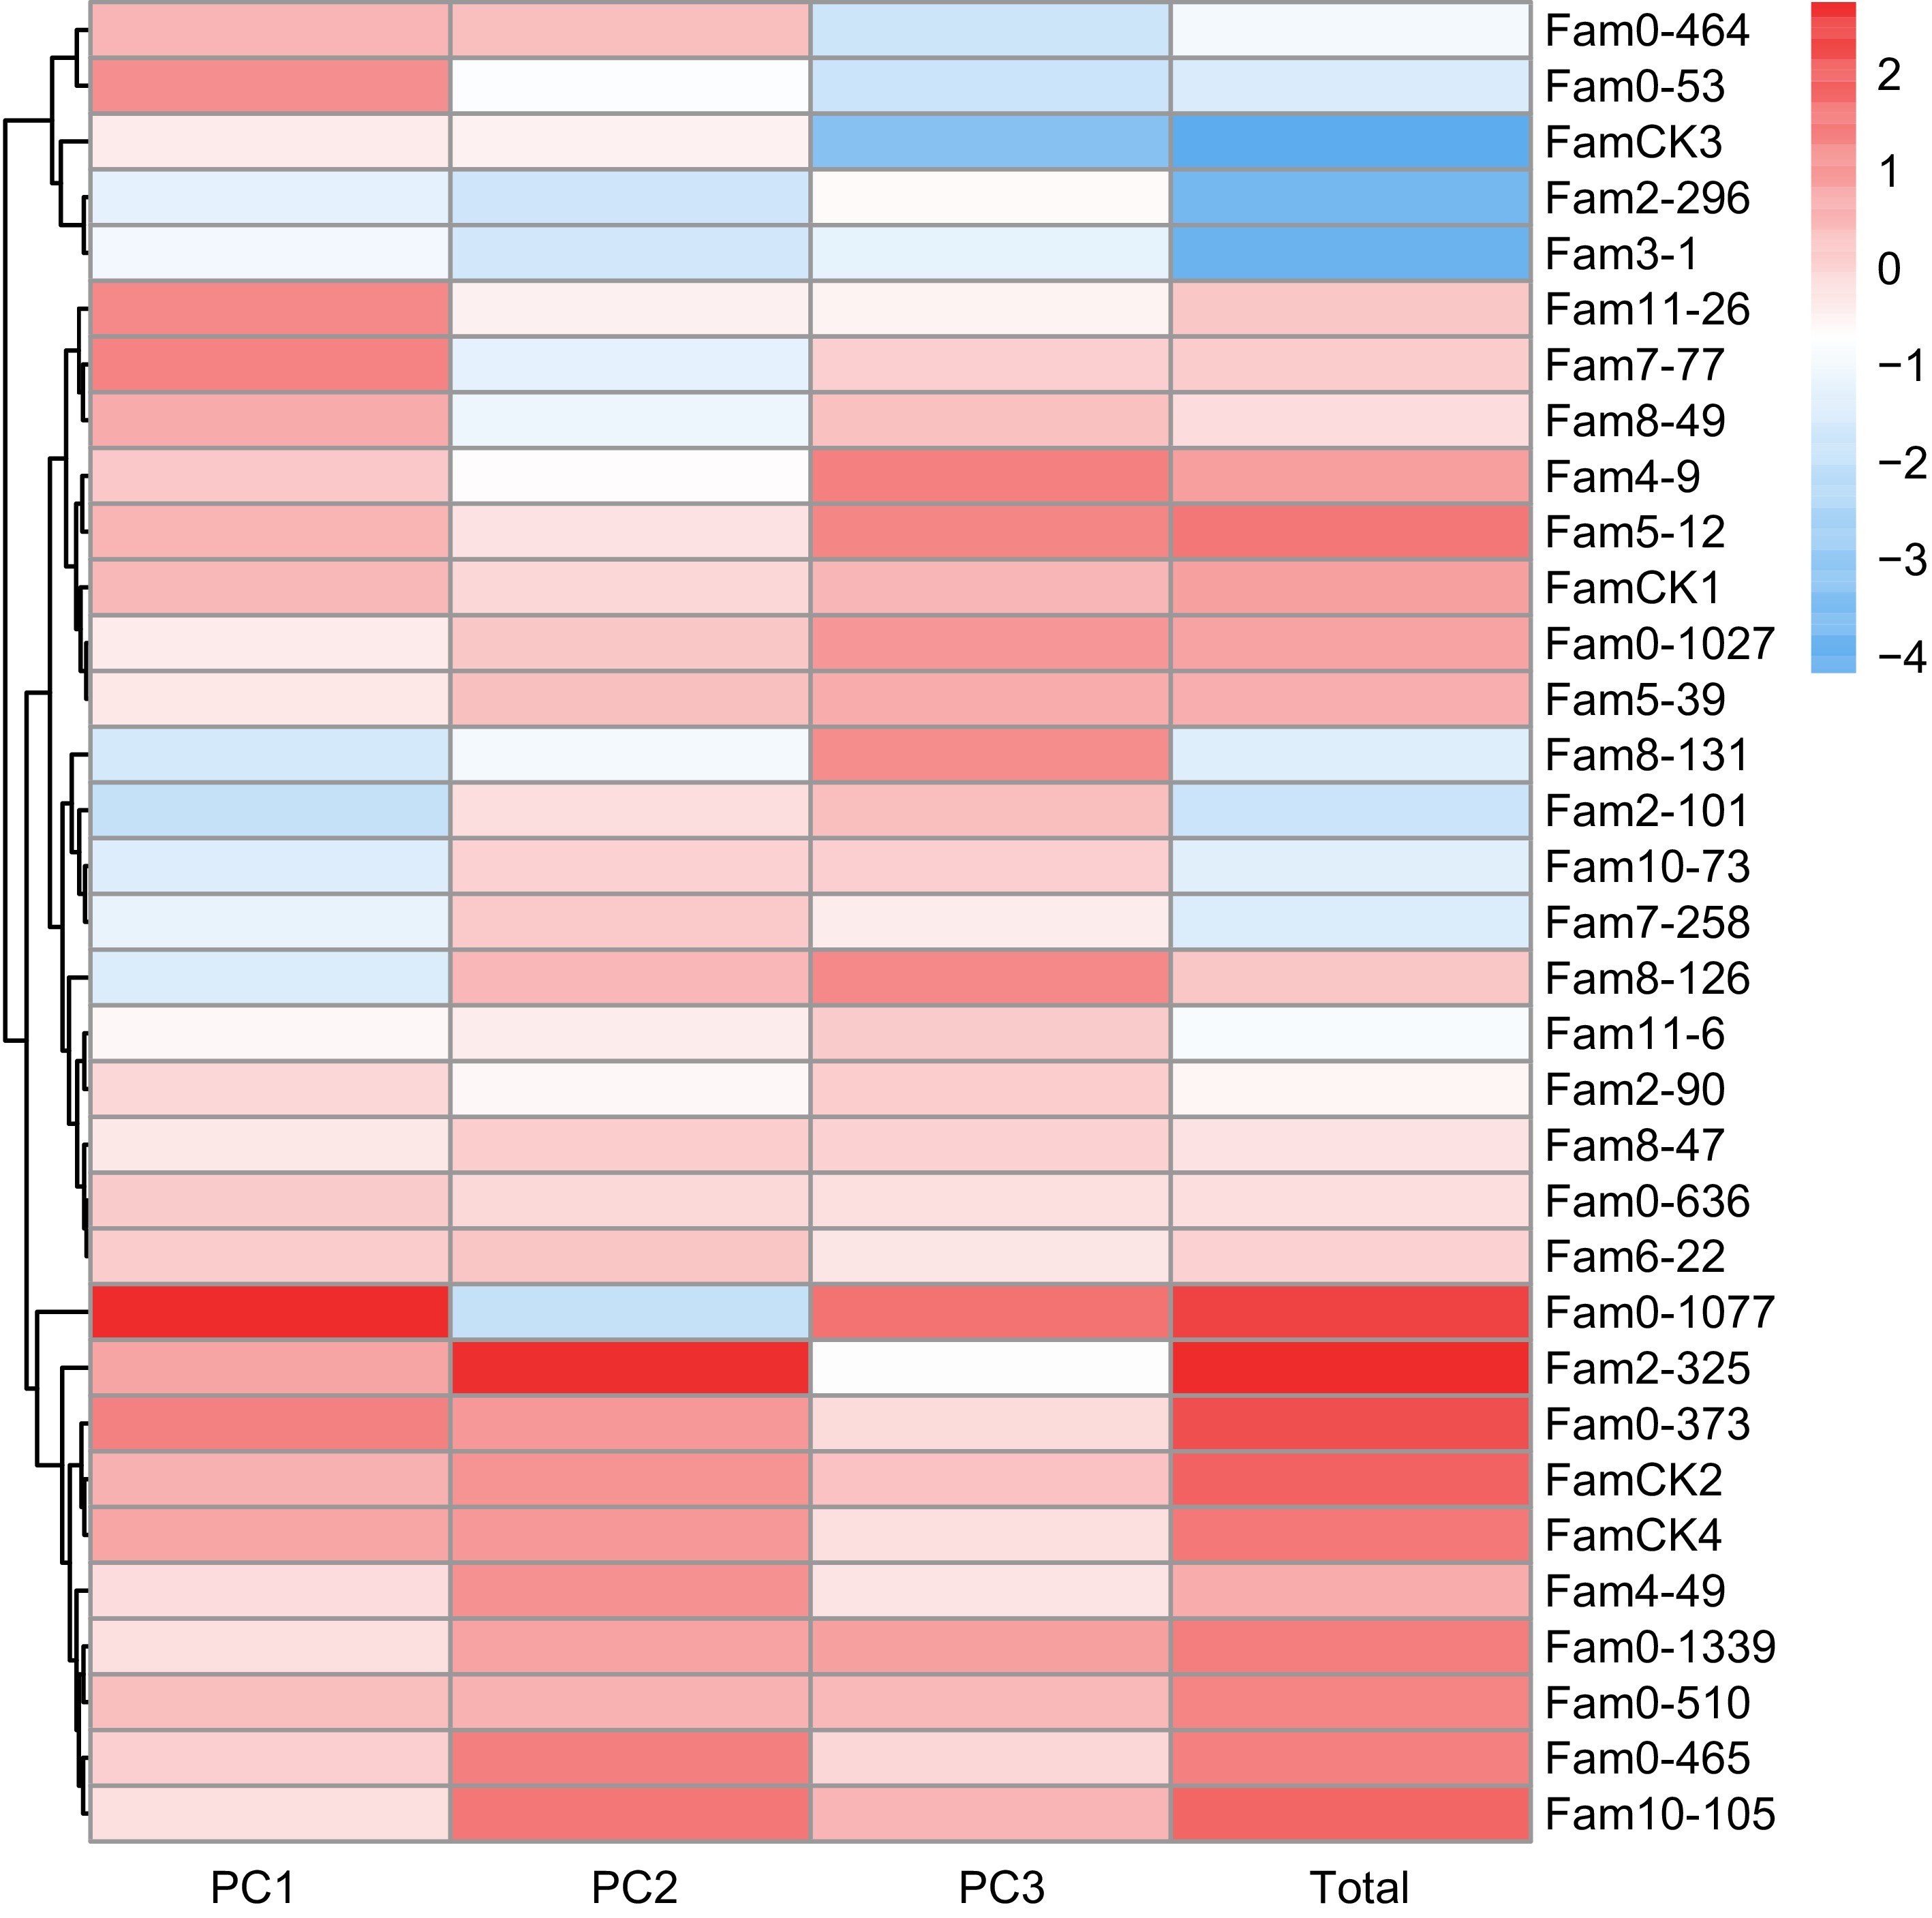
Figure 4.
PC factor scores of wood quality traits in P. elliottii 33 half-sib families. The color of the squares transitions from blue to red, indicating increasing PC scores.
-
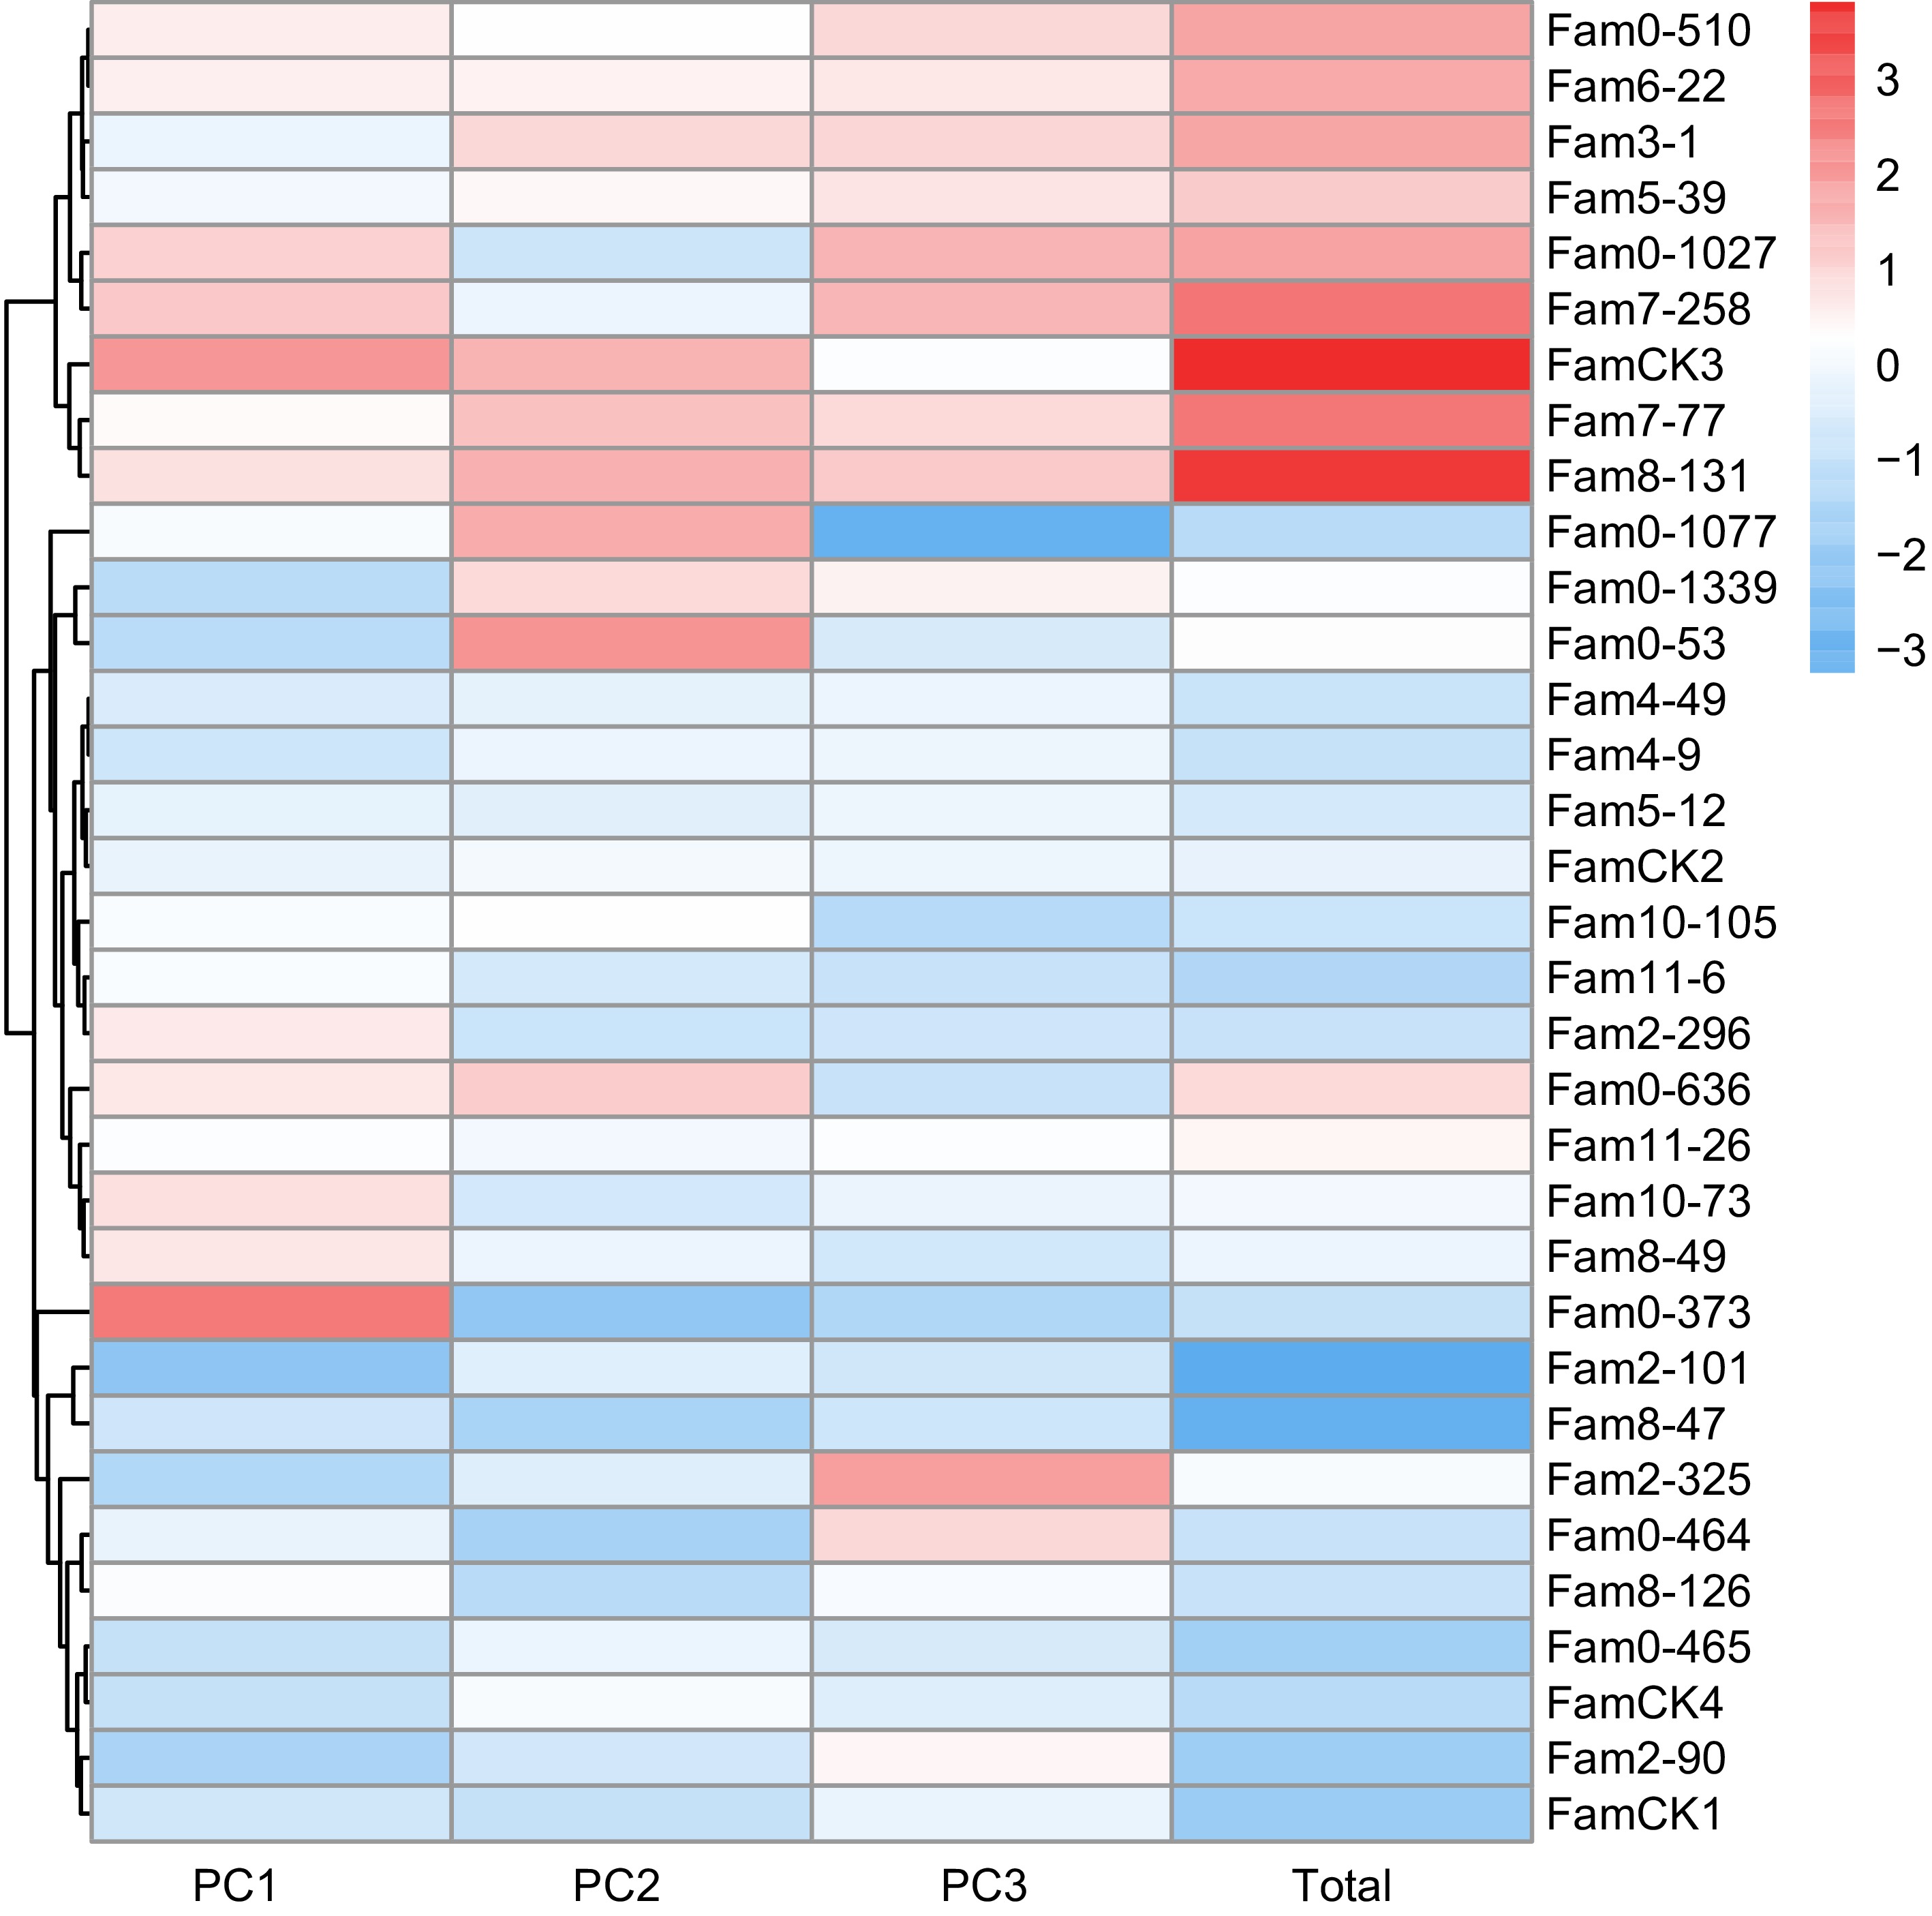
Figure 5.
PC factor scores of resin traits in P. elliottii 33 half-sib families. The color of the squares transitions from blue to red, indicating increasing PC scores.
-
Traits Mean SD CV/% F-statistic Family Block Block × family DBH (cm) 19.766 4.026 20.370 1.518* 0.616 0.894 Ht (m) 16.773 2.637 15.724 2.901** 7.738** 1.902* Huc (m) 9.439 2.334 24.730 1.393* 5.102** 0.875 Crown (m2) 3.469 0.934 26.931 1.529* 3.362* 1.463* ARW (mm) 4.254 0.818 19.228 1.477* 0.427 0.622 Pd (mm) 19.836 2.050 10.335 2.637** 4.351** 1.007 MOE (Gpa) 3.006 0.368 12.244 1.750* 3.842* 1.239 AMP (%) 0.415 0.122 29.488 2.731** 2.902** 1.446* OY (g) 1.838 0.710 38.622 1.618* 1.213* 0.972 Alpha_pinene (μg·g−1) 14.790 4.301 29.078 1.184* 0.649* 0.771* Beta_pinene (μg·g−1) 10.661 4.491 42.126 1.274* 1.241* 0.929* Abietic_acid (μg·g−1) 8.183 2.994 36.596 0.887* 1.221* 1.094 Levopimaric_acid (μg·g−1) 21.631 3.216 14.868 1.341* 2.703* 1.212 ** denotes the significance level of p < 0.01, while * indicates p < 0.05. Table 1.
Results of descriptive statistics and variance analysis.
-
Traits $ {I}_{p} $ $ {I}_{g} $ $ {h}_{i}^{2} $ $ {H}_{i}^{2} $ $ \Delta G $ r = 0.05
i = 2.06r = 0.10
i = 1.75r = 0.20
i = 1.40DBH 0.205 0.041 0.172 (0.017) 0.593 (0.296) 0.107 0.091 0.073 Ht 0.155 0.092 0.355 (0.021) 0.794 (0.151) 0.114 0.097 0.077 Huc 0.240 0.091 0.145 (0.017) 0.543 (0.033) 0.052 0.045 0.036 Crown 0.268 0.115 0.183 (0.017) 0.610 (0.284) 0.026 0.022 0.017 ARW 0.194 0.113 0.338 (0.024) 0.781 (0.181) 0.035 0.030 0.024 Pd 0.099 0.072 0.524 (0.024) 0.885 (0.100) 0.111 0.094 0.075 MOE 0.121 0.063 0.273 (0.019) 0.870 (0.219) 0.015 0.012 0.010 AMP 0.297 0.170 0.281 (0.020) 0.874 (0.214) 0.005 0.005 0.004 OY 0.379 0.150 0.157 (0.023) 0.566 (0.042) 0.017 0.015 0.012 Alpha_pinene 0.290 0.143 0.244 (0.020) 0.694 (0.234) 0.146 0.124 0.099 Beta_pinene 0.421 0.202 0.245 (0.020) 0.695 (0.251) 0.148 0.126 0.101 Abietic_acid 0.366 0.061 0.173 (0.013) 0.285 (0.049) 0.022 0.019 0.015 Levopimaric_acid 0.147 0.061 0.172 (0.010) 0.592 (0.031) 0.084 0.071 0.057 r represents the selection rate, and i represents the selection intensity. Table 2.
Genetic parameter estimation results for various traits.
-
Summary Traits PCs PC1 PC2 PC3 Feature vector DBH −0.457 0.654 0.000 Ht 0.740 0.322 −0.300 Huc 0.425 0.695 0.177 Crown −0.769 0.246 0.249 ARW 0.400 −0.116 0.872 Eigenvalue 1.689 1.088 0.944 Contribution rate (%) 0.664 0.173 0.077 Cummulative contribution rate (%) 0.664 0.837 0.915 Table 3.
PCA of growth traits of P. elliottii half-sib families.
-
Summary Traits PCs PC1 PC2 PC3 Feature vector Pd 0.750 0.000 0.659 MOE 0.673 0.464 −0.576 AMP −0.409 0.875 0.260 Eigenvalue 1.182 0.984 0.833 Contribution rate (%) 0.394 0.328 0.278 Cummulative contribution rate (%) 0.394 0.722 1.000 Table 4.
PCA of wood properties of P. elliottii half-sib families.
-
Summary Traits PCs PC1 PC2 PC3 Feature vector OY −0.334 0.717 0.494 Alpha_pinene 0.934 0.330 0.000 Beta_pinene 0.933 0.331 0.000 Abietic_acid −0.660 0.572 0.000 Levopimaric_acid 0.000 −0.481 0.856 Eigenvalue 2.290 1.291 0.993 Contribution rate (%) 0.458 0.258 0.199 Cummulative contribution (%) 0.458 0.716 0.915 Table 5.
PCA of resin traits of P. elliottii half-sib families.
Figures
(5)
Tables
(5)