-
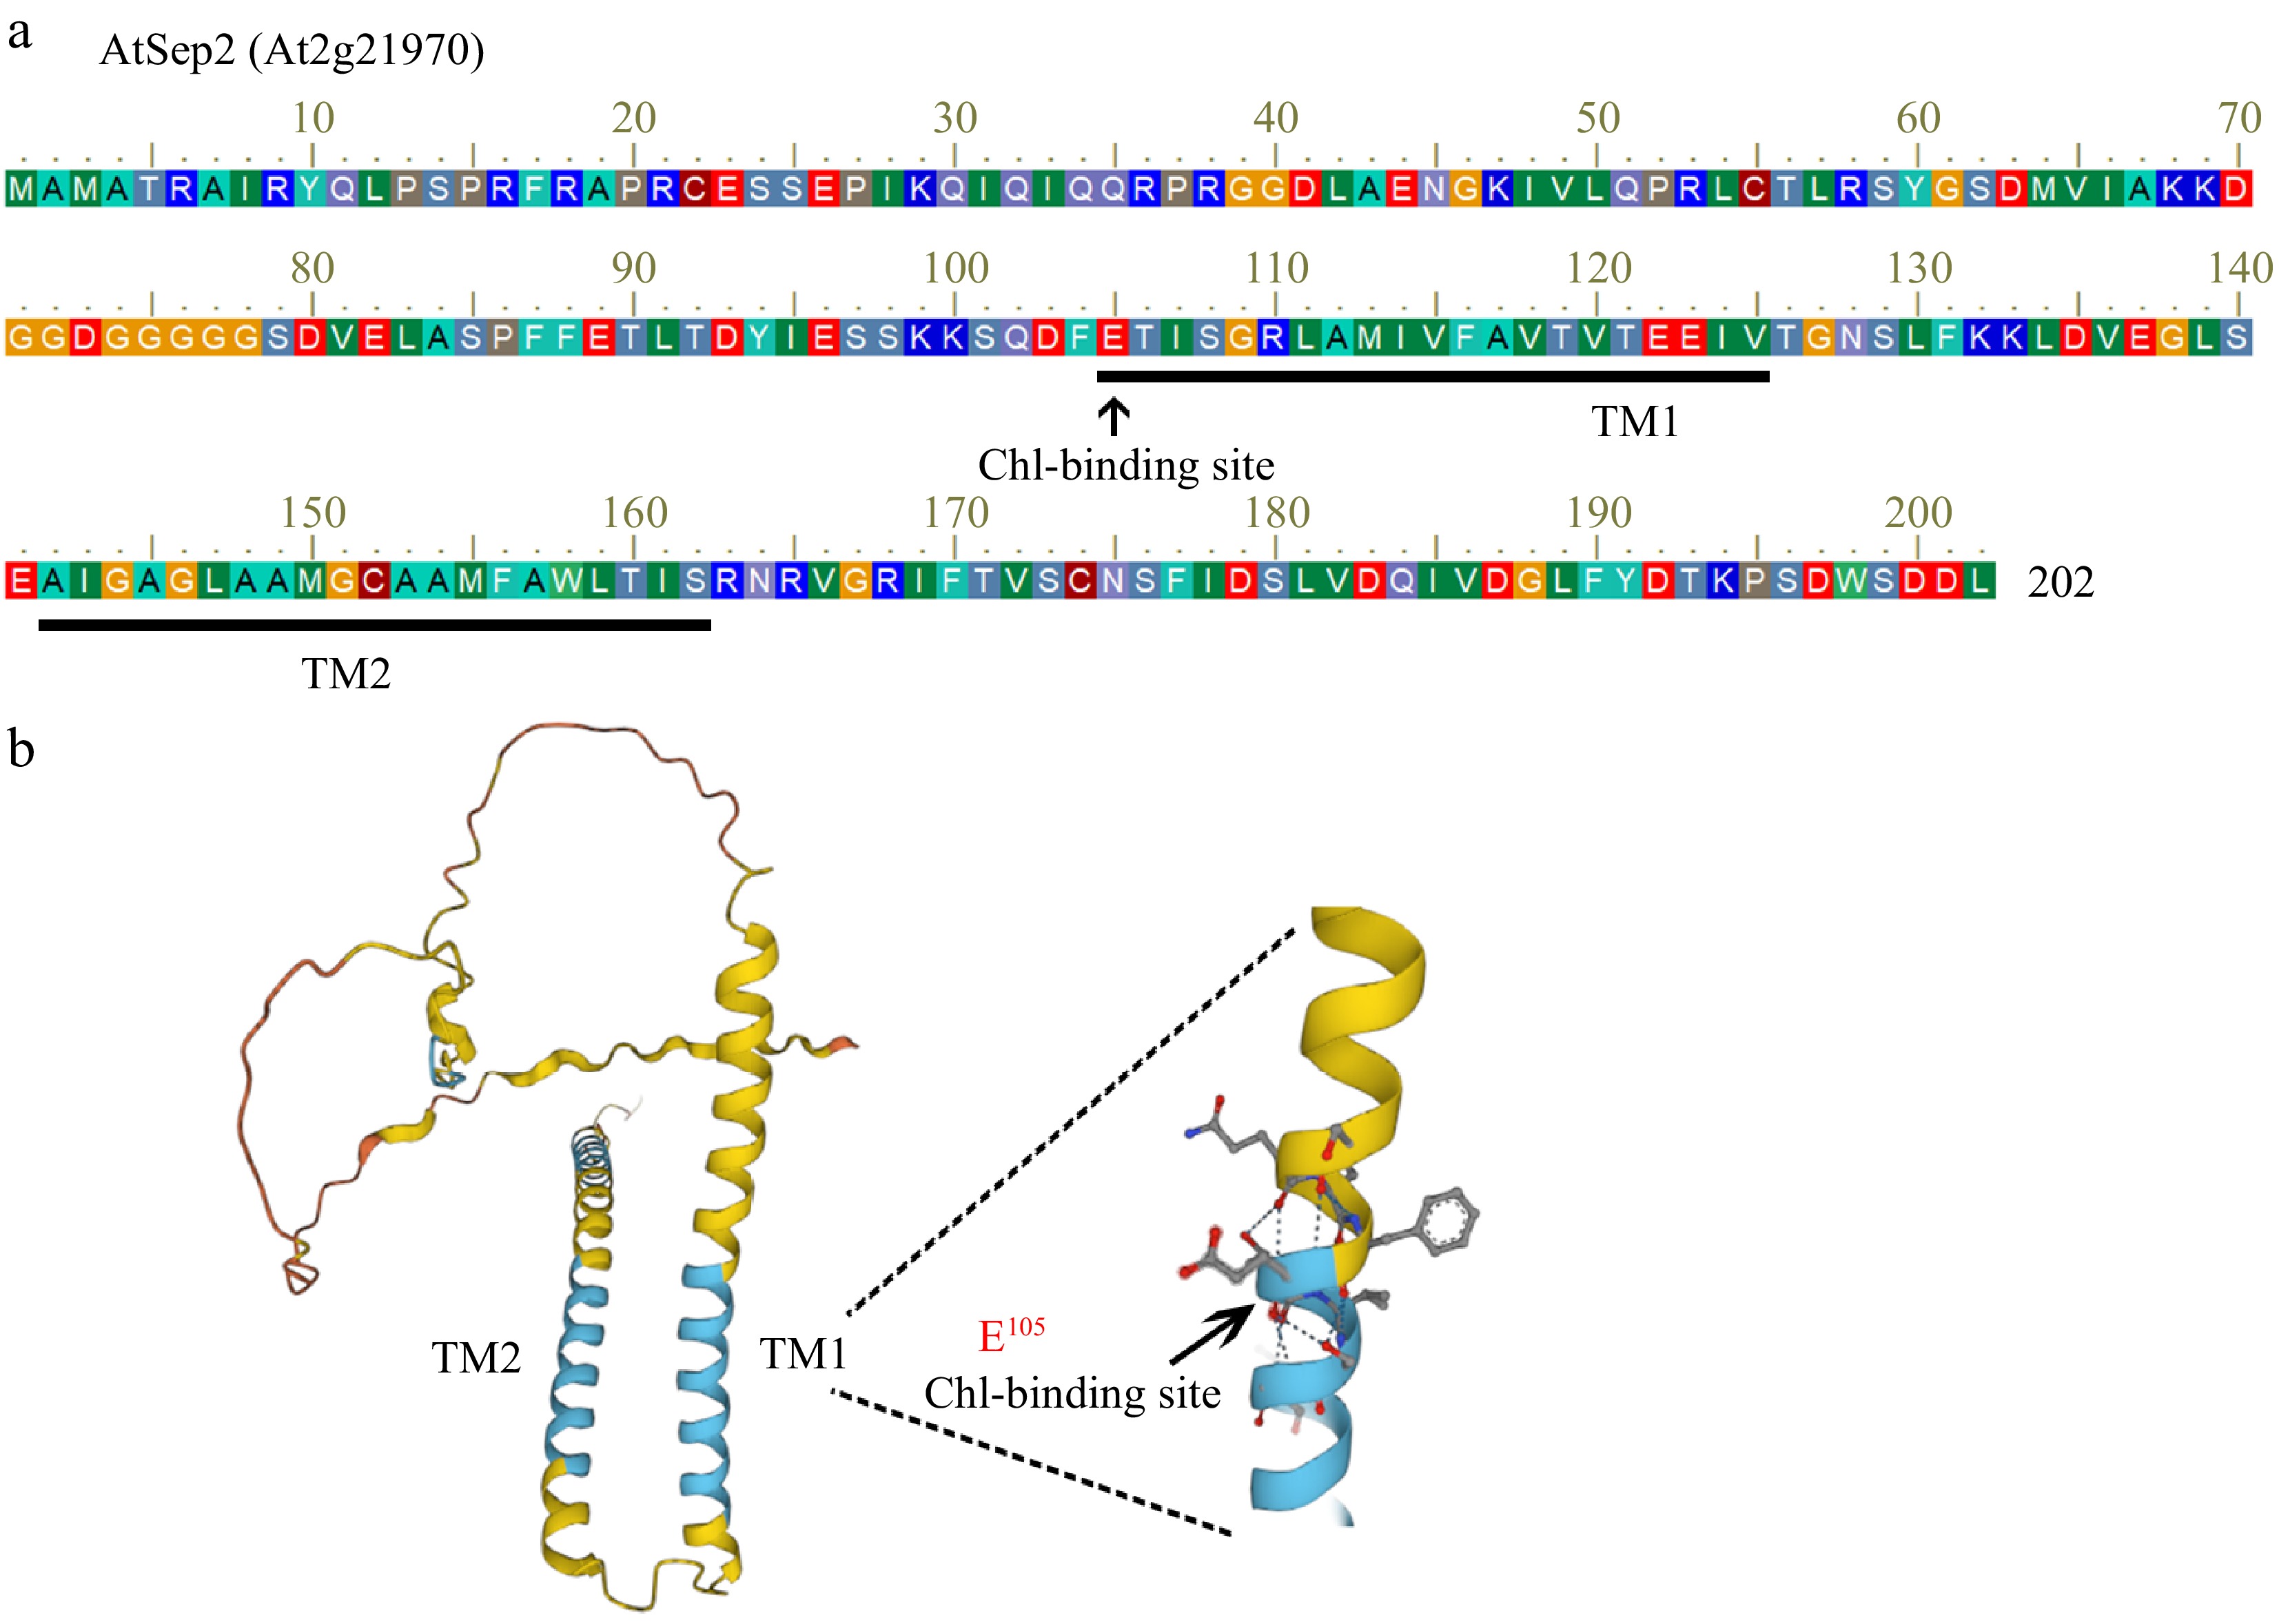
Figure 1.
Sequence analysis of AtSep2. (a) Amino acid sequence of AtSep2. (b) Predictive model of the AtSep2 protein structure. (c) Arrowheads indicate the conserved Chl-binding site E105 amino in the first transmembrane structure (TM).
-
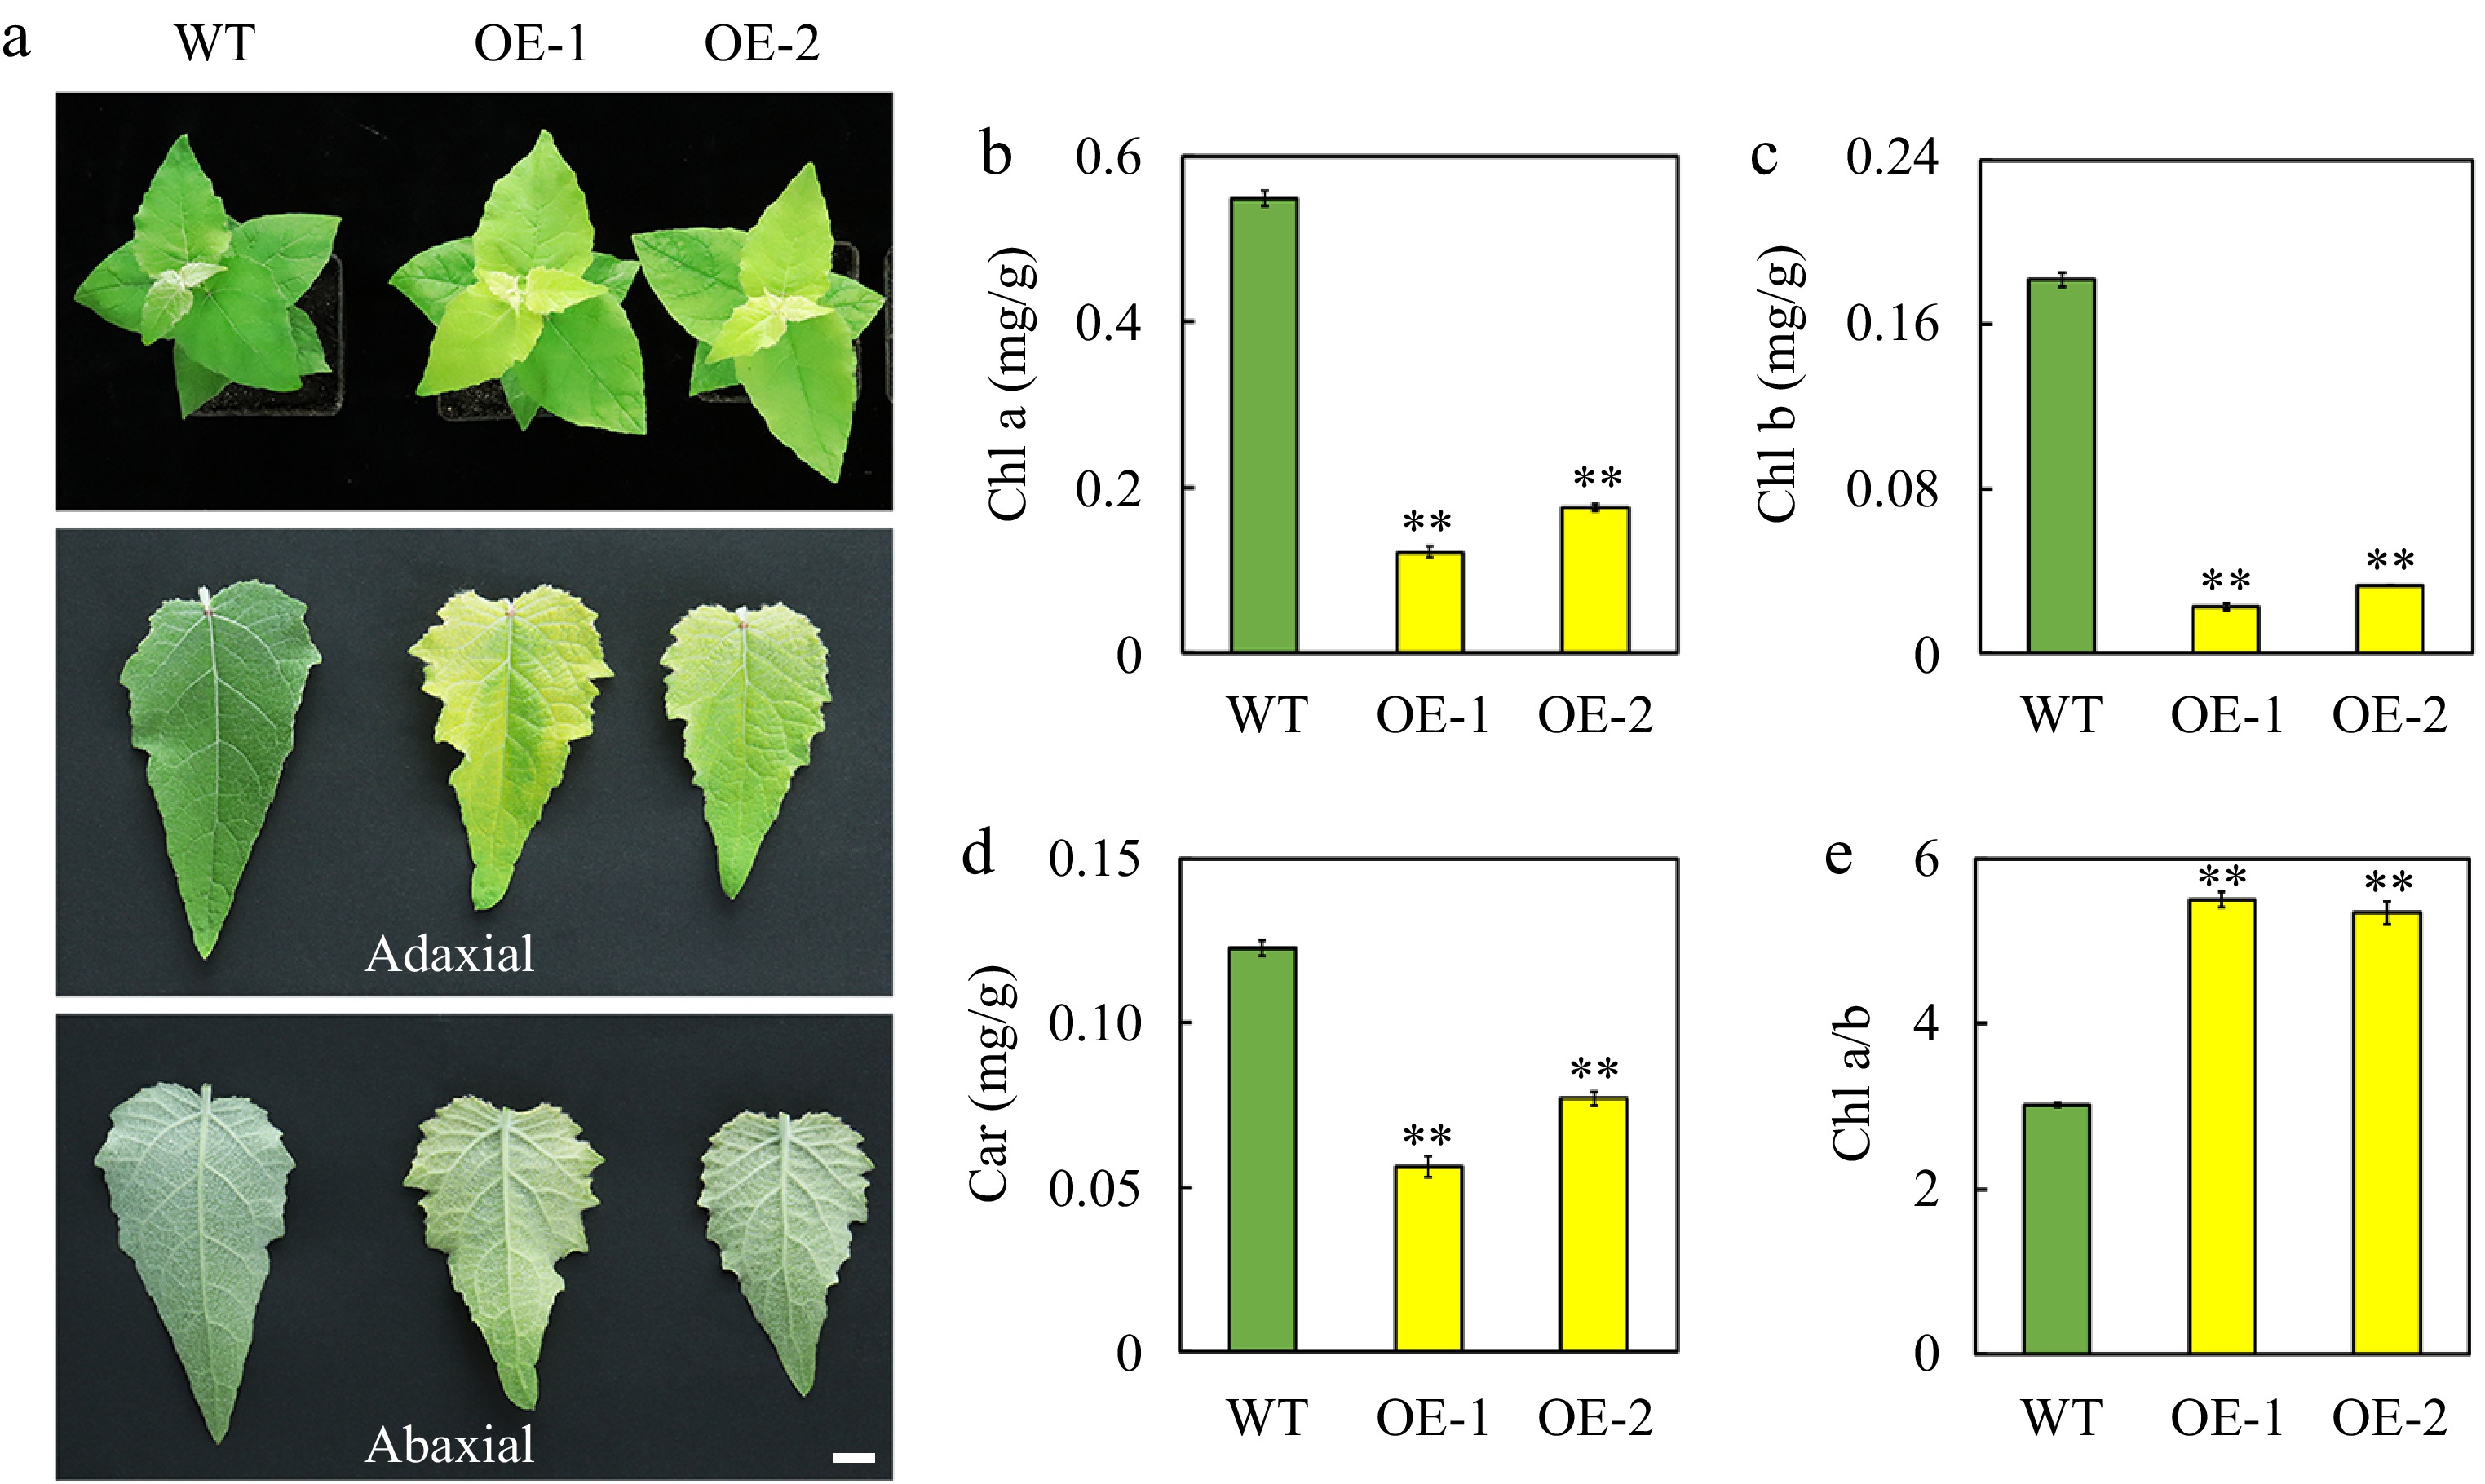
Figure 2.
Phenotype and pigment content of leaves of the wild-type (WT) and transgenic poplar seedlings overexpressing (OE) AtSep2. (a) Comparison of leaf (adaxial and abaxial) color of the WT and transgenic poplar seedlings. The content of (b) chlorophyll (Chl) a, (c) Chl b and (d) carotenoid (car) and the ratio of (e) Chl a and b in the leaves of WT and transgenic poplar seedlings. Asterisks indicate significant differences between WT and transgenic plants (** p < 0.01; Student's t-test). Error bars represent SE (n = 3). Scale bars = 1 cm.
-
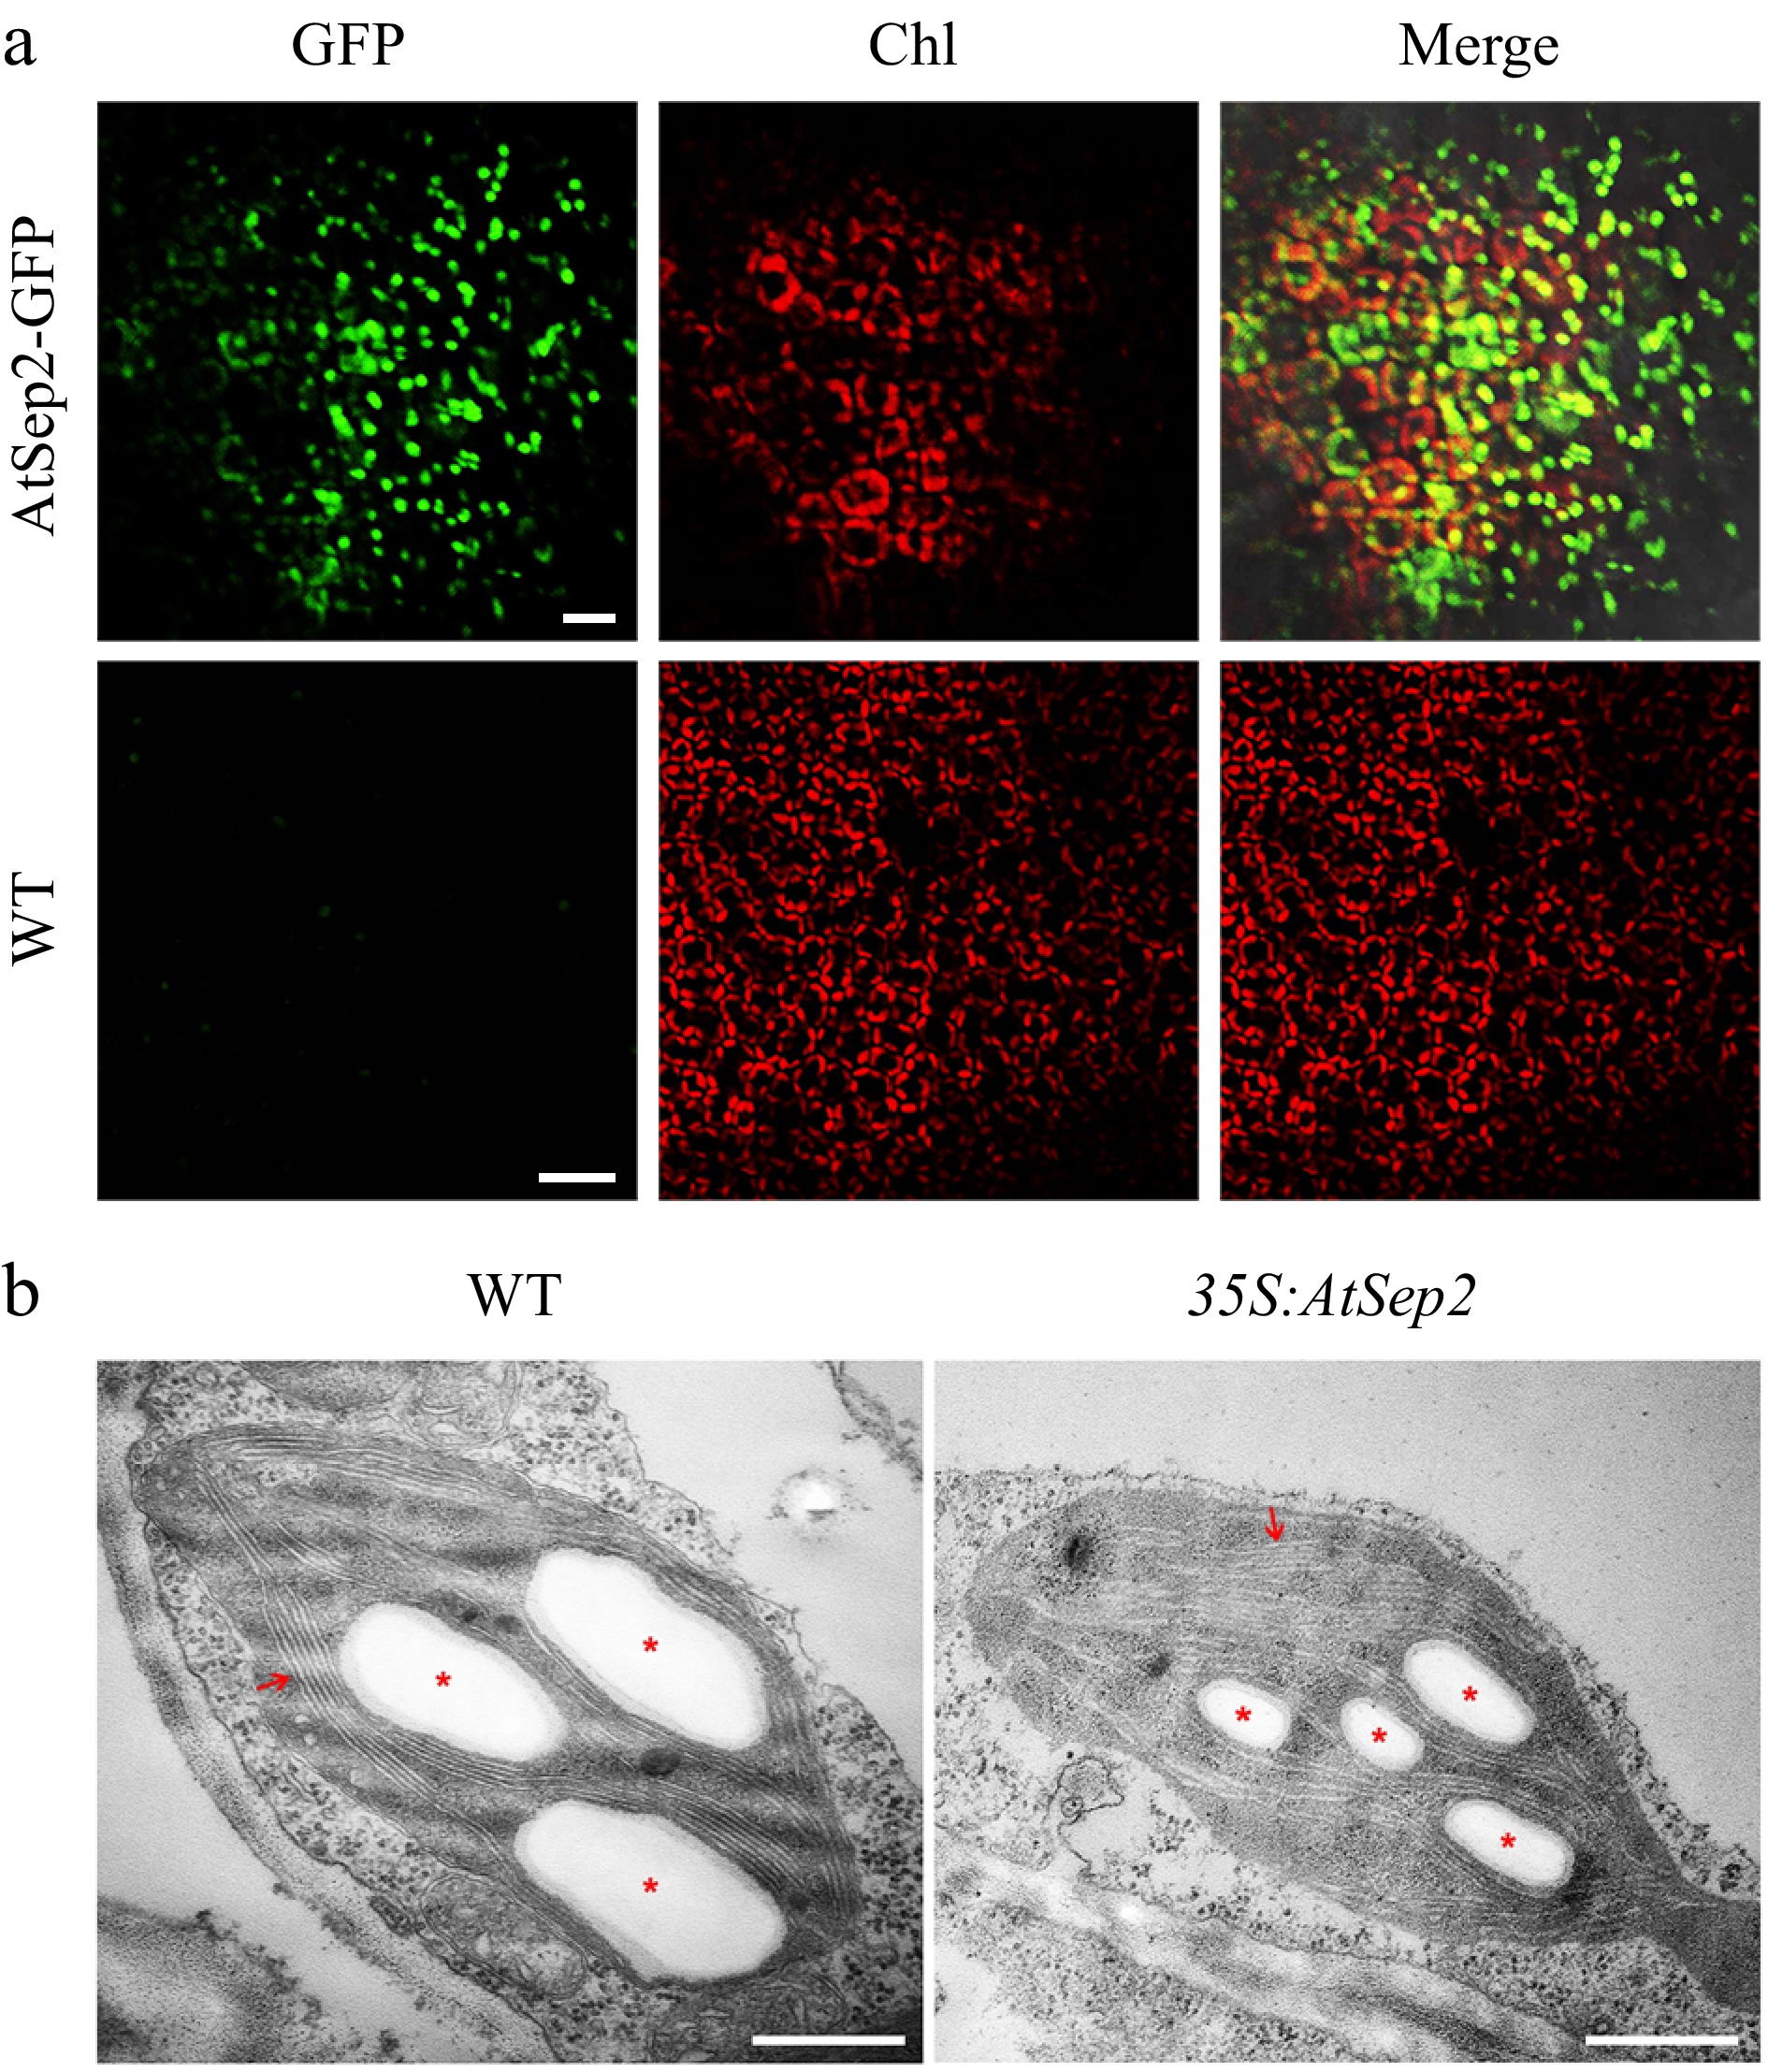
Figure 3.
Subcellular localization of AtSep2 and its effect on chloroplast ultrastructure in poplar. (a) Confocal images of leaves of wild-type (WT) and transgenic poplar stably expressing AtSep2-GFP. GFP fluorescence is green and Chl autofluorescence is red. Yellow signal is obtained by merging the GFP and Chl autofluorescence images. (b) Transmission electron microscopy (TEM) images of chloroplasts of wild-type (WT) and transgenic poplar overexpressing AtSep2. Red arrows indicate granum-thylakoid membranes, and asterisks indicate starch granules. Scale bars = (a) 20 μm, (b) 500 nm.
-
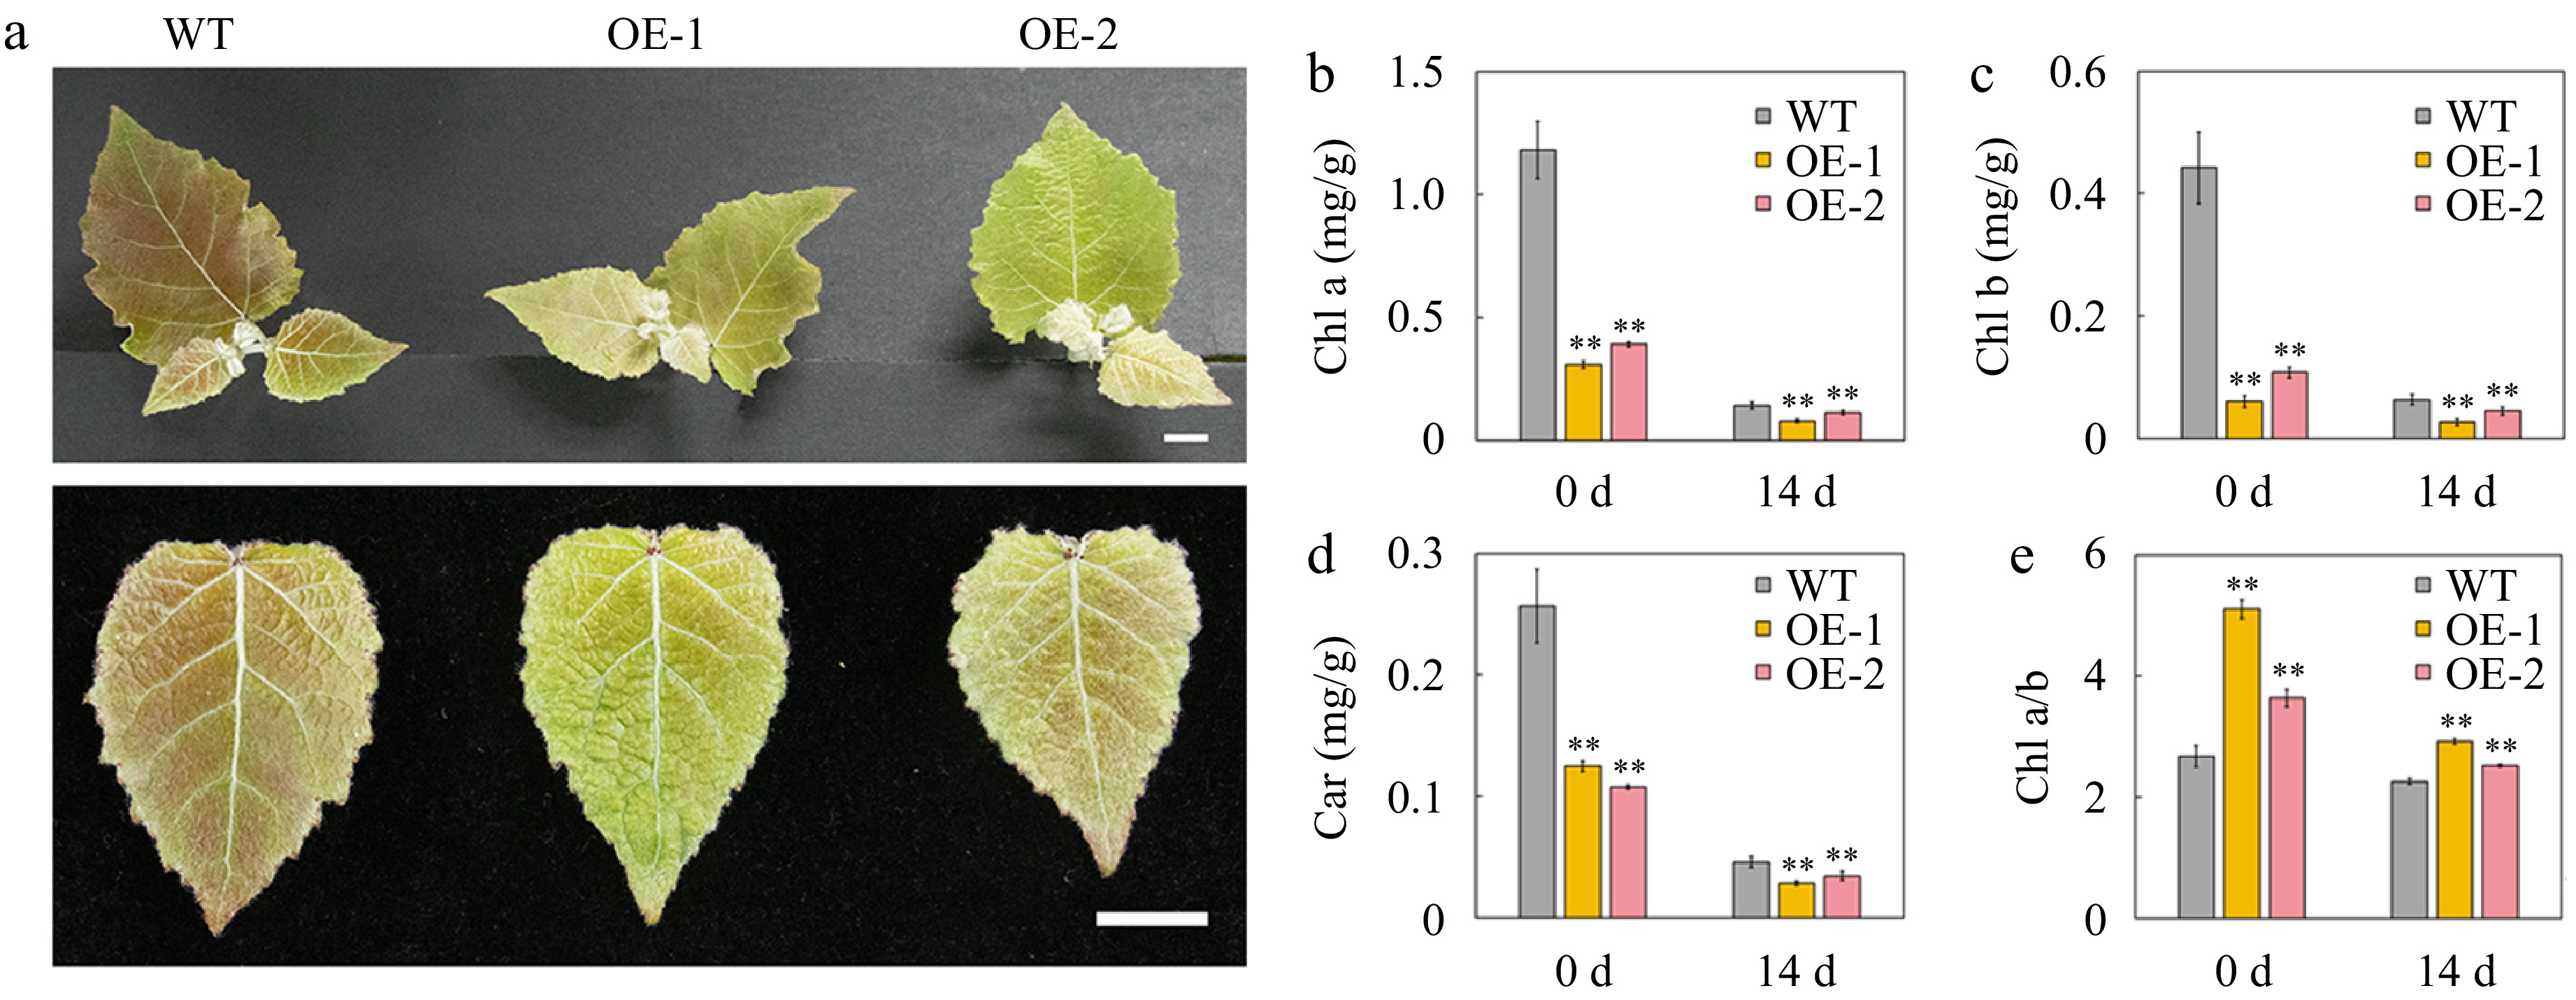
Figure 4.
Phenotype and pigment content of the leaves of wild-type (WT) and transgenic poplar overexpressing (OE) AtSep2 under high light stress. (a) Plant and leaf phenotypes of WT and transgenic poplar under high light stress for 14 d. The content of (b) chlorophyll (Chl) a, (c) Chl b and (d) carotenoid (car) and the ratio of (e) Chl a and b in the leaves of WT and transgenic poplar. Asterisks indicate significant differences between WT and transgenic plants (** p < 0.01; Student's t-test). Error bars represent SE (n = 3). Scale bars = 1 cm.
-
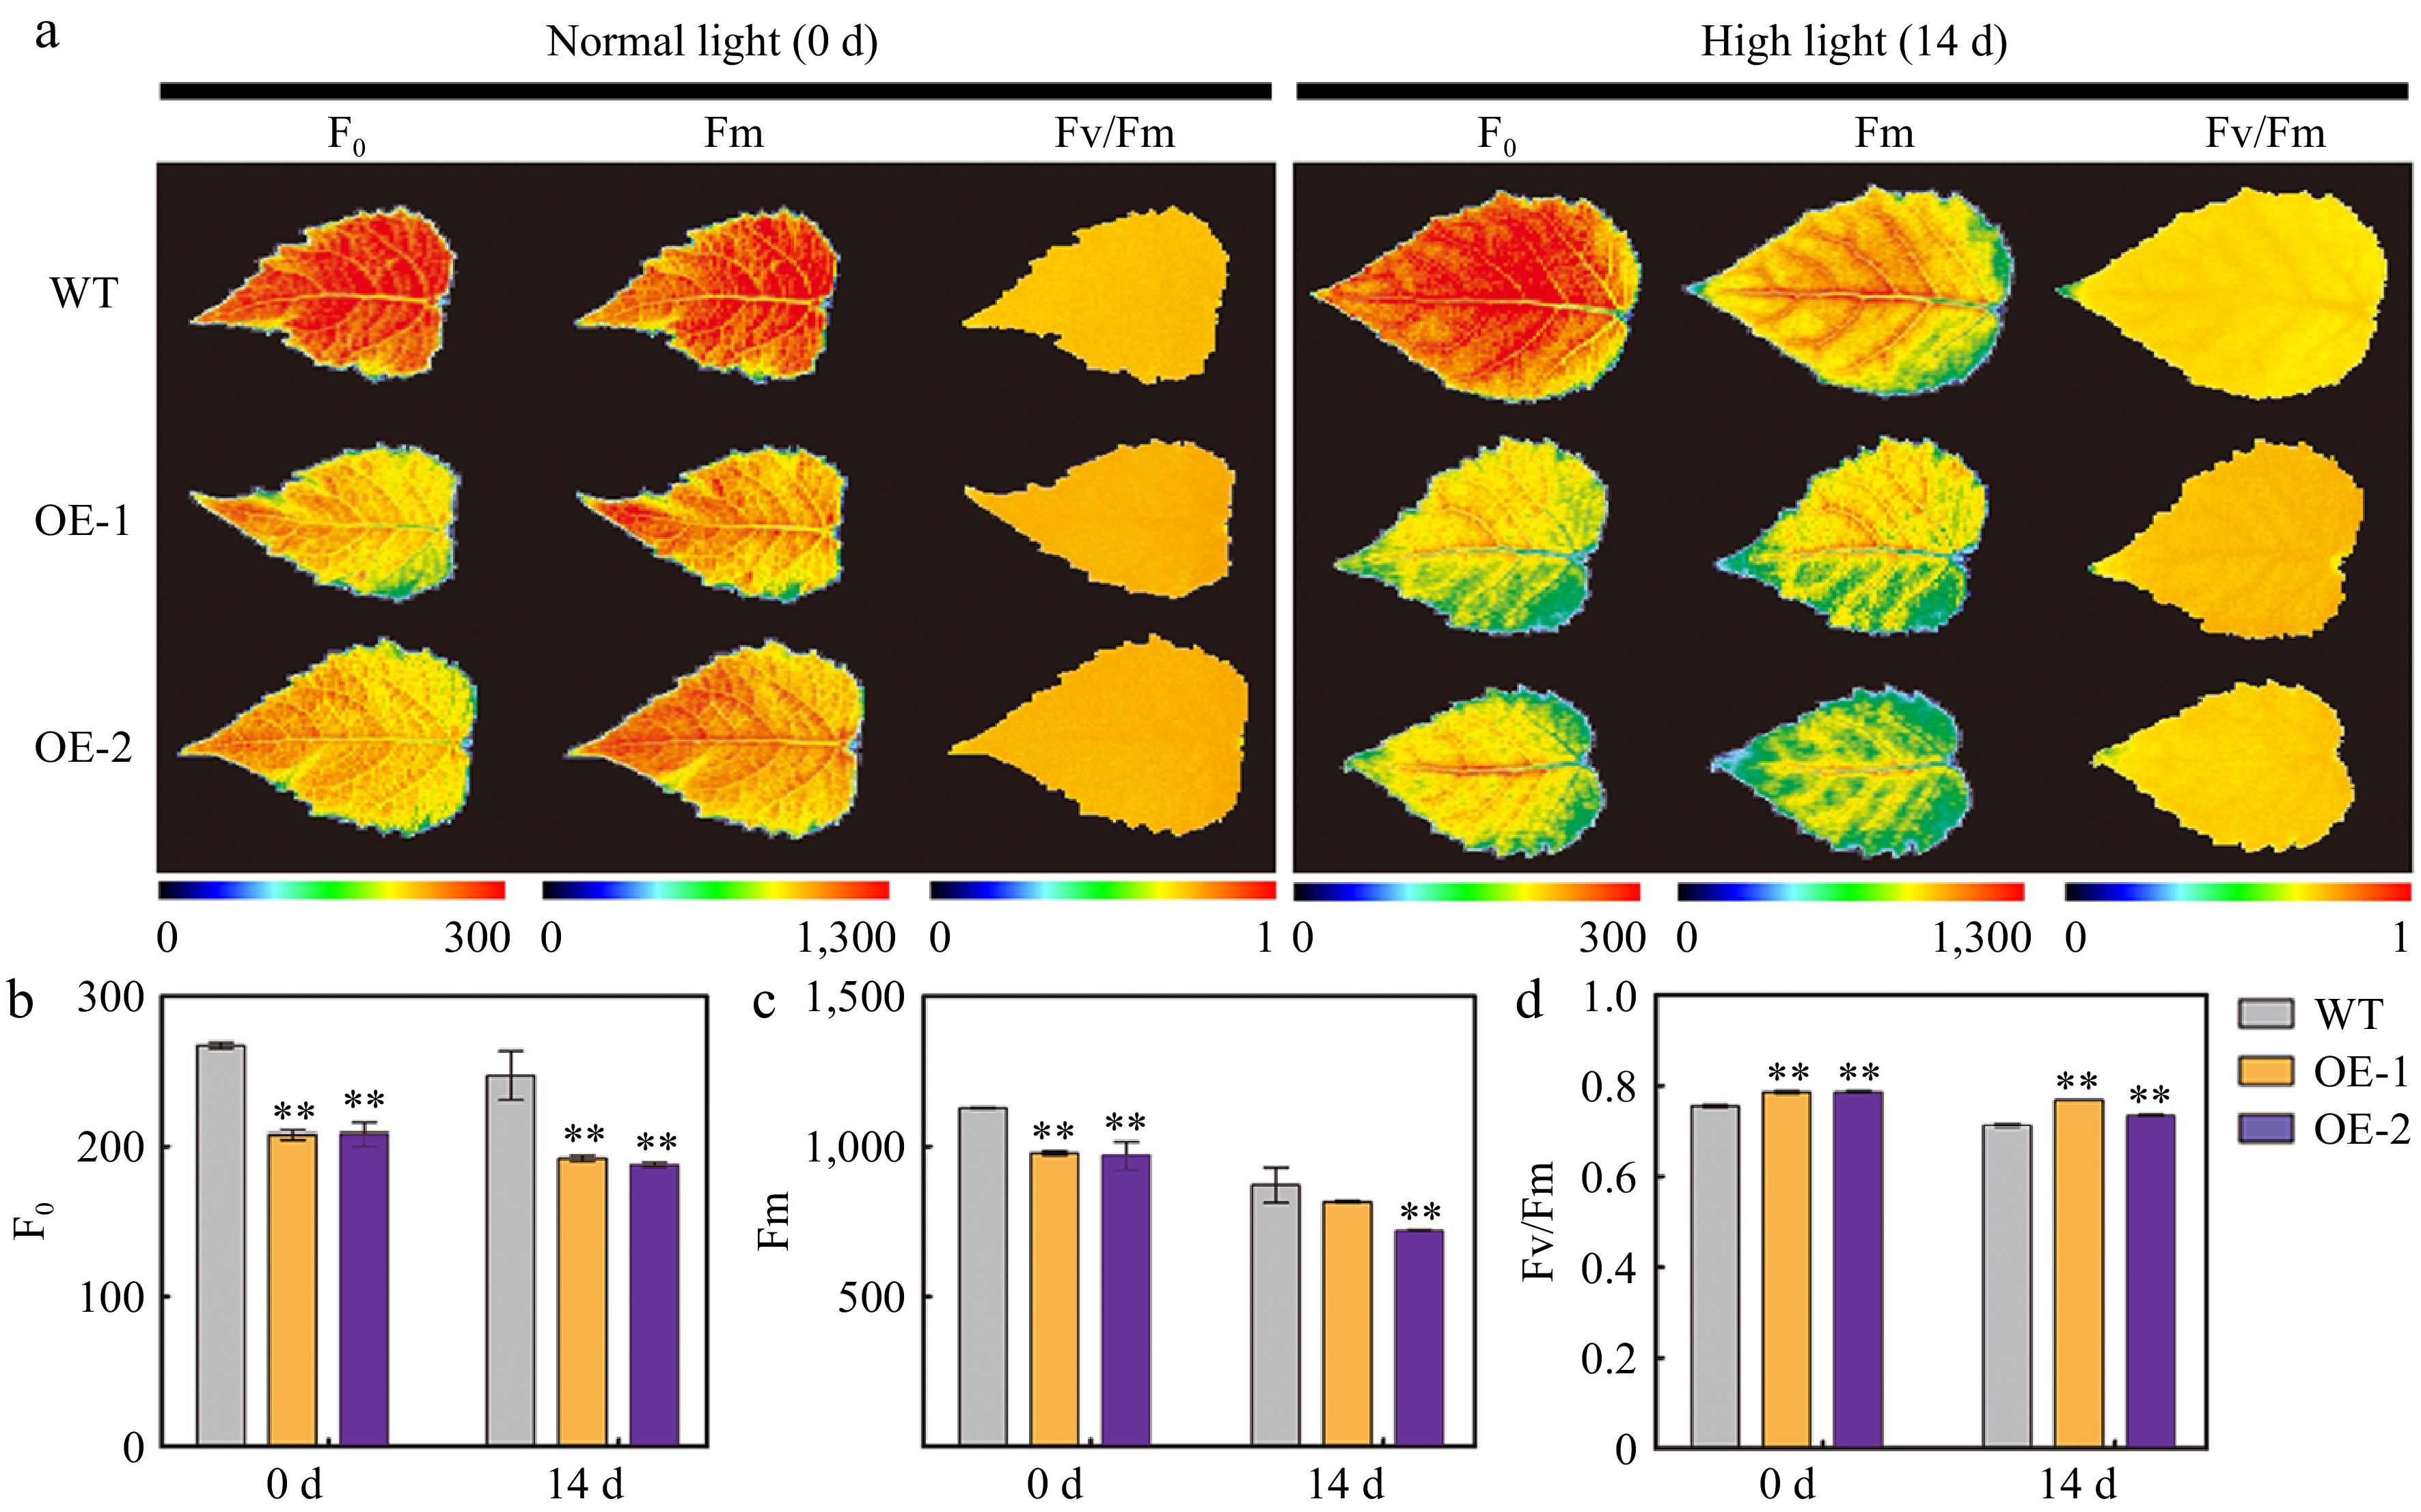
Figure 5.
Chlorophyll (Chl) fluorescence parameters in the leaves of wild type (WT) and transgenic poplar overexpressing (OE) AtSep2 under high light stress. (a) Minimum Chl fluorescence (F0), maximum Chl fluorescence (Fm), and maximal quantum yield of PSII photochemistry (Fv/Fm) images of the leaves of WT and transgenic poplar under normal light or high light stress for 14 d and (b)−(d) their quantitative analysis. Pseudo-colored bar depicted at the bottom of the panel ranges from 0 (black) to 300 (F0), 1,000 (Fm), or 1.0 (Fv/Fm) (red). Asterisks indicate significant differences between WT and transgenic plants (** p < 0.01; Student's t-test). Error bars represent SE (n = 3).
-
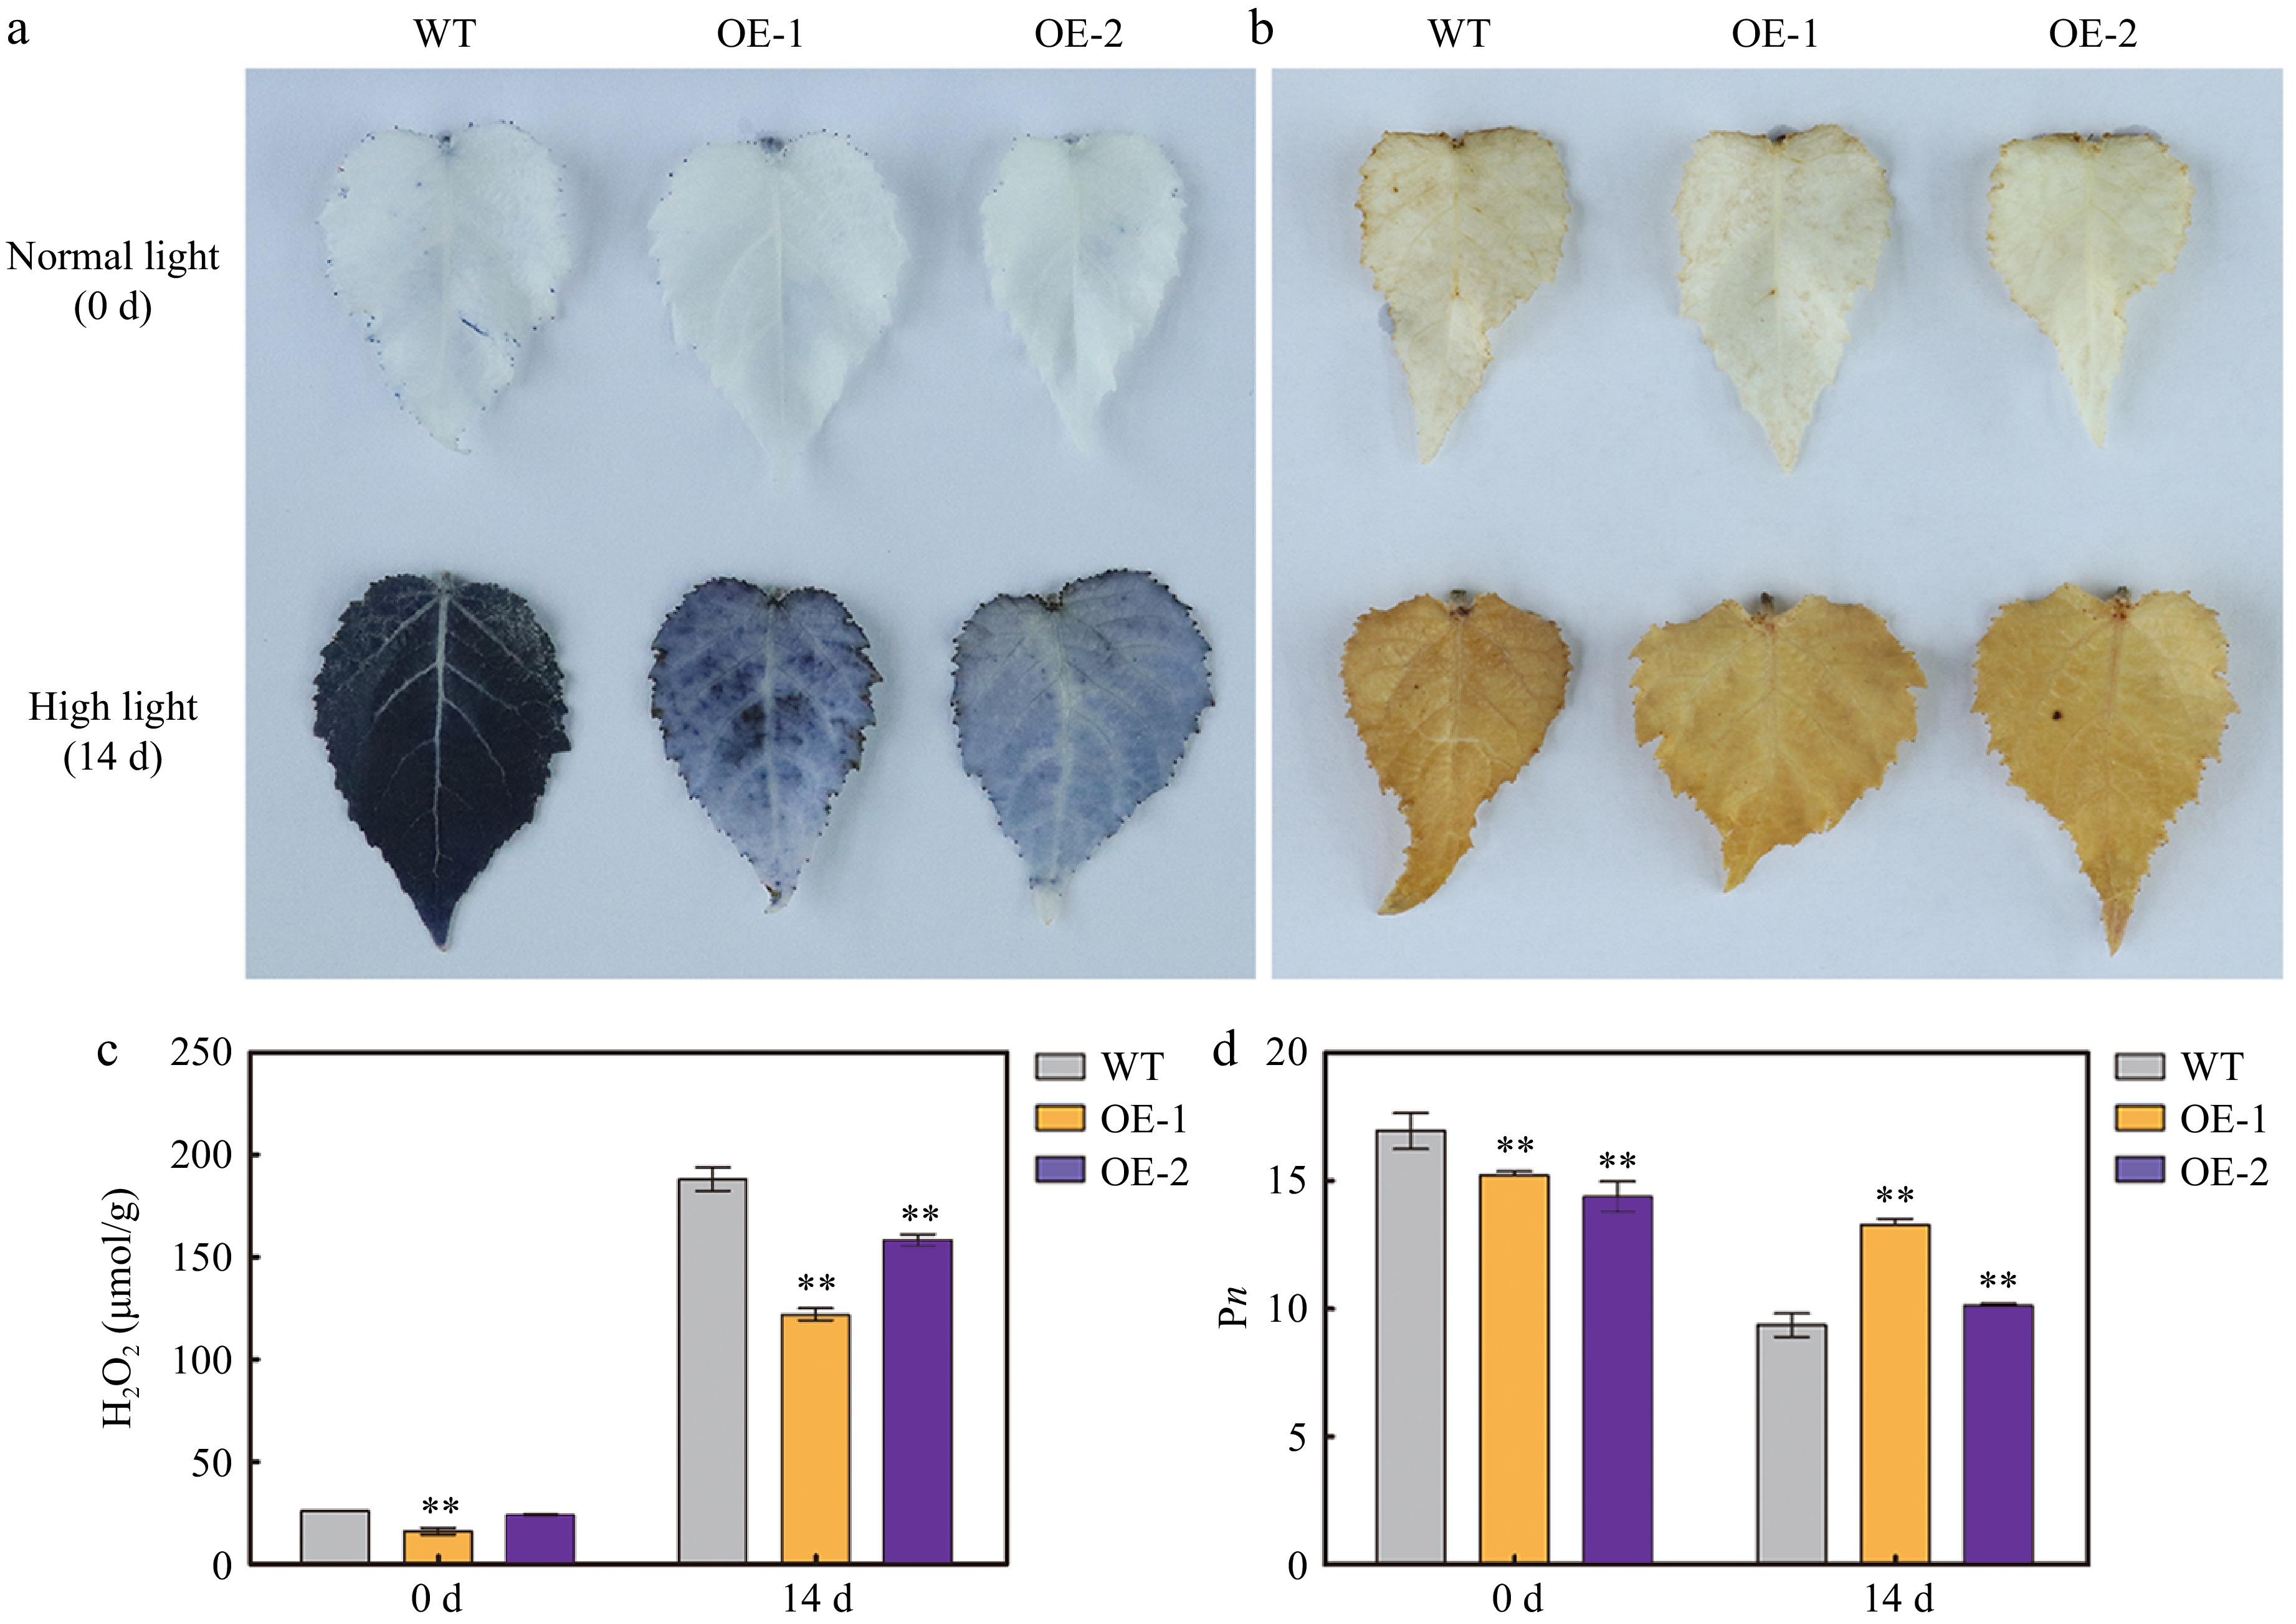
Figure 6.
Reactive oxygen species (ROS) accumulation and net photosynthetic rate (Pn) in the leaves of wild type (WT) and transgenic poplar overexpressing (OE) AtSep2 under high light stress. The O2– and H2O2 levels in the leaves of WT and transgenic poplar under normal light or high light stress for 14 d, as indicated by (a) nitroblue tetrazolium (NBT) and (b) 3,3'-diaminobenzidine (DAB) staining. (c) H2O2 content and (d) Pn in the leaves of WT and transgenic poplar under normal light or high light stress for 14 d. Asterisks indicate significant differences between WT and transgenic plants (** p < 0.01; Student's t-test). Error bars represent SE (n = 3).
-
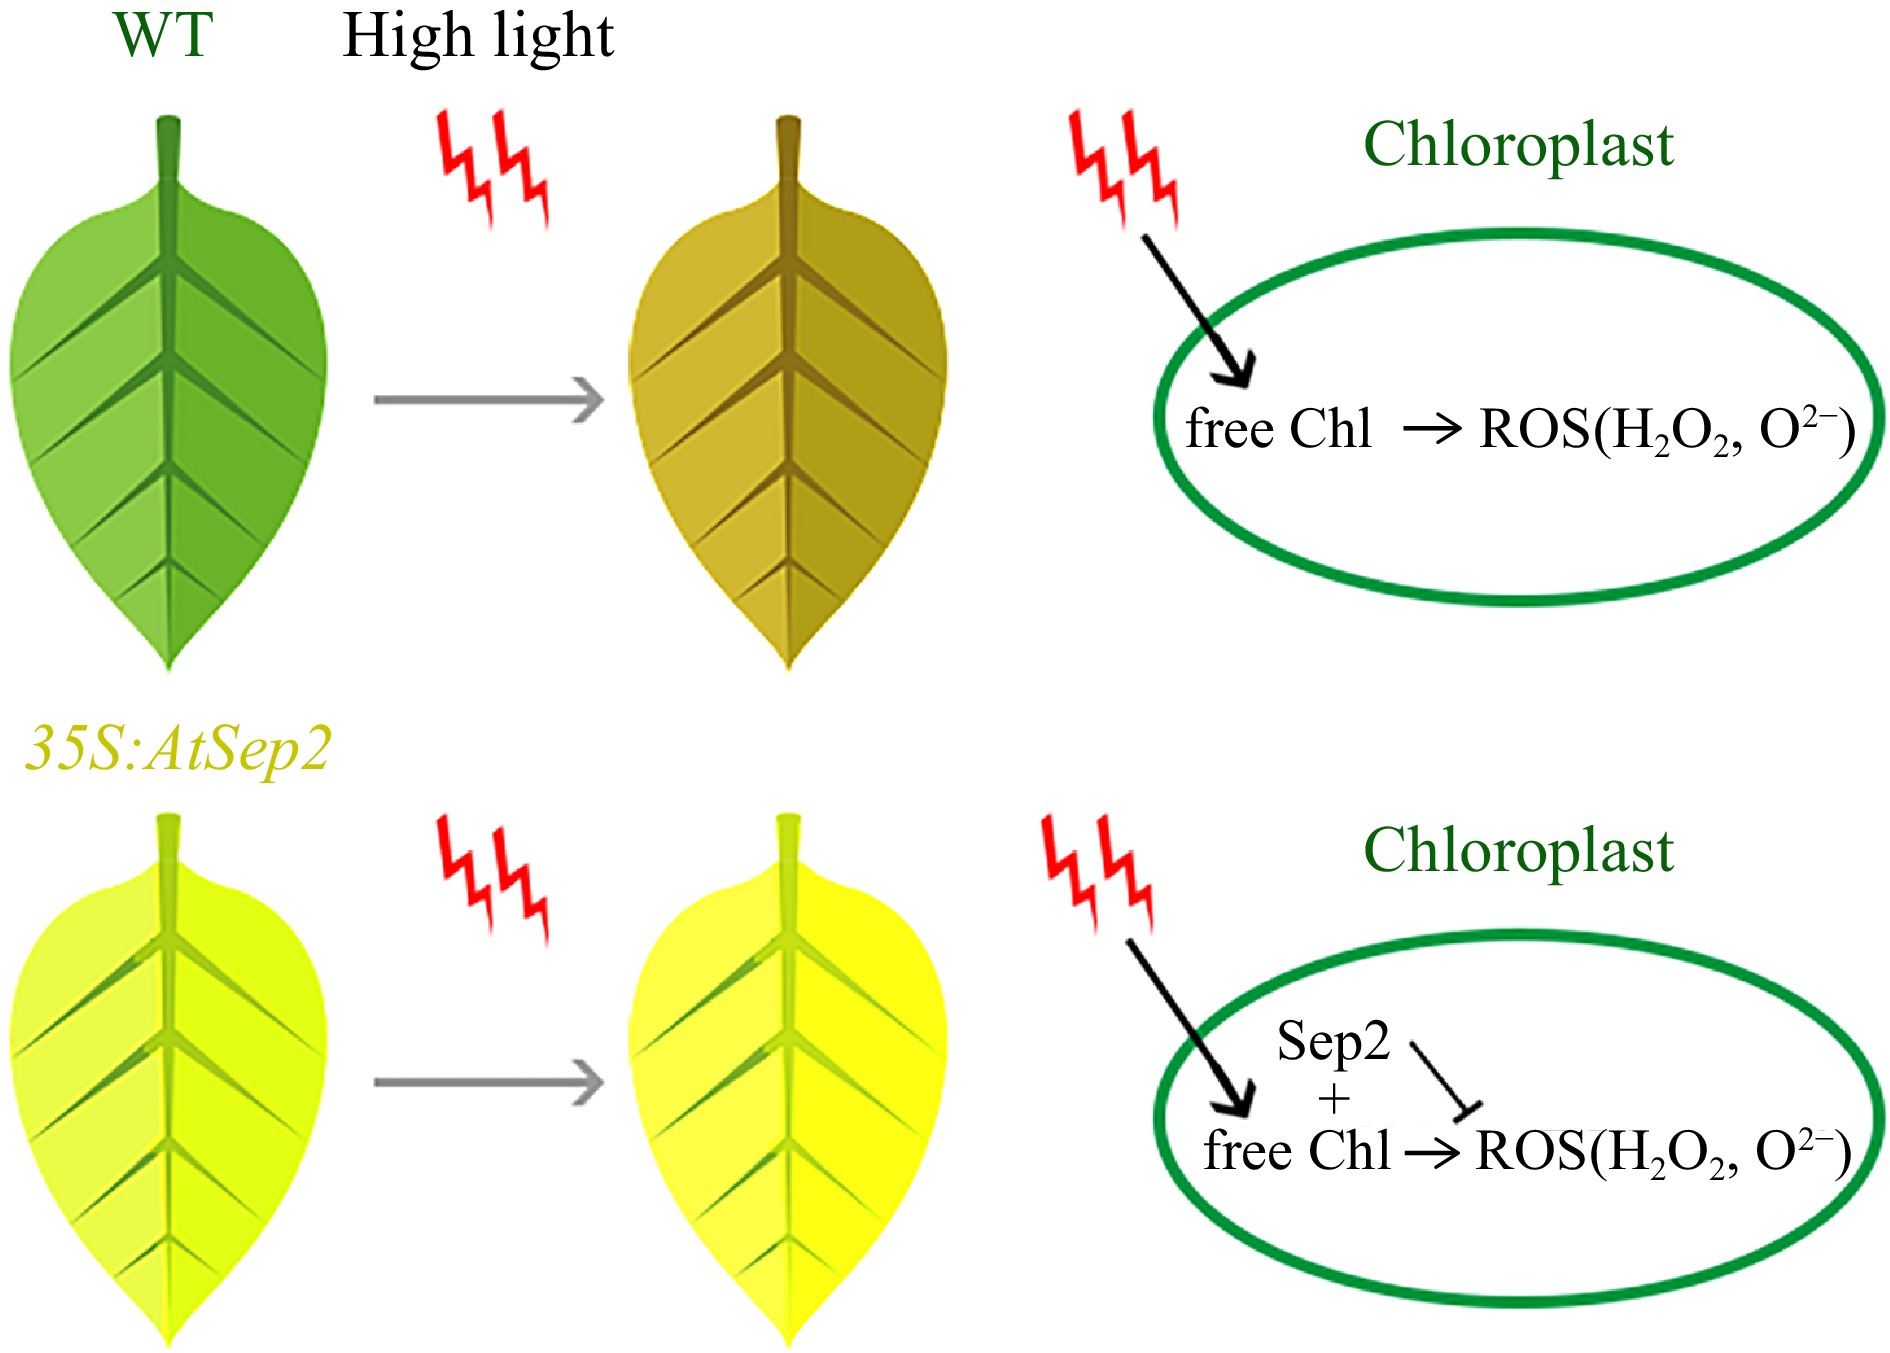
Figure 7.
Putative model of AtSep2 function in leaf yellowing and tolerance of high light stress in transgenic poplar. High light stress induces free chlorophyll (Chl) to form the Chl triplets, which react with O2 to form harmful reactive oxygen species (ROS), such as H2O2 and O2–; however, AtSep2 may prevent the further production of ROS by binding with free Chl.
Figures
(7)
Tables
(0)