-
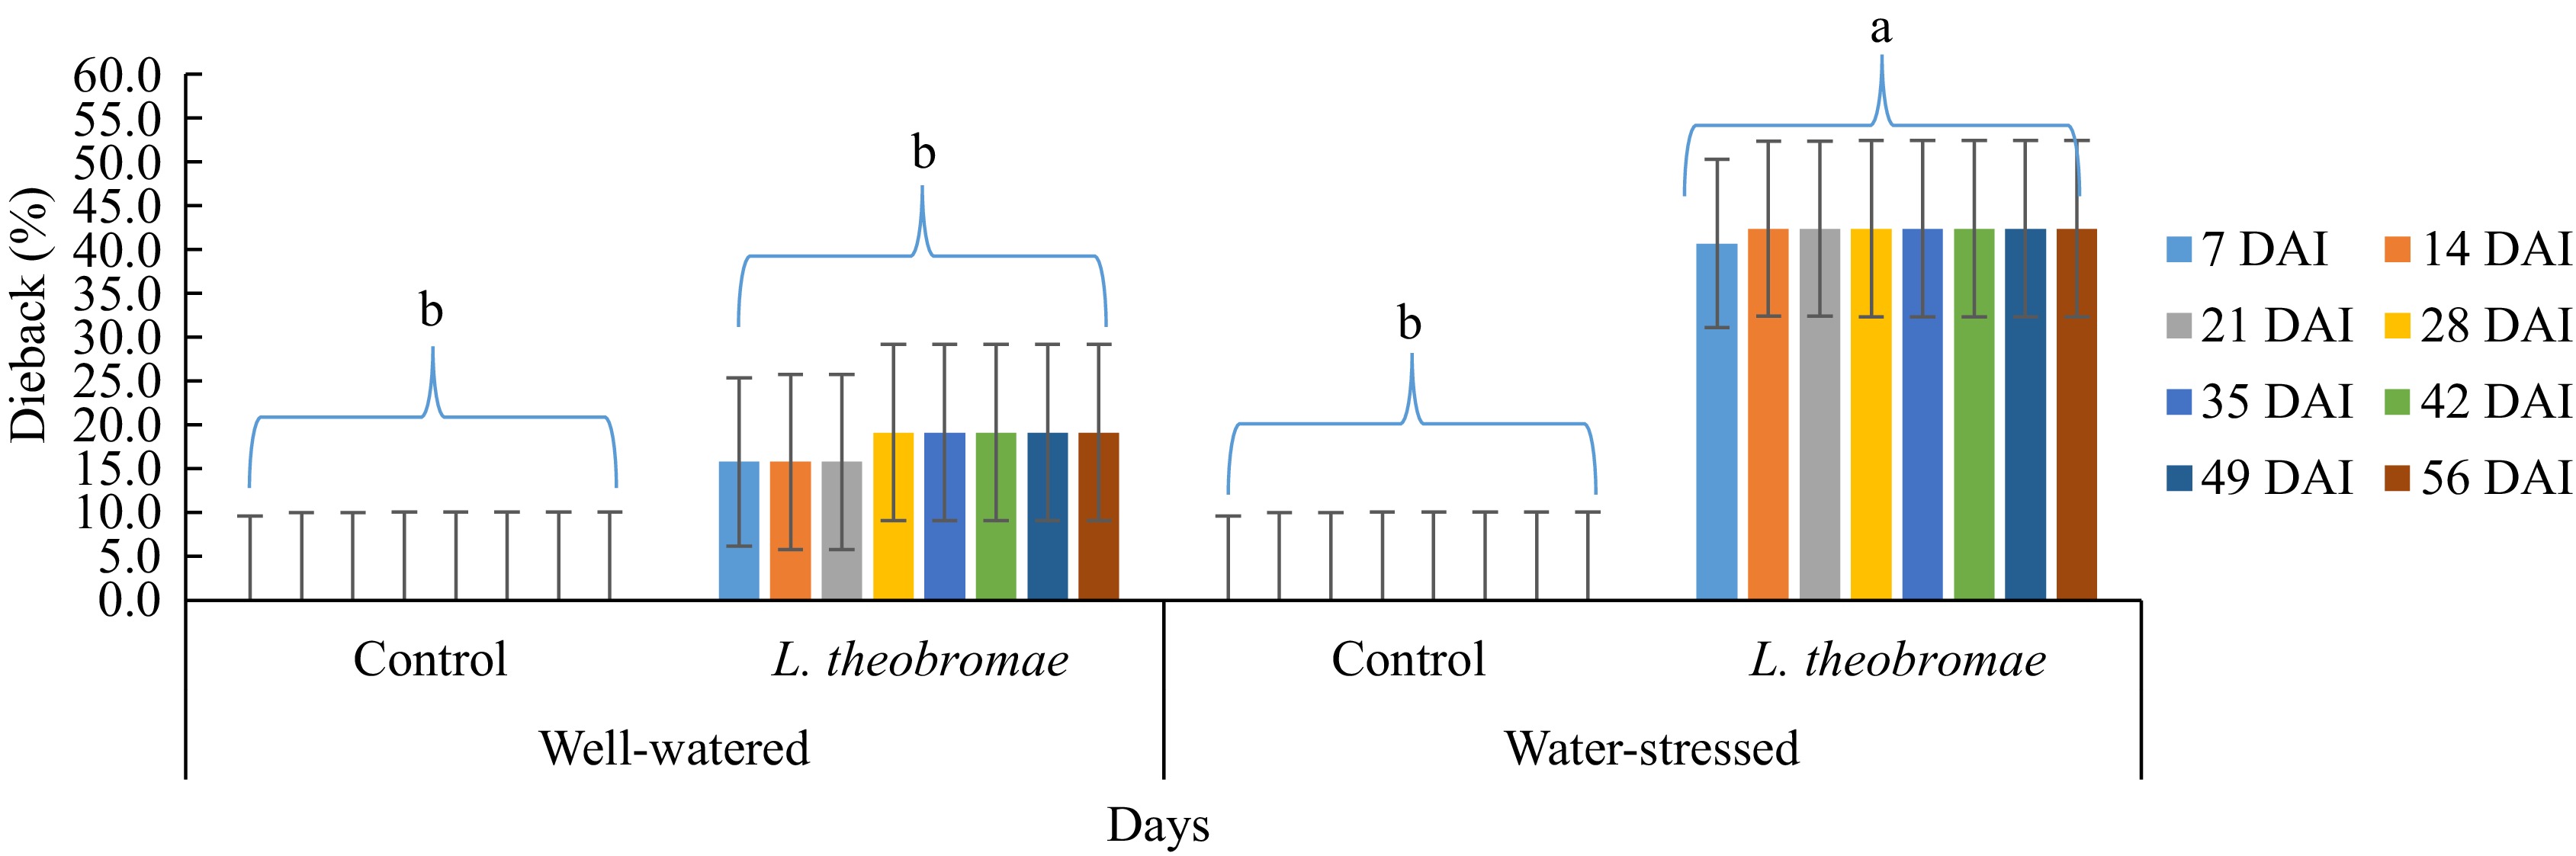
Figure 1.
Dieback severity in cocoa MCC 02 clone inoculated with L. theobromae simultaneous to water-stress imposition and with PDA as a control inoculum for 56 d. Bars with the same letter indicate no significant difference according to the Tukey's test at p ≤ 0.05. DAI: Days after inoculation.
-
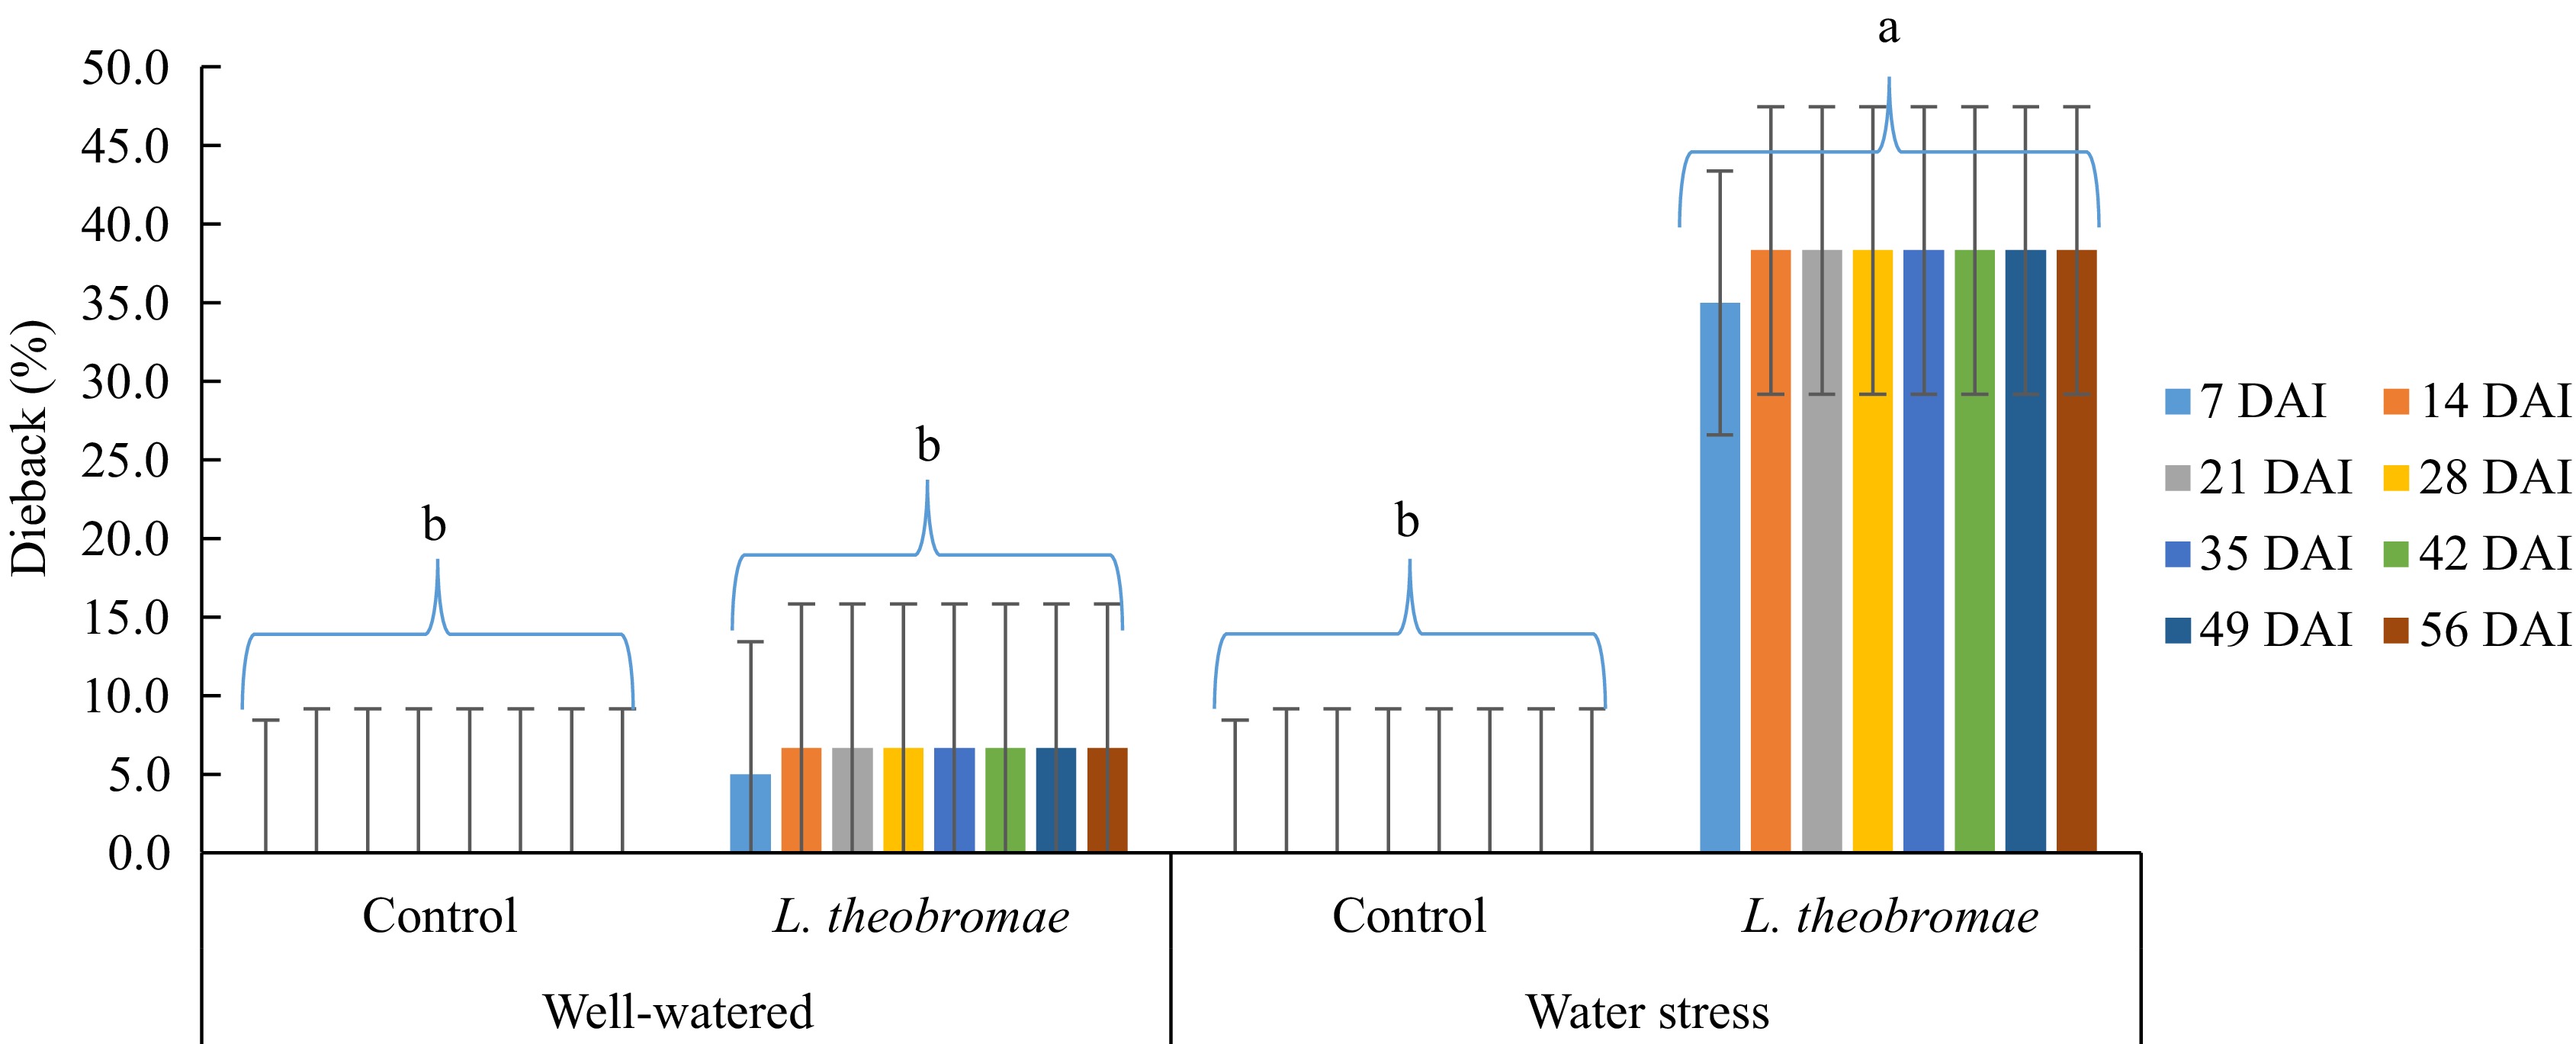
Figure 2.
Dieback severity in MCC 02 cocoa clone inoculated with L. theobromae 7 d after the initiation of water-stress imposition and with PDA as a control inoculum for 56 d. Bars with the same letter indicate no significant difference according to the Tukey's test at p ≤ 0.05. DAI: Days after inoculation.
-
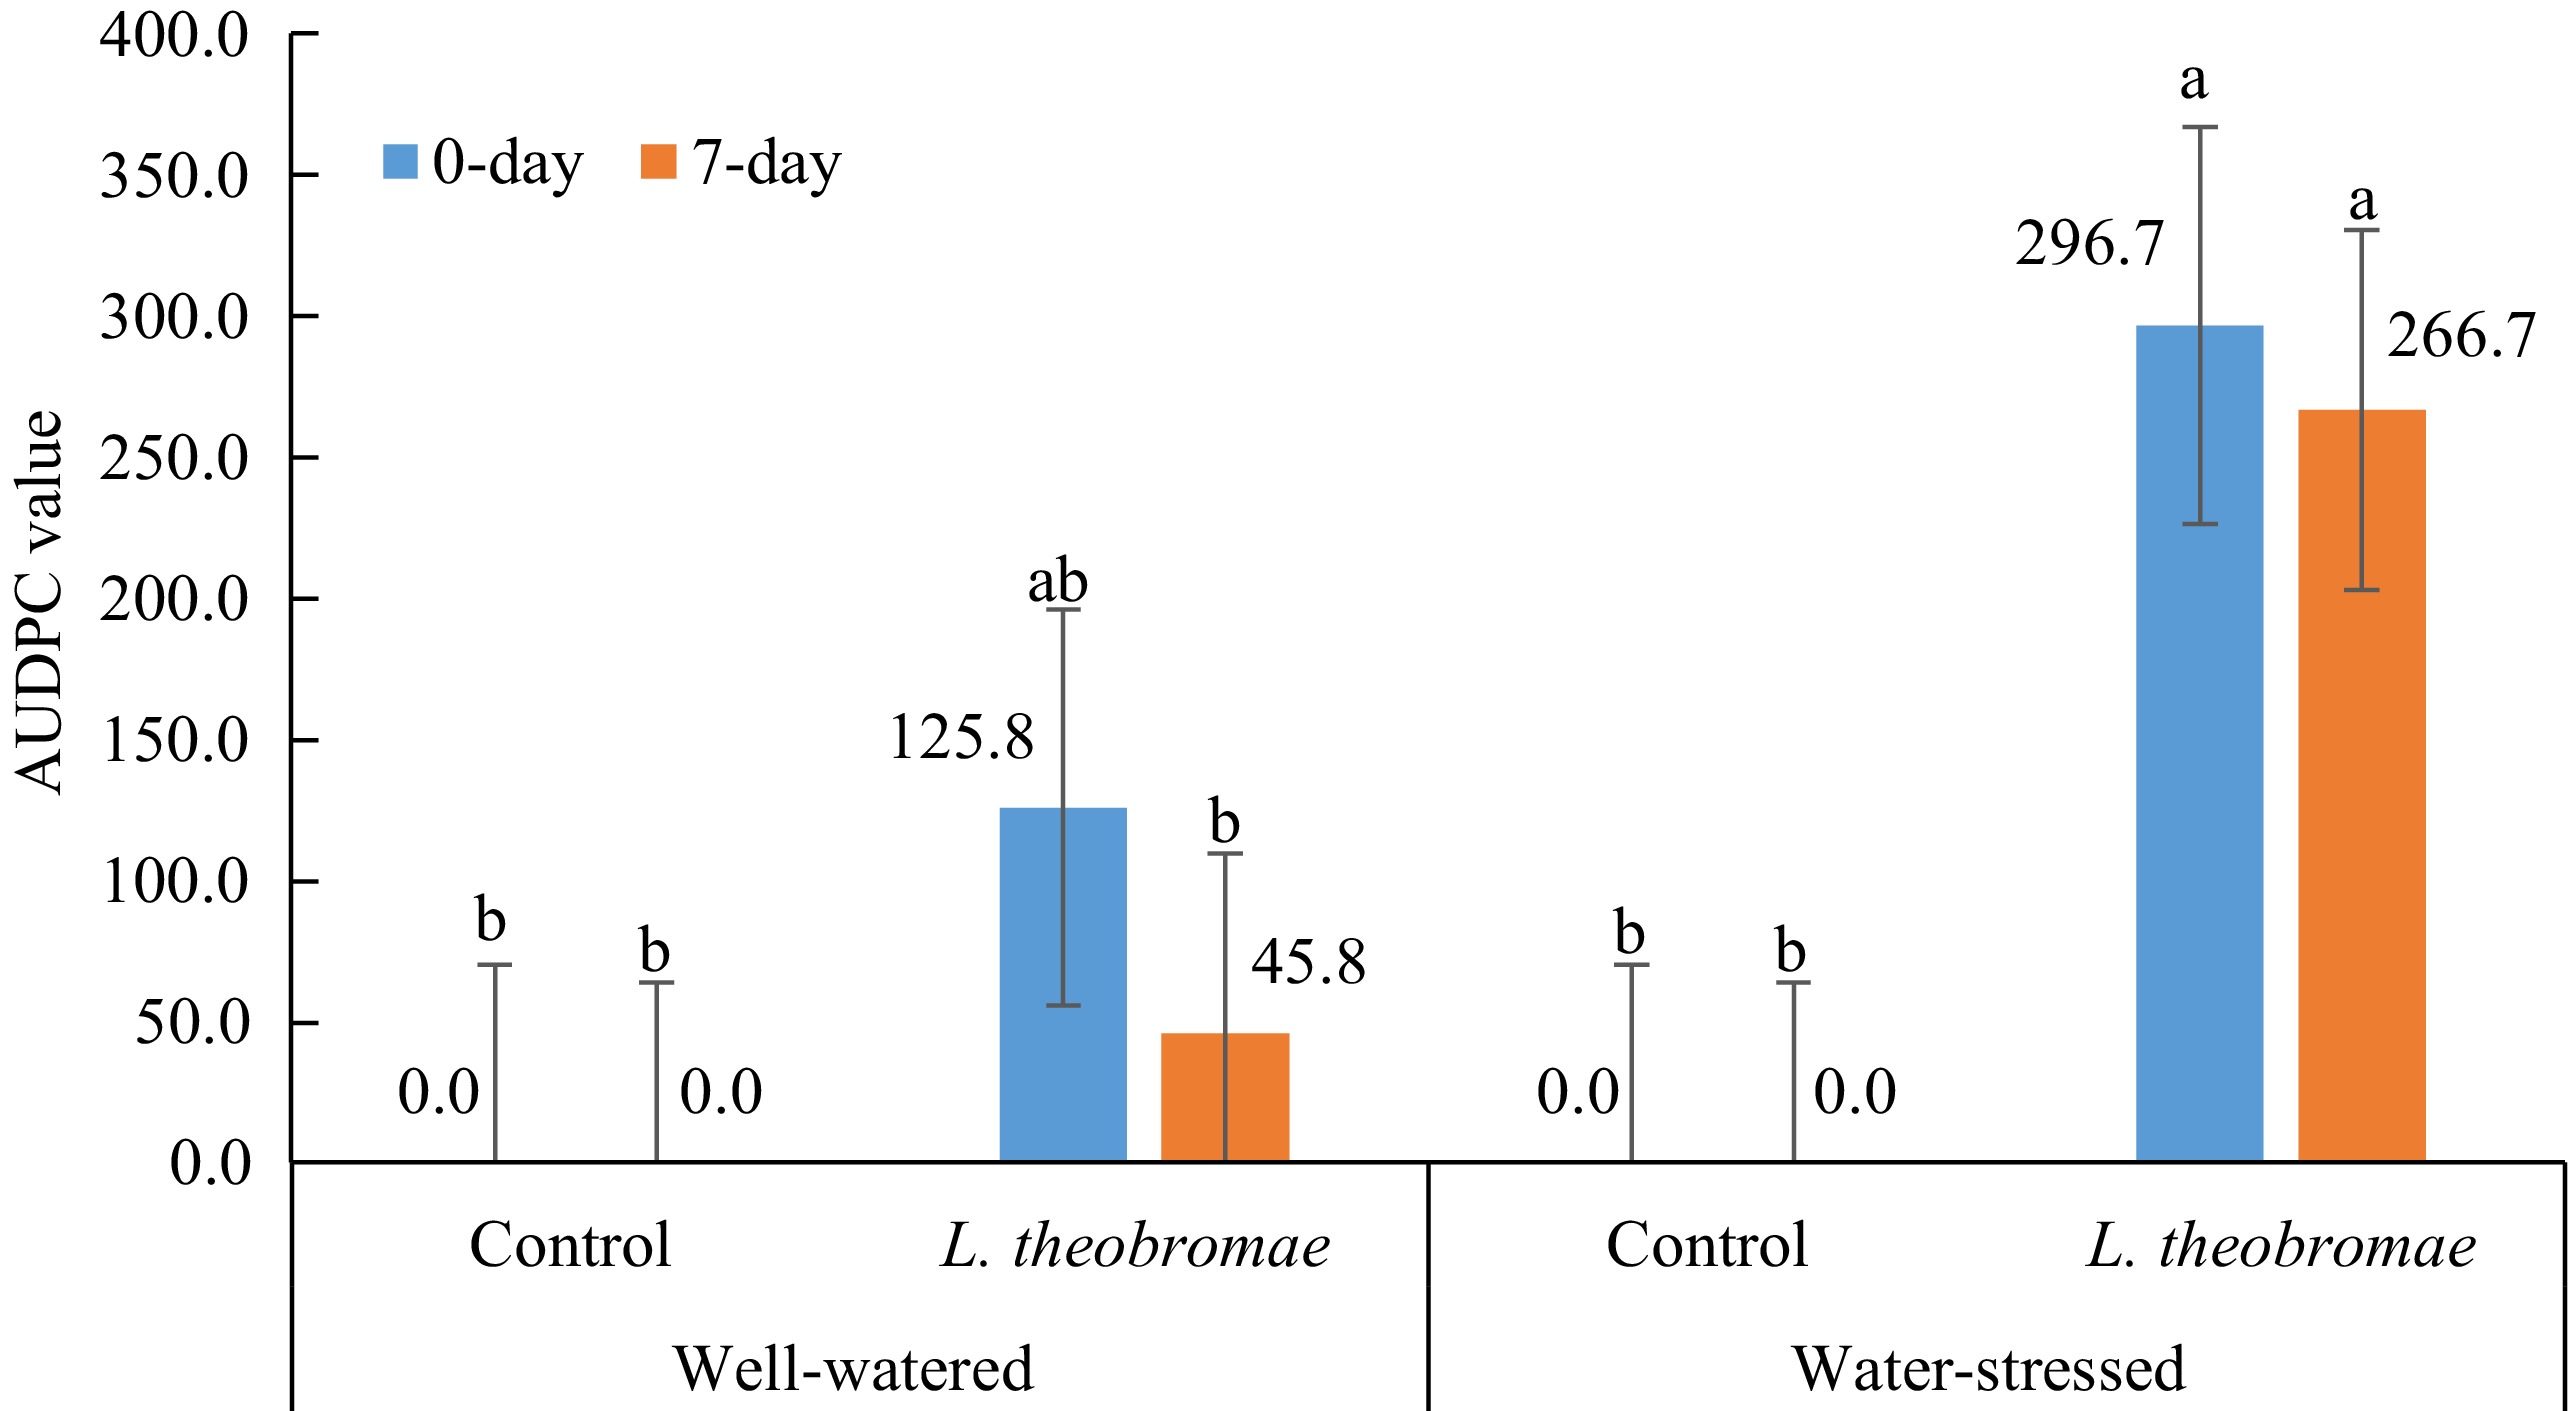
Figure 3.
Mean AUDPC values of dieback severity in two different watering regimes and two different times of inoculation of L. theobromae evaluated 1, 2, 3, 4, and 5 weeks after inoculation in South Sulawesi (from January 2023 to March 2023). In all treatments, dieback symptoms were first observed one week after inoculation. Bars with the same letter do not differ significantly according to the Tukey's test analysis (p < 0.05).
-
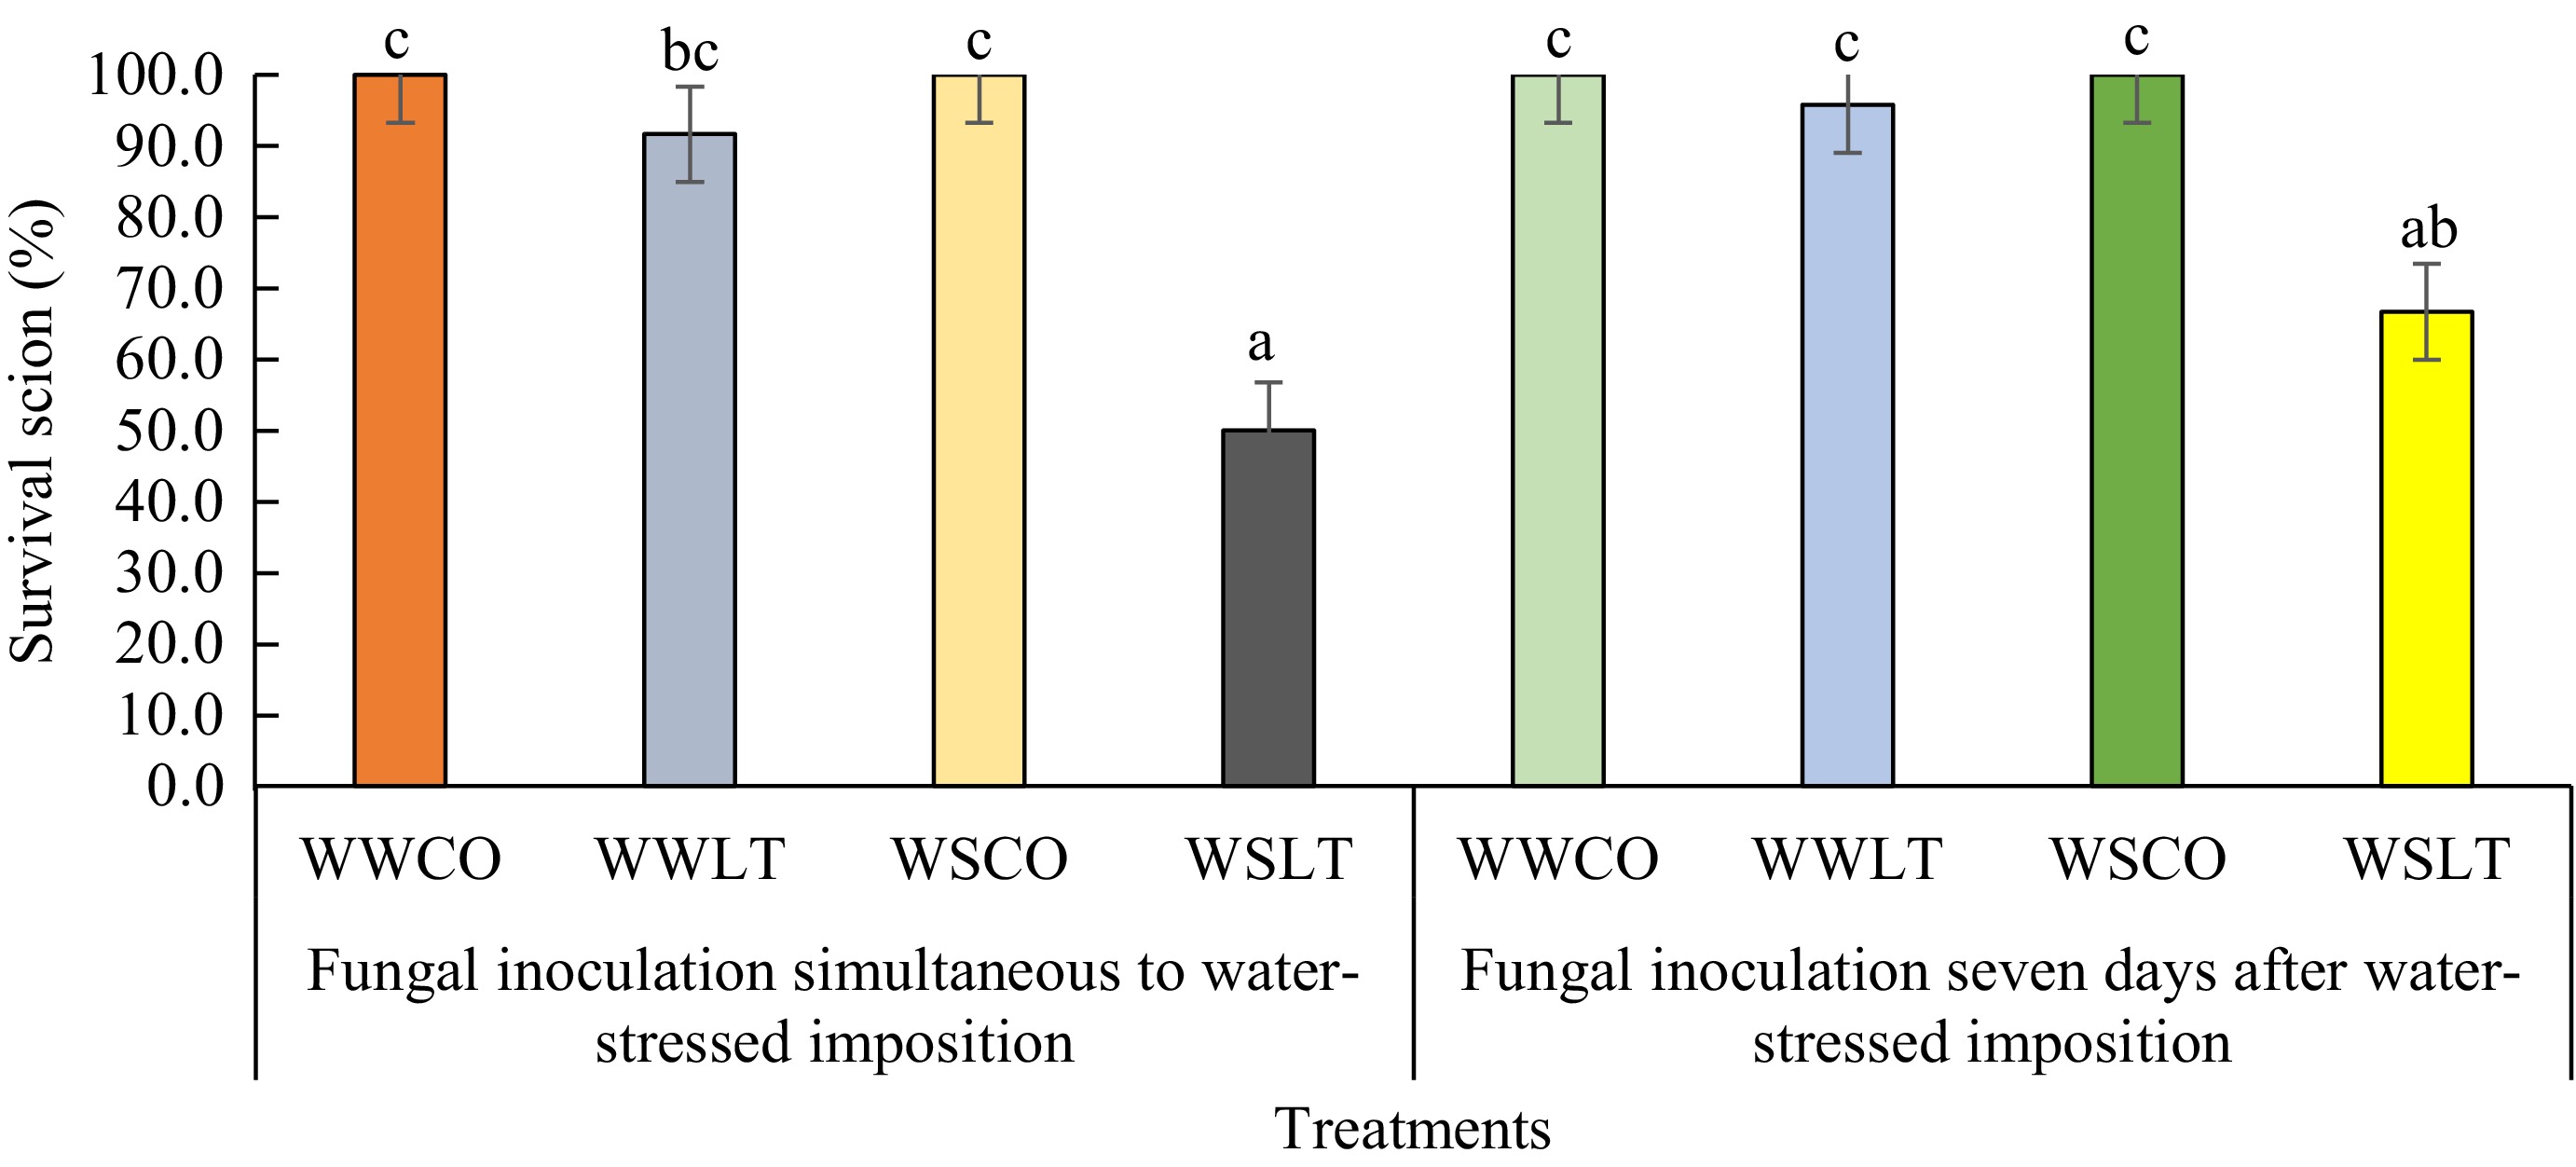
Figure 4.
Survival rates of scions inoculated by L. theobromae in two different experiments: Fungal inoculation simultaneous to water stress imposition (Experiment 1) and 7 d after the initiation of water stress imposition (Experiment 2), with PDA as a control inoculum for 64 d. Differences in letters above the bar on each treatment indicate statistically significant differences by Tukey's test analysis (p < 0.05). WWCO: Well-watered treated with a PDA plug (control); WWLT: Well-watered with L. theobromae inoculation; WSCO: Water-stressed treated with a PDA plug (control); WSLT: Water-stressed with L. theobromae inoculation.
-
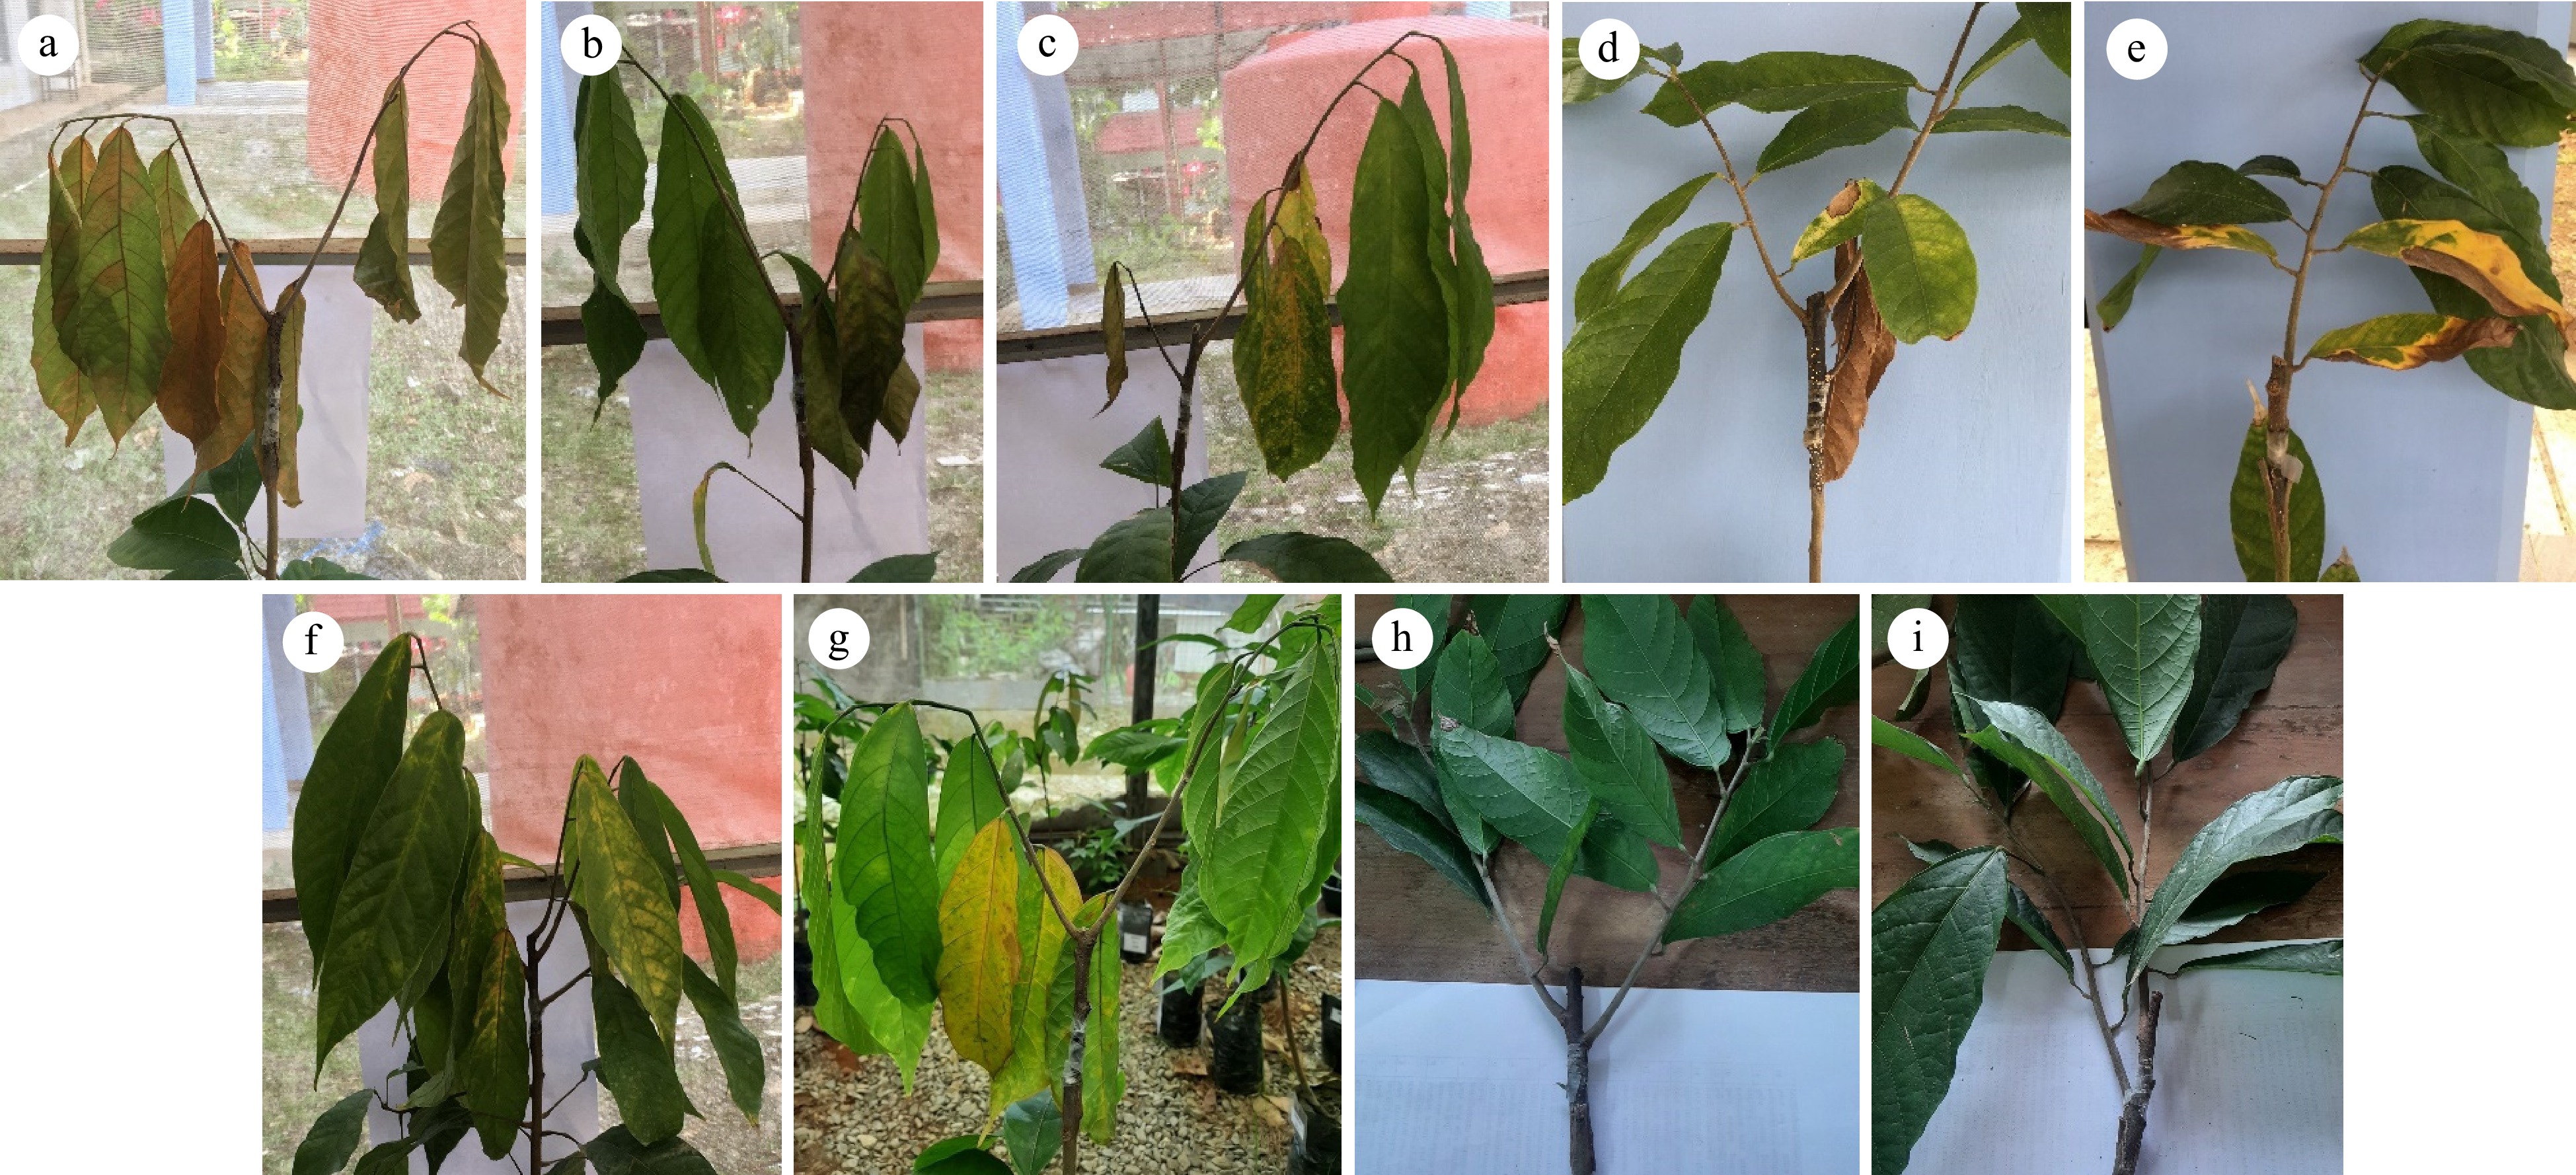
Figure 5.
Various initial symptoms on leaves of cocoa scions inoculated by L. theobromae (simultaneously or 7 d after water imposition) under well-watered and water-stressed conditions. (a), (b) dieback; (c)−(e) chlorotic and mixed of chlorotic and necrotic; (f), (g) chlorotic; (h), (i) control (a PDA plug).
-
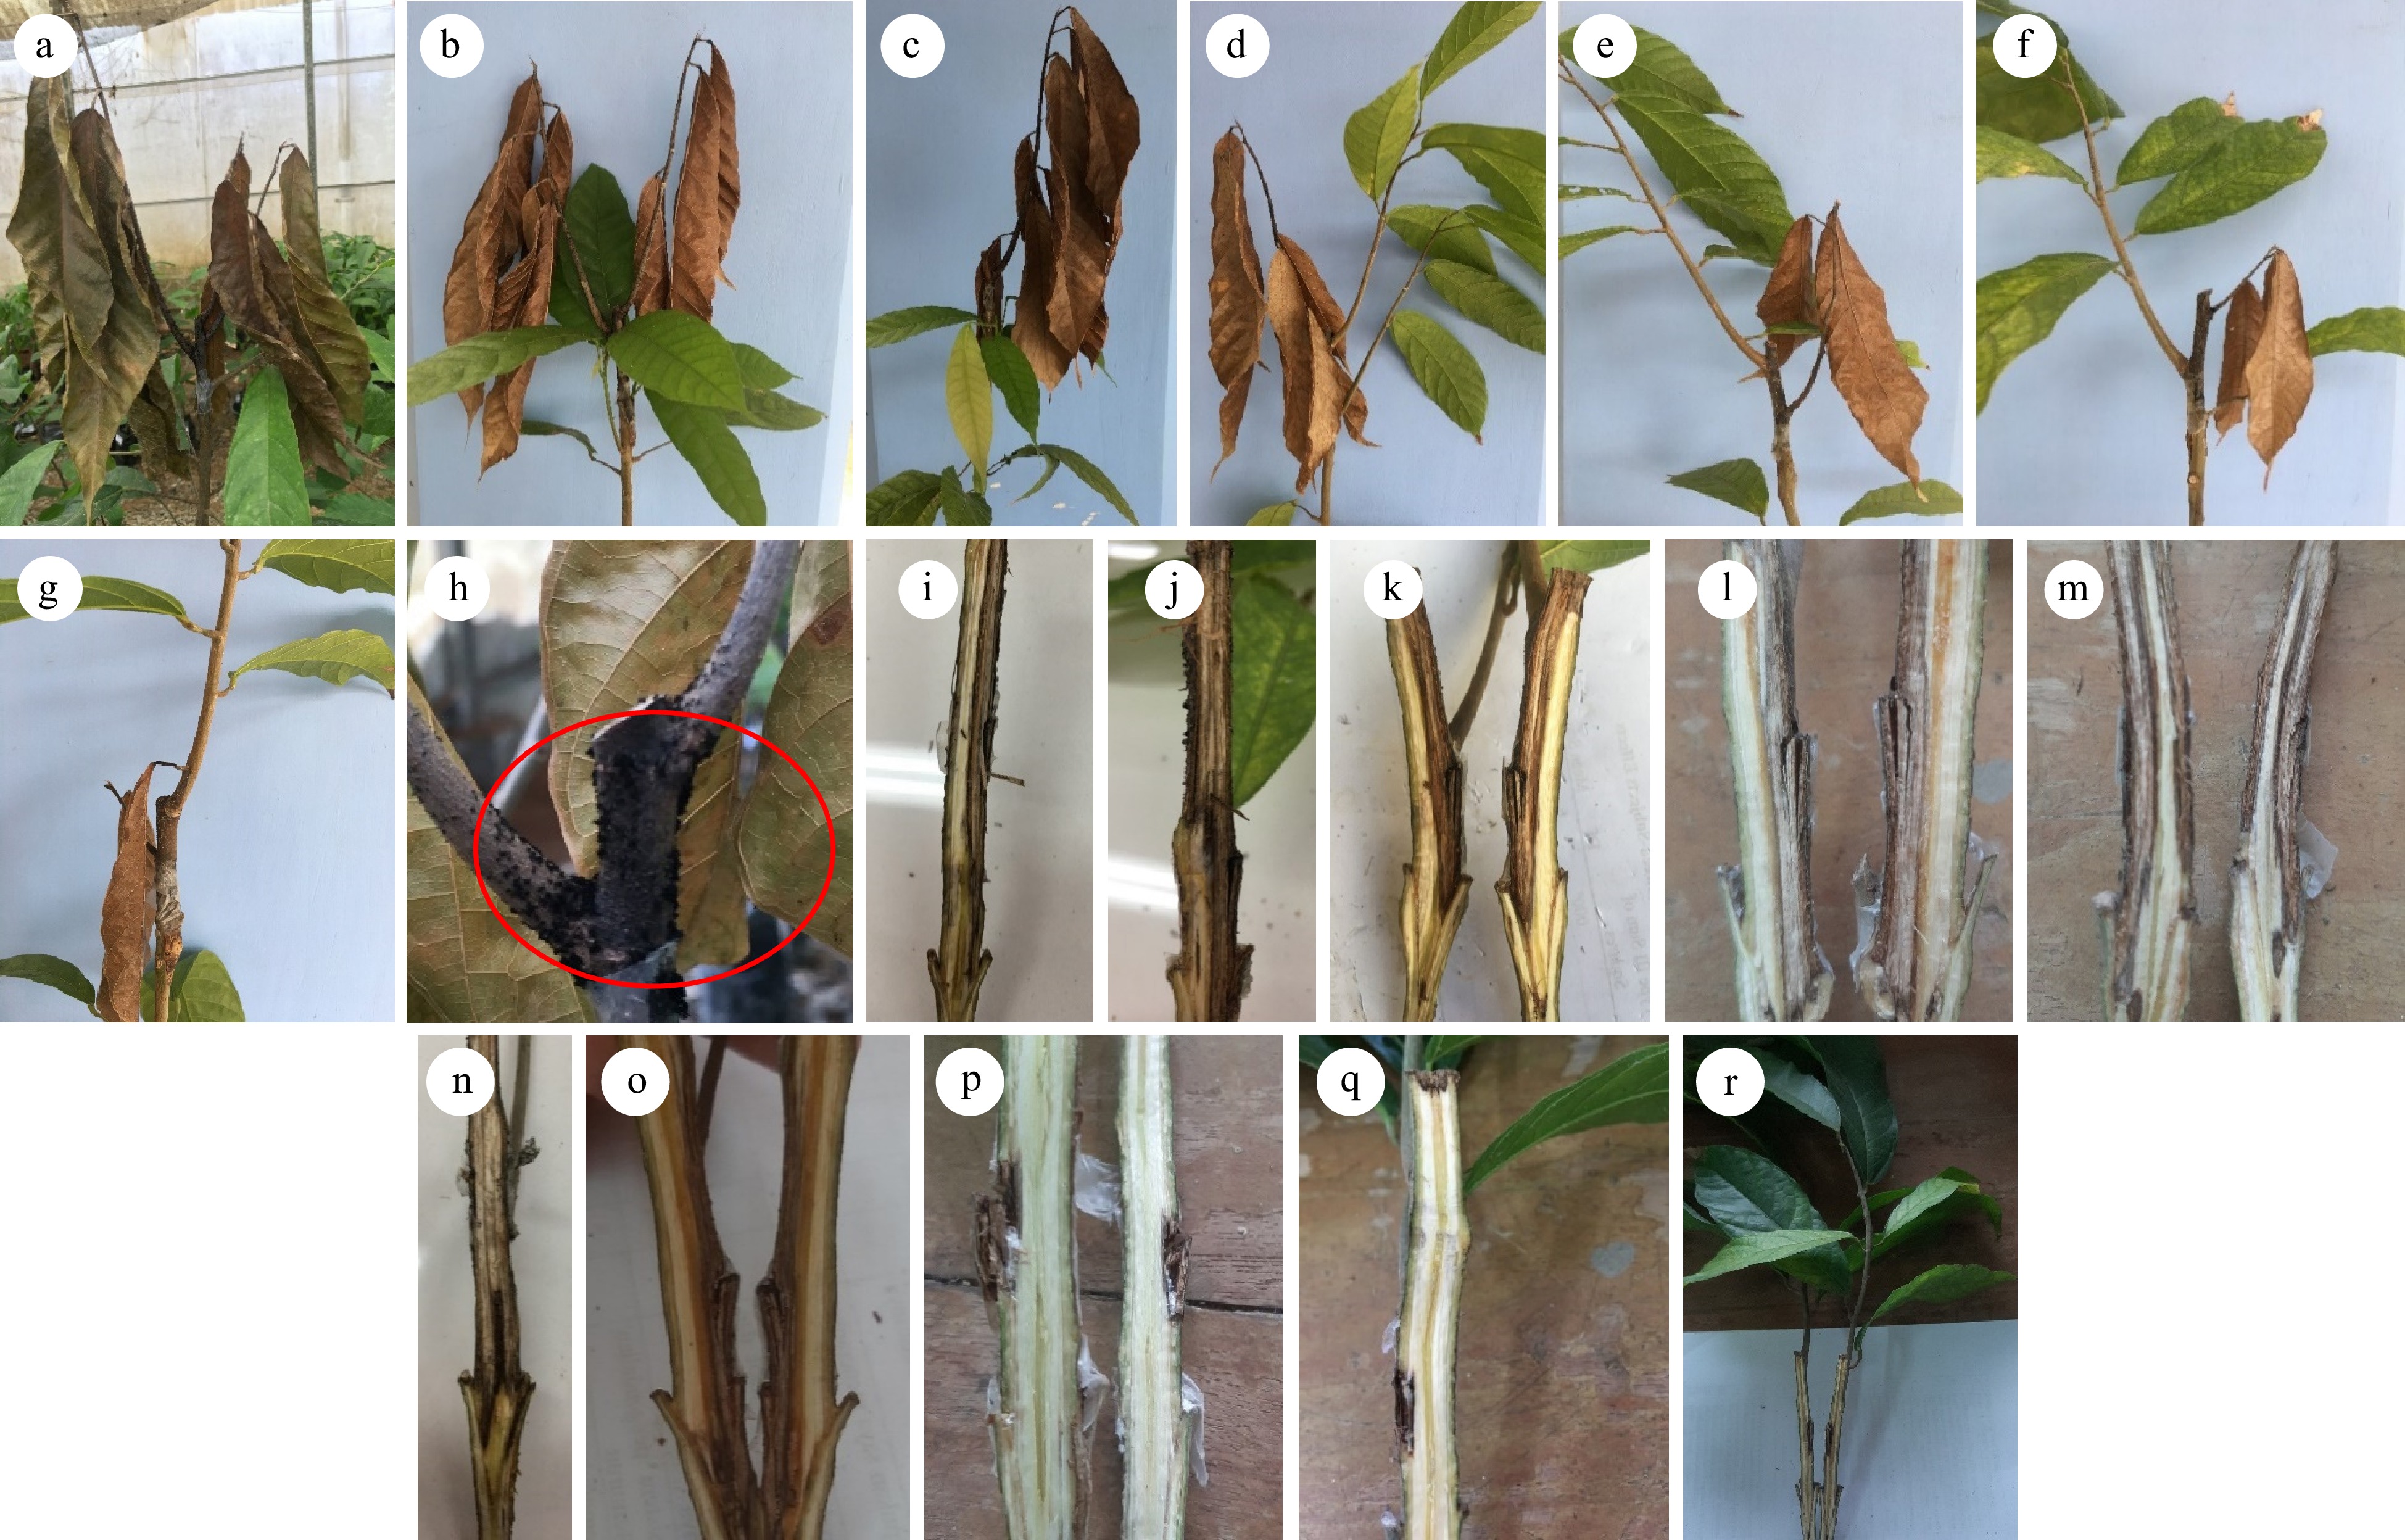
Figure 6.
Various advanced symptoms on cocoa scions inoculated with L. theobromae simultaneously with water imposition and 7 d after the initiation of water imposition. (a)−(c) dieback on all branches, three, two, and one branch(es), respectively; (d)−(g) dieback on one side of the branch; (g)browning leaf at lower leaf; (h) presence of black conidiomata (red circle) on the fungal inoculated stem; (i)−(o) vertical section of fungal inoculated scion stems showed vascular streaking; (p)−(r) vertical section of control showed symptomless/no vascular streaking.
-
Watering regime/
inoculum typeDieback severity
1 week after inoculationDieback severity
2 weeks after inoculationDieback severity
3 weeks after inoculationDieback severity
4 weeks after inoculationDieback severity
5 weeks after inoculationMean AUDPC disease severity
for 8 weeksAverages for each watering regime Well-watered 7.92% 7.92% 7.92% 9.58% 9.58% 62.92% Water-stressed 20.42% 20.42% 20.42% 21.25% 21.25% 148.33% Tukey's test 15.08% (NS) 15.08% (NS) 15.08% (NS) 13.73% (NS) 13.73% (NS) 98.85% (NS) Averages for each inoculation time Control 0.00 0.00 0.00 0.00 0.00 0.00 L. theobromae 28.33% 28.33% 28.33% 30.83% 30.83% 211.25% Tukey's test 15.08% (**) 15.08% (**) 15.08% (**) 13.73% (**) 13.73% (**) 98.85% (**) Analysis of variance (p-value) Watering regime (W) NS NS NS NS NS NS Inoculum type (I) ** ** ** ** ** ** W × I NS NS NS NS NS NS ** and NS indicate statistical significance at p < 0.01, 0.05, and not significant by Tukey's test analysis (p < 0.05), respectively. Mean disease severity as described on Materials and methods section. Table 1.
Two-way ANOVA of dieback severity in two different watering regimes and two different inoculum types. Cocoa MCC 02 clone inoculated with L. theobromae simultaneous to water stress imposition and with PDA as a control inoculum for 56 d and evaluated 1, 2, 3, 4, and 5 weeks after inoculation in South Sulawesi (from January 2023 to March 2023). In all treatments, dieback symptoms were first observed one week after inoculation.
-
Watering regime/
inoculum typeDieback severity
1 week after inoculationDieback severity
2 weeks after inoculationDieback severity
3 weeks after inoculationDieback severity
4 weeks after inoculationDieback severity
5 weeks after inoculationMean AUDPC disease severity for 8 weeks Averages for each watering regime Well-watered 2.50% 3.33% 3.33% 3.33% 3.33% 22.92% Water-stressed 17.50% 19.17% 19.17% 19.17% 19.17% 133.33% Tukey's test 8.29% (**) 7.52% (**) 7.52% (**) 7.52% (**) 7.52% (**) 52.62% (**) Averages for each inoculation time Control 0.00 0.00 0.00 0.00 0.00 0.00 L. theobromae 20.00% 22.50% 22.50% 22.50% 22.50% 156.25% Tukey's test 8.29% (**) 7.52% (**) 7.52% (**) 7.52% (**) 7.52% (**) 52.62% (**) Analysis of variance (p-value) Watering regime (W) ** ** ** ** ** ** Inoculum type (I) ** ** ** ** ** ** W × I ** ** ** ** ** ** ** indicate statistical significance at p < 0.01, 0.05 by Tukey's test analysis (p < 0.05). Mean disease severity as described on materials and methods. Table 2.
Two-way ANOVA of dieback severity in two different watering regimes and two different inoculum types. Cocoa MCC 02 clone inoculated with L. theobromae 7 d after the initiation of water-stress imposition and with PDA as a control inoculum for 56 d and evaluated 1, 2, 3, 4, and 5 weeks after inoculation in South Sulawesi (from January 2023 to March 2023). In all treatments, dieback symptoms were first observed one week after inoculation.
-
Watering regime/
inoculation timeDieback severity
1 week after inoculationDieback severity
2 weeks after inoculationDieback severity
3 weeks after inoculationDieback severity
4 weeks after inoculationDieback severity
5 weeks after inoculationMean AUDPC disease severity for 8 weeks Averages for each watering regime Well-watered LT 5.21%b 5.63%b 5.63%b 6.46%b 6.46%b 42.92%b Water-stressed LT 18.96%a 20.21%a 20.21%a 20.21%a 20.21%a 140.83%a Well-watered CO 0.00b 0.00b 0.00b 0.00b 0.00b 0.00b Water-stressed CO 0.00b 0.00b 0.00b 0.00b 0.00b 0.00b Tukey's test 13.11% (**) 12.56% (**) 12.56% (**) 11.77% (**) 11.77% (**) 83.99% (**) Averages for each inoculation time 0-day 28.33% 29.17% 29.17% 30.83% 30.83% 211.25% 7-day 20.00% 22.50% 22.50% 22.50% 22.50% 156.25% Tukey's test NS NS NS NS NS NS Analysis of variance (p-value) Watering regime (W) ** ** ** ** ** ** Inoculation time (I) NS NS NS NS NS NS W × I NS NS NS NS NS NS Numbers in the same column followed by the same letter are not significantly different by Tukey's test analysis (p < 0.05). ** and NS indicate statistical significance at p < 0.01, 0.05, and not significant, respectively. Mean disease severity as described in the Materials and methods. LT: L. theobromae; CO: Control, a PDA plug. Table 3.
Two-way ANOVA of dieback severity in four different watering regimes and two different times of inoculation of L. theobromae evaluated 1, 2, 3, 4, and 5 weeks after inoculation in South Sulawesi (from January 2023 to March 2023). In all treatments, dieback symptoms were first observed one week after inoculation.
-
No. Experiment Treatment Vascular streaking (mm) Vascular streaking length compared
to scion lengthDistance of from inoculation site to edge of lesion (mm) Upward Downward 1 L. theobromae inoculation simultaneous to water-stressed imposition Well-watered Control 0.0b 0.0c 0.0b 0.0b L. theobromae 71.3a 72.6%ab 34.5a 36.8a Water-stressed Control 0.0b 0.0c 0.0b 0.0b L. theobromae 80.2a 83.7%a 40.0a 40.2a 2 L. theobromae inoculation seven days after water-stressed imposition Well-watered Control 0.0b 0.0c 0.0b 0.0b L. theobromae 71.2a 65.1%b 38.6a 32.7a Water-stressed Control 0.0b 0.0c 0.0b 0.0b L. theobromae 82.6a 87.3%a 42.4a 40.2a Tukey's test at α = 0.05 16.84 (**) 15.13% (**) 8.67 (**) 10.41 (**) Columns with the same letter do not differ significantly according to Tukey's test at α = 0.05. Table 4.
Vascular streaking length (mm) in the stem of MCC 02 cocoa clone inoculated with Lasiodiplodia theobromae simultaneous to water-stress imposition (Experiment 1) and 7 d after the initiation of water-stressed imposition (Experiment 2) with PDA as a control inoculum for 64 d.
Figures
(6)
Tables
(4)