-
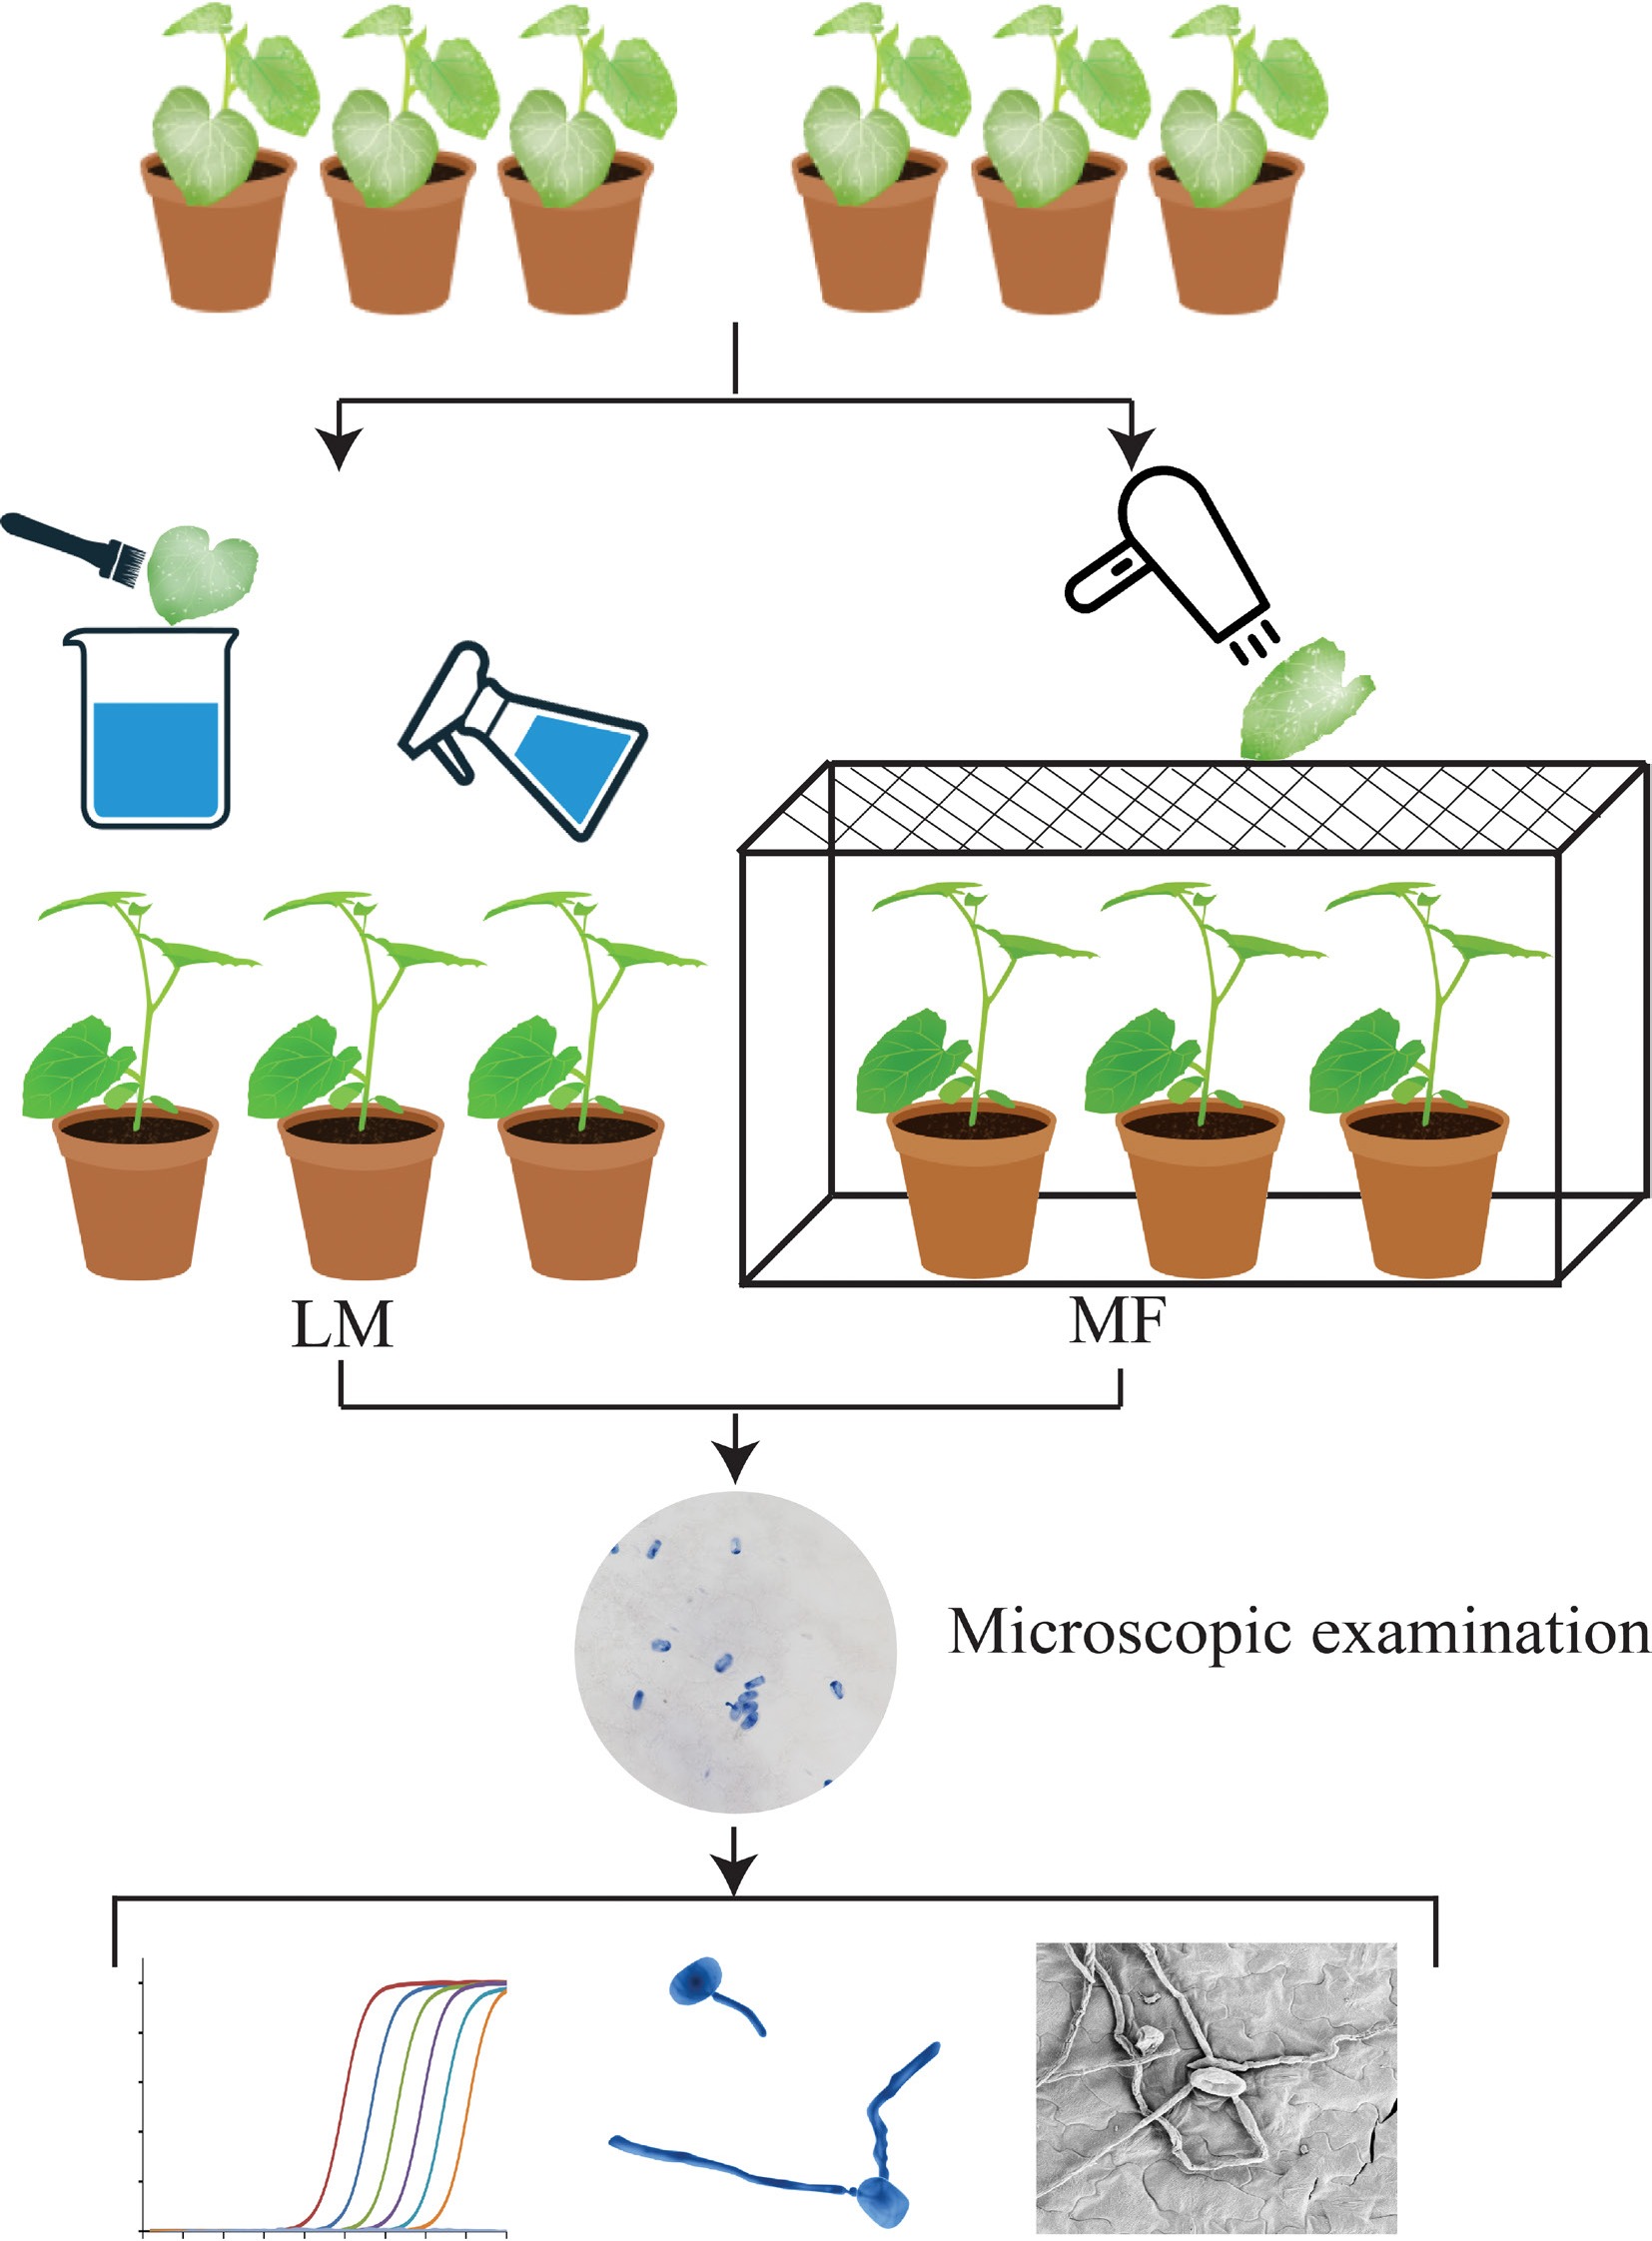
Figure 1.
Schematic illustration for liquid-mediated (LM) and medium-free (MF) inoculations that are used to investigate melon-powdery mildew interactions in this study.
-
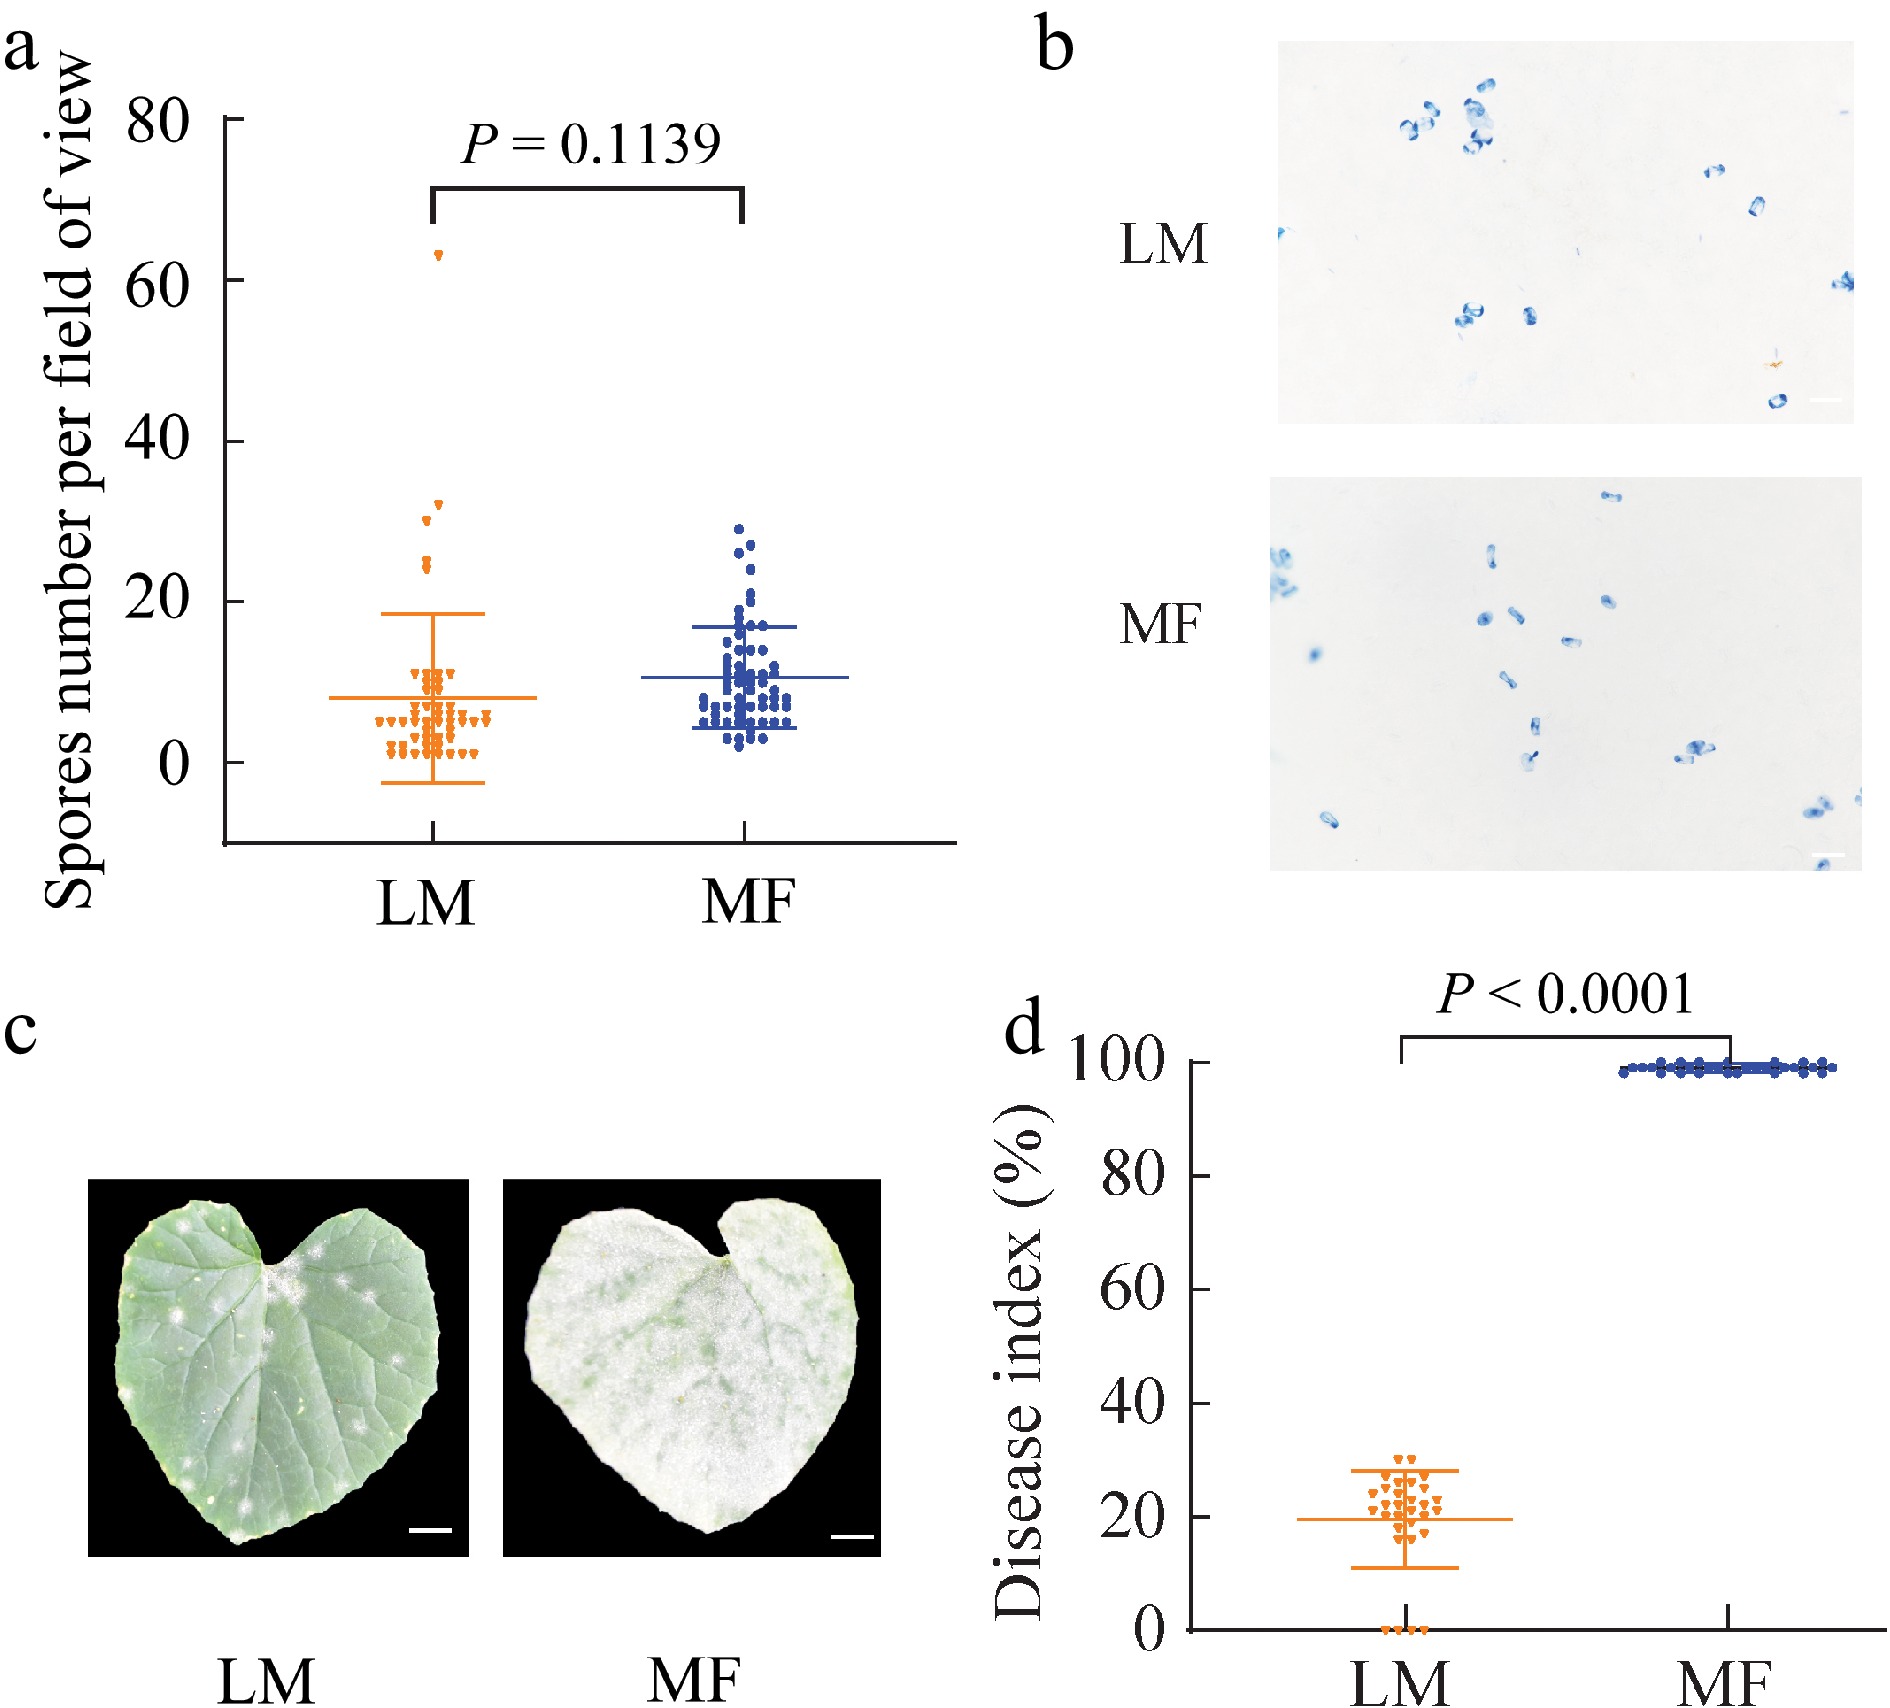
Figure 2.
Spore density, phenotypes and disease index on the leaves of melon seedlings infected by different methods. (a) Spore number on the leaves of melon seedlings immediately after being treated by liquid-mediated (LM) and medium-free (MF) inoculations. (b) Trypan blue staining for P. xanthii on the leaves of melon seedlings immediately after being treated by LM and MF inoculations. (c) Disease symptoms on the leaves of melon seedlings treated by LM and MF inoculations at 5 d post inoculation (DPI). (d) Disease index of melon seedlings treated by LM and MF inoculations at 5 DPI. The value of each group represents mean of (a) 50 or (d) 30 biological repeats ± standard deviations (SD). Scale bar is equal to (b) 200 μm or (c) 1 cm.
-
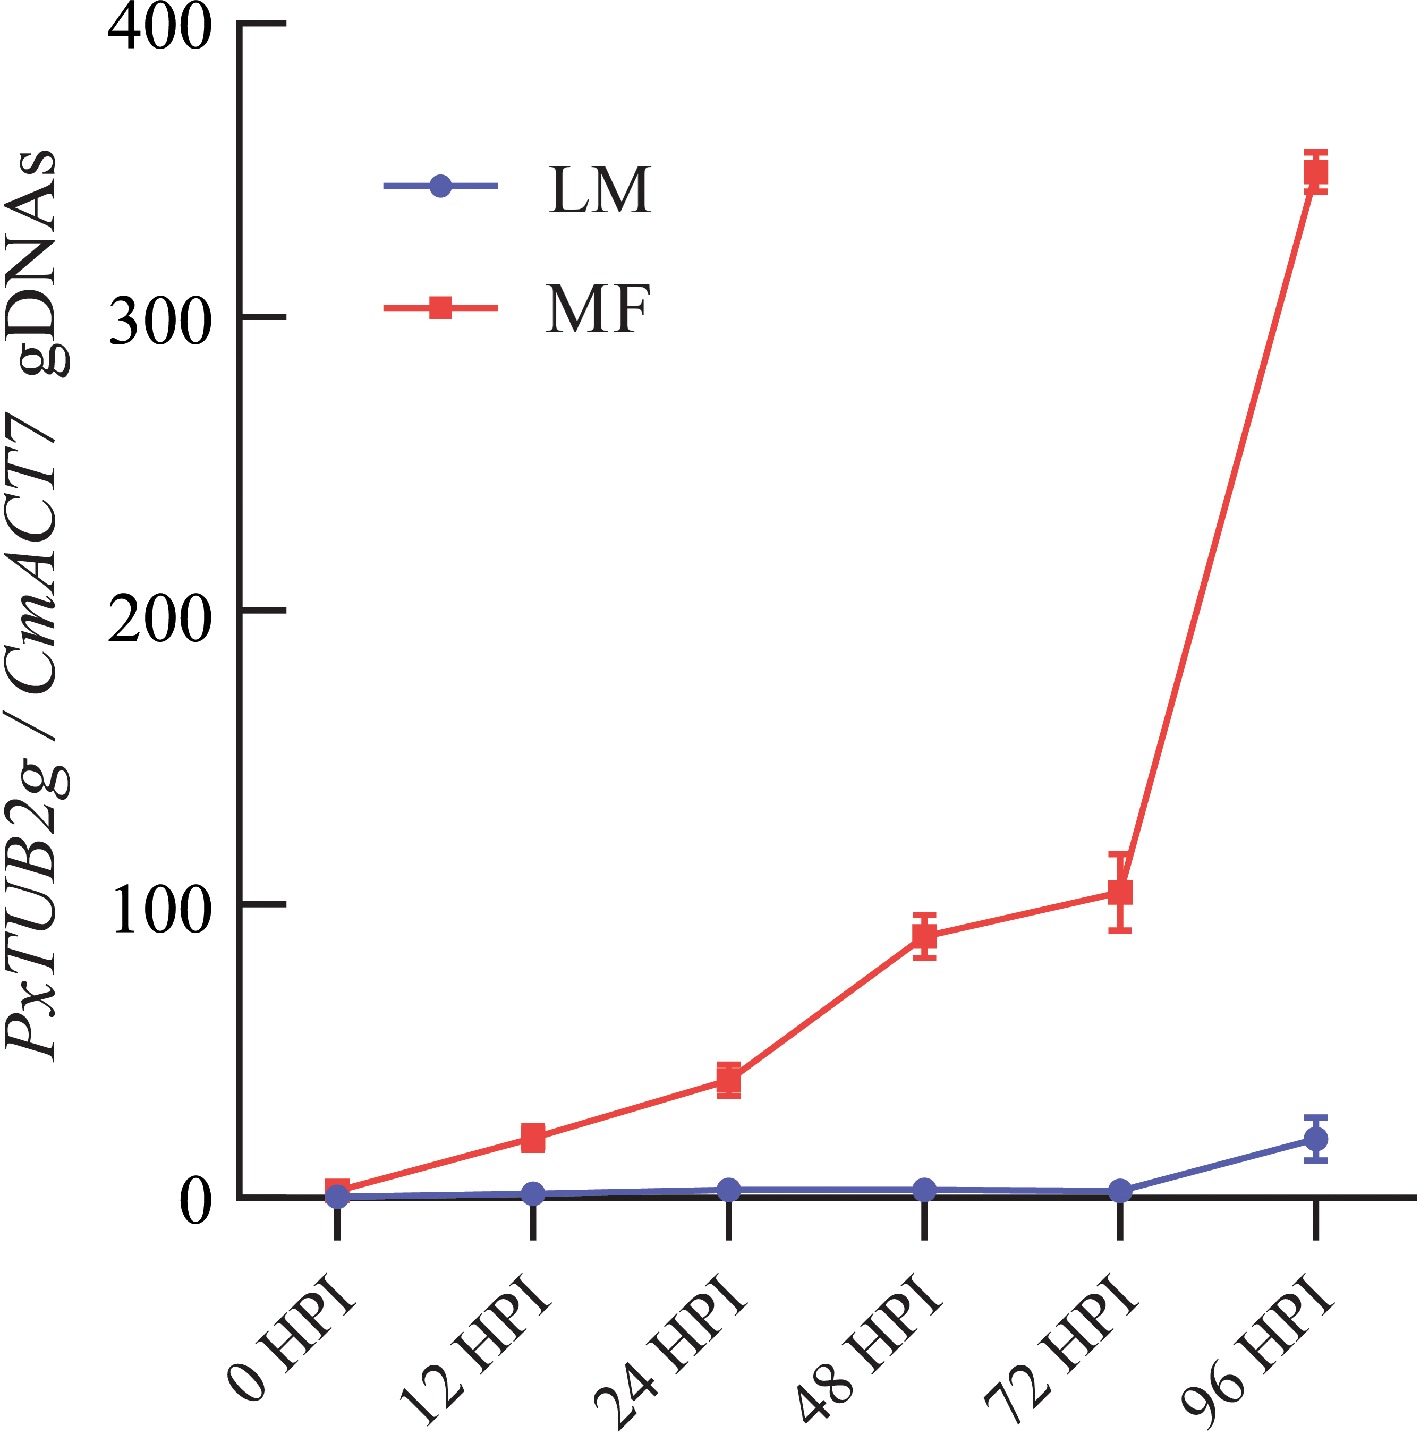
Figure 3.
Quantification of powdery mildew pathogens on the leaves of melon seedlings infected by different methods. The development of P. xanthii was quantitatively assayed by qPCR on the leaves of melon seedlings treated by liquid-mediated (LM) and medium-free (MF) inoculations at 0, 12, 24, 48, 72, and 96 h post inoculation (HPI), respectively. The value of each group represents mean of three biological repeats ± standard derivations (SD).
-
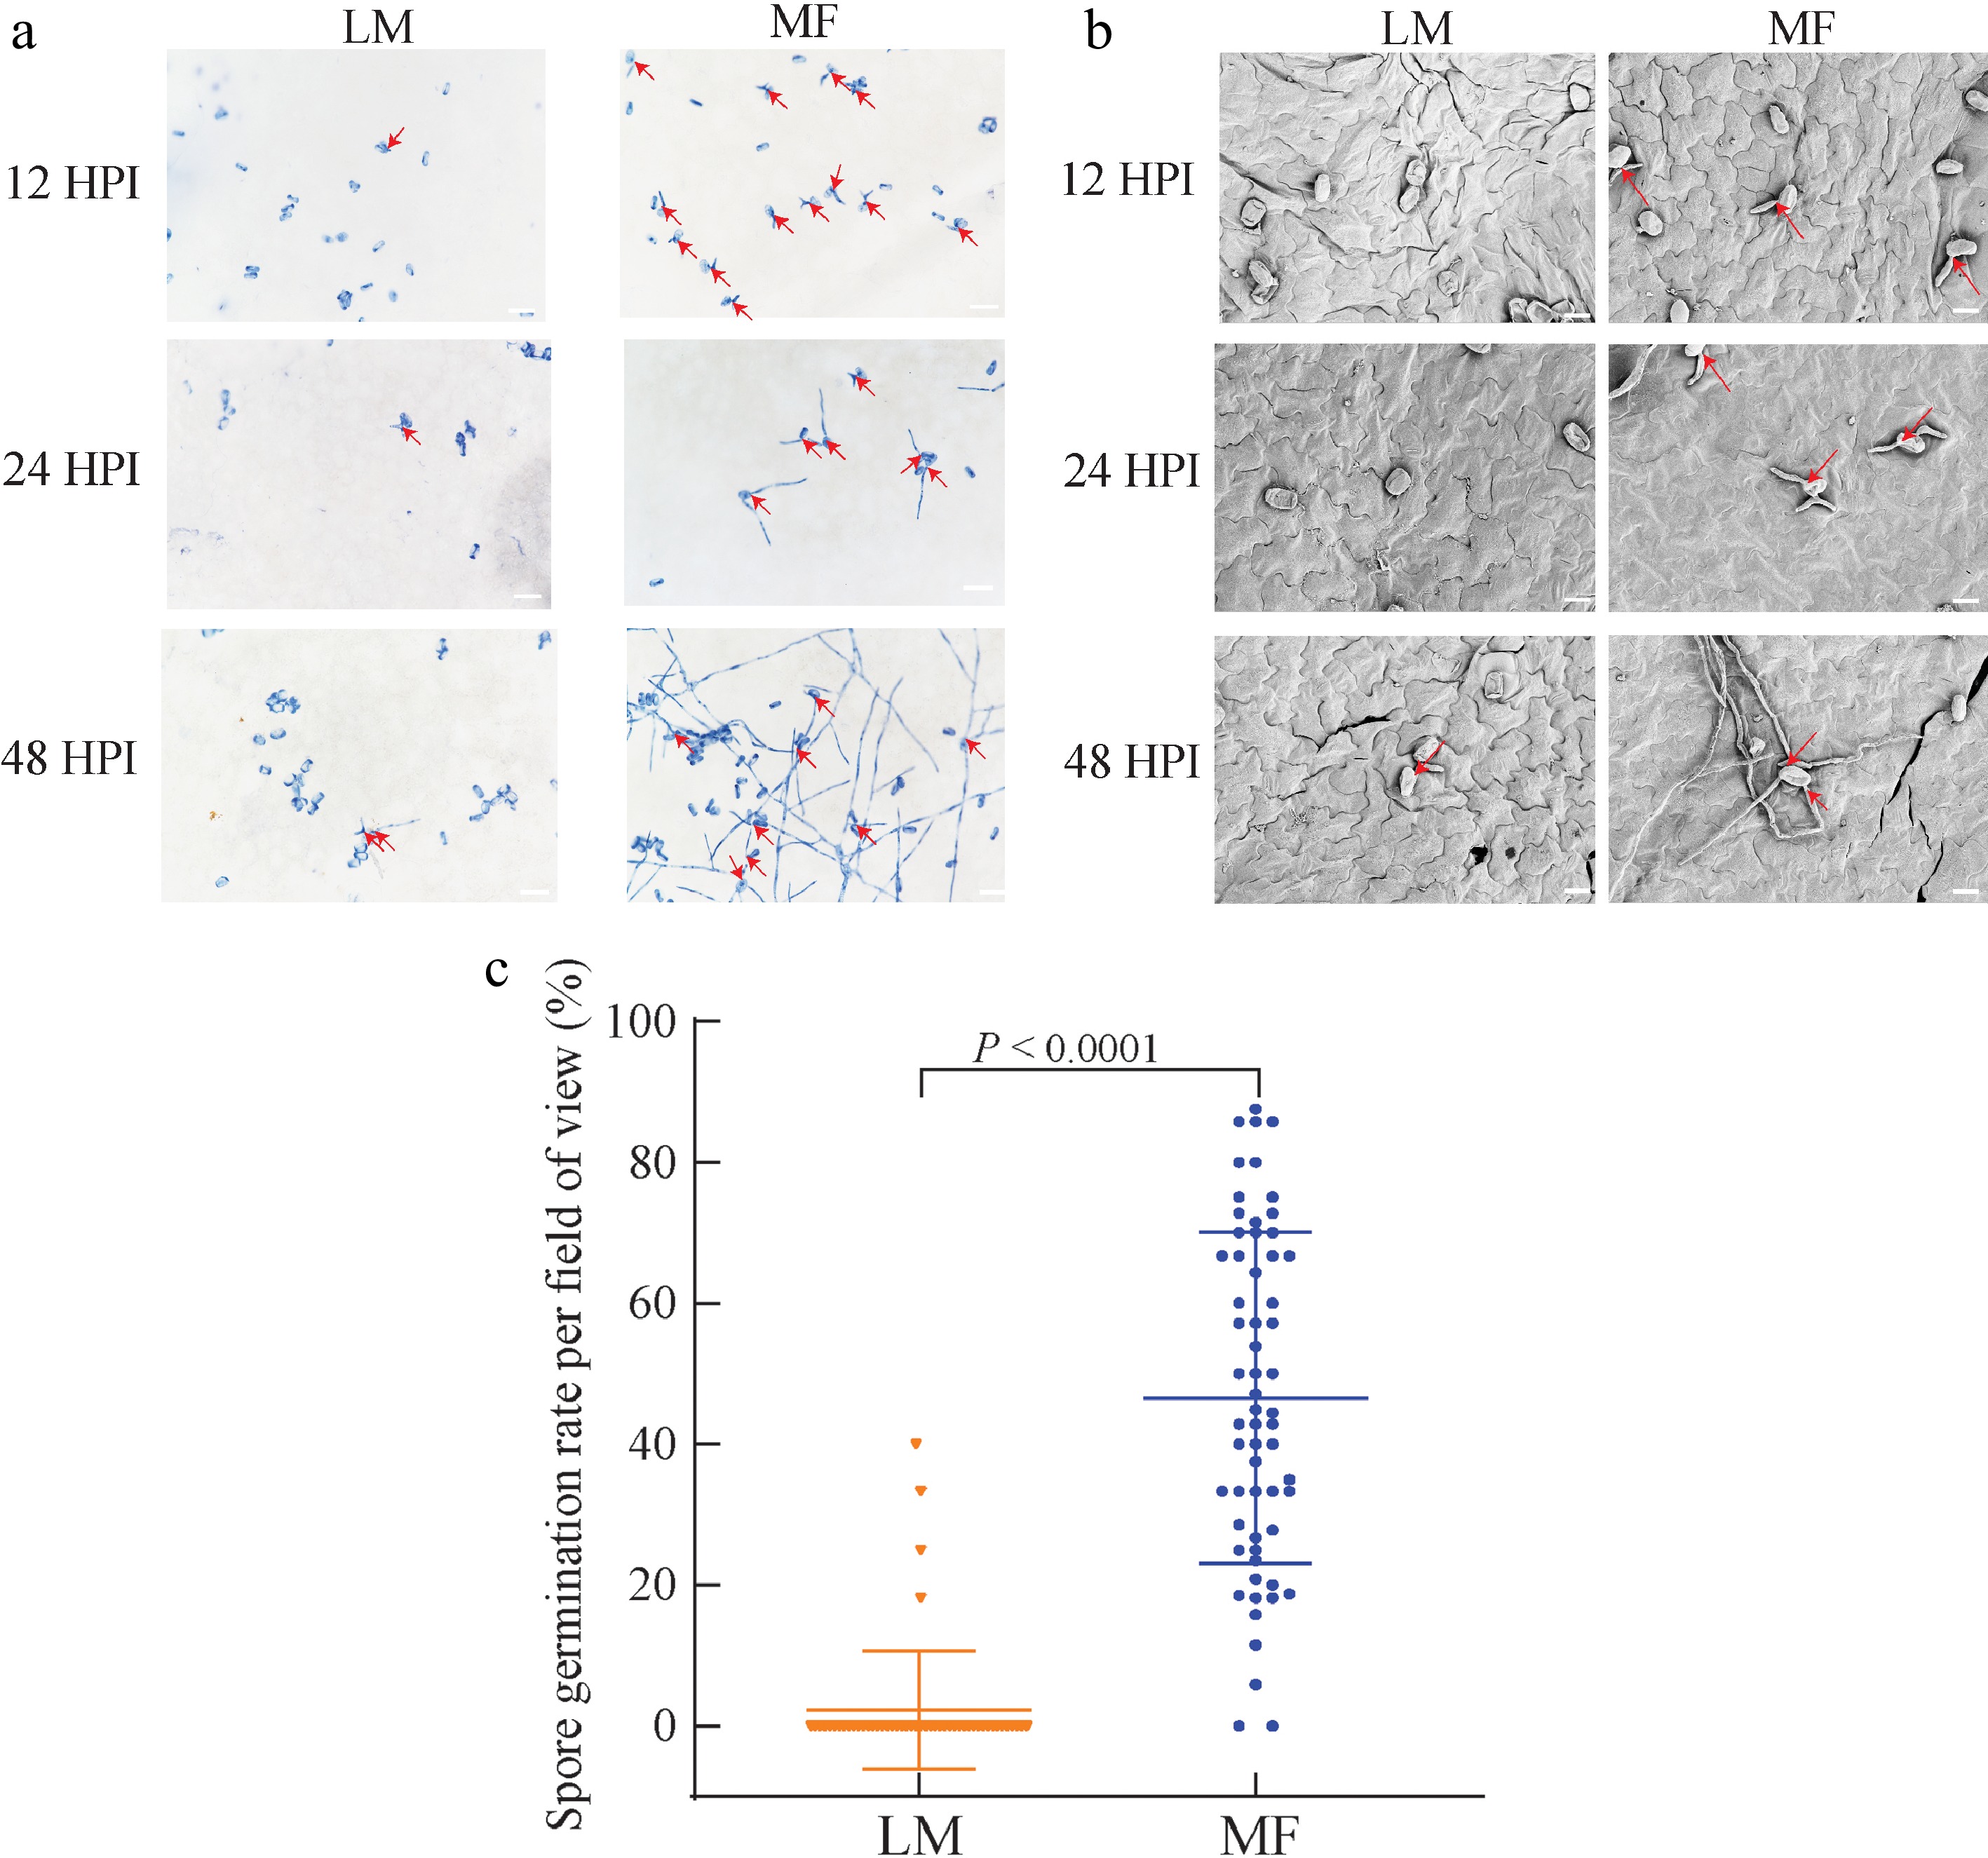
Figure 4.
Mildew pathogen development and spore germination on the leaves of melon seedlings infected by different methods. (a) Trypan blue staining for P. xanthii on the leaves of melon seedlings treated by liquid-mediated (LM) and medium-free (MF) inoculations at 12, 24, and 48 h post inoculation (HPI). (b) Scanning electron microscope (SEM) investigation for P. xanthii on the leaves of melon seedlings treated by LM and MF inoculations at 12, 24, and 48 HPI. (c) Spore germination on the leaves of melon seedlings treated by LM and MF inoculations at 96 HPI. The value of each group represents mean of 60 biological repeats ± standard deviations (SD). Scale bar is equal to (a) 200 μm or (b) 20 μm.
-
Gene ID Forward (5'→3') Reverse (5'→3') PxTUB2g TTGTAGGAATCACATCCC
TTTCTCTTCTTCCGGTTGCATGGGT
GGTTCCmACT7 GGCTGGATTTGCCGGTGA
TGATGCGGAAGGAGGAAATCAGTGT
GAACCTable 1.
Primers for qPCR assay of powdery mildew biomass.
Figures
(4)
Tables
(1)