-
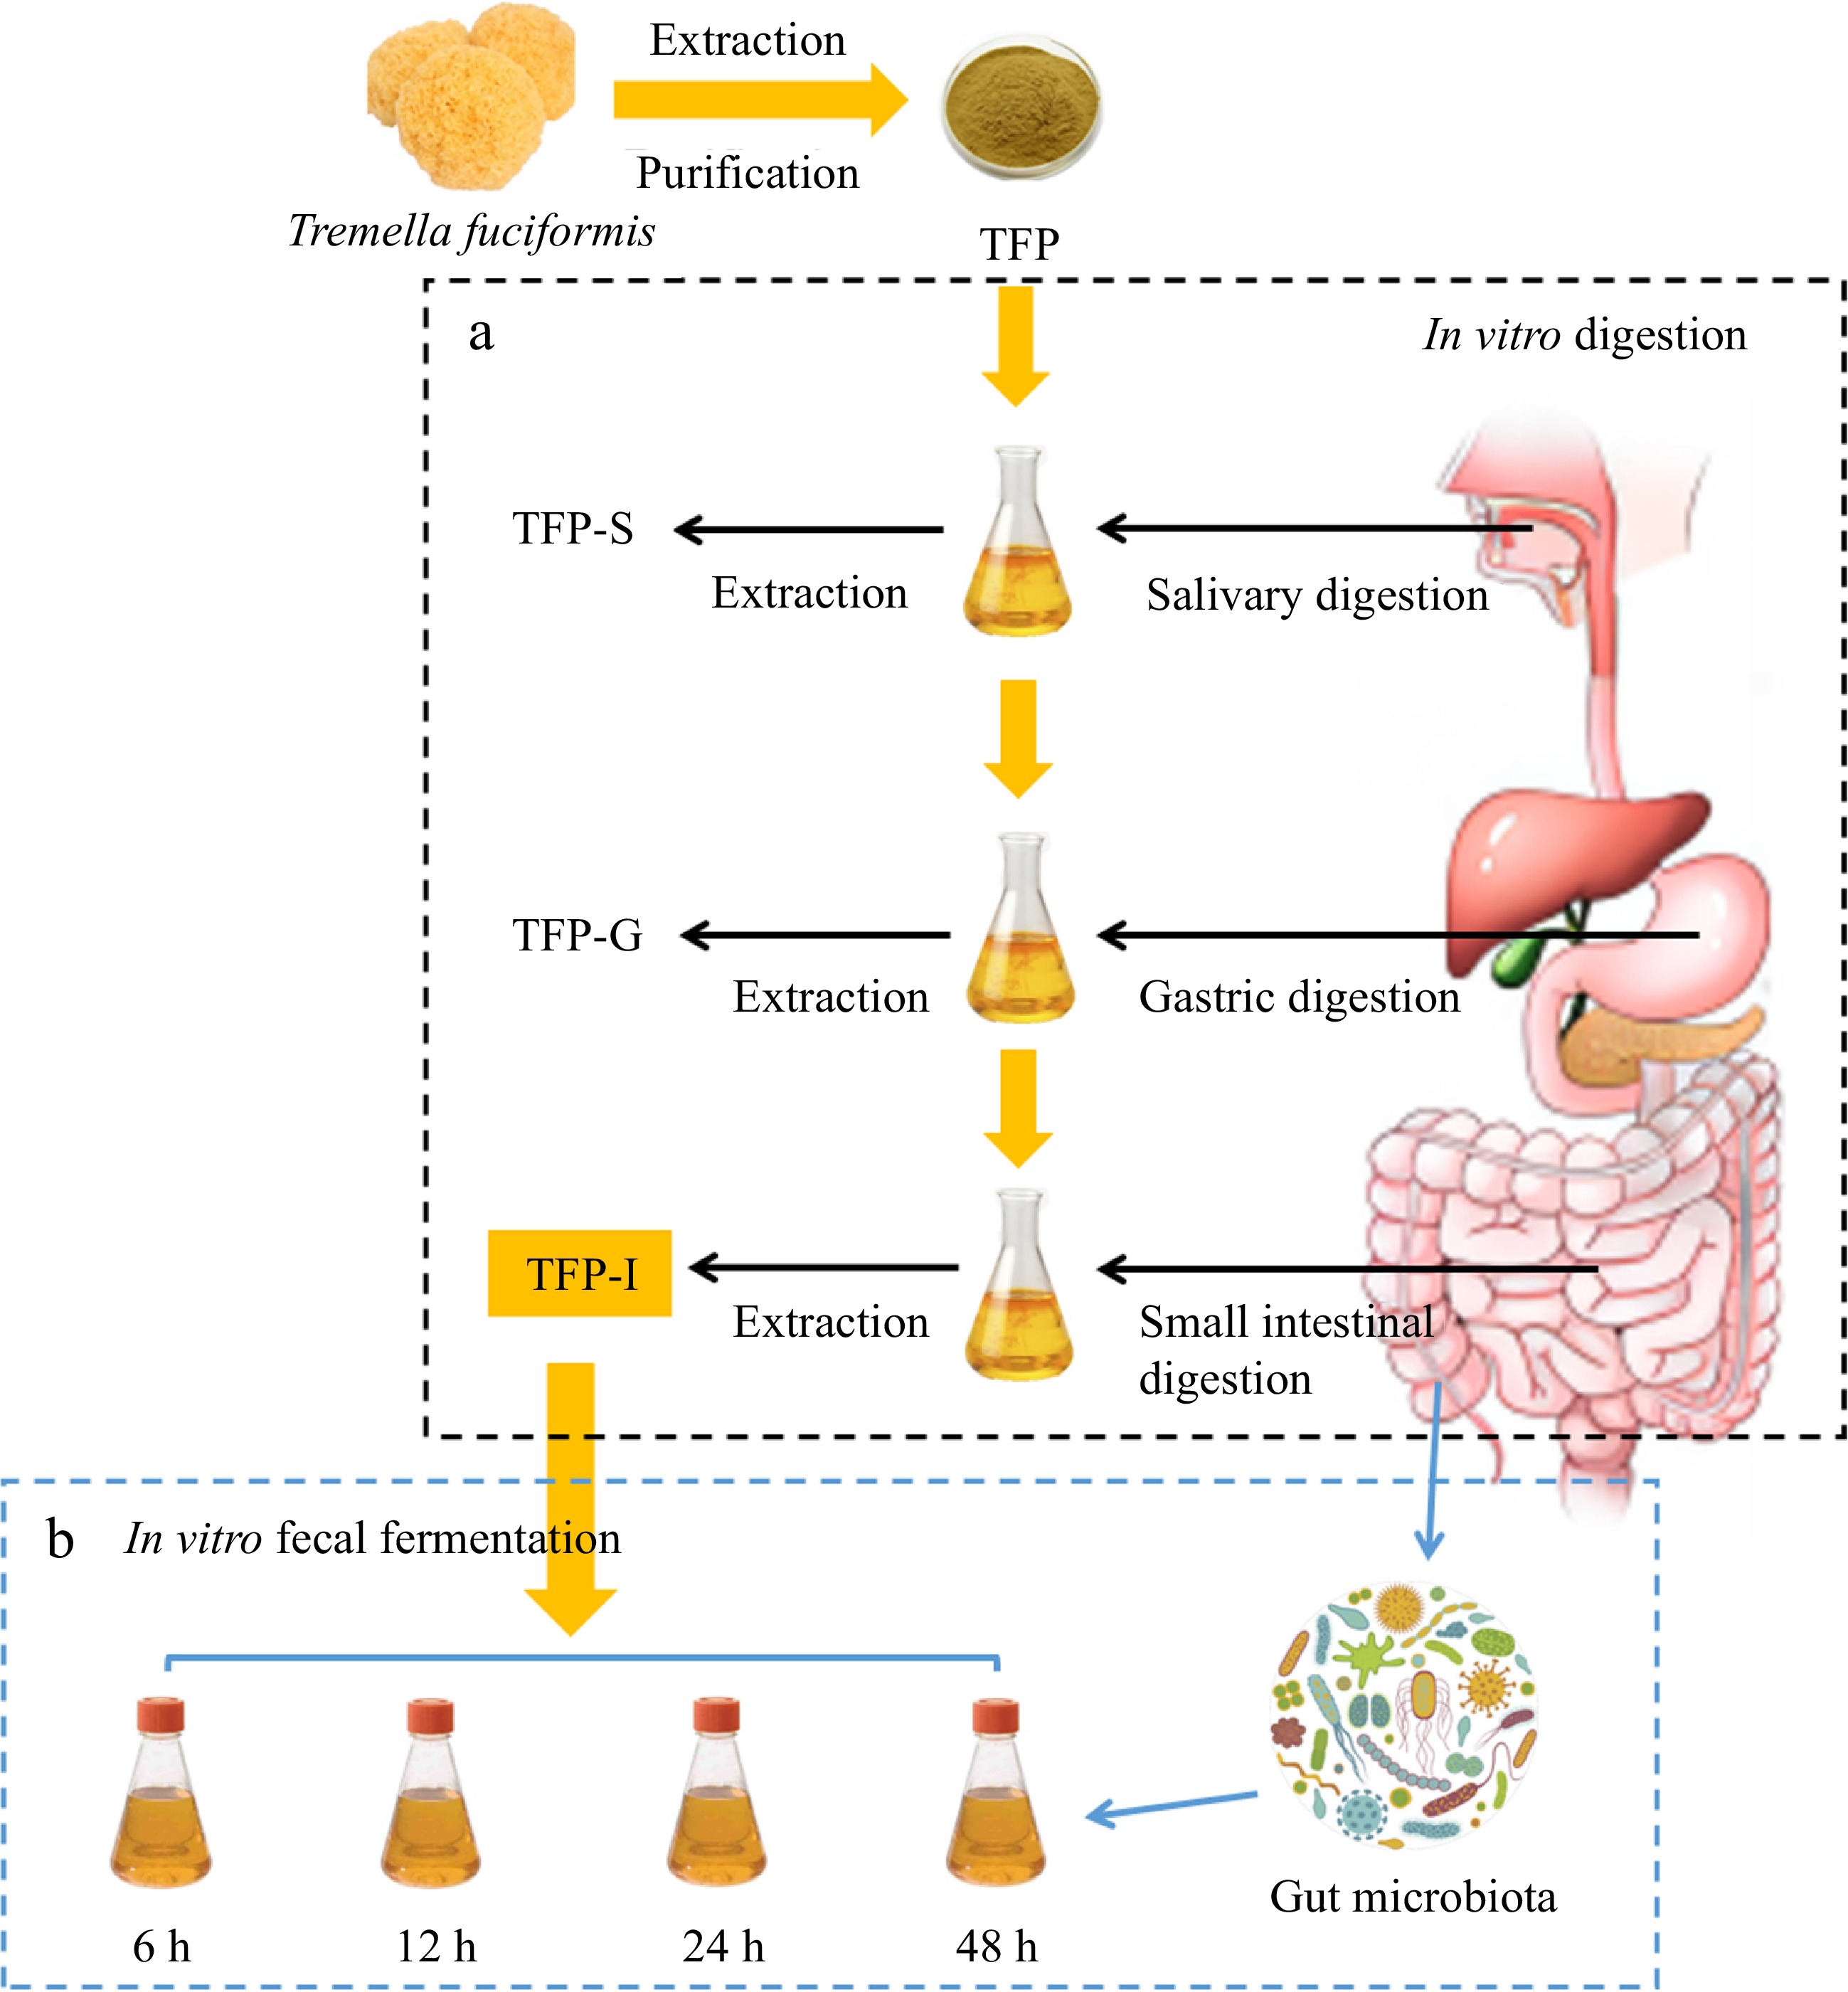
Figure 1.
Flow diagram of (a) in vitro digestion and (b) fecal fermentation method of TFP.
-
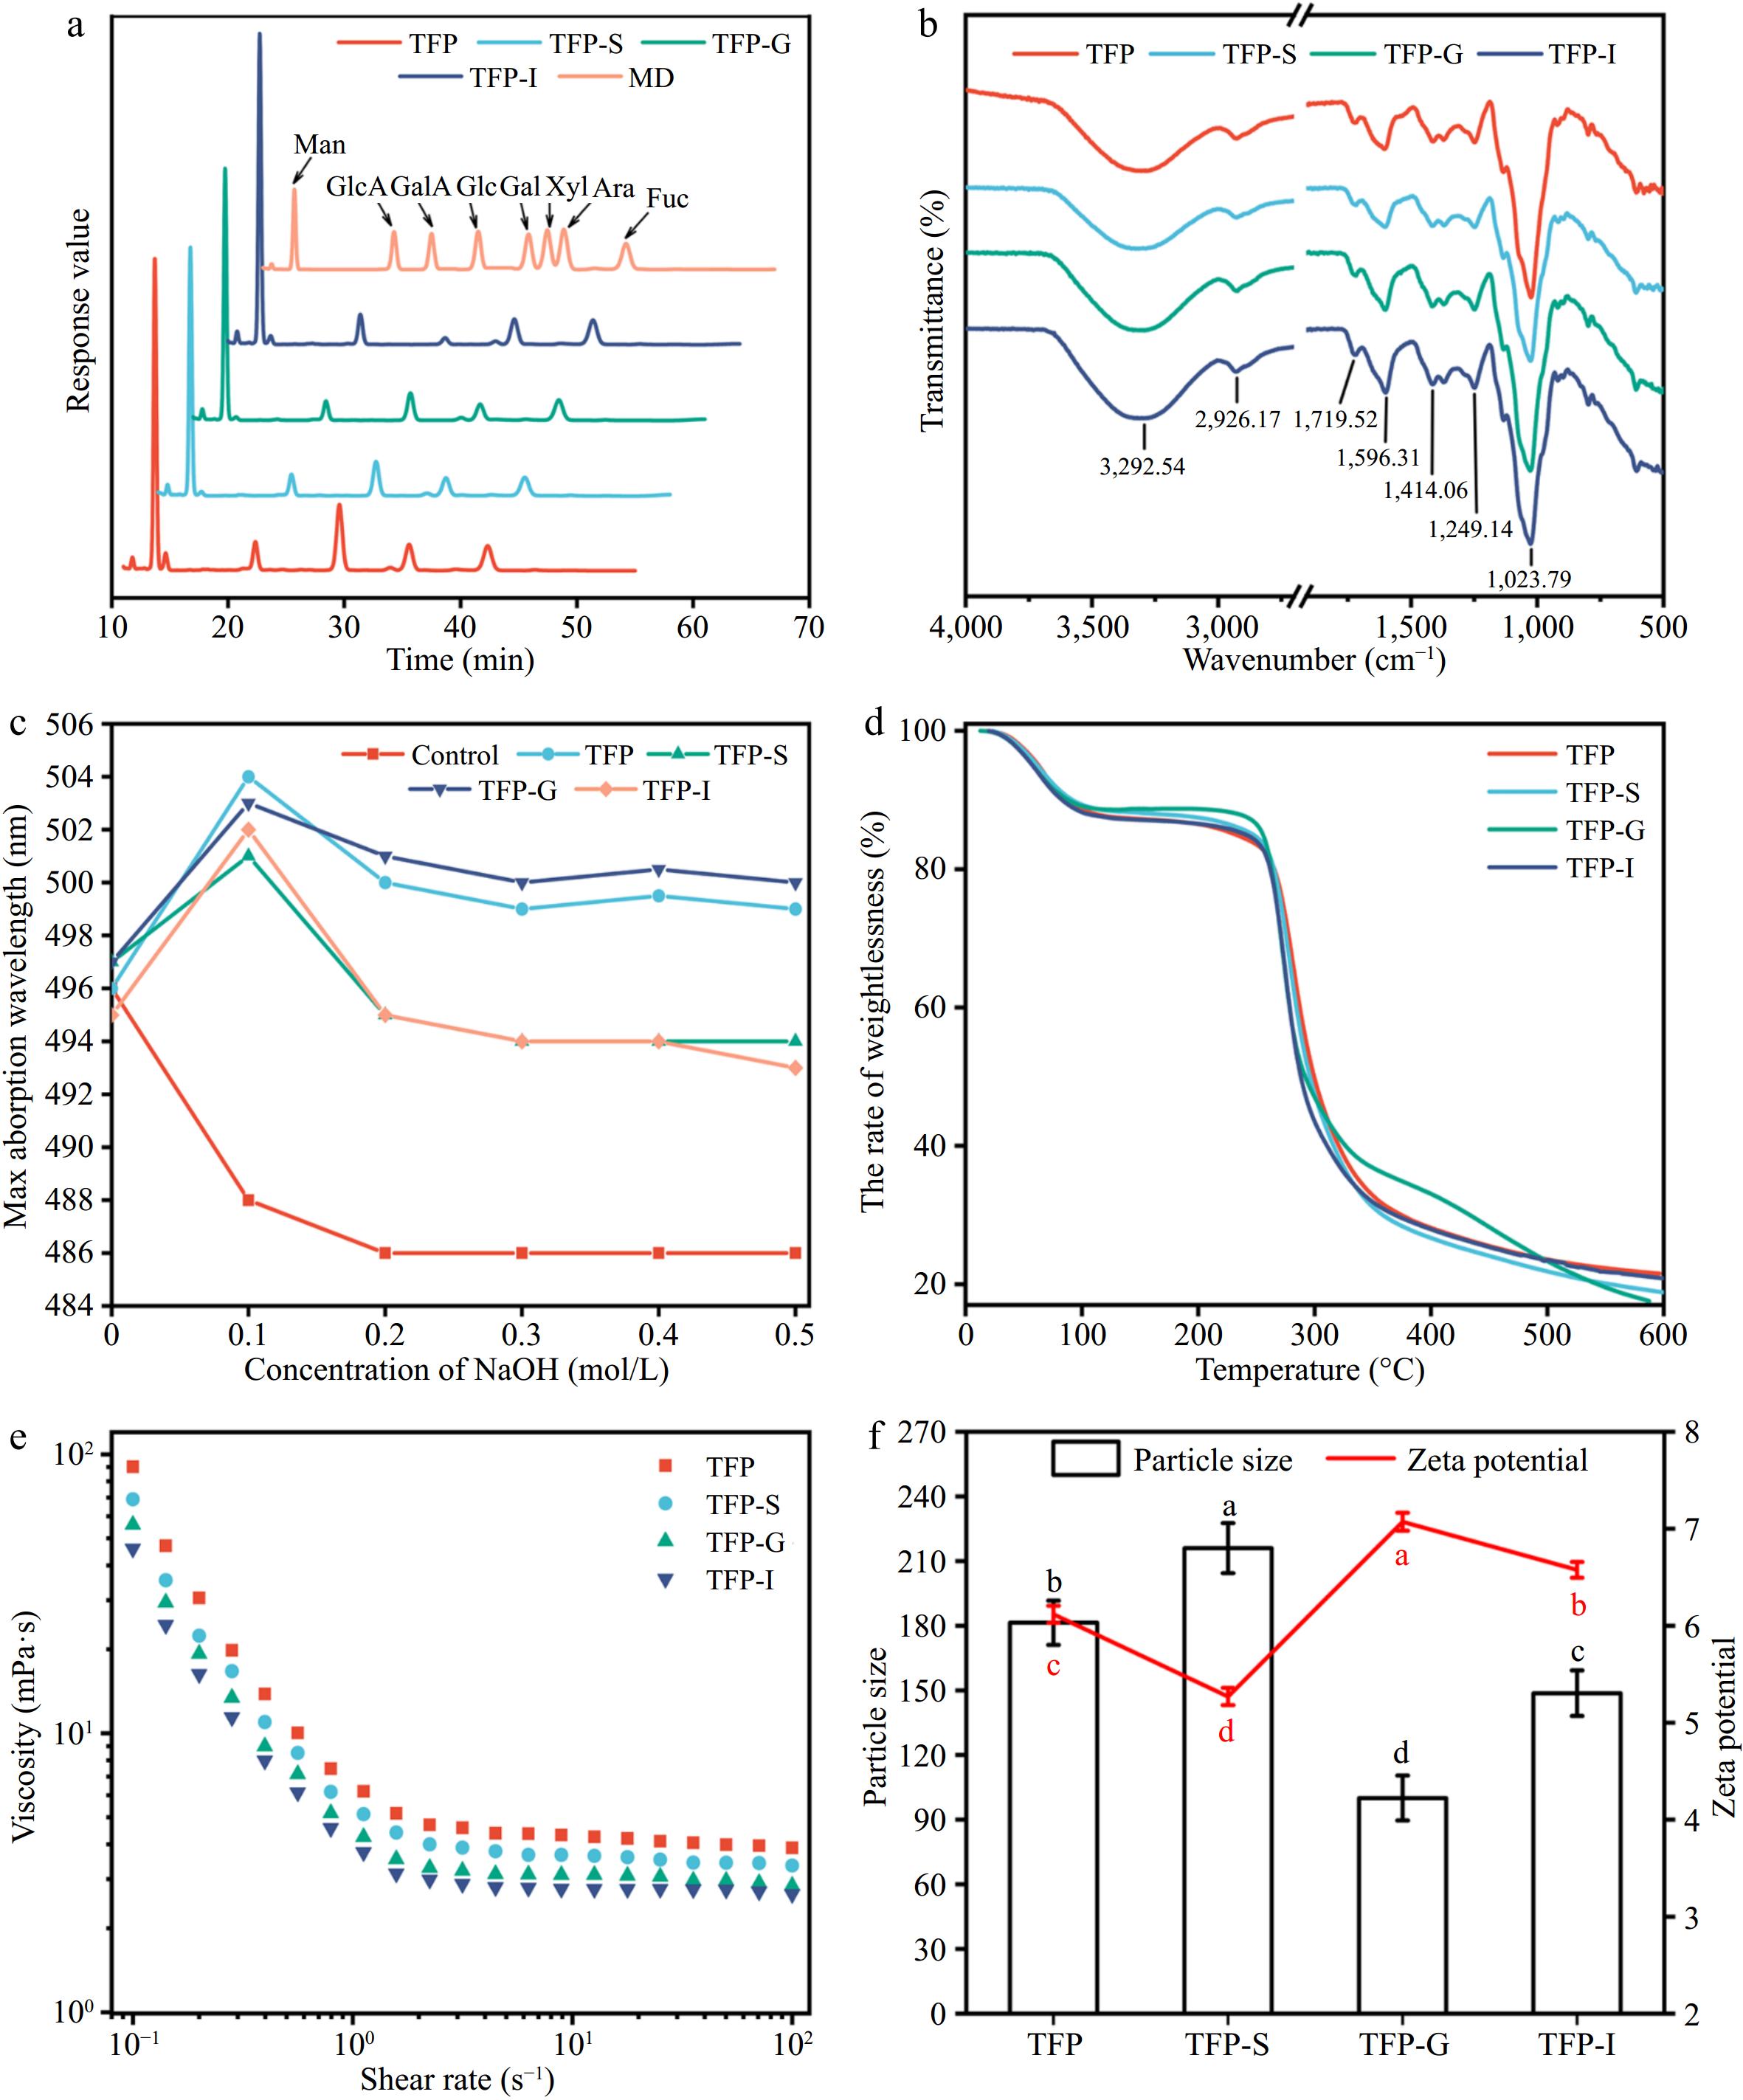
Figure 2.
Variations in structural characterizations of TFP during in vitro digestion. (a) Monosaccharide composition. (b) FT-IR. (c) Congo red staining. (d) Thermogravimetric curve. (e) Rheological properties. (f) Particle size and zeta potential.
-

Figure 3.
Variations in CR, pH, residual carbohydrates and gas production during in vitro fermentation of TFP. (a) Total carbohydrates. (b) Reducing sugars. (c) pH value. (d) The amount of gas produced.
-
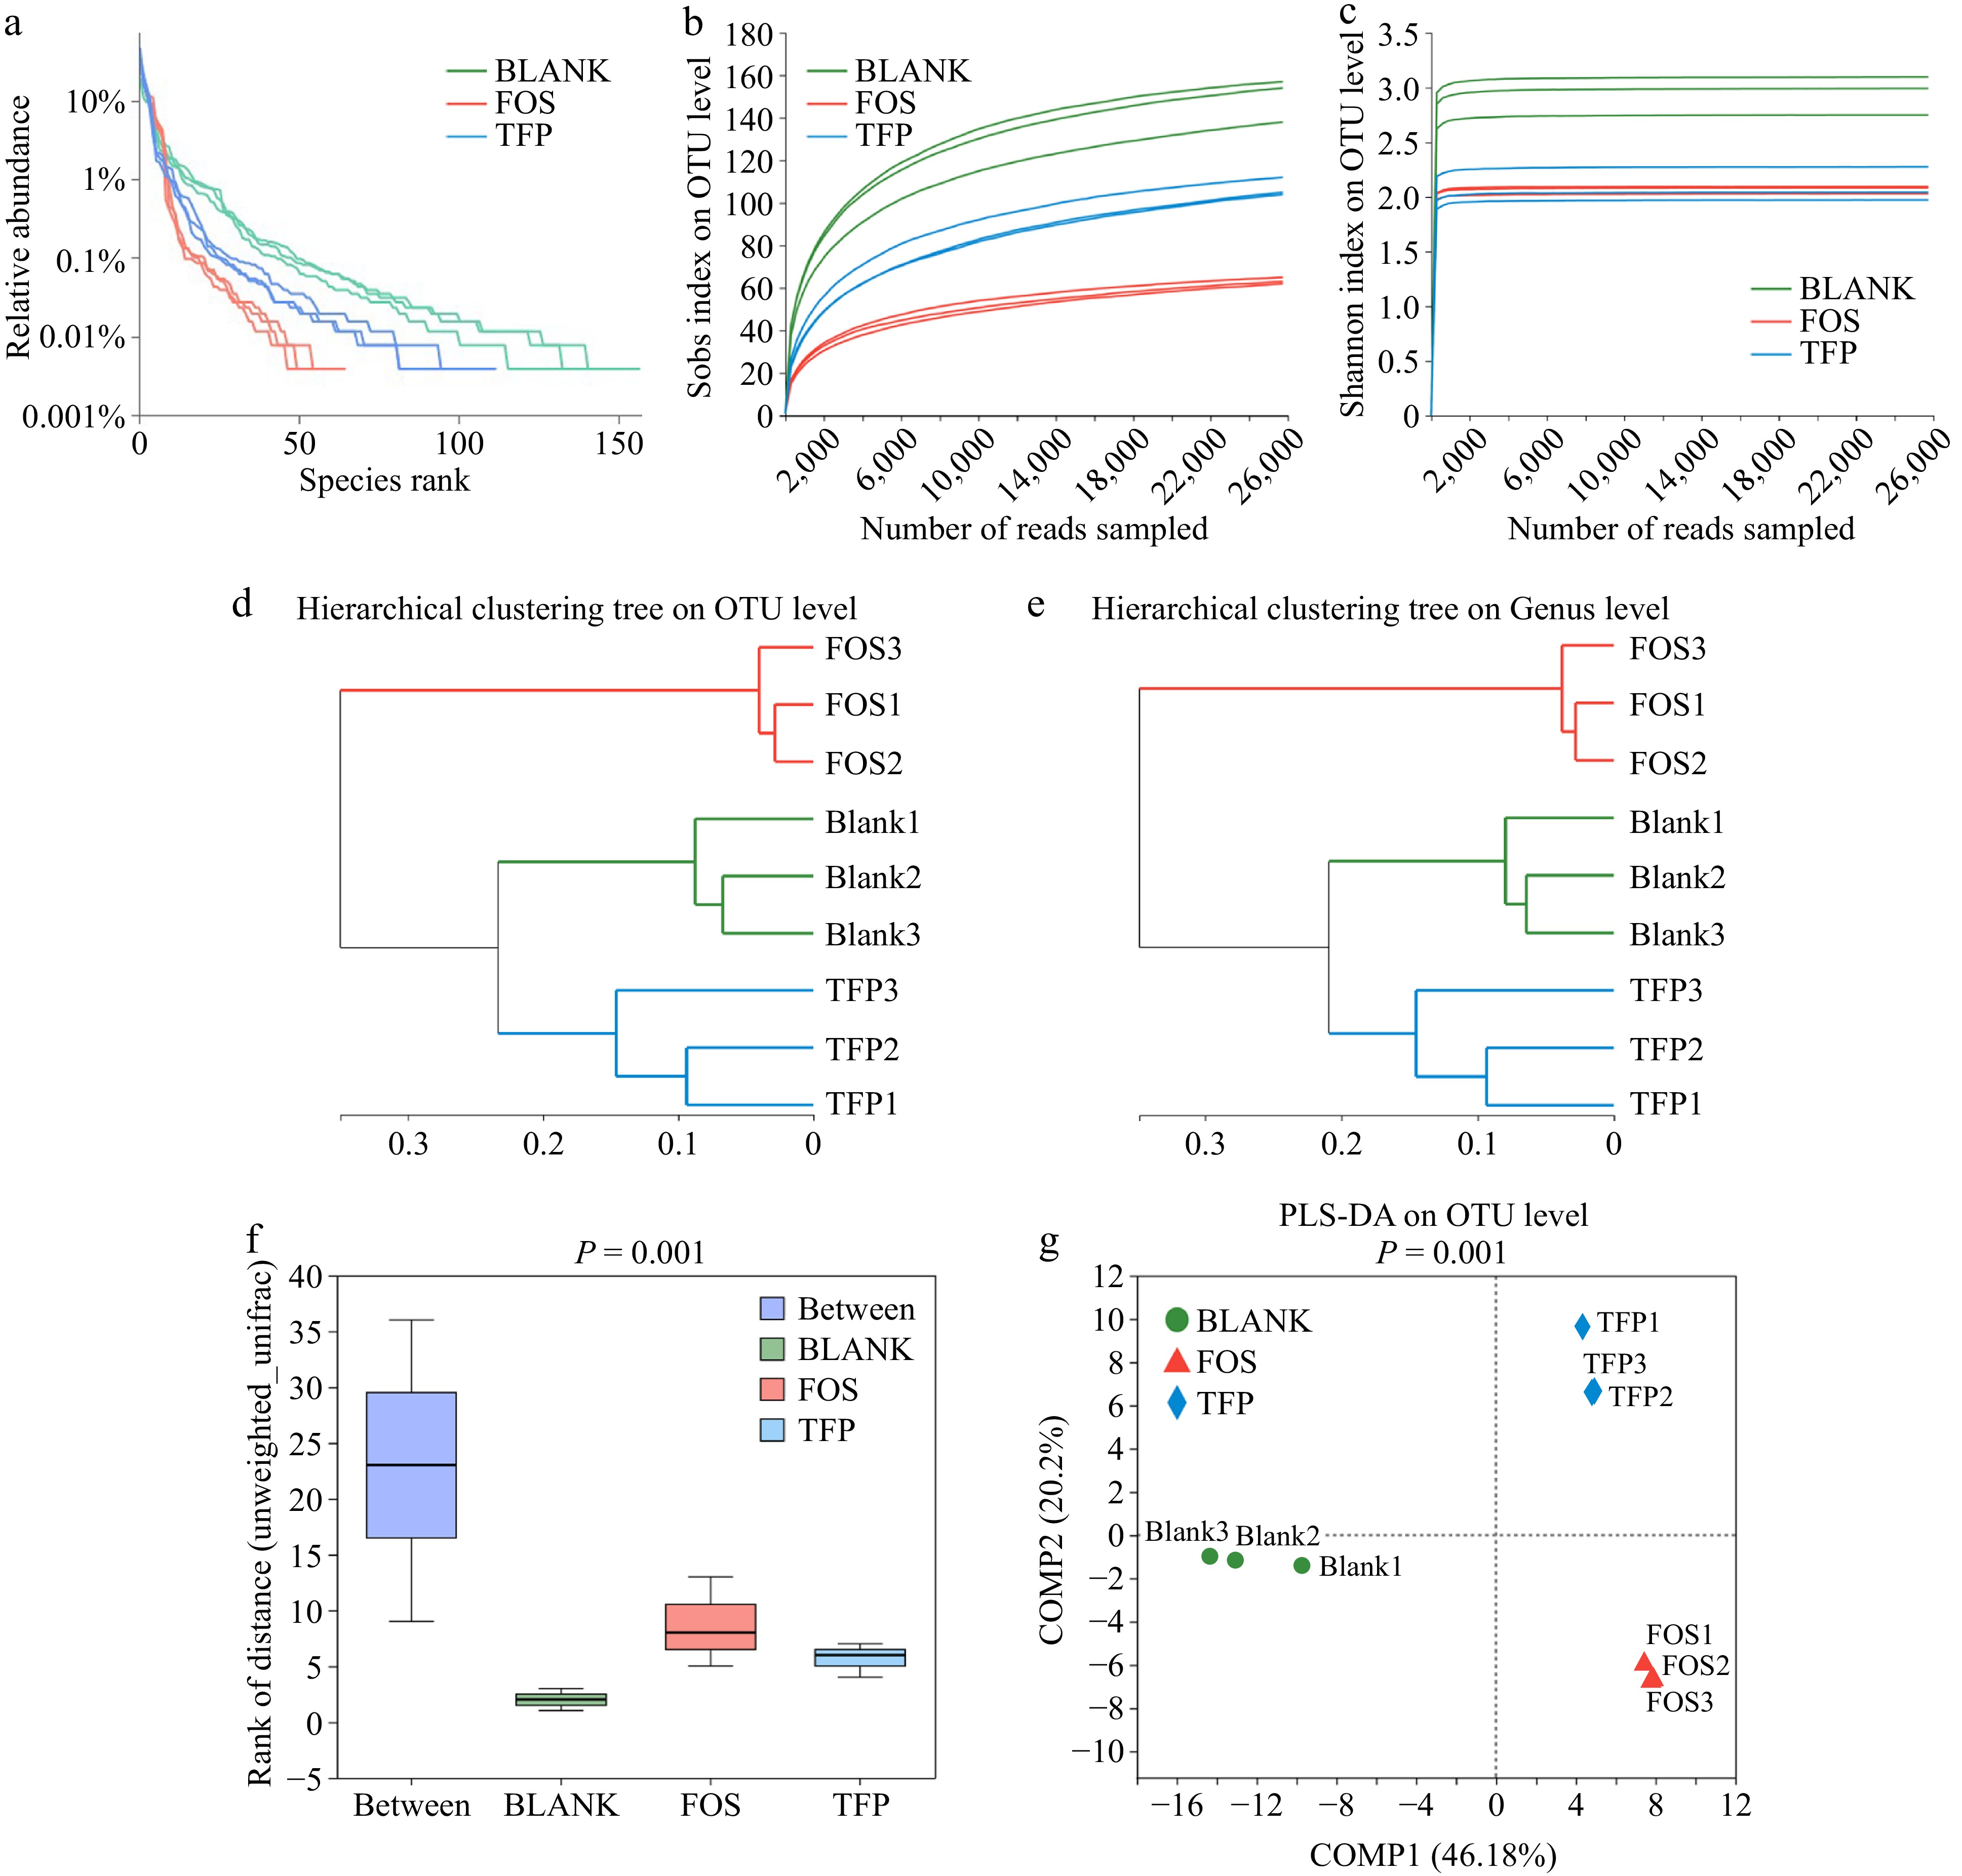
Figure 4.
Correlation curve of species diversity and between-group similarity analysis of gut microflora in vitro fermentation for 48 h. (a) Rank-Abundance curve. (b), (c) Rarefaction curve. (d), (e) Hierarchical clustering tree based on OUT and Genus levels. (f) ANOSIM/Adonis analysis. (g) PLS-DA analysis.
-
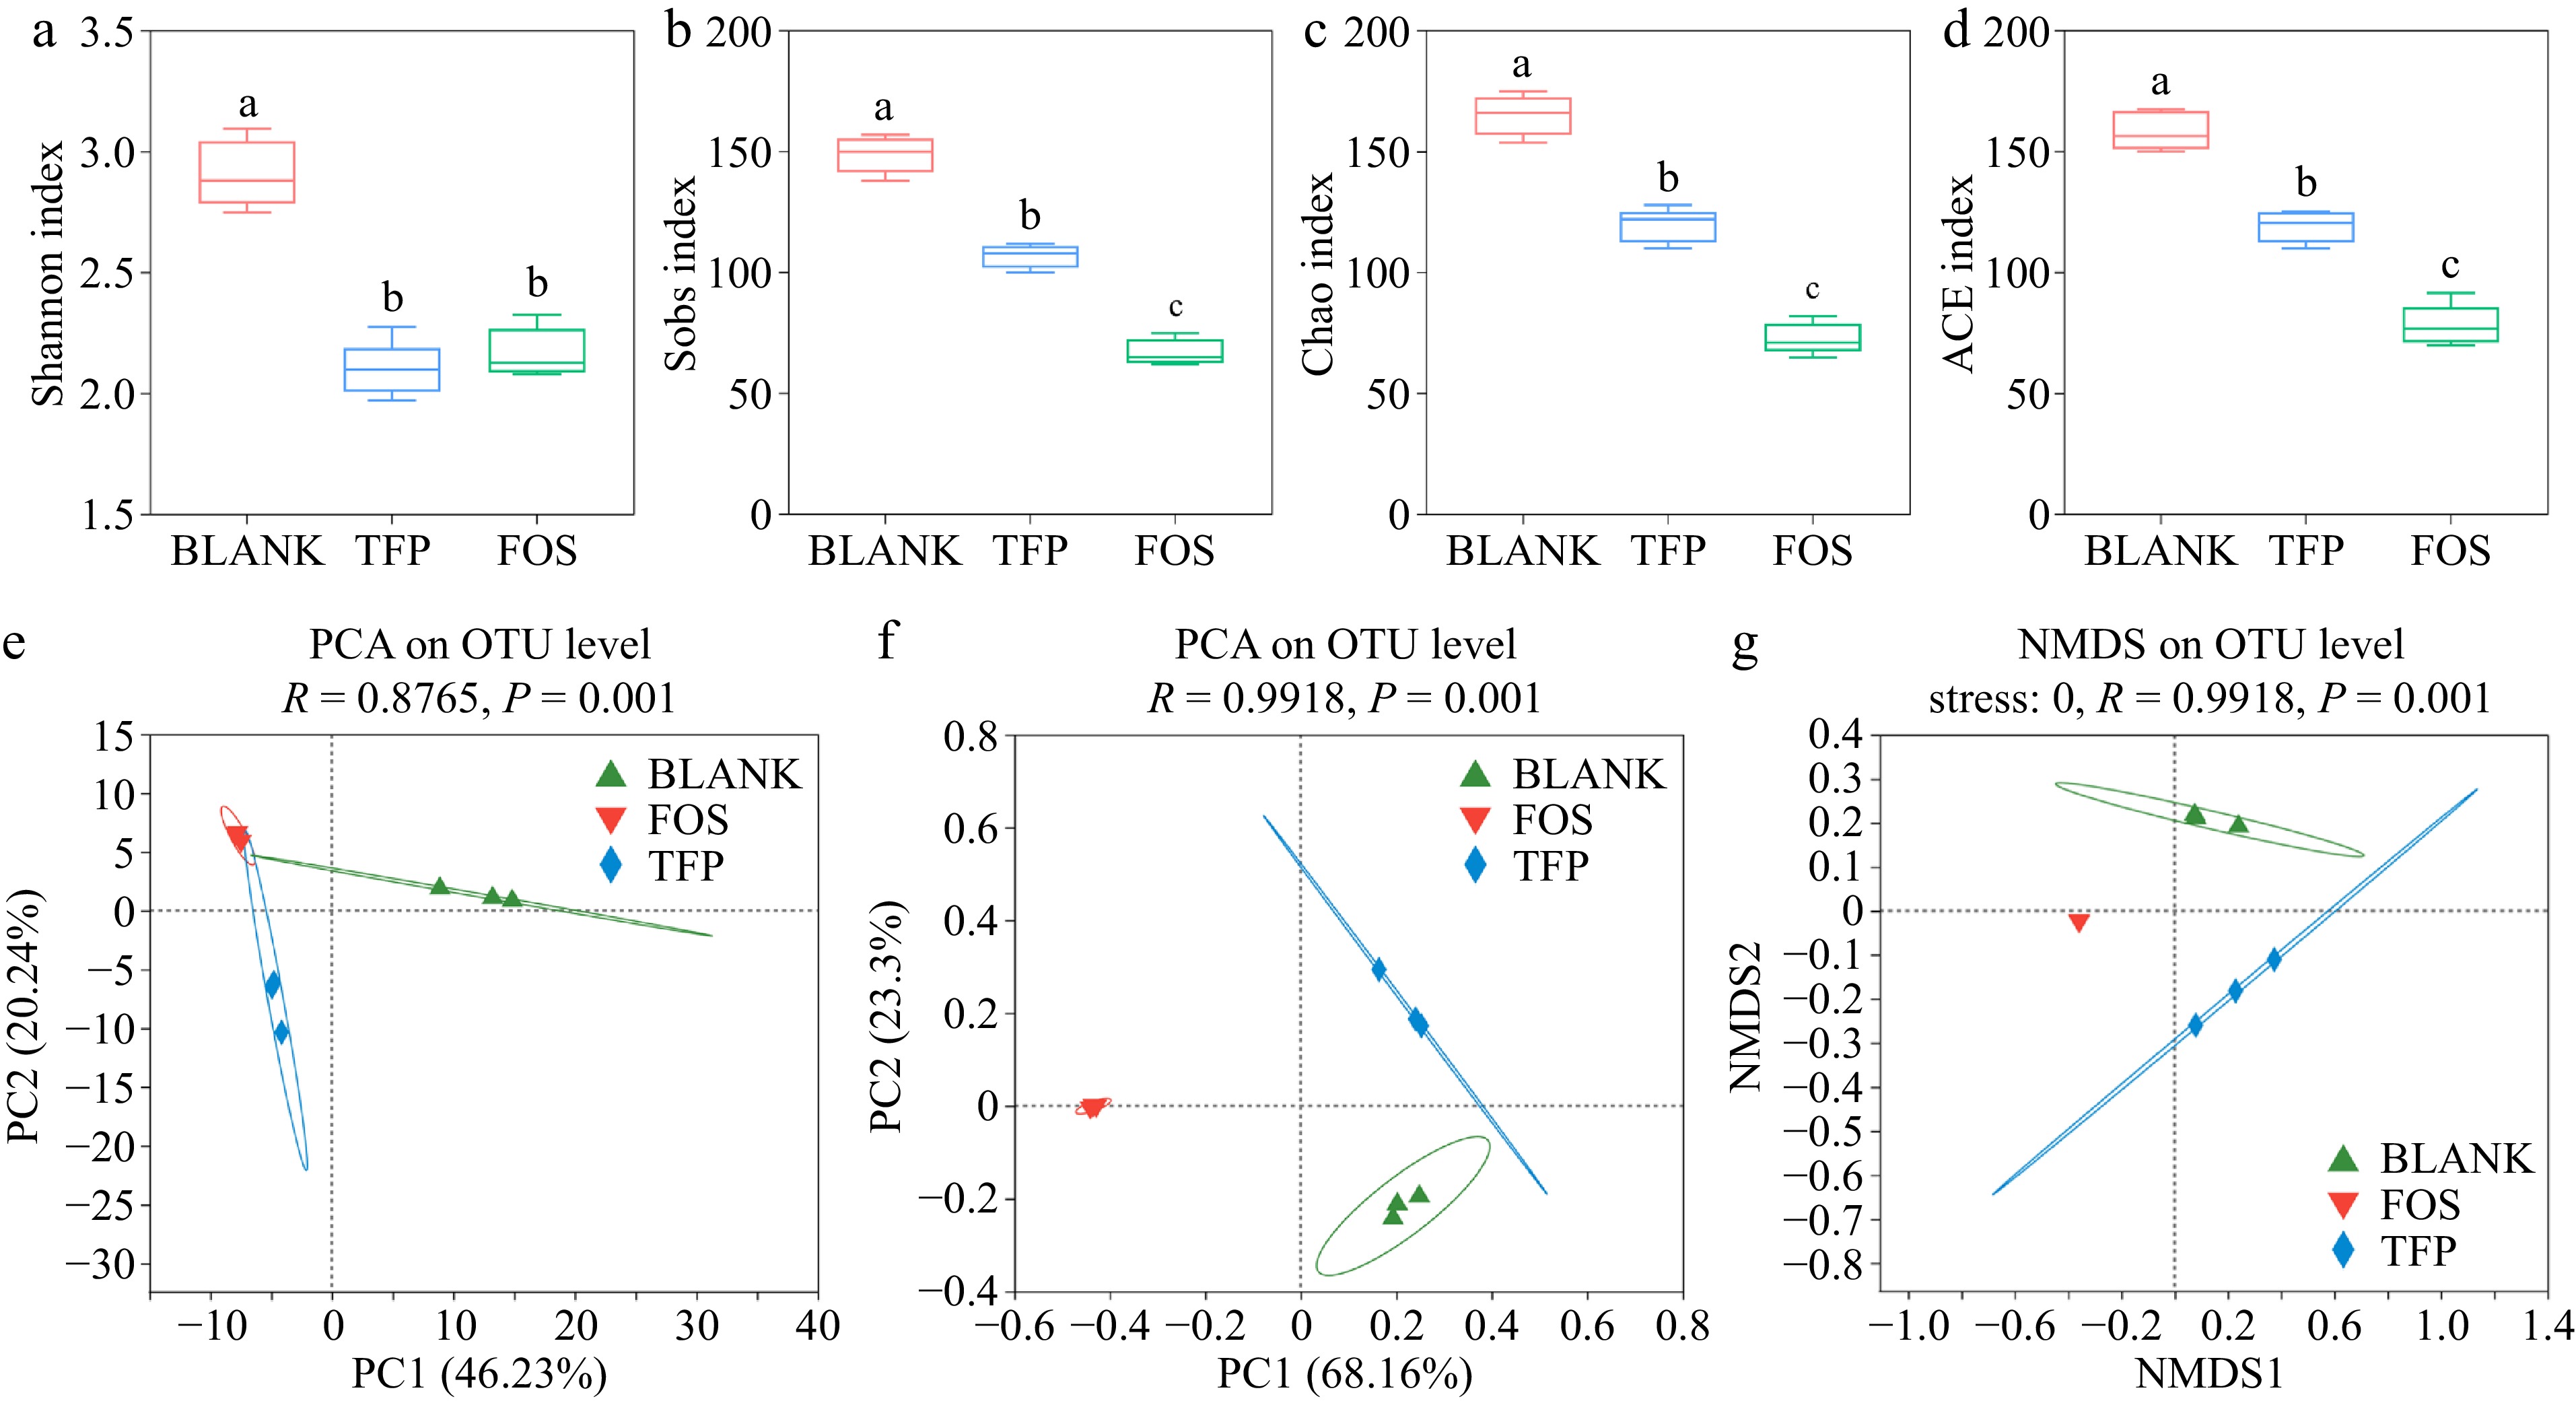
Figure 5.
Analysis of α and β diversity after 48 h of fermentation in vitro in the gut microbial community. (a)-(d) α diversity indices. (e) PCA analysis. (f) PCoA analysis. (g) NMDS analysis.
-
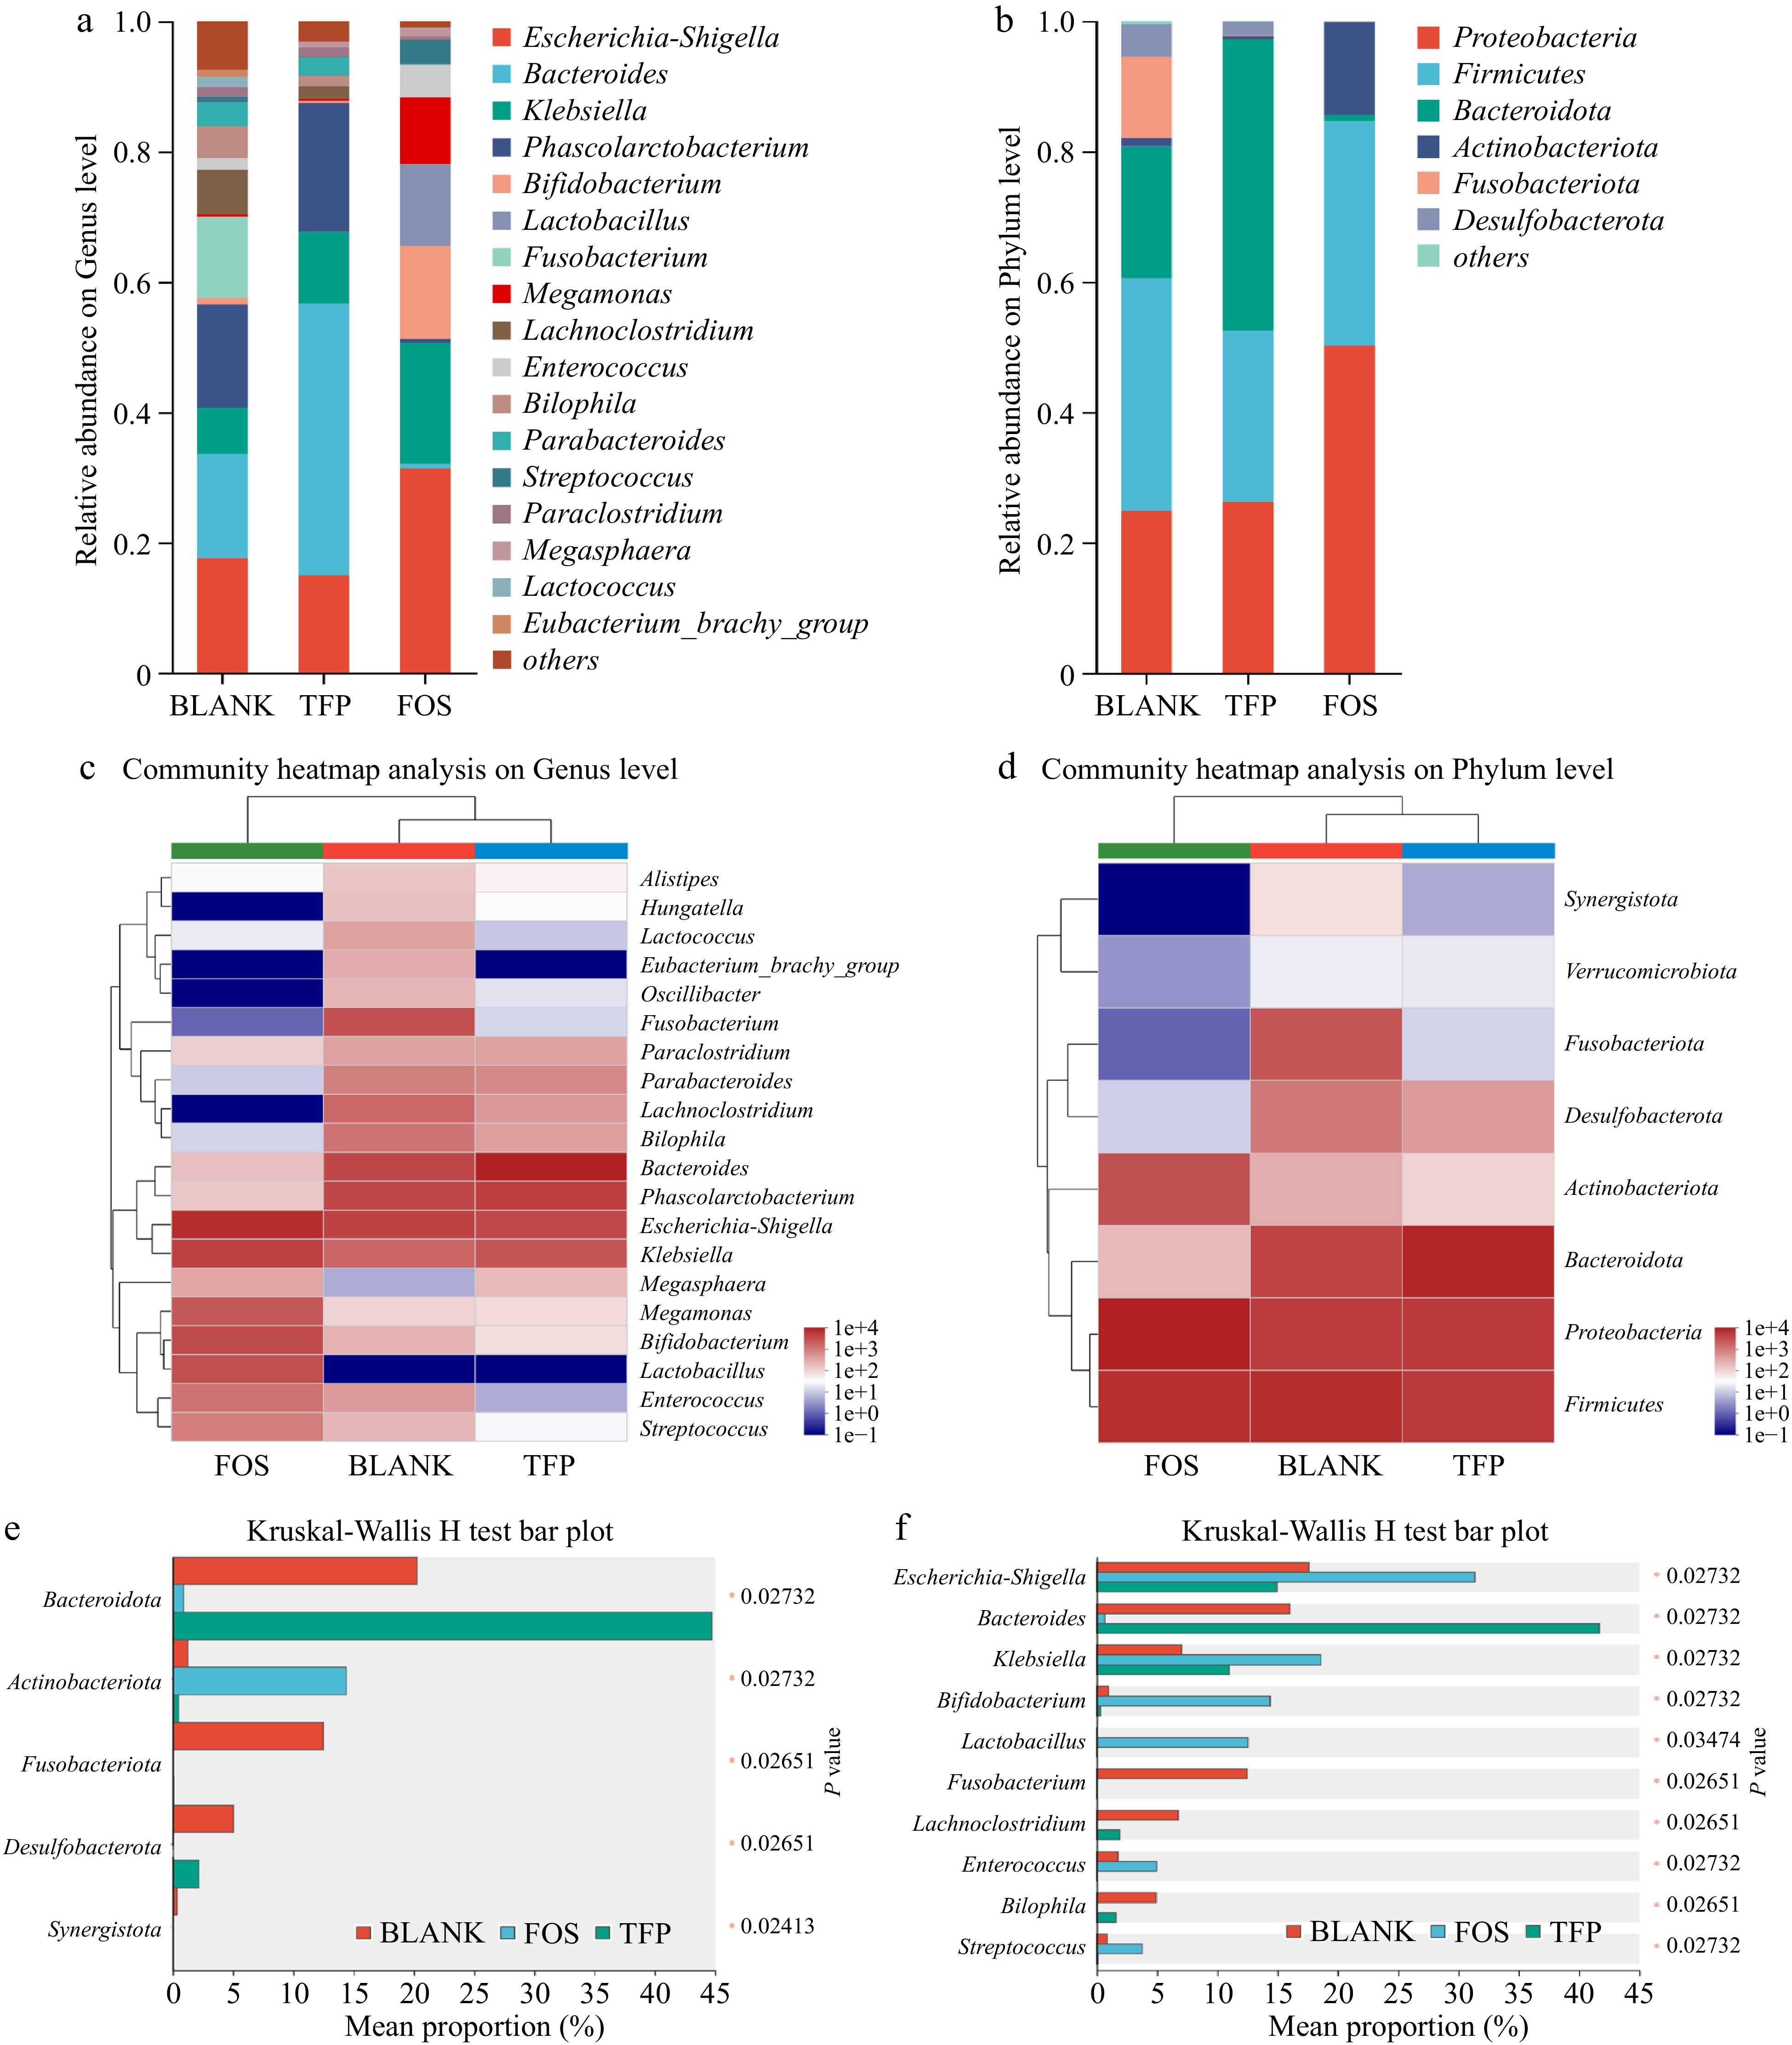
Figure 6.
Analysis of gut microbial community composition during 48 h of in vitro fermentation. (a), (b) Relative abundance. (c), (d) Community heatmap analysis. (e), (f) Kruskal-Wallis H test bar plot.
-
TFP TFP-S TFP-G TFP-I Total polysaccharides (%) 89.62 ± 0.82a 88.90 ± 0.55ab 87.28 ± 0.78b 86.07 ± 1.03c Total uronic acids (%) 15.35 ± 0.80a 15.83 ± 0.36a 14.74 ± 0.11b 14.15 ± 0.33c Total proteins (%) 2.53 ± 0.05a 1.90 ± 0.01b 0.79 ± 0.01c 0.60 ± 0.02d Molecular weight Mw × 104 (Da) 2.0361 ± 0.0375a 1.9686 ± 0.0412a 1.7864 ± 0.0109b 1.6620 ± 0.0156c Mw/Mn 1.33172 1.2779 1.20094 1.36855 Constituent monosaccharides and molar ratios Man 1.00 1.00 1.00 1.00 GlcA 0.07 0.08 0.08 0.07 Glc 0.86 0.73 0.75 0.58 Xyl 0.42 0.44 0.40 0.41 Fuc 0.19 0.19 0.20 0.20 Table 1.
Data summarization of TFP, TFP-S, TFP-G and TFP-I.
-
Processes Time (h) CR (mg·mL−1) Origin − 0.115 ± 0.001a Saliva digestion stage 0.25 0.113 ± 0.003a 0.5 0.114 ± 0.002a 1 0.116 ± 0.001a Gastric juice digestion stage 0.5 0.312 ± 0.032e 1 0.364 ± 0.002d 2 0.408 ± 0.010c 4 0.583 ± 0.023b 6 0.729 ± 0.016a Small intestinal juice digestion stage 0.5 0.809 ± 0.011c 1 0.836 ± 0.024bc 2 0.880 ± 0.039b 4 0.931 ± 0.022ab 6 0.950 ± 0.005a Table 2.
Variations in CR of TFP during in vitro digestion.
Figures
(6)
Tables
(2)