-
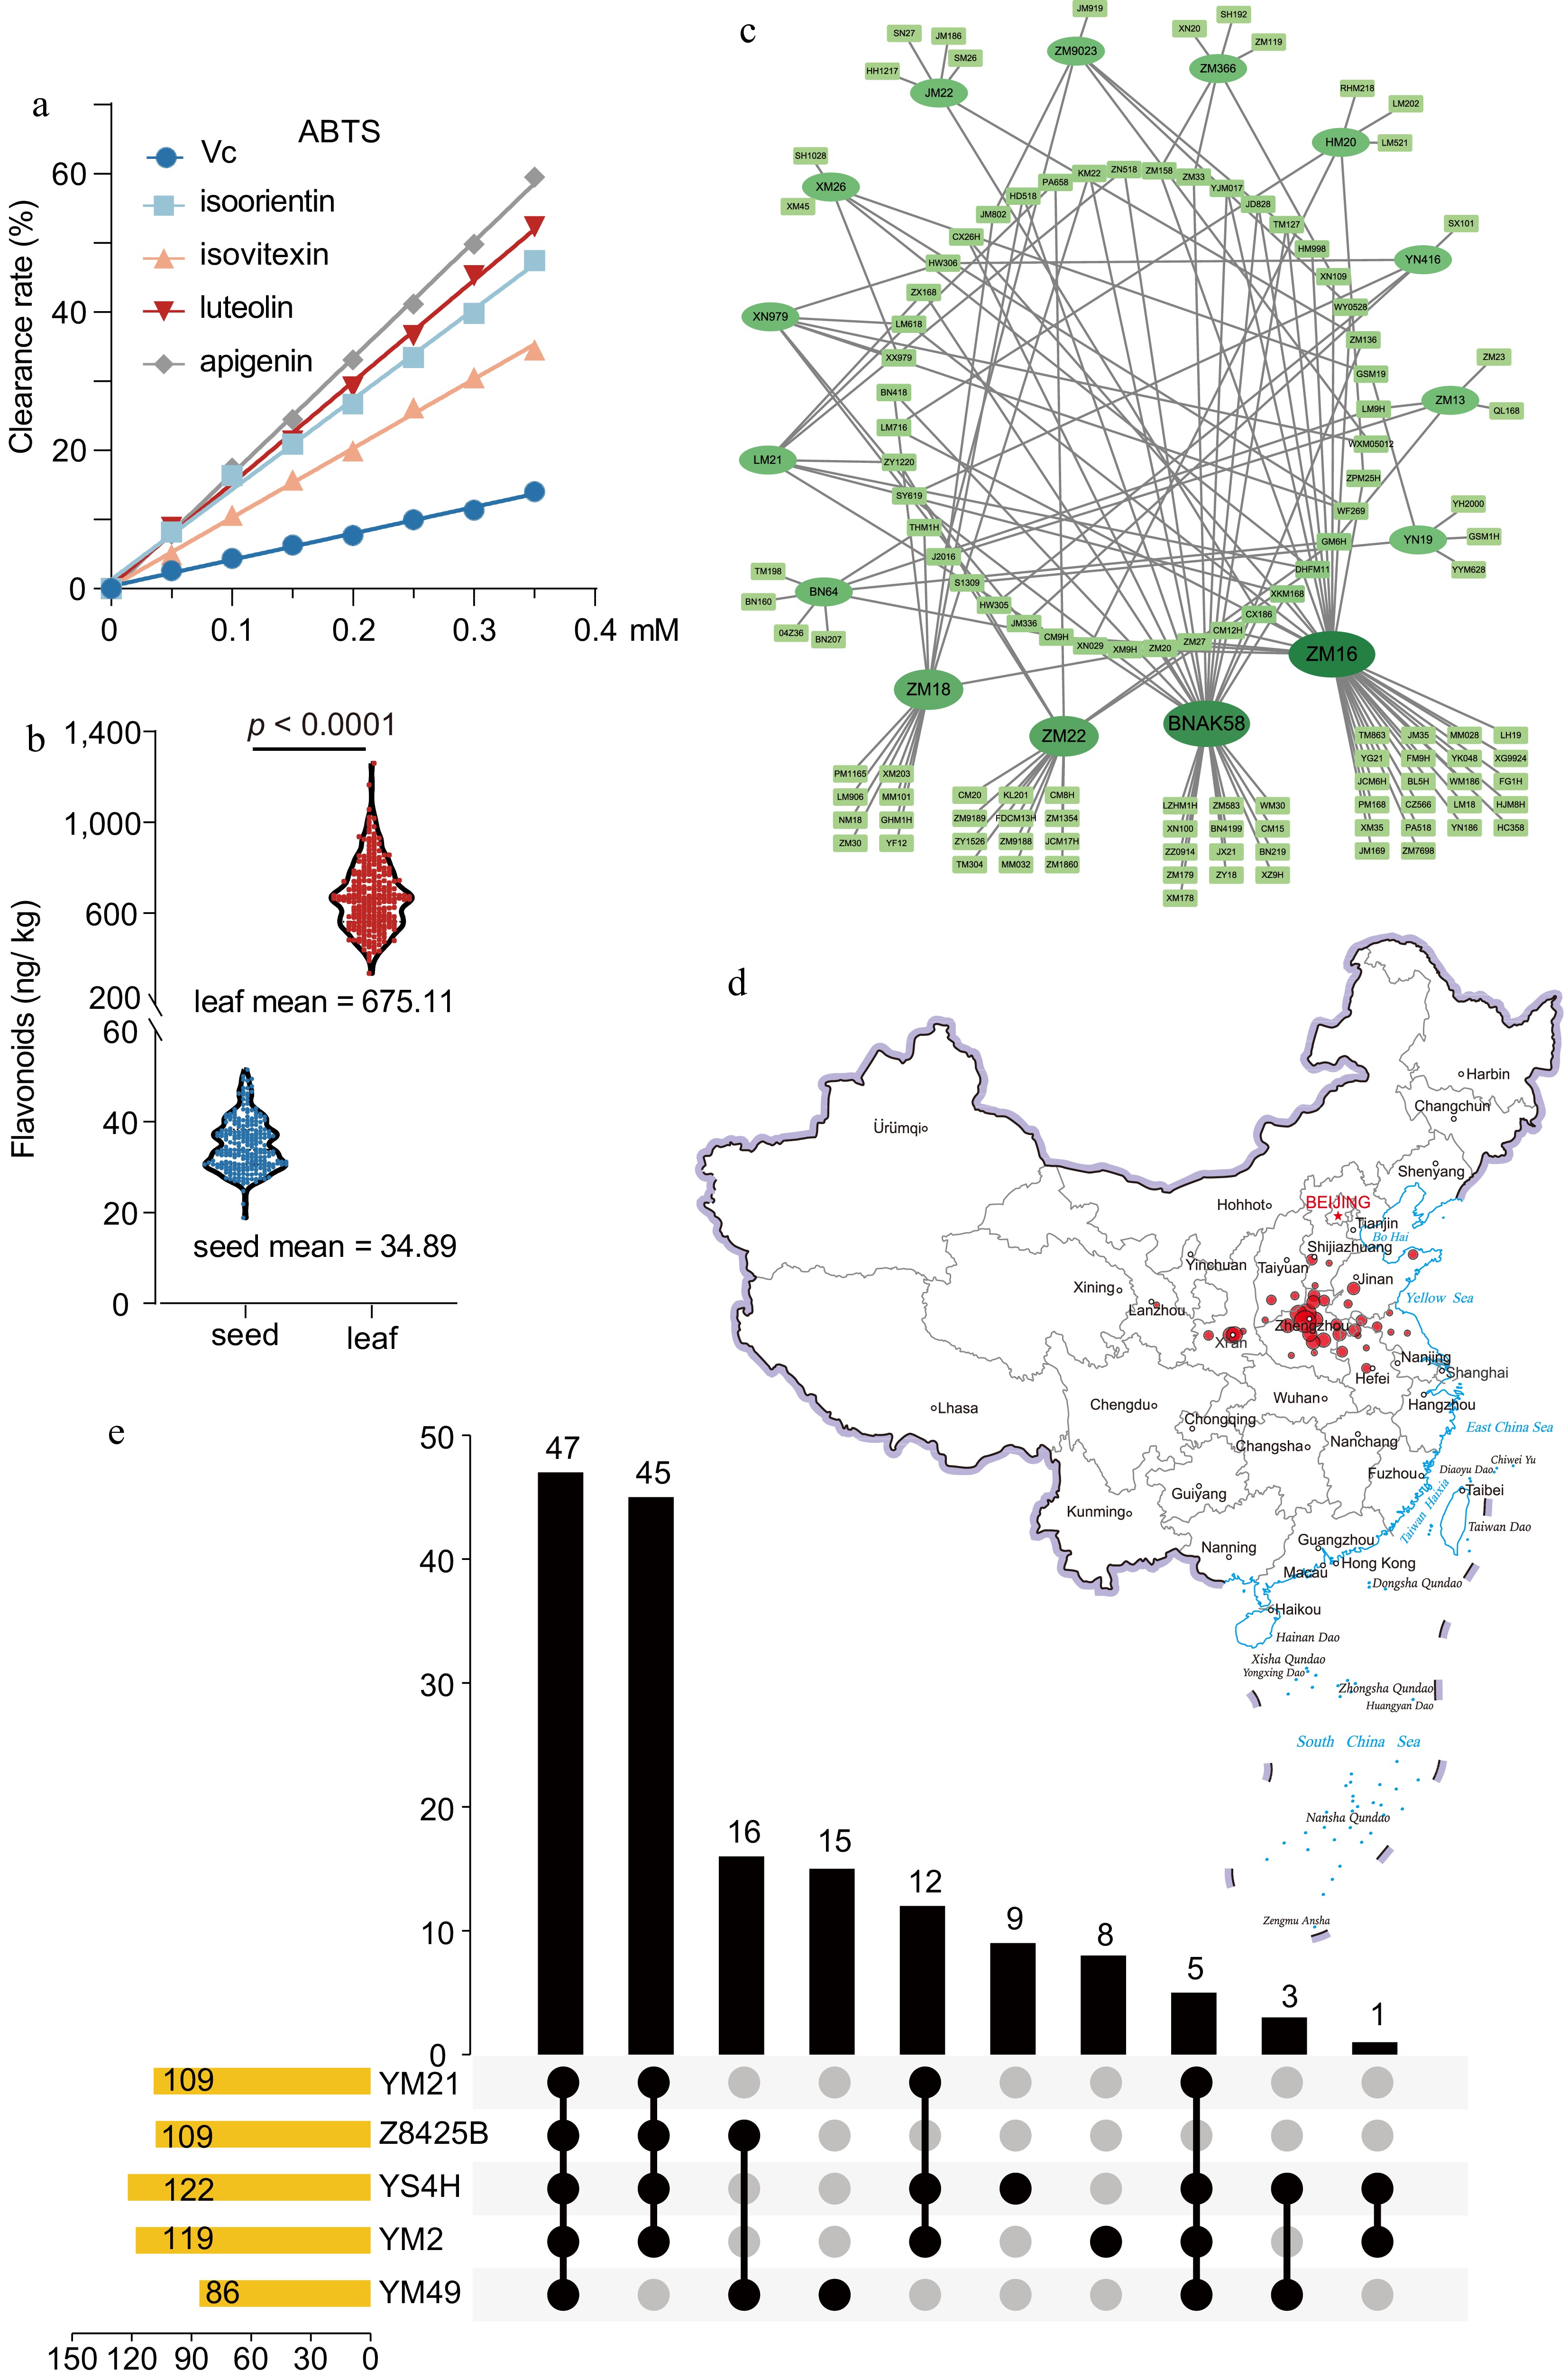
Figure 1.
Analysis and products of flavonoids in wheat accessions. (a) Comparison of the antioxidant activity of wheat flavonoids with vitamin C using the DPPH method. (b) The contents of flavonoids in grains and wheatgrass on the accessions. Data represent the mean ± standard error. The student’s t-test determined the p-value (hereafter). (c) The phylogenetic relationships of bred history. Ovals represent breeding parents, rectangles represent bred cultivars, and related cultivars are linked by black lines. Ellipse color and variety size deepen and increase with breeding usage. (d) The distribution of the wheat accessions. The size of the circle indicates the number of cultivars. (e) The ancestral information of accessions. The yellow bar chart on the left indicates the number of genes associated with each trait. The black circle and line indicate the overlap groups and the corresponding bar chart shows intersecting gene numbers.
-
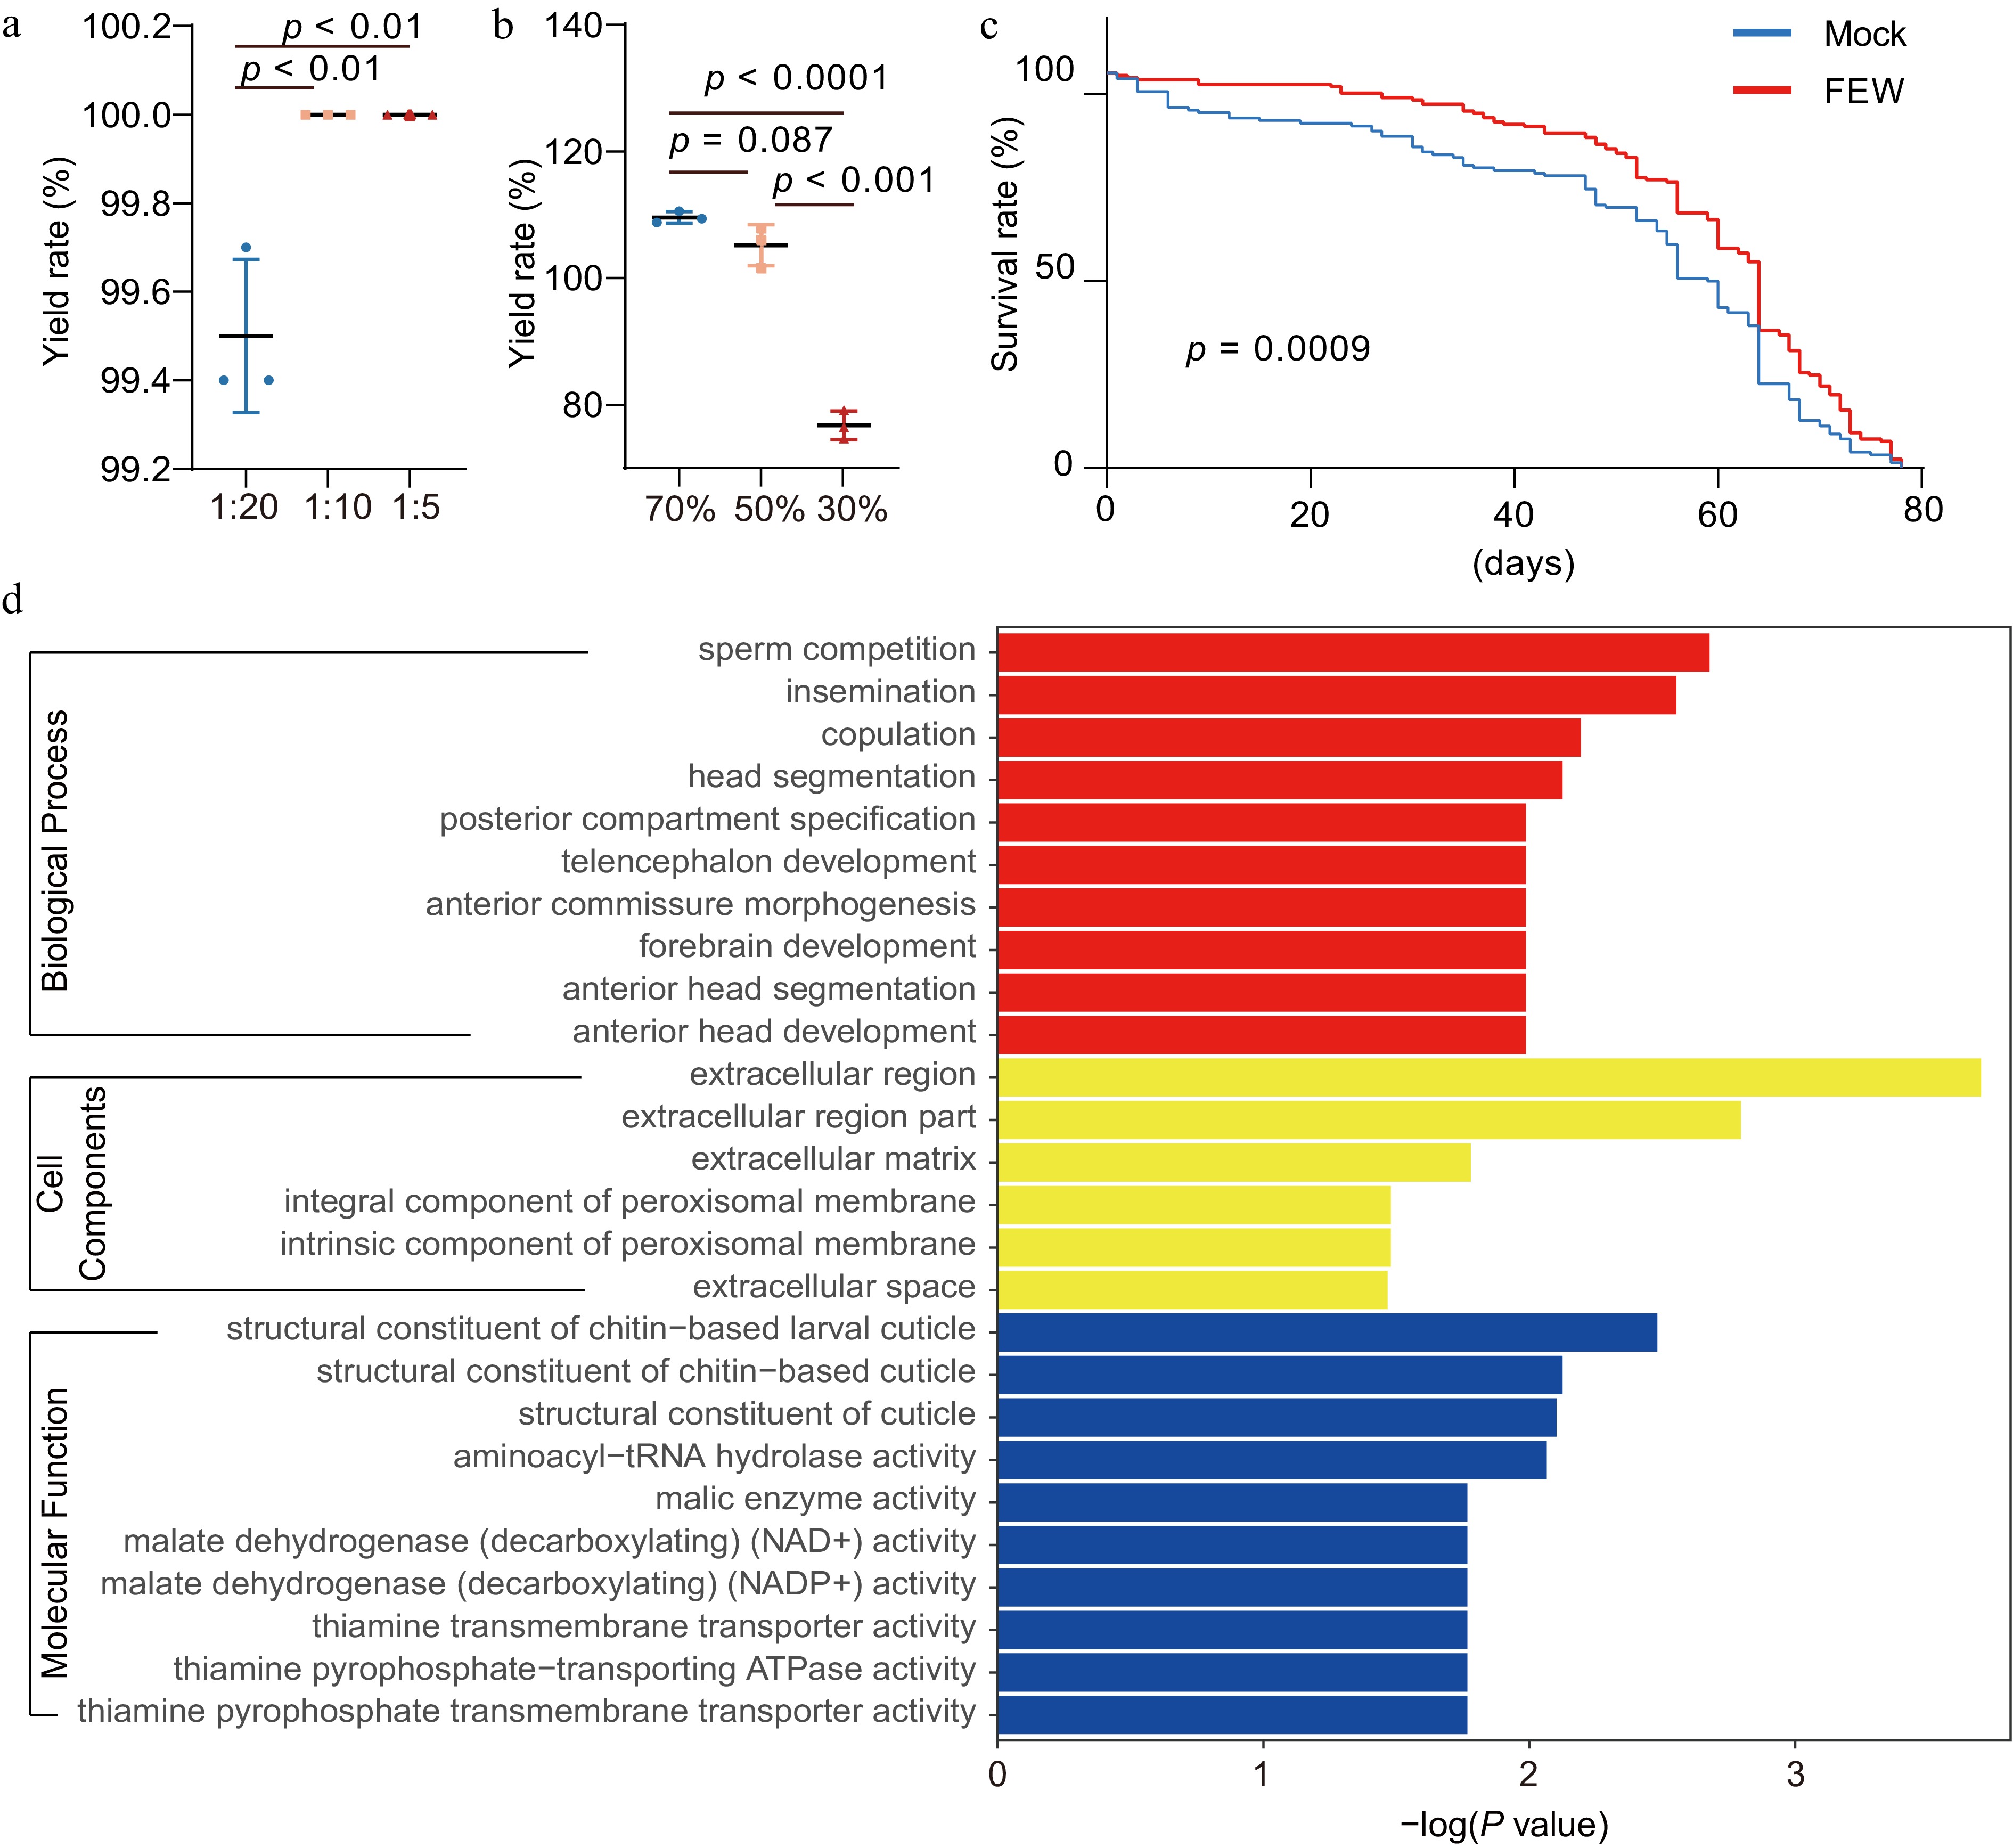
Figure 2.
Purification and animal effects of flavonoids from wheatgrass. (a) Effect of solid-liquid ratio and (b) elution ethanol concentration on static purification of flavonoids by macroporous adsorption resin. (c) The lifespan of male fruit flies fed with foods containing 1 mM of FEW or without (control). (d) The Gene Ontology (GO) analysis of enrichments of differentially expressed genes (DEGs) in male fruit flies fed with FEW or control foods.
-
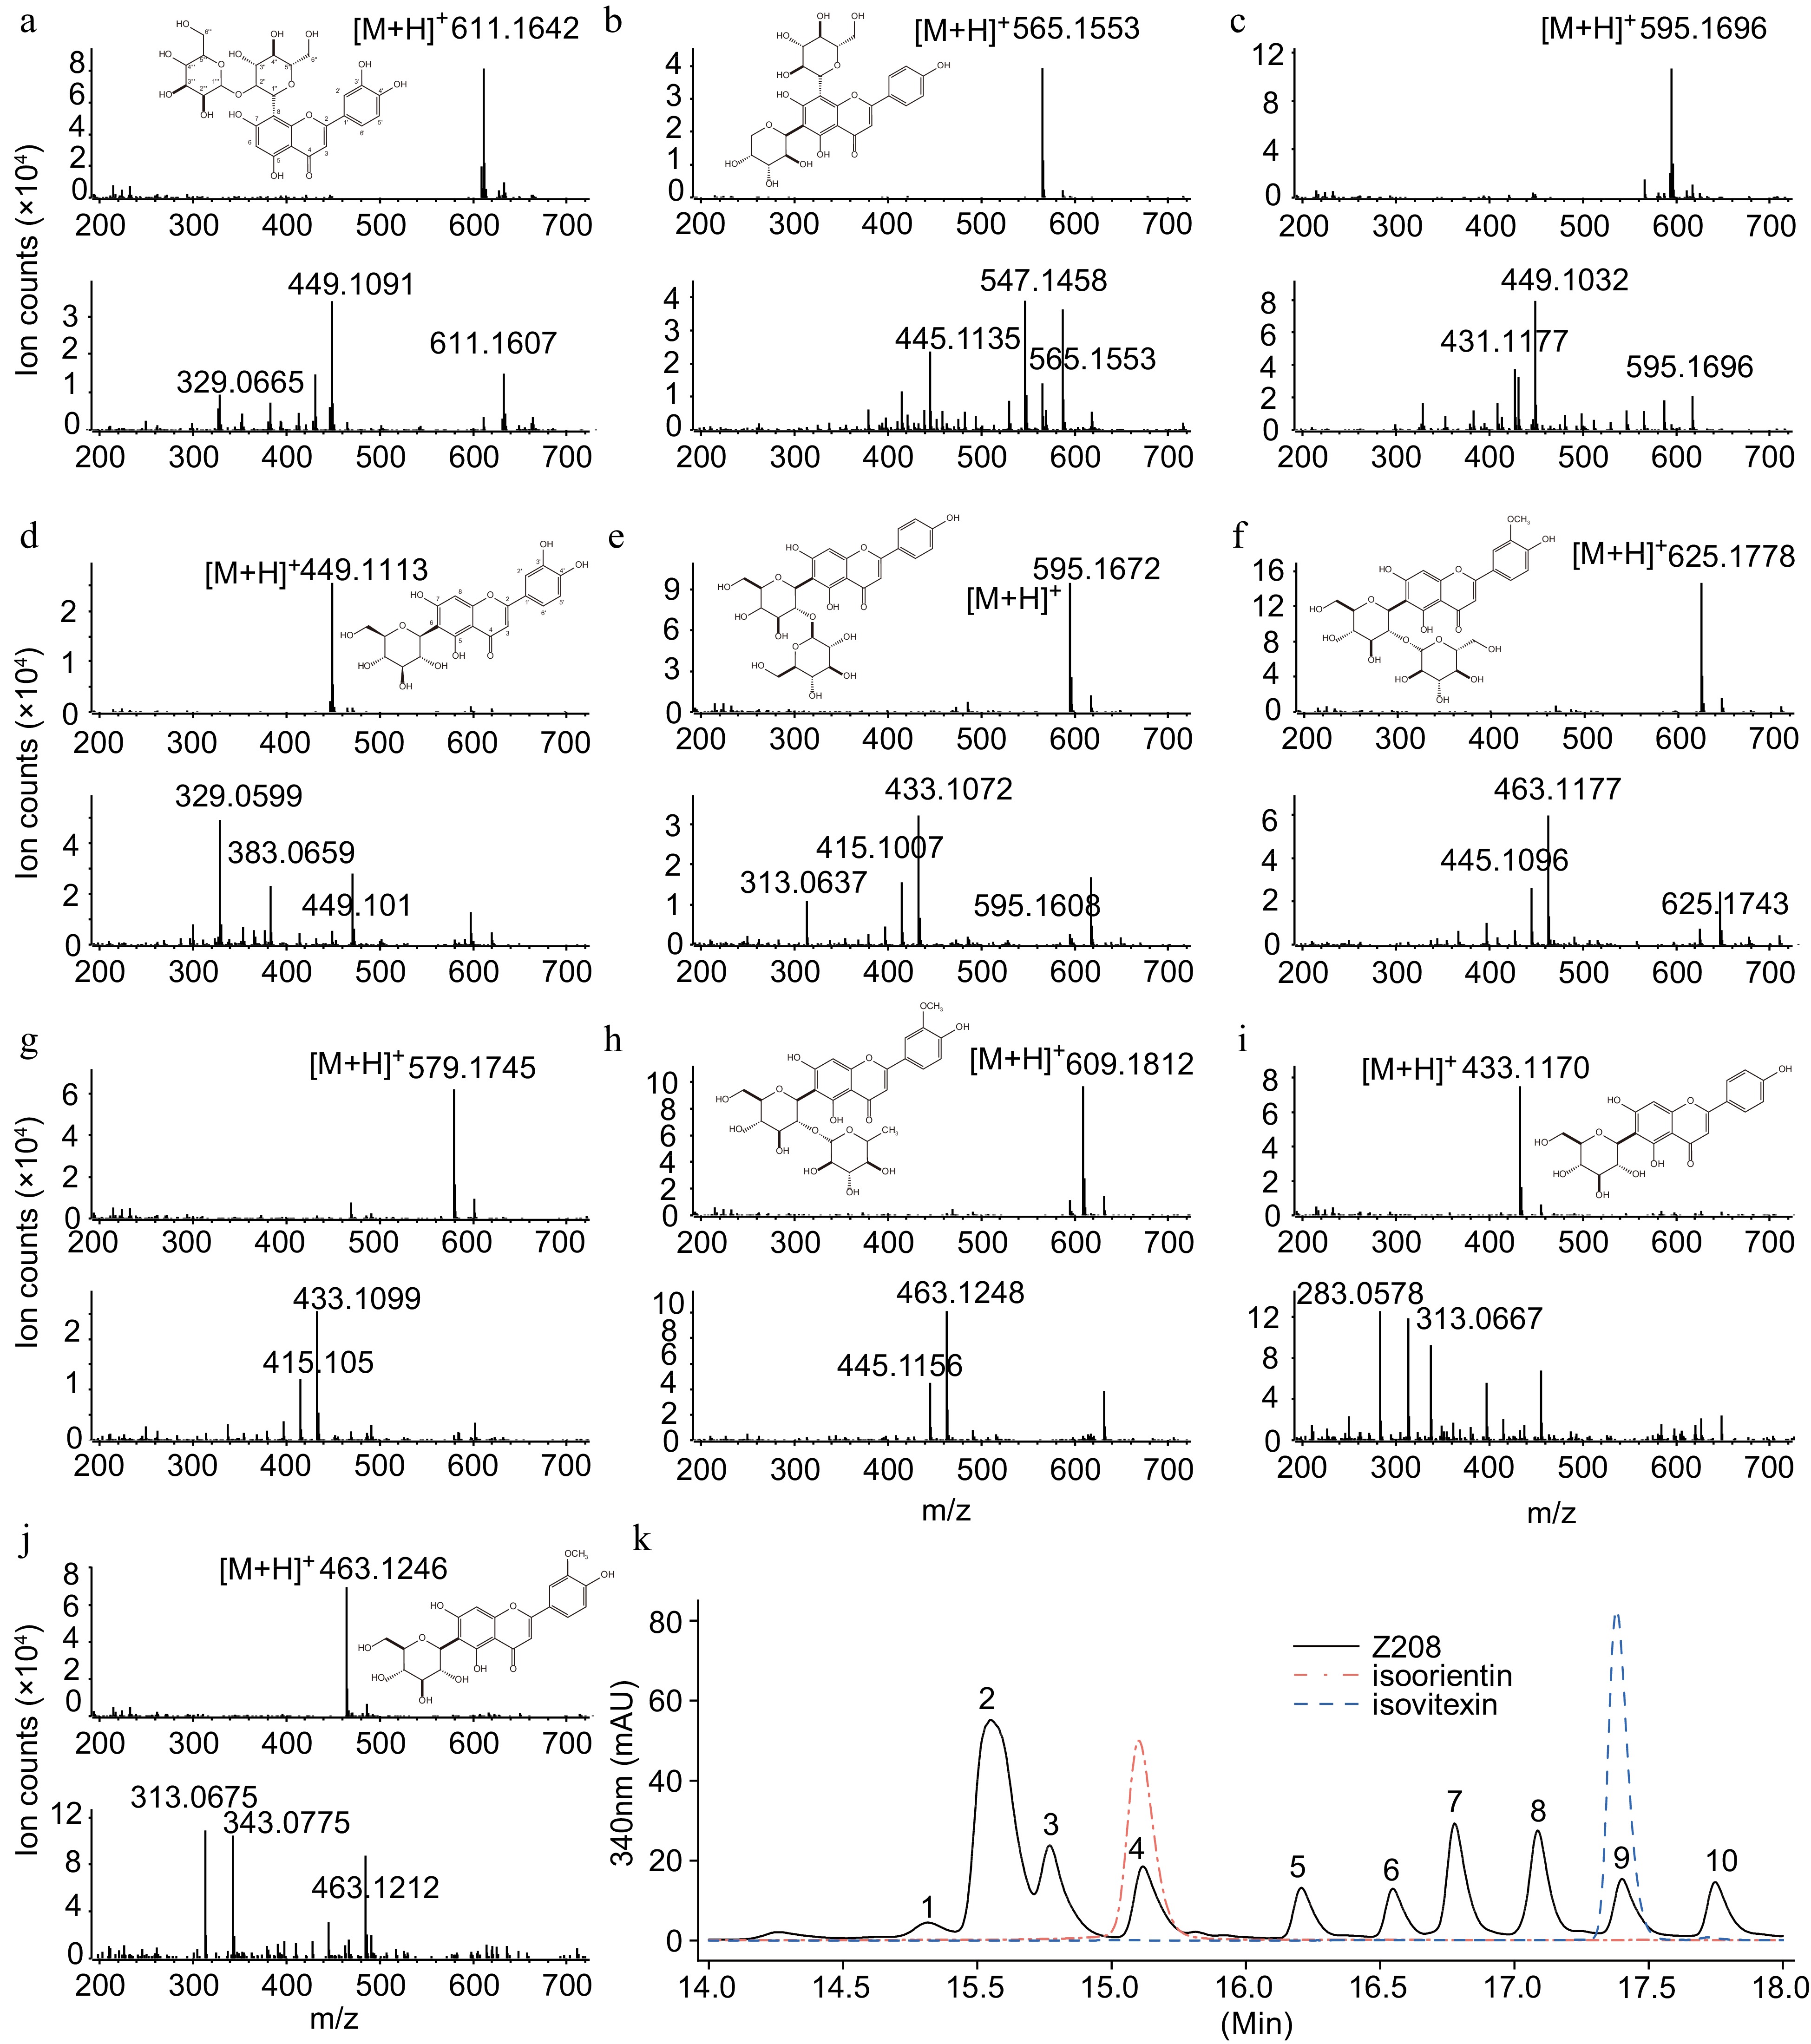
Figure 3.
Chemical structures and cleavage modes of major flavonoids in wheatgrass. (a)−(j). The chemical structure and cracking patterns of 10 flavonoids. Top, the MS spectrum of the compound. Bottom, the MS/MS spectrum. (k) Chromatogram of flavonoids in wheatgrass. The black line shows flavonoids in cultivar Z208. The red and blue lines showed authentic isoorientin and isovitexin standards, respectively.
-
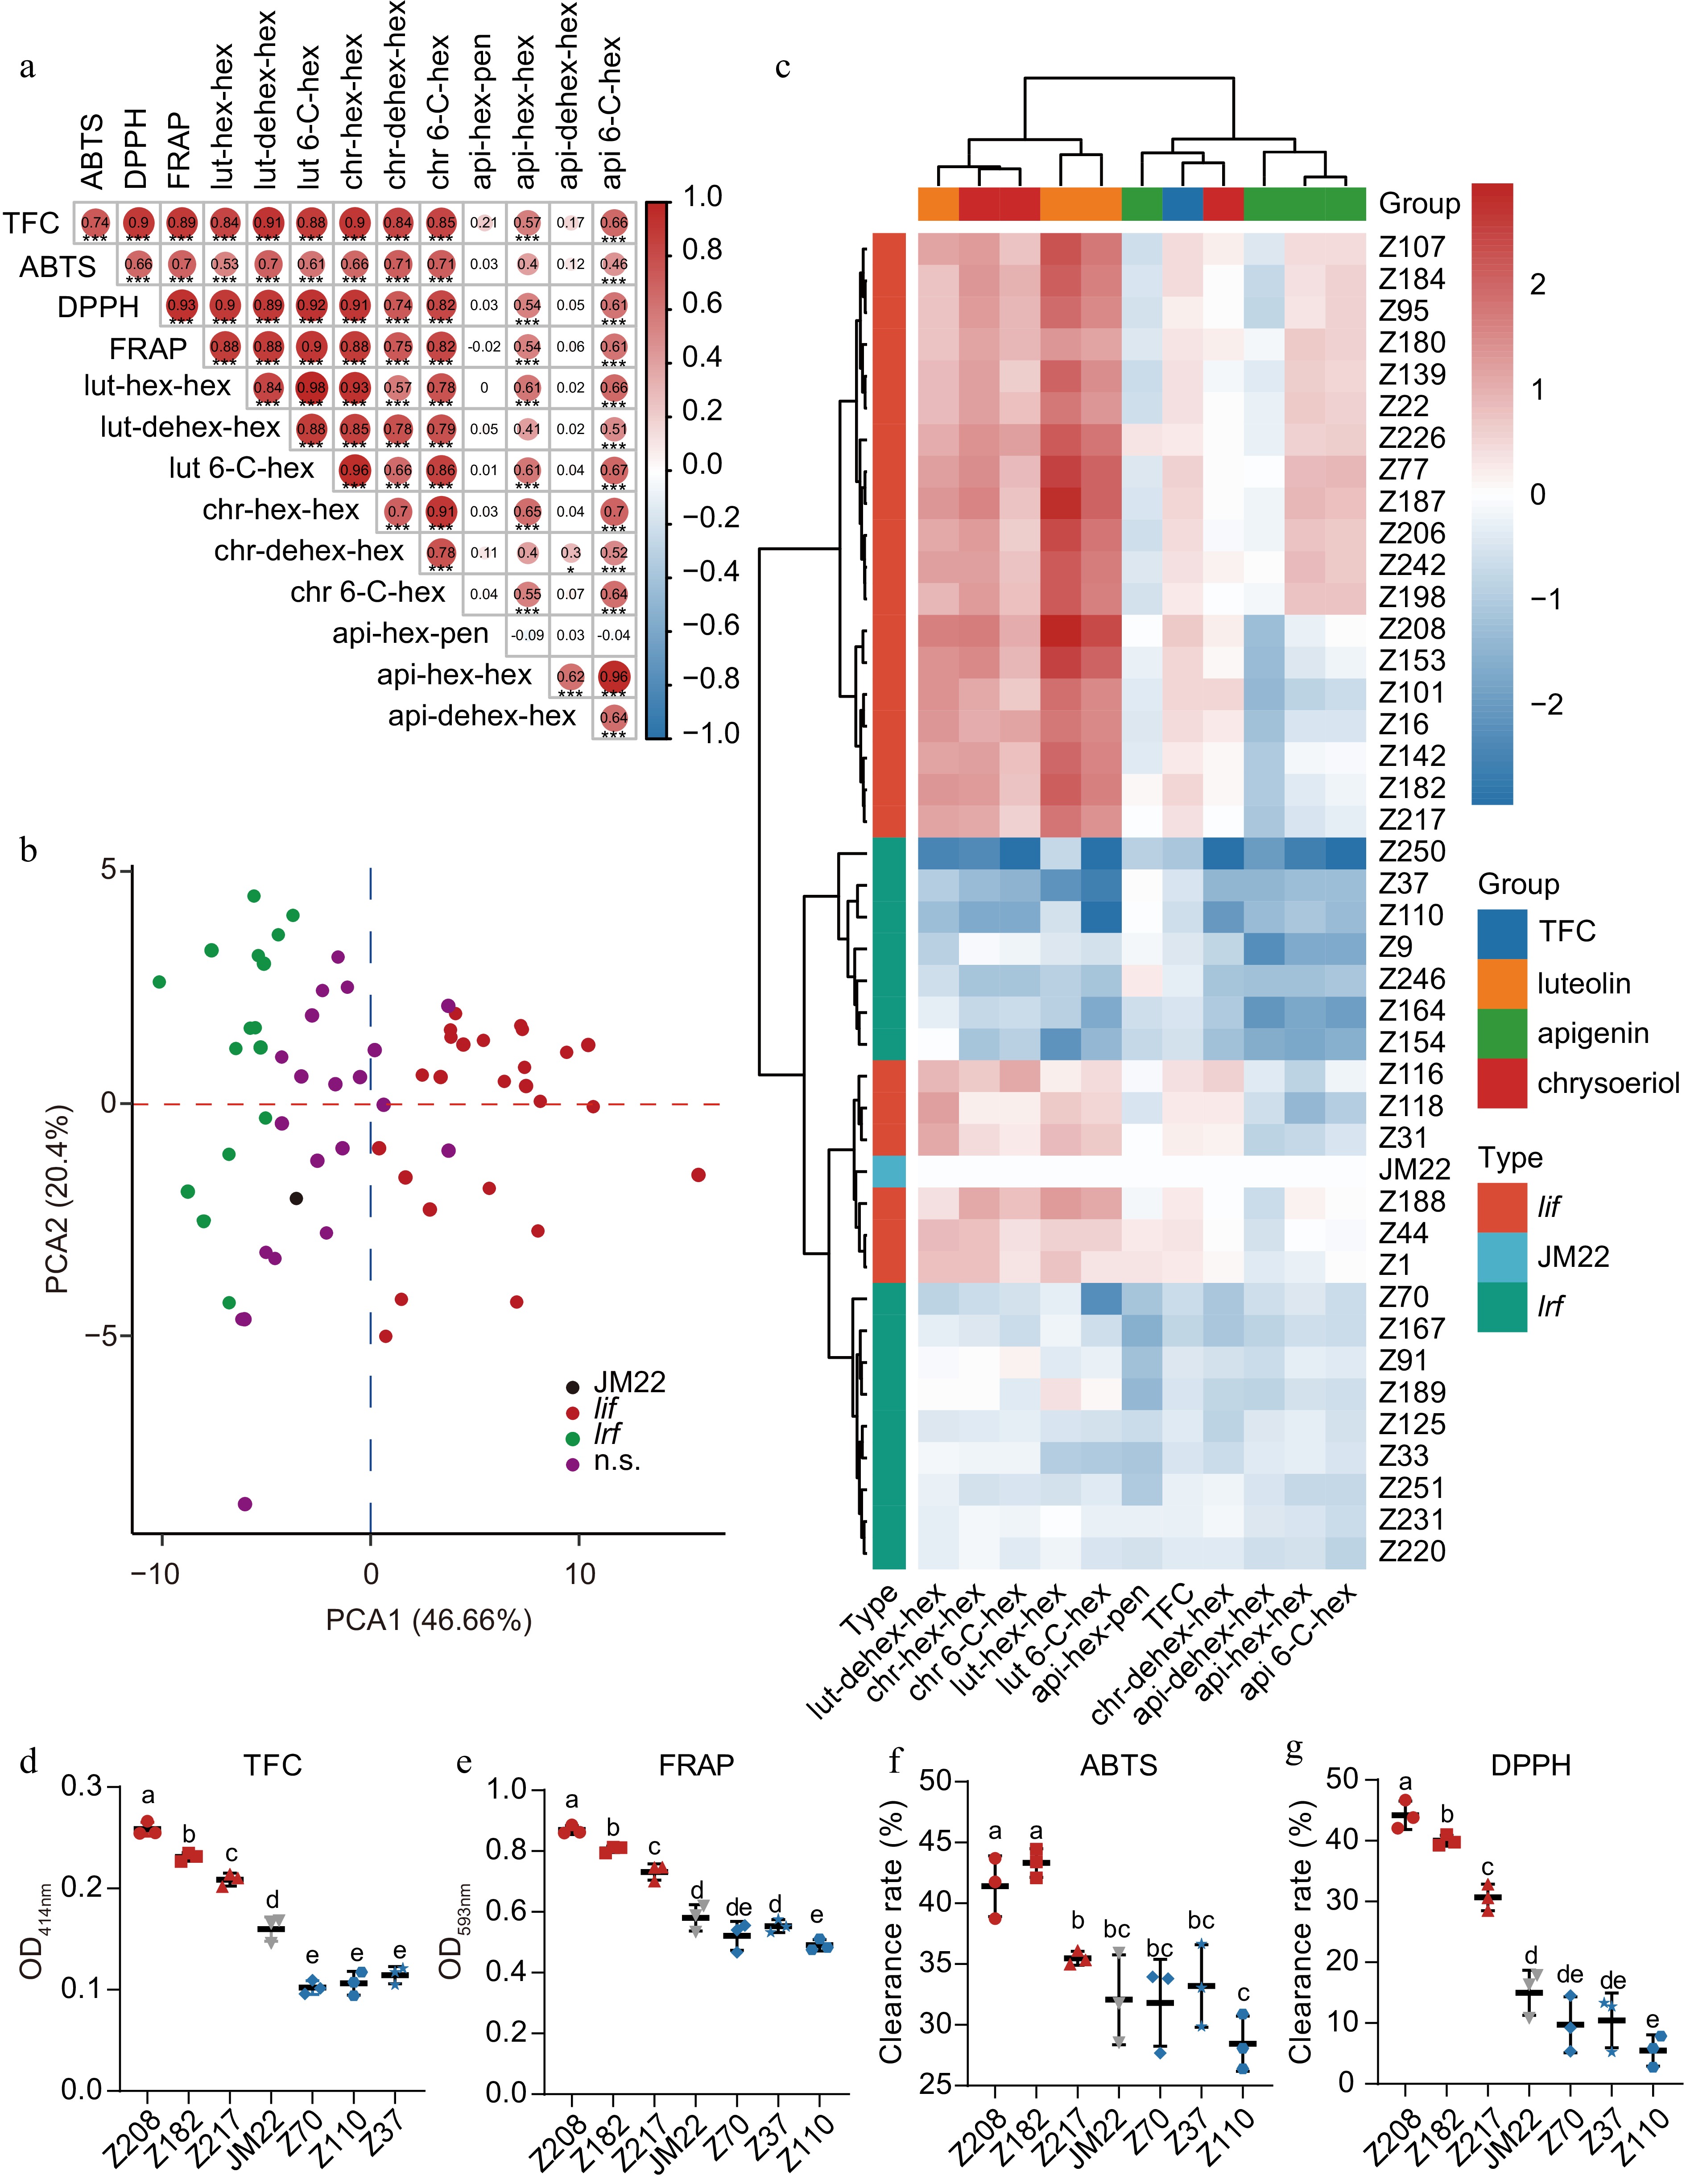
Figure 4.
Detection and analysis of flavonoids in wheatgrass of modern Chinese wheat accessions. (a) The correlation analysis among various traits in the wheat accessions. The red color indicated a positive correlation between the two traits, while the blue indicated a negative correlation between the two traits. The black number presented R value. * represents the confidence test of correlation analysis. (b) The distribution of cultivars in the principal component analysis. lif, leaf increased flavonoids; lrf, leaf reduced flavonoids. (c) Heat map analysis of flavonoid contents in selected cultivars. (d)−(g) Determination of total flavonoid contents and antioxidant capacities of selected cultivars.
-
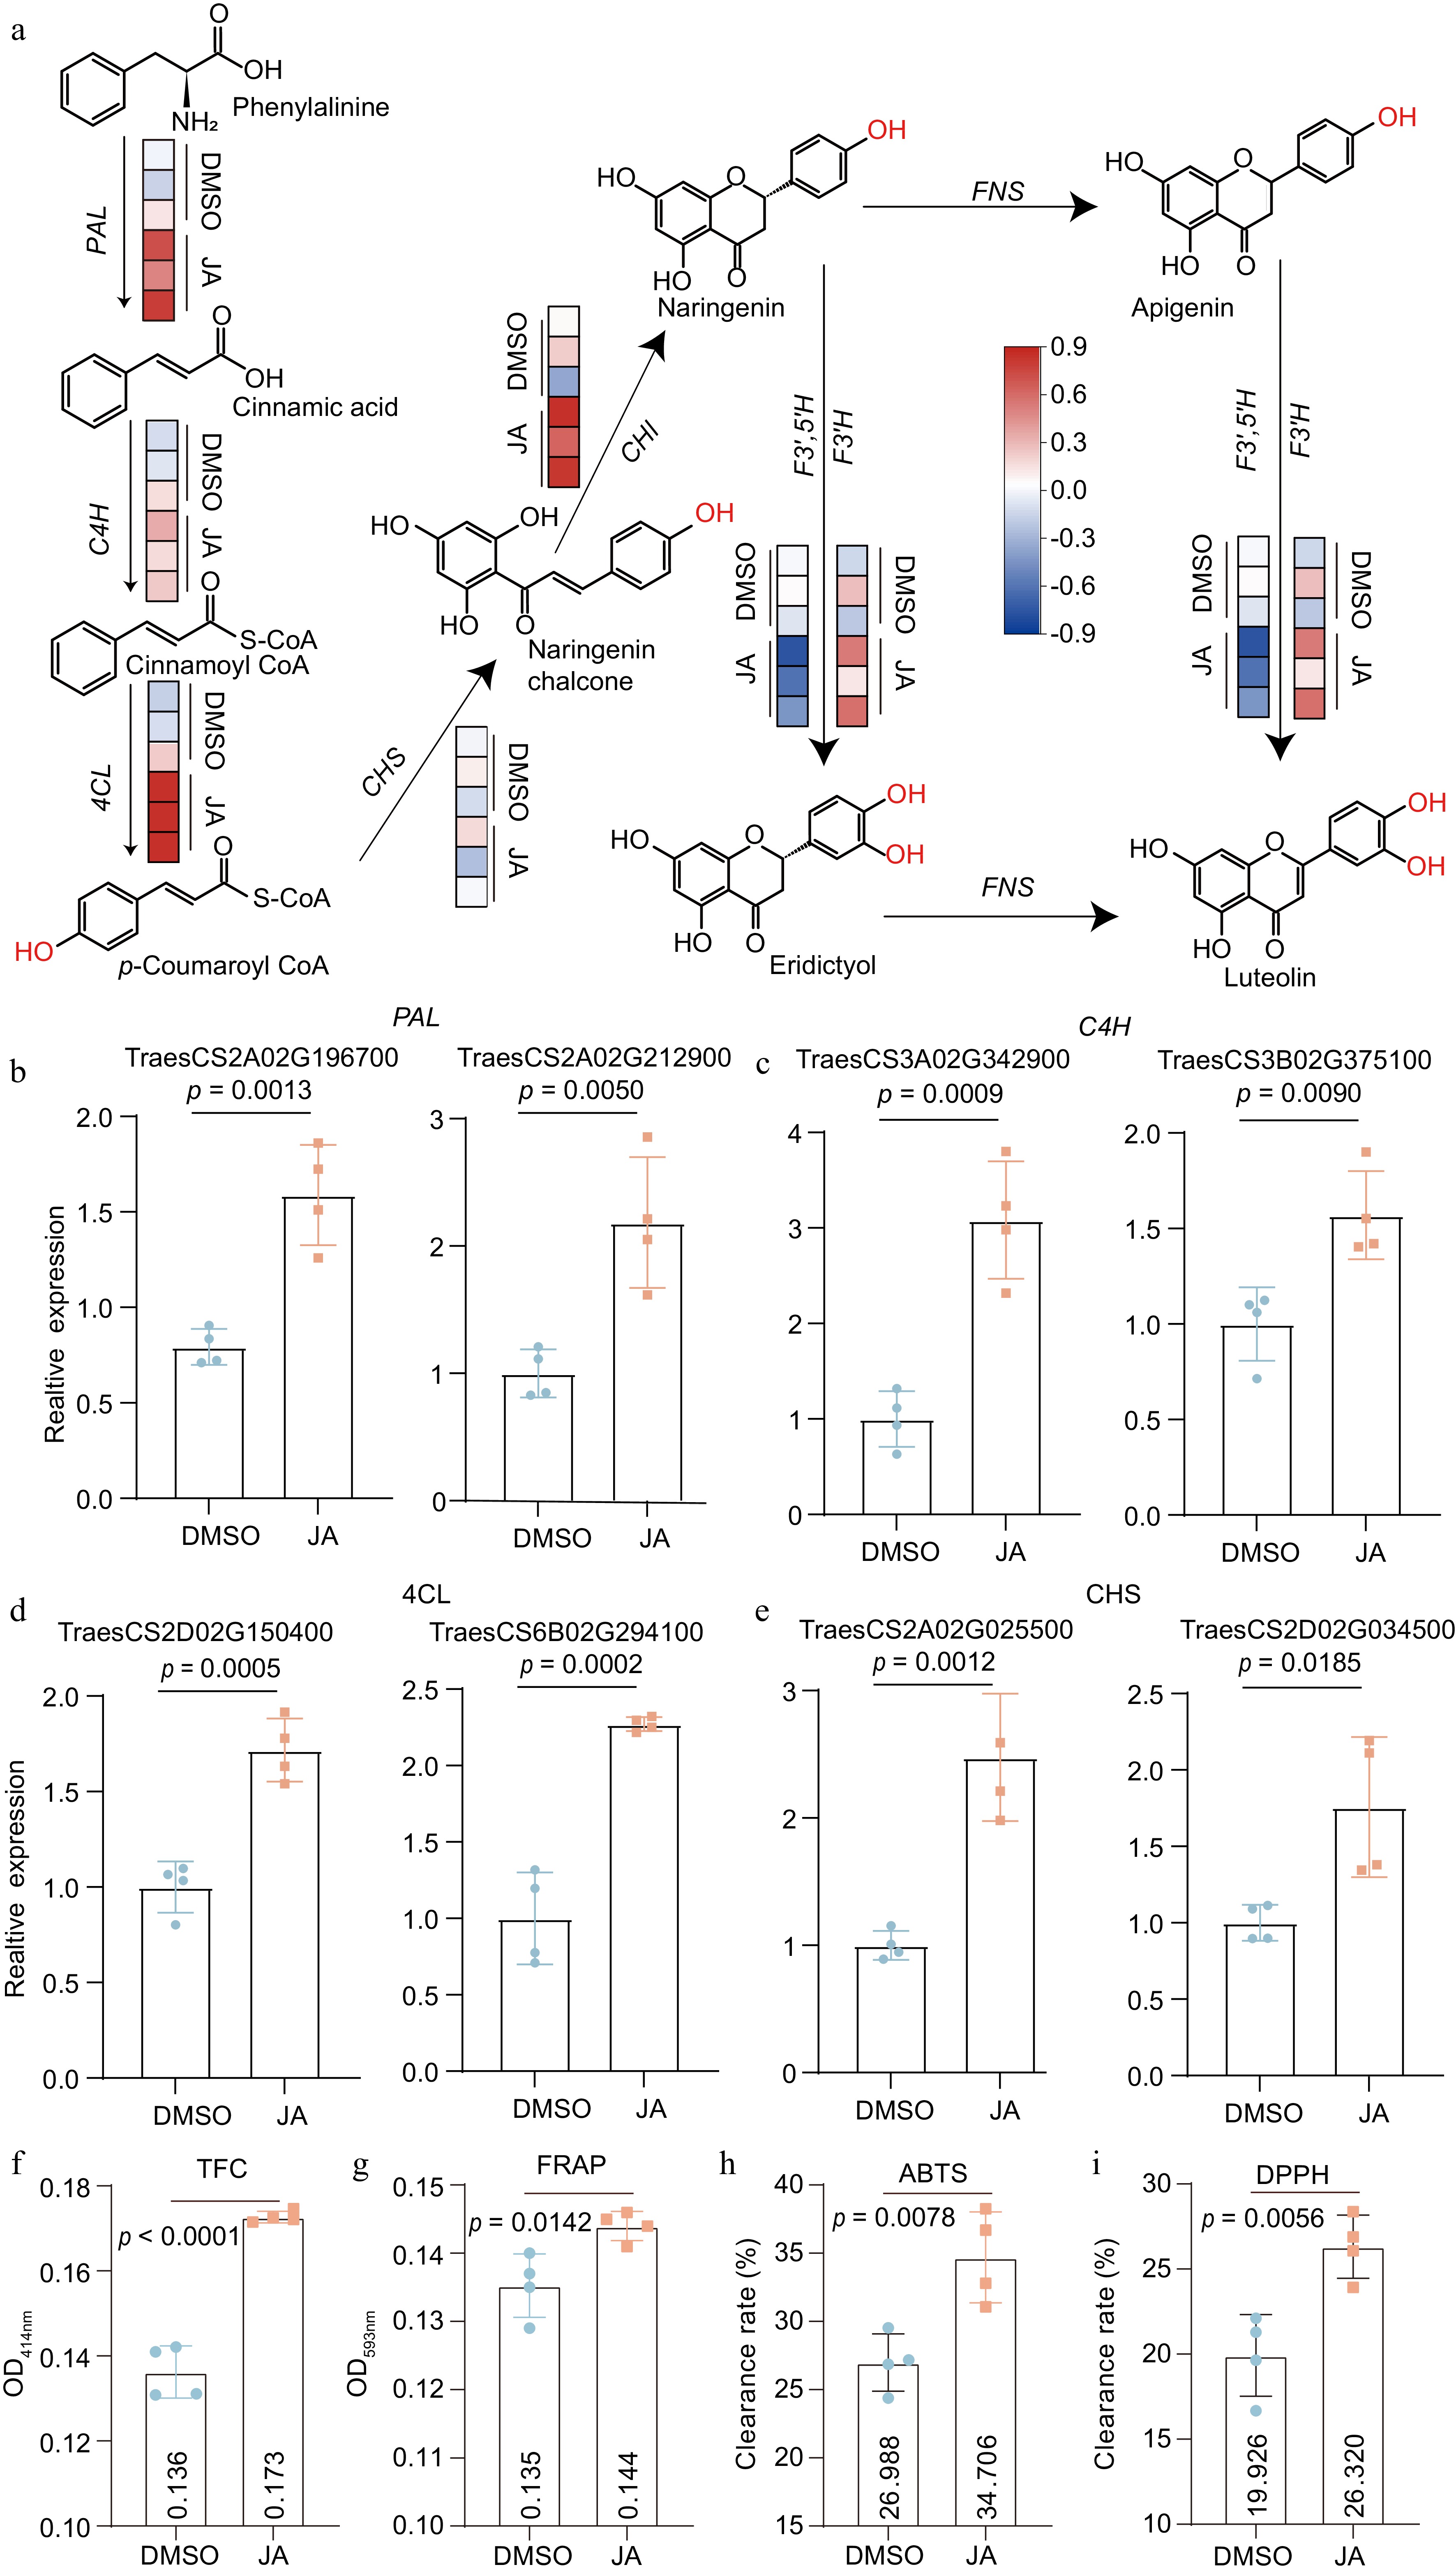
Figure 5.
Boosting flavonoid biosynthesis by JA treatment. (a) The effect of JA treatment on the wheat flavonoid synthesis pathway. Data were from the NCBI bio project database (PRJNA831434). The red block indicated upregulated in a sample at the whole gene family level. Quantitative RT-PCR analyses of (b) Phenylalanine lyase (PAL), (c) 4-coumaroyl CoA ligase (4-CL), (d) 4-coumaroyl CoA hydroxylase (C4H), and (e) Chalcone synthetase (CHS) genes by JA treatment. (f-i) The changes of (f) total flavonoid contents and (g-i) antioxidant capacities of selected cultivars. n = 4.
Figures
(5)
Tables
(0)