-
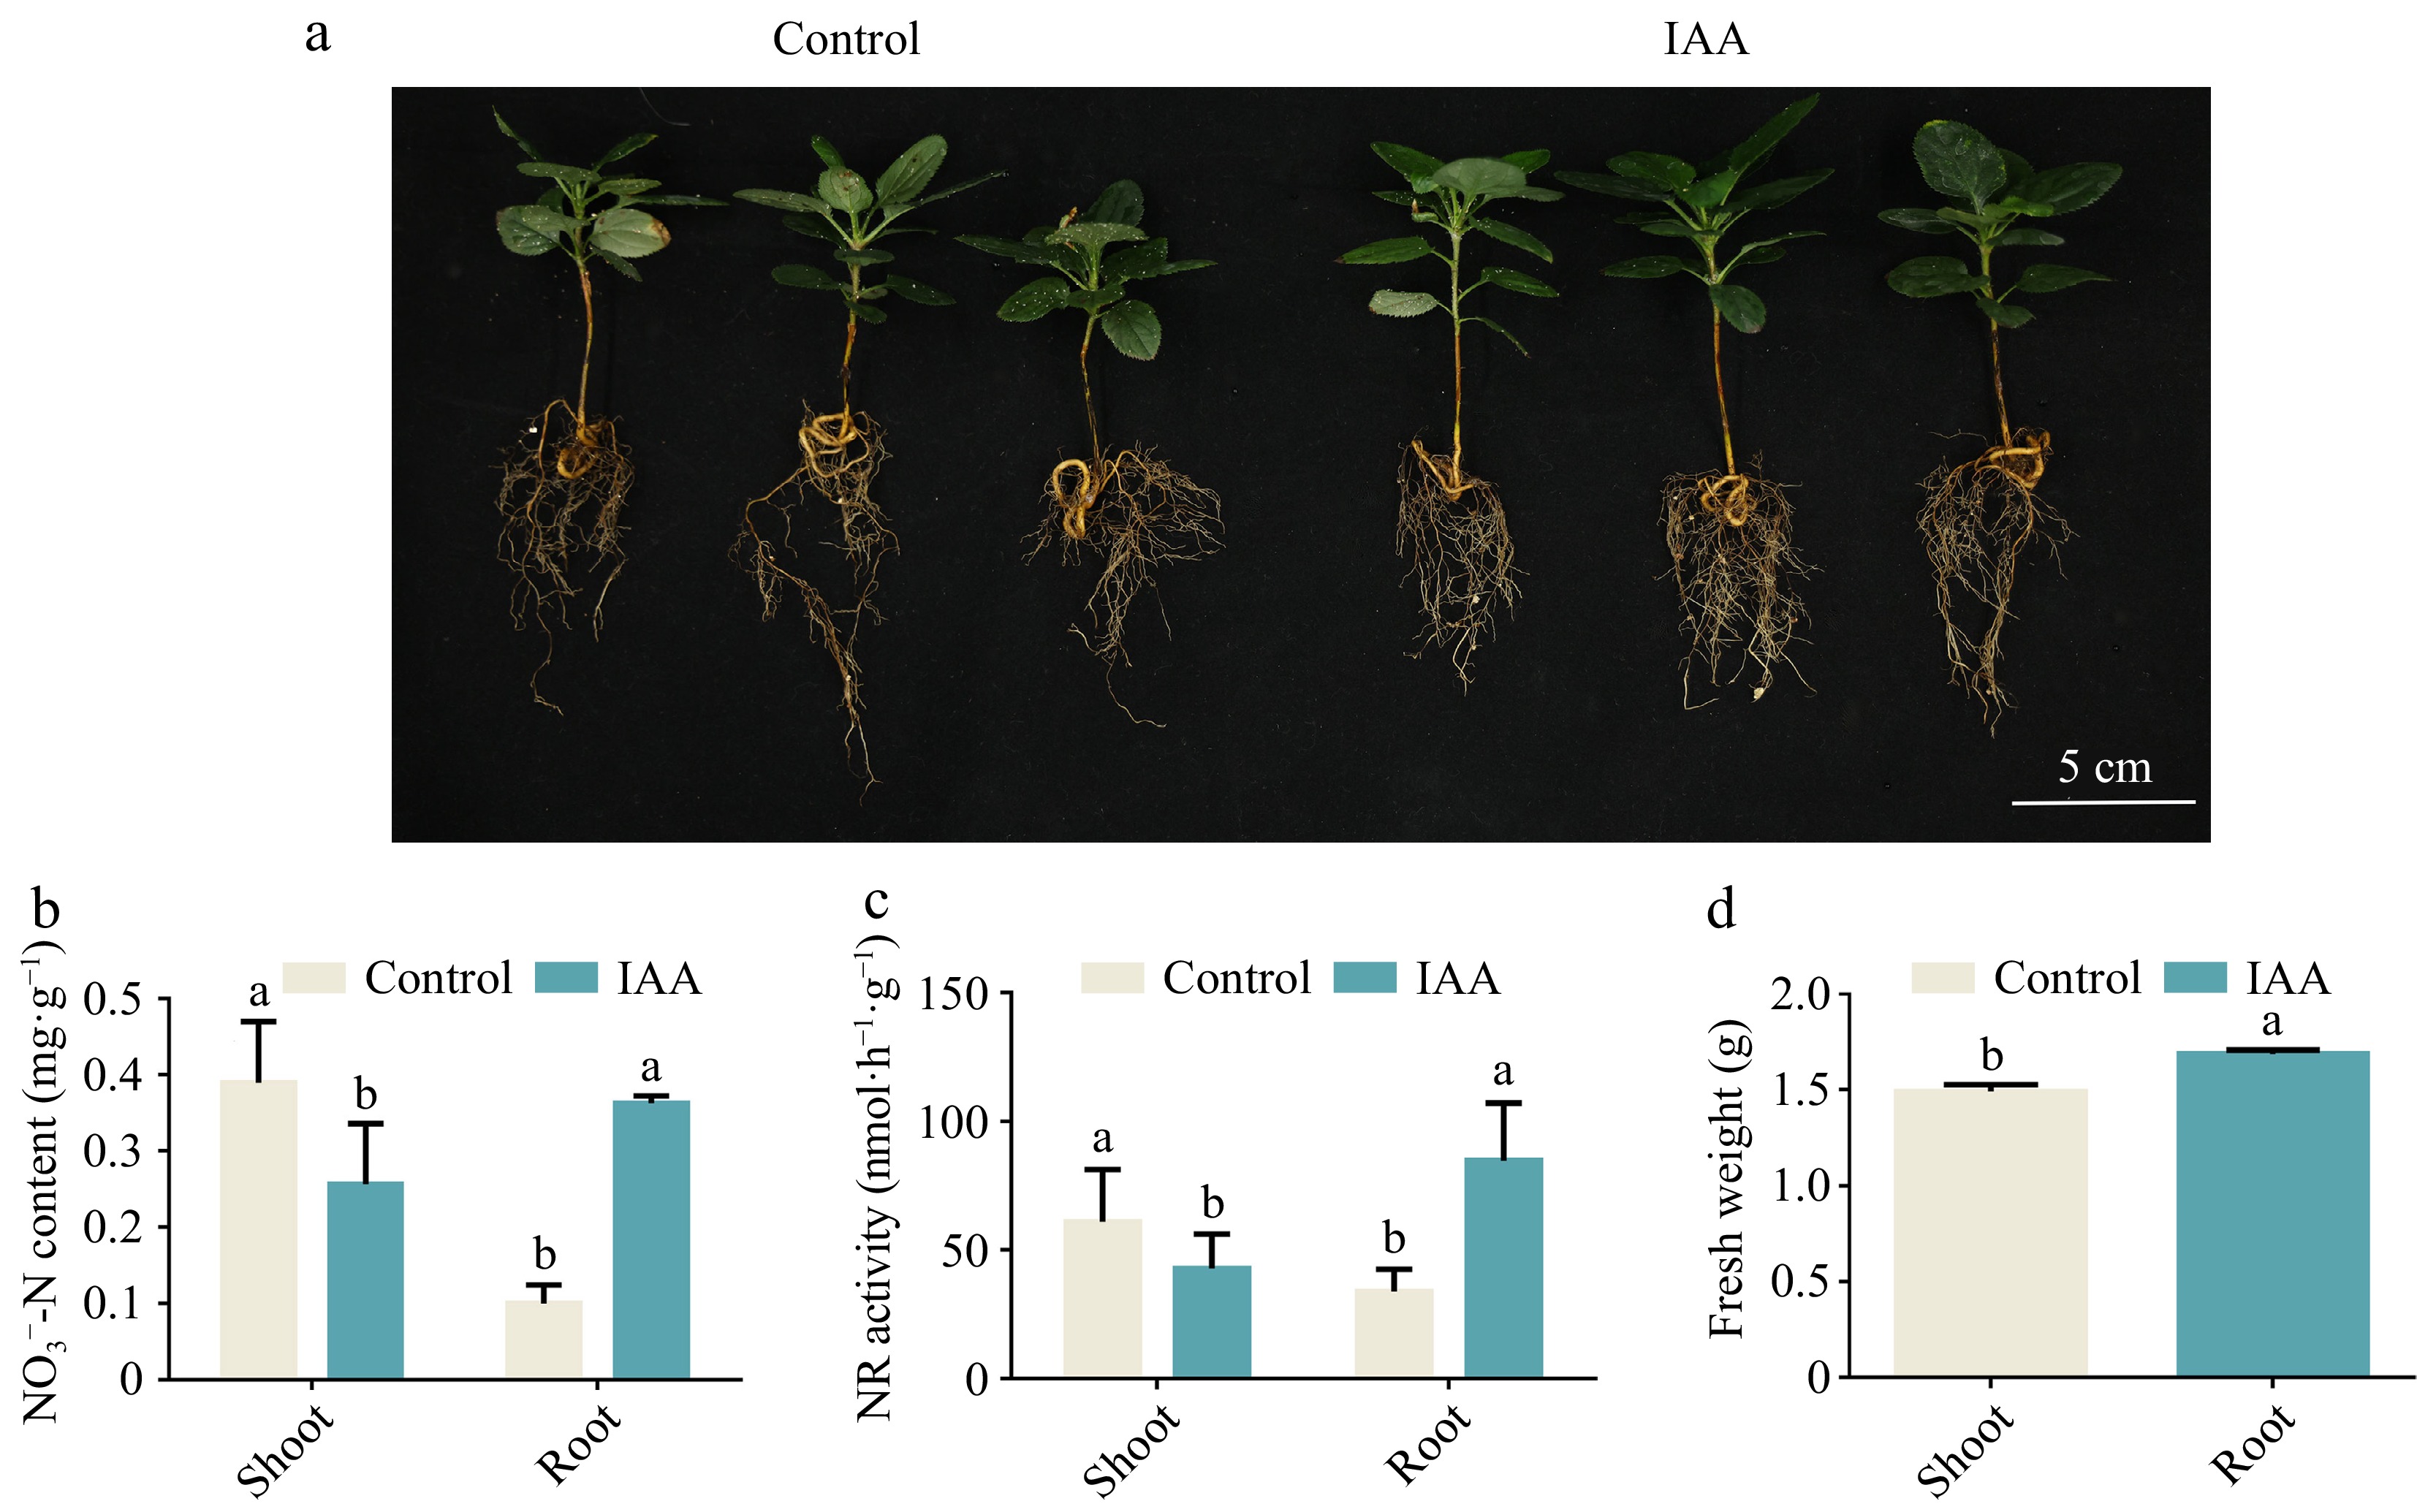
Figure 1.
Auxin enhances nitrate uptake of Gala seedlings. (a) Phenotypes of apple (Malus domestica 'Royal Gala') seedlings grown nutritionally for 50 d under IAA (10 μM) treatment. (b) Nitrate content of shoot and root apple (Malus domestica 'Royal Gala') seedlings treated with IAA. (c) NR activity in shoot and root of IAA treatment apple (Malus domestica 'Royal Gala') seedlings. (d) Seedling fresh weight under IAA treatment. Bars represent the mean ± SD (n = 3). Different letters above the bars indicate significant differences using the LSD test (p < 0.05).
-
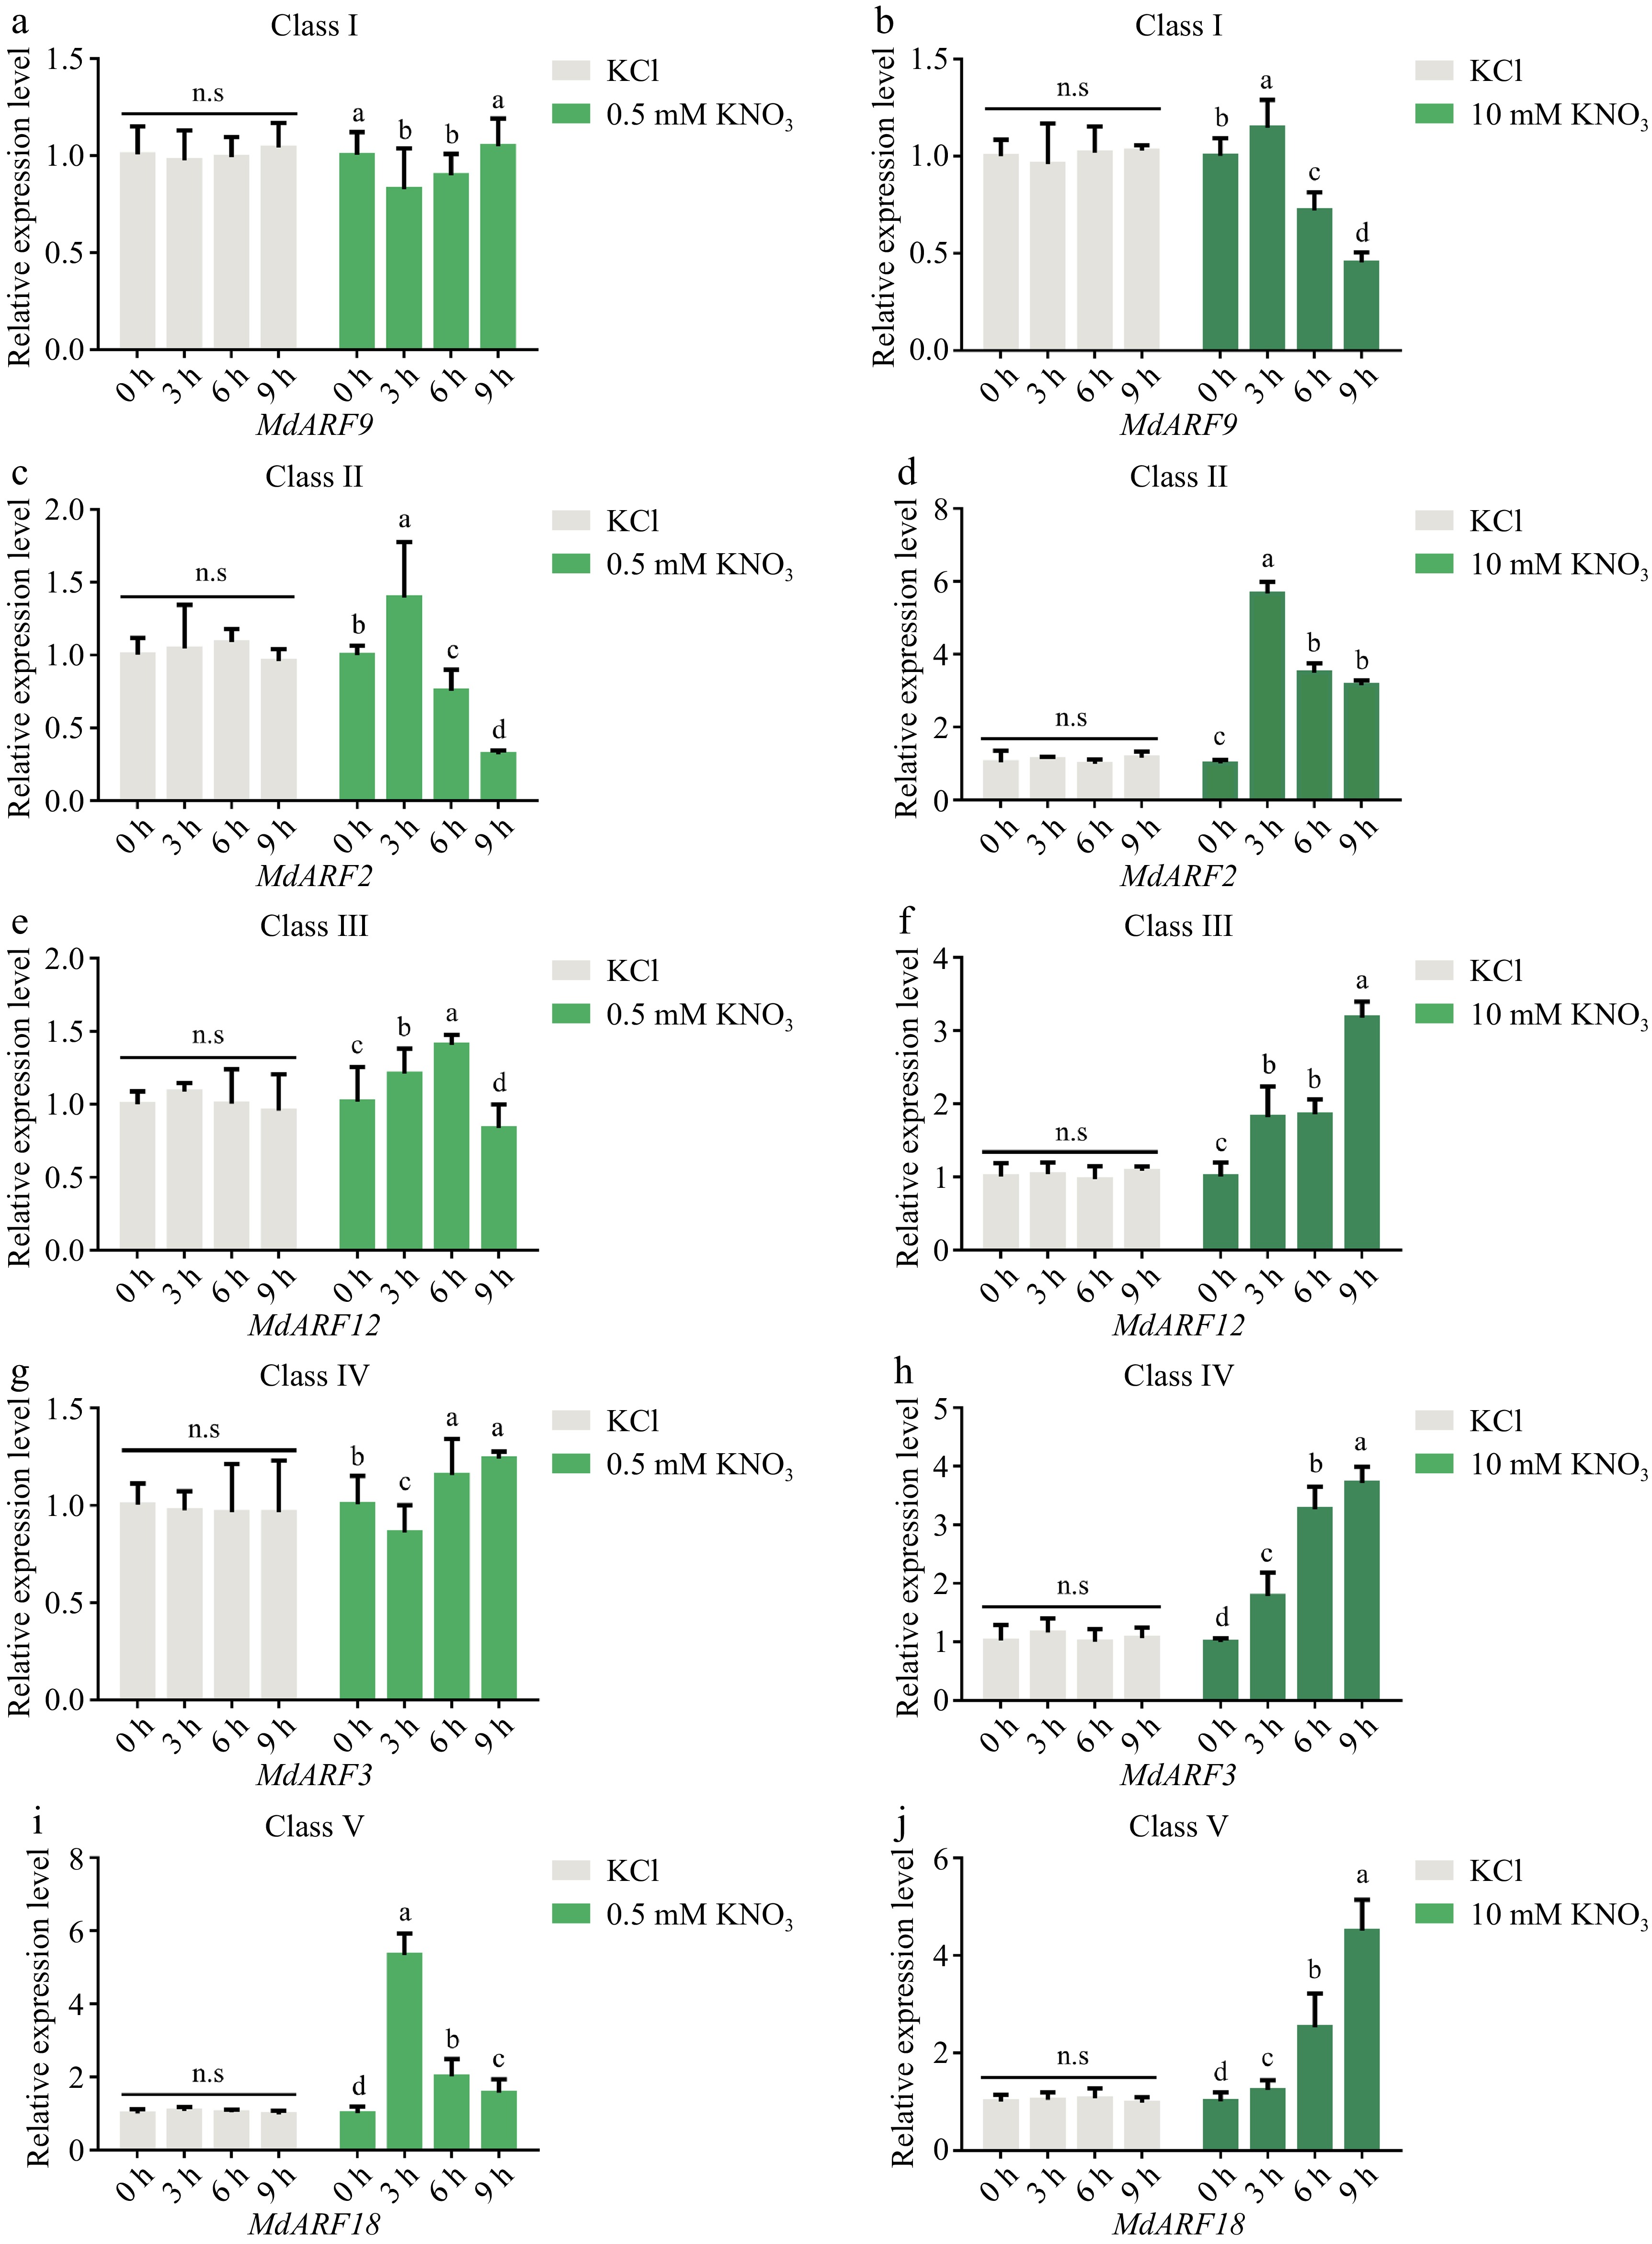
Figure 2.
Relative expression analysis of MdARFs subfamilies in response to different concentrations of nitrate. Expression analysis of representative genes from five subfamilies of MdARF transcription factors. Bars represent the mean ± SD (n = 3). Different letters above the bars indicate significant differences using the LSD test (p < 0.05).
-
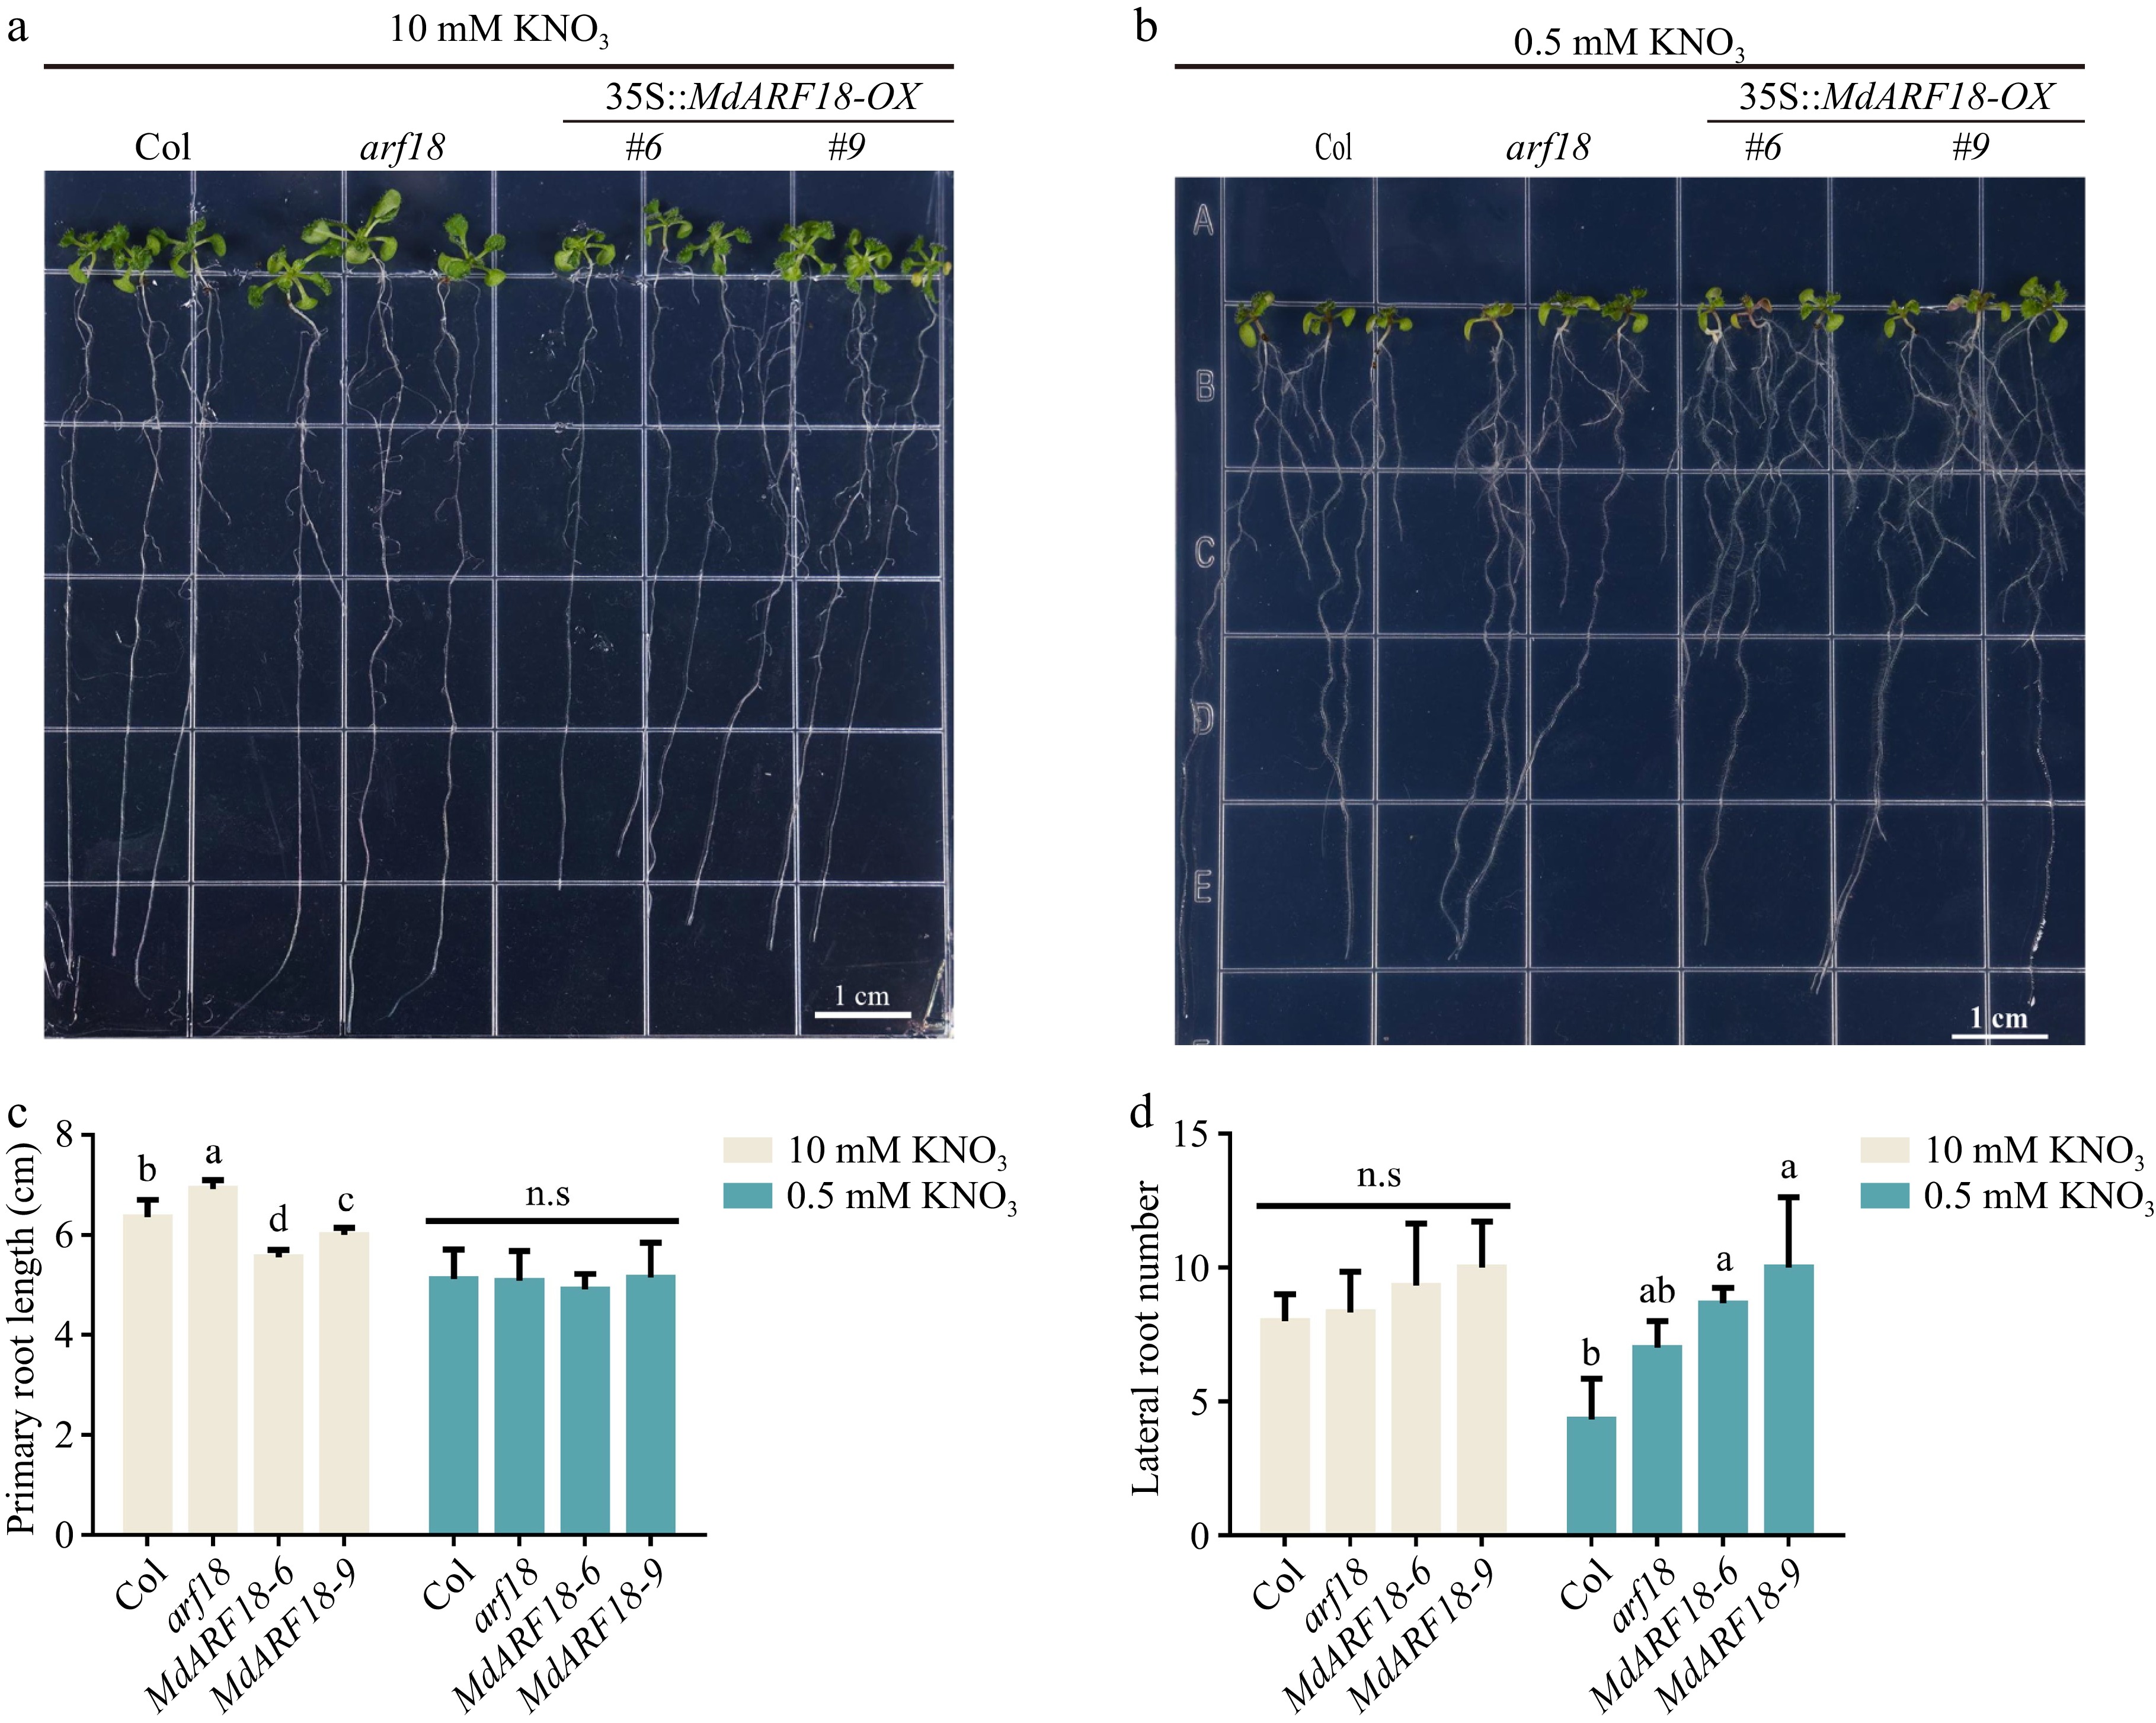
Figure 3.
MdARF18 inhibits root development. (a) MdARF18 inhibits root length at 10 mM nitrate concentration. (b) MdARF18 promotes lateral root growth at 0.5 mM nitrate concentration. (c) Primary root length statistics. (d) Lateral root number statistics. Bars represent the mean ± SD (n = 3). Different letters above the bars indicate significant differences using the LSD test (p < 0.05).
-
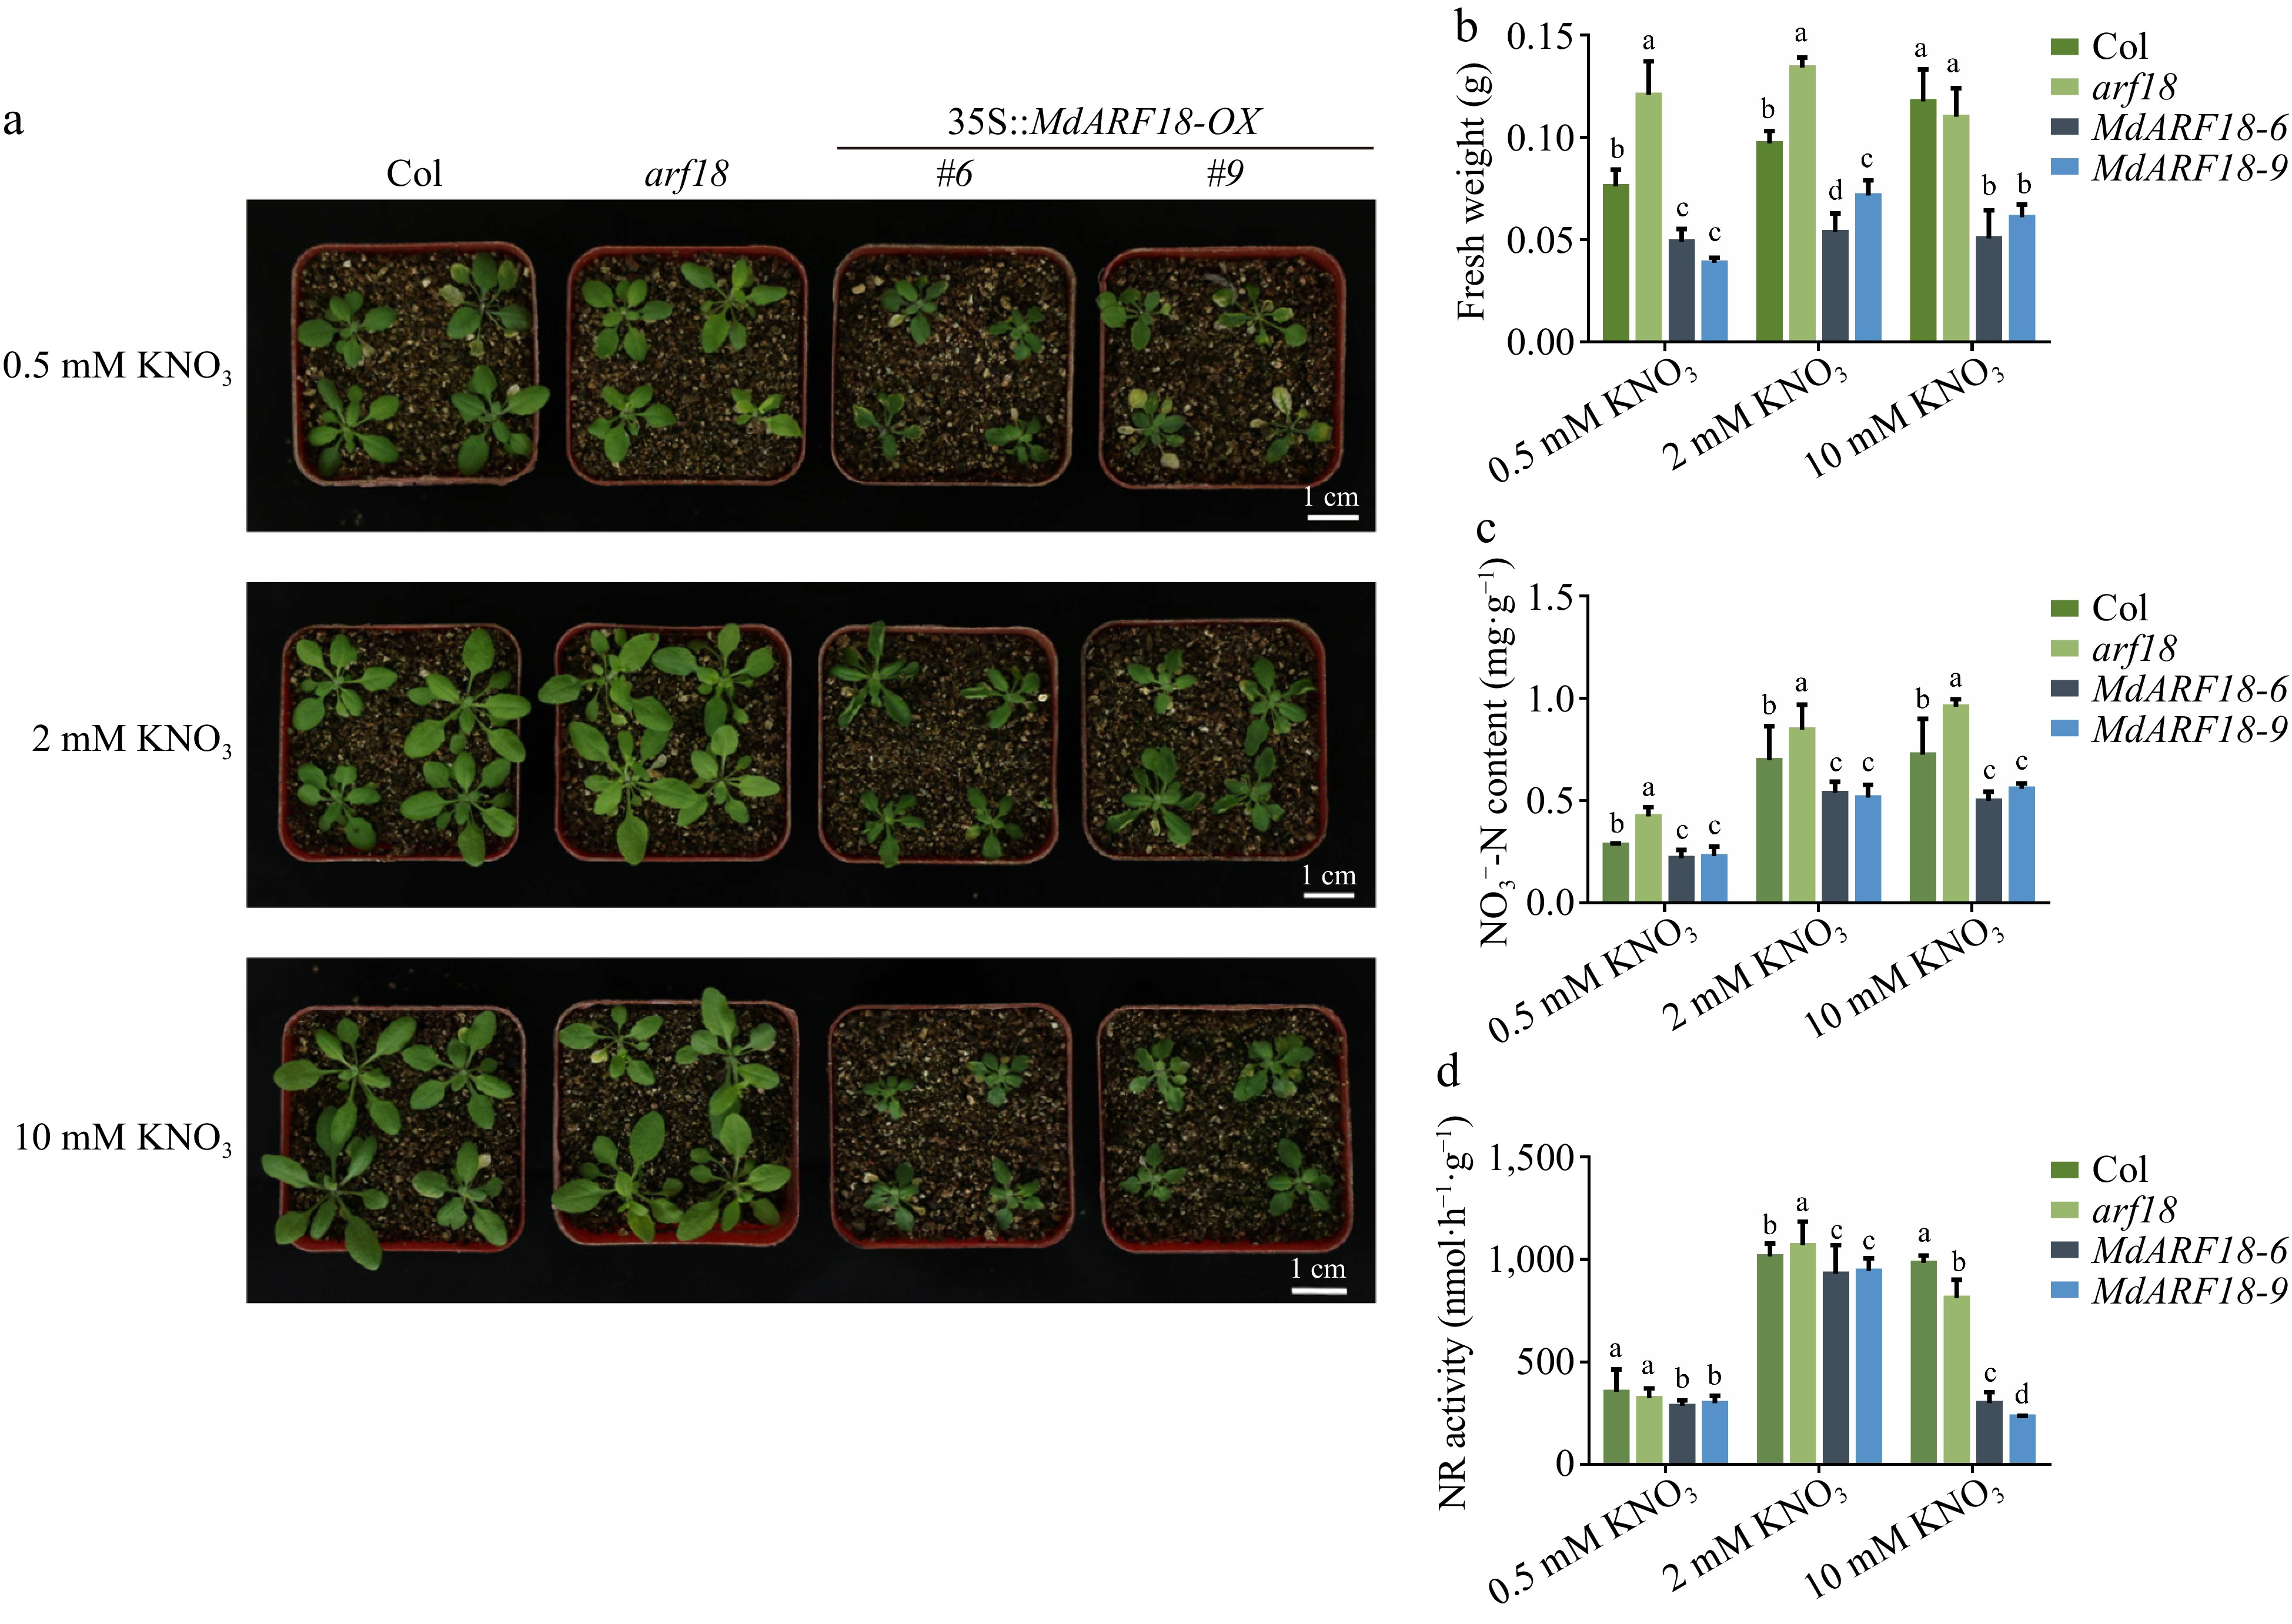
Figure 4.
Ectopic expression of MdARF18 inhibits Arabidopsis growth. (a) Status of Arabidopsis growth after one month of incubation at different nitrate concentrations. (b) Fresh weight of Arabidopsis. (c) Nitrate content of Arabidopsis. (d) NR activity in Arabidopsis. Bars represent the mean ± SD (n = 3). Different letters above the bars indicate significant differences using the LSD test (p < 0.05).
-
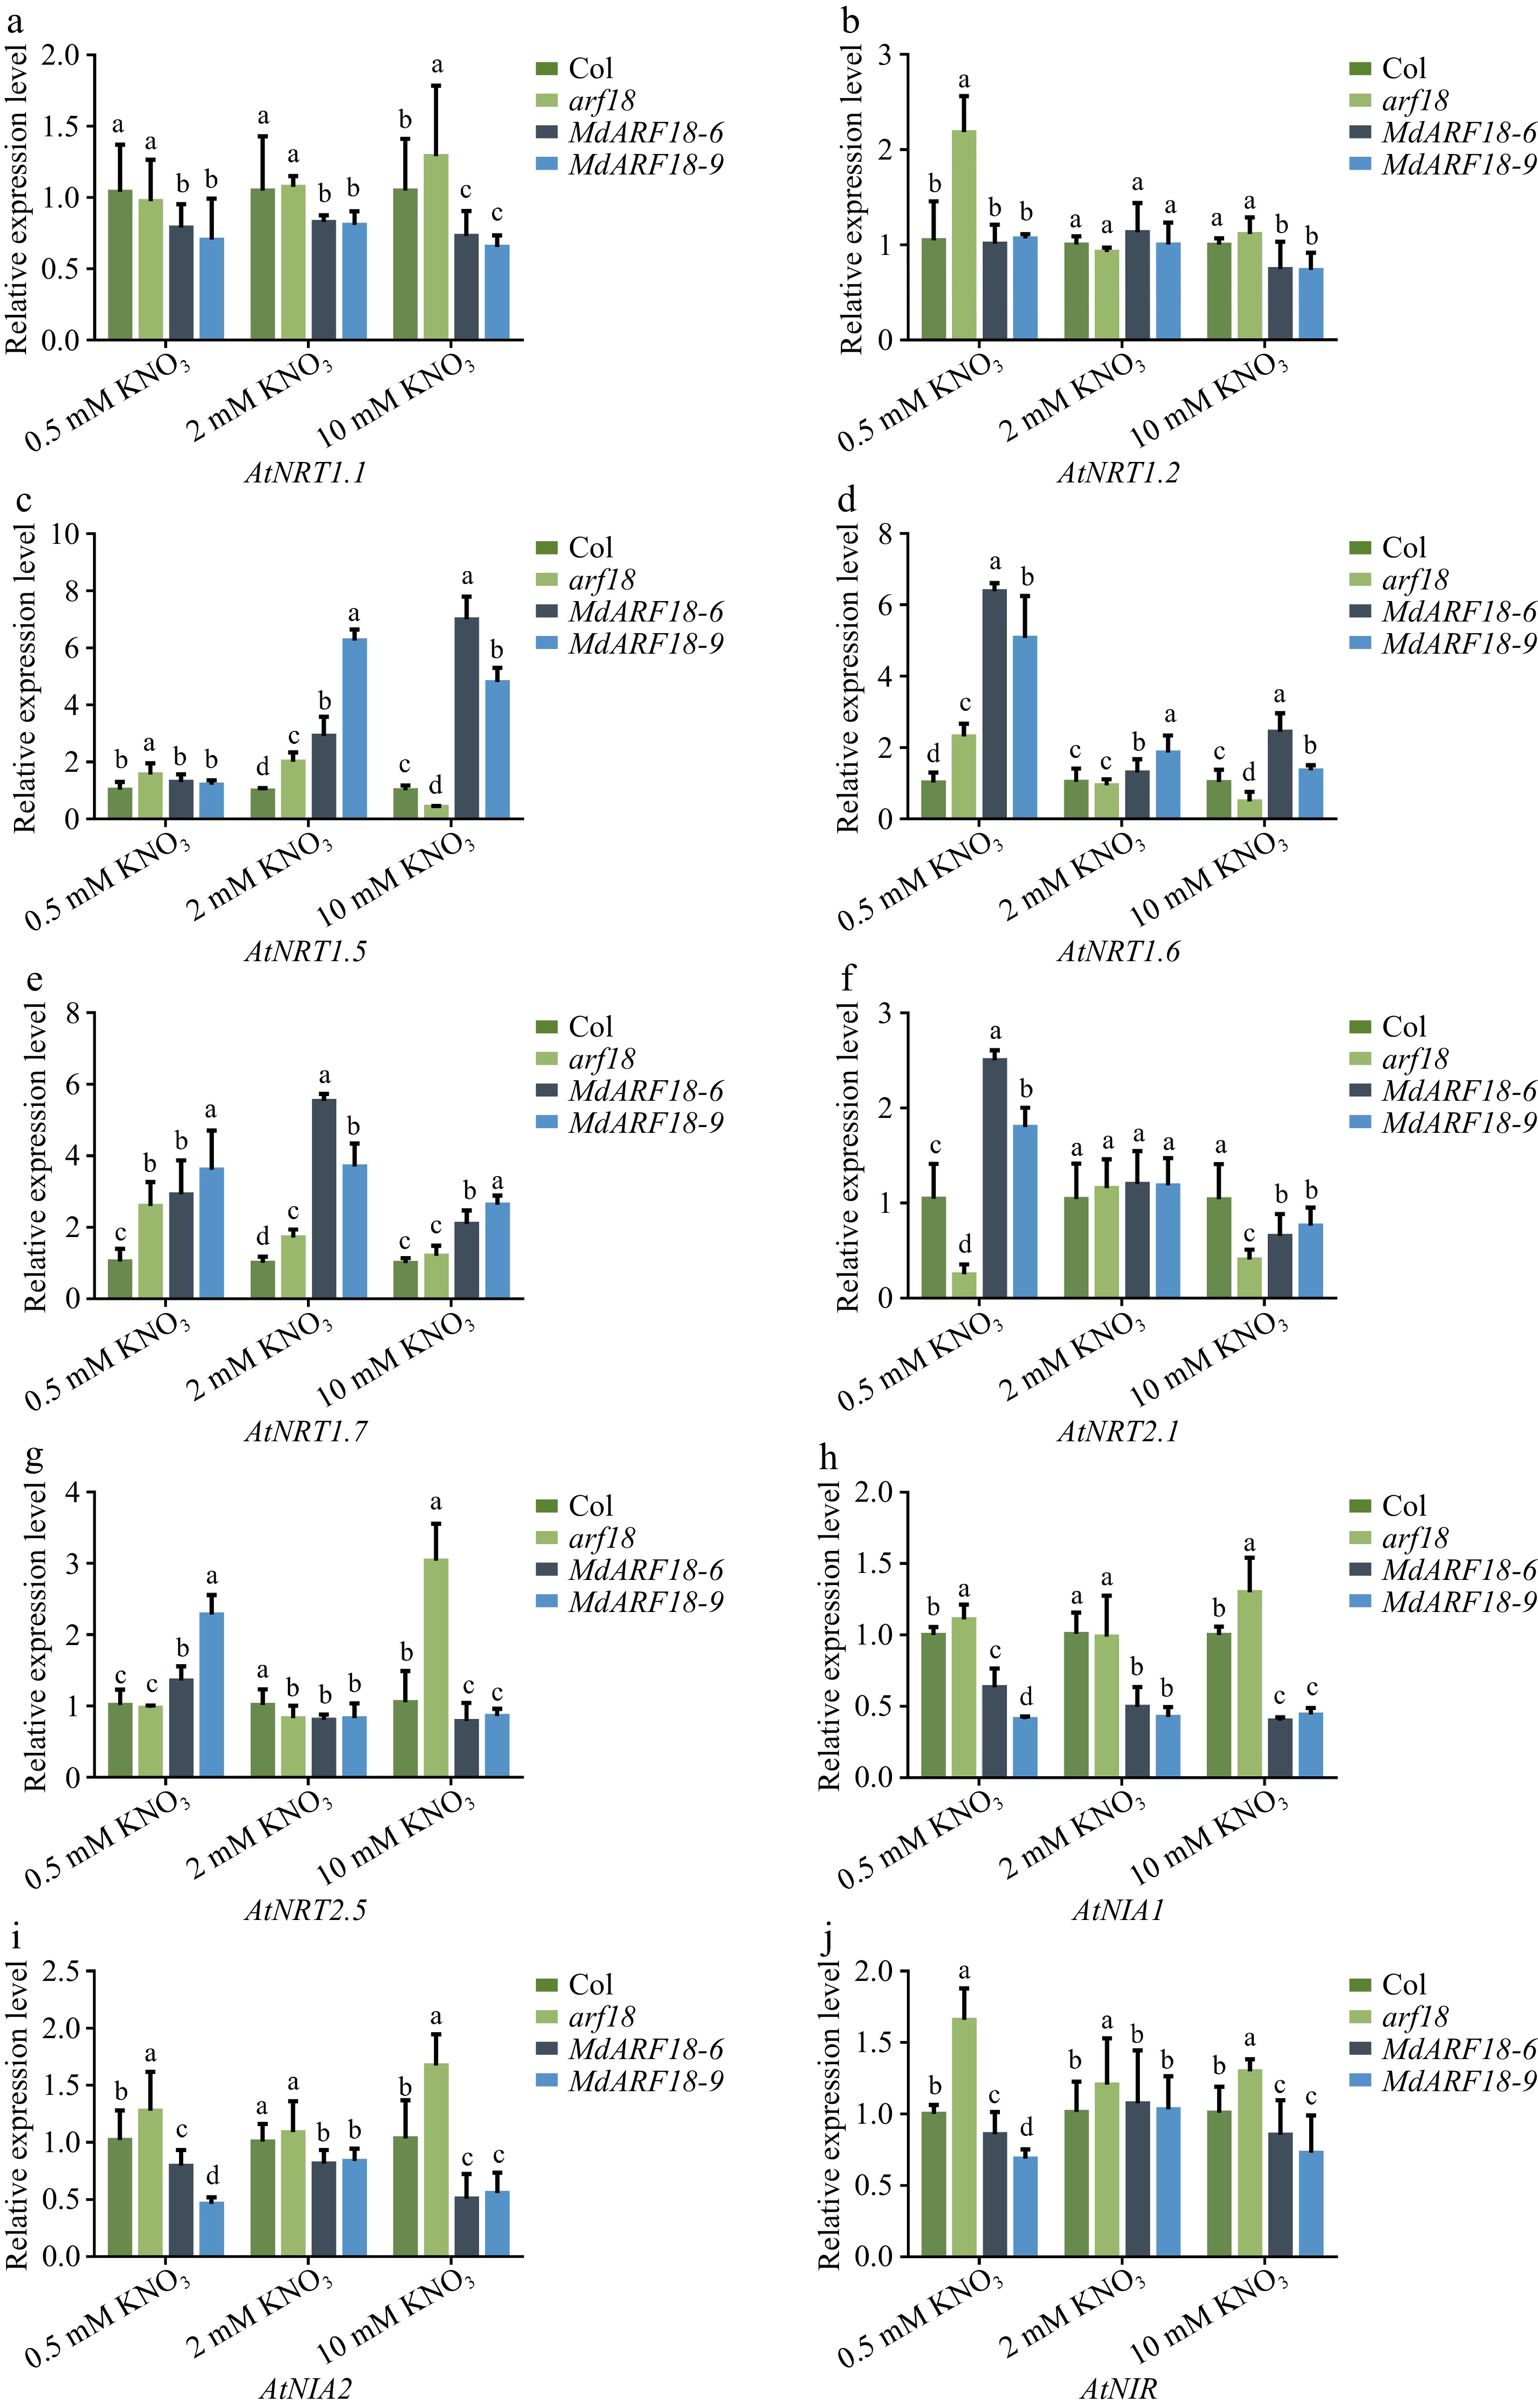
Figure 5.
qPCR-RT analysis of N-related genes. Expression analysis of N-related genes in MdARF18 transgenic Arabidopsis at different nitrate concentrations. Bars represent the mean ± SD (n = 3). Different letters above the bars indicate significant differences using the LSD test (p < 0.05).
-
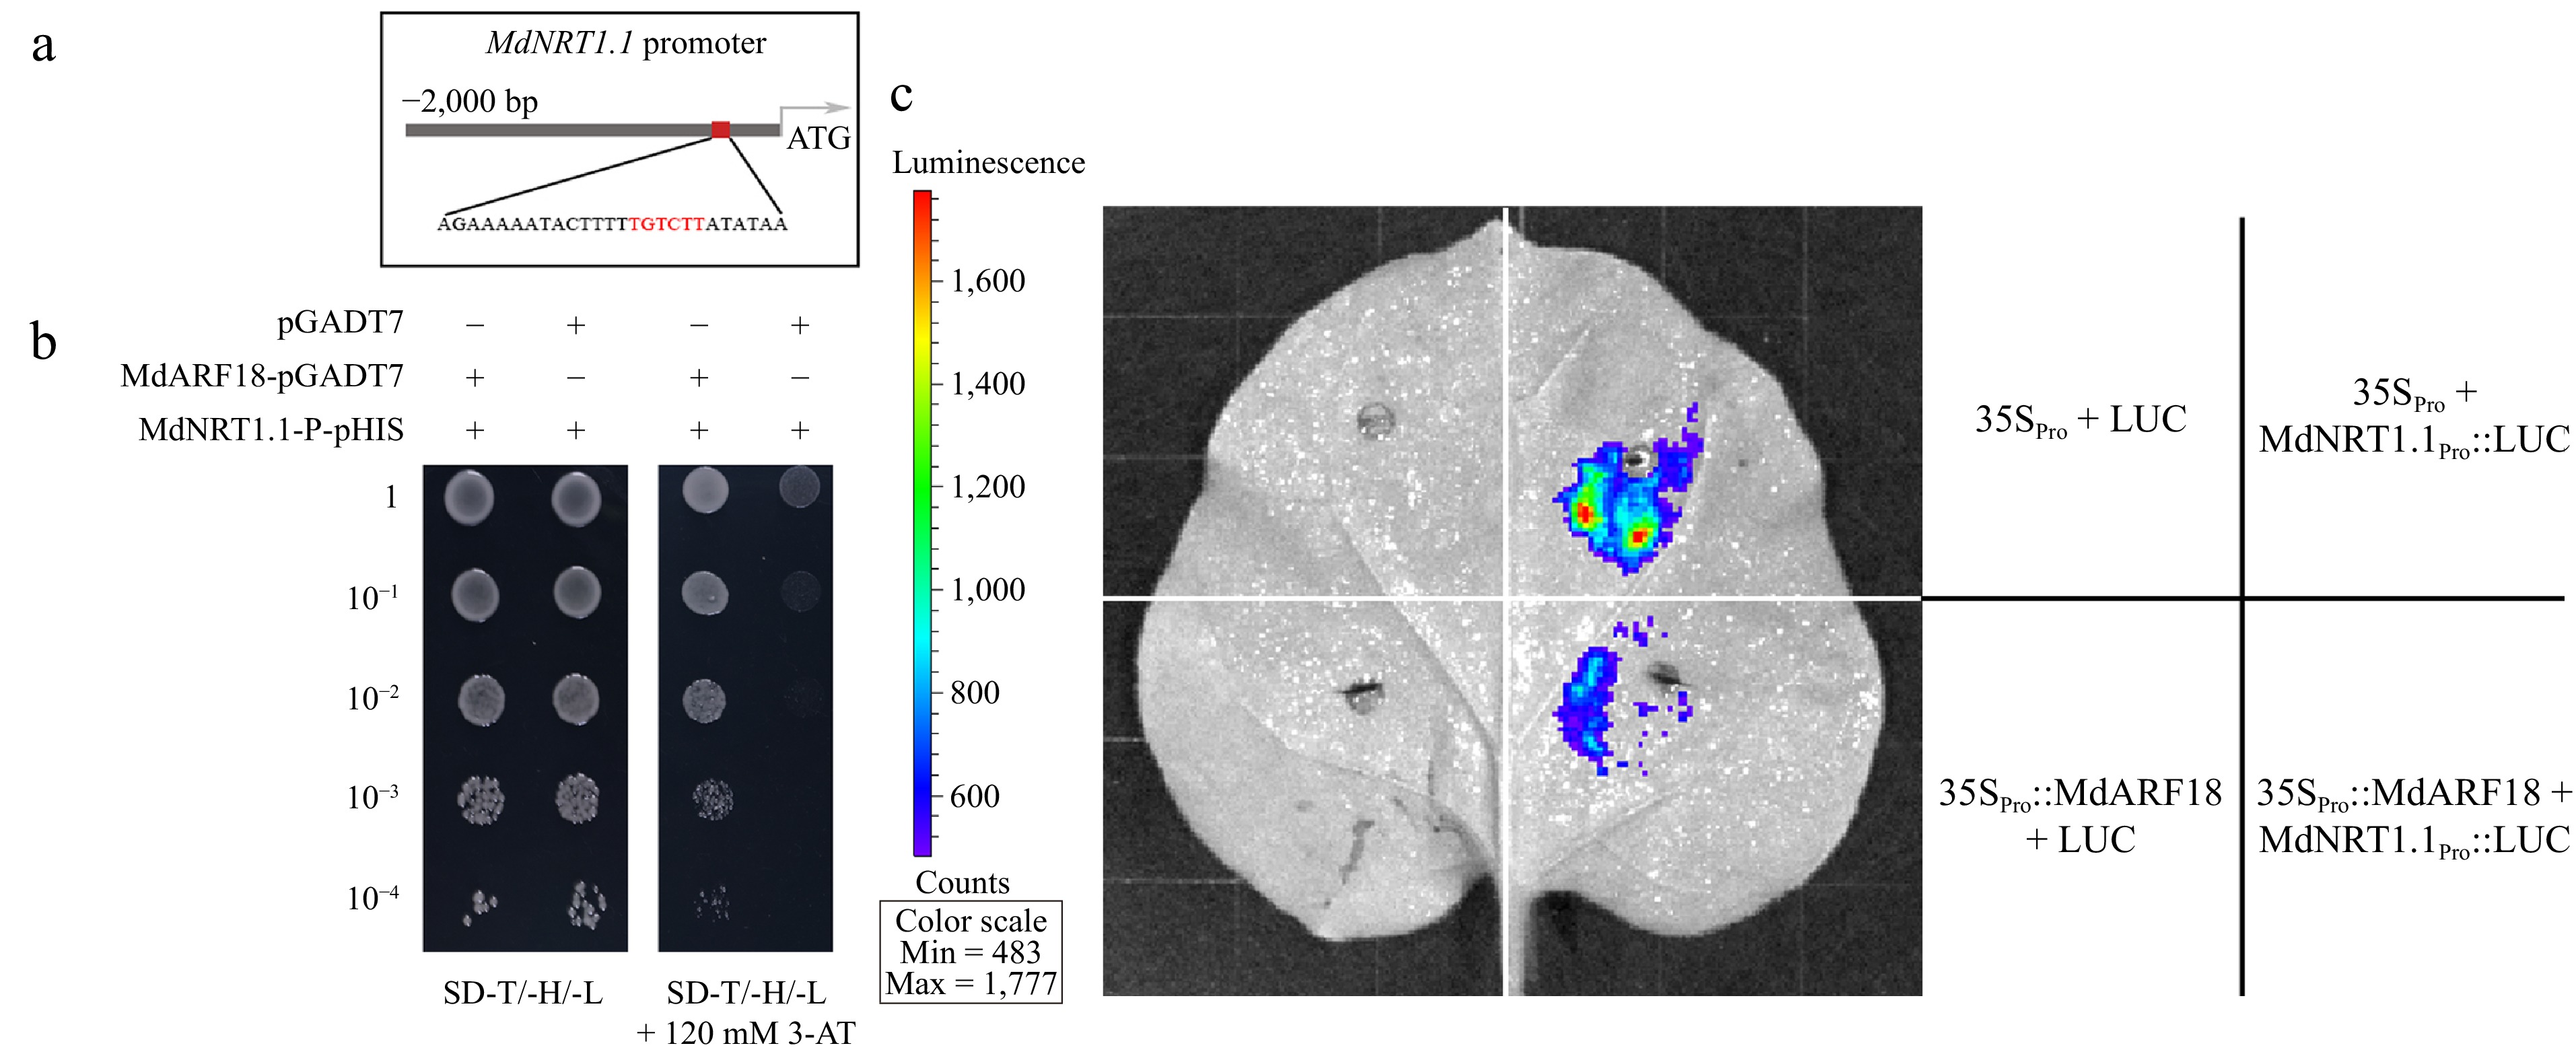
Figure 6.
MdARF18 binds directly to the promoter of MdNRT1.1. (a) Schematic representation of MdNRT1.1 promoter. (b) Y1H assay of MdARF18 bound to the MdNRT1.1 promoter in vitro. 10−1, 10−2, 10−3, and 10−4 indicate that the yeast concentration was diluted 10, 100, 1,000, and 10,000 times, respectively. 3-AT stands for 3-Amino-1,2,4-triazole. (c) Dual luciferase assays demonstrate the binding of MdARF18 with MdNRT1.1 promoter. The horizontal bar on the left side of the right indicates the captured signal intensity. Empty LUC and 35S vectors were used as controls. Representative images of three independent experiments are shown here.
-
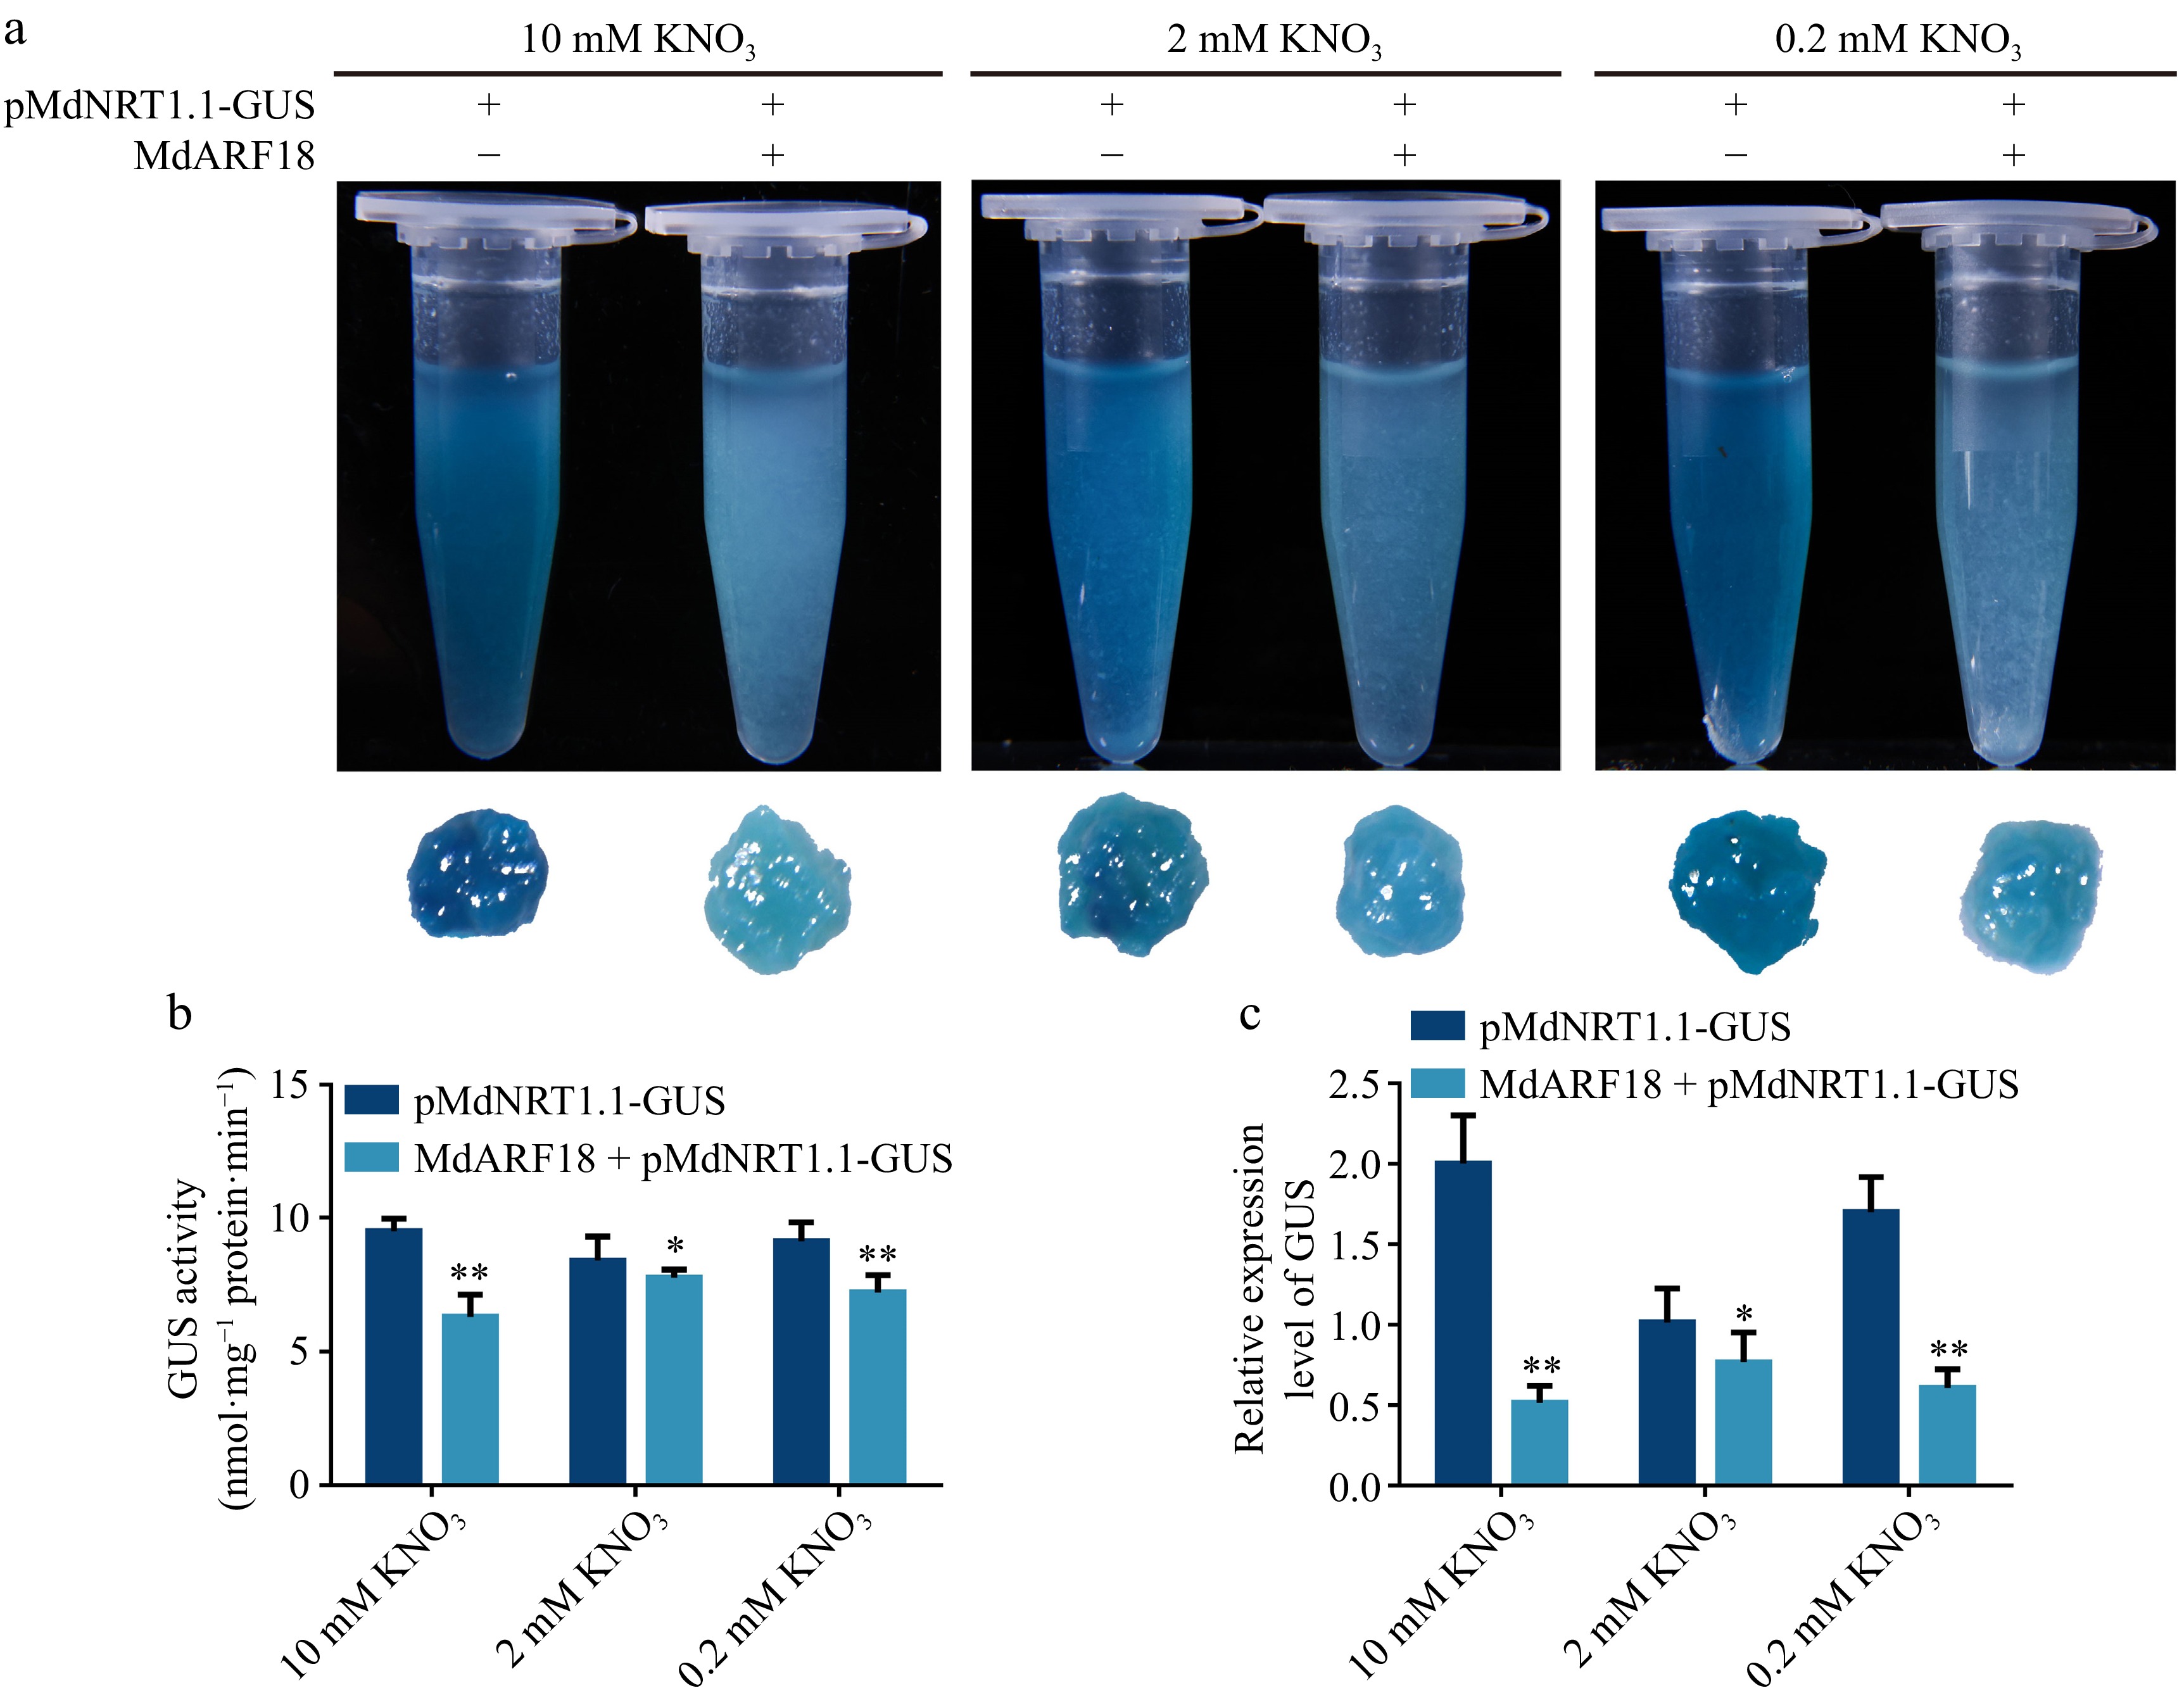
Figure 7.
MdARF18 inhibits the expression of MdNRT1.1. (a) GUS staining experiment of pMdNRT1.1::GUS transgenic calli and transgenic calli containing both pMdNRT1.1::GUS and 35S::MdARF18 with different nitrate treatments. (b) GUS activity assays in MdARF18 overexpressing calli with different nitrate treatments. (c) GUS expression level in MdARF18 overexpressing calli with different nitrate treatments. Bars represent the mean ± SD (n = 3). Different numbers of asterisk above the bars indicate significant differences using the LSD test (*p < 0.05 and **p< 0.01).
Figures
(7)
Tables
(0)