-
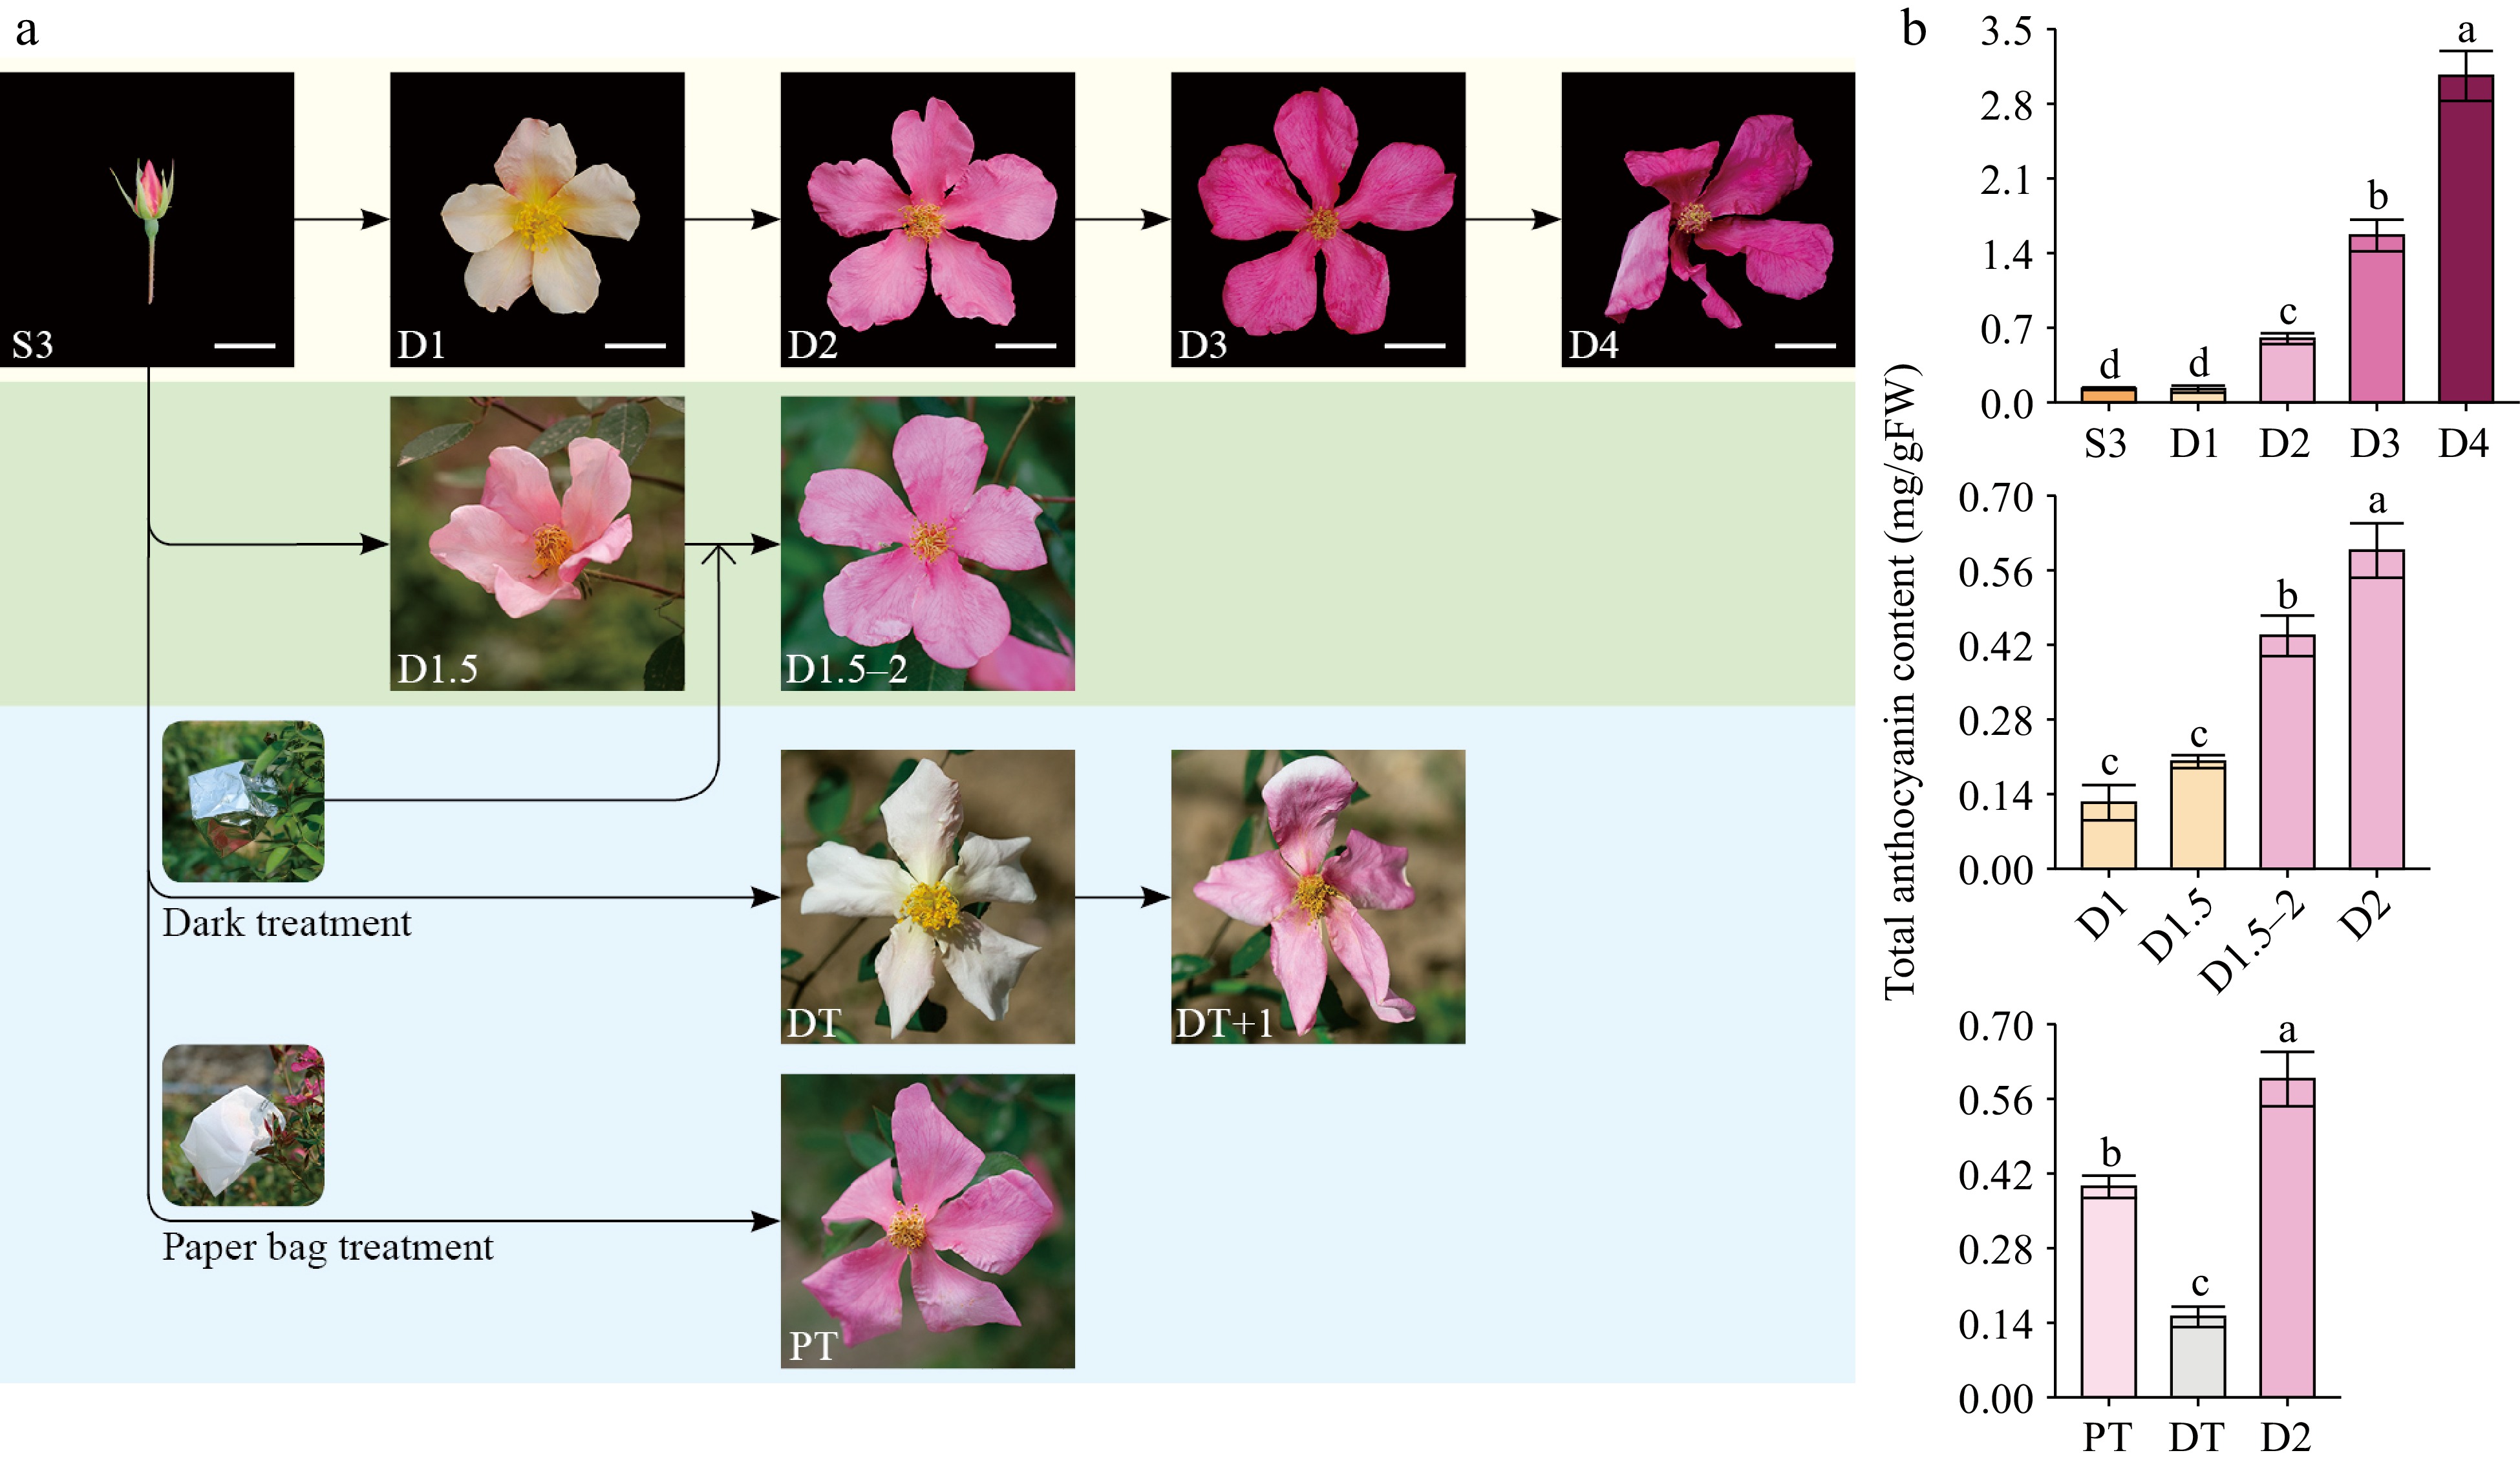
Figure 1.
Phenotypes and total anthocyanins contents of butterfly rose (R. chinensis 'Mutabilis') samples. (a) Photos of butterfly rose flowers under natural conditions and different treatments. Scale bars = 2 cm. S3, bud stage (one day before anthesis); D1, first day of anthesis; D2, second day of anthesis; D3, third day of anthesis; D4, fourth day of anthesis. PT, paper bag treatment, DT, dark treatment; DT+1, dark treatment flower exposed to natural sunlight conditions for one day. D1.5, flowers collected in the afternoon (17:30) on the first day of flowering; D1.5–2, flowers at the D1.5 stage that were dark treated until the next morning. (b) Total anthocyanin contents of different butterfly rose samples (n = 3–4). Different lowercase letters indicate statistically significant differences (ANOVA test, p < 0.05).
-
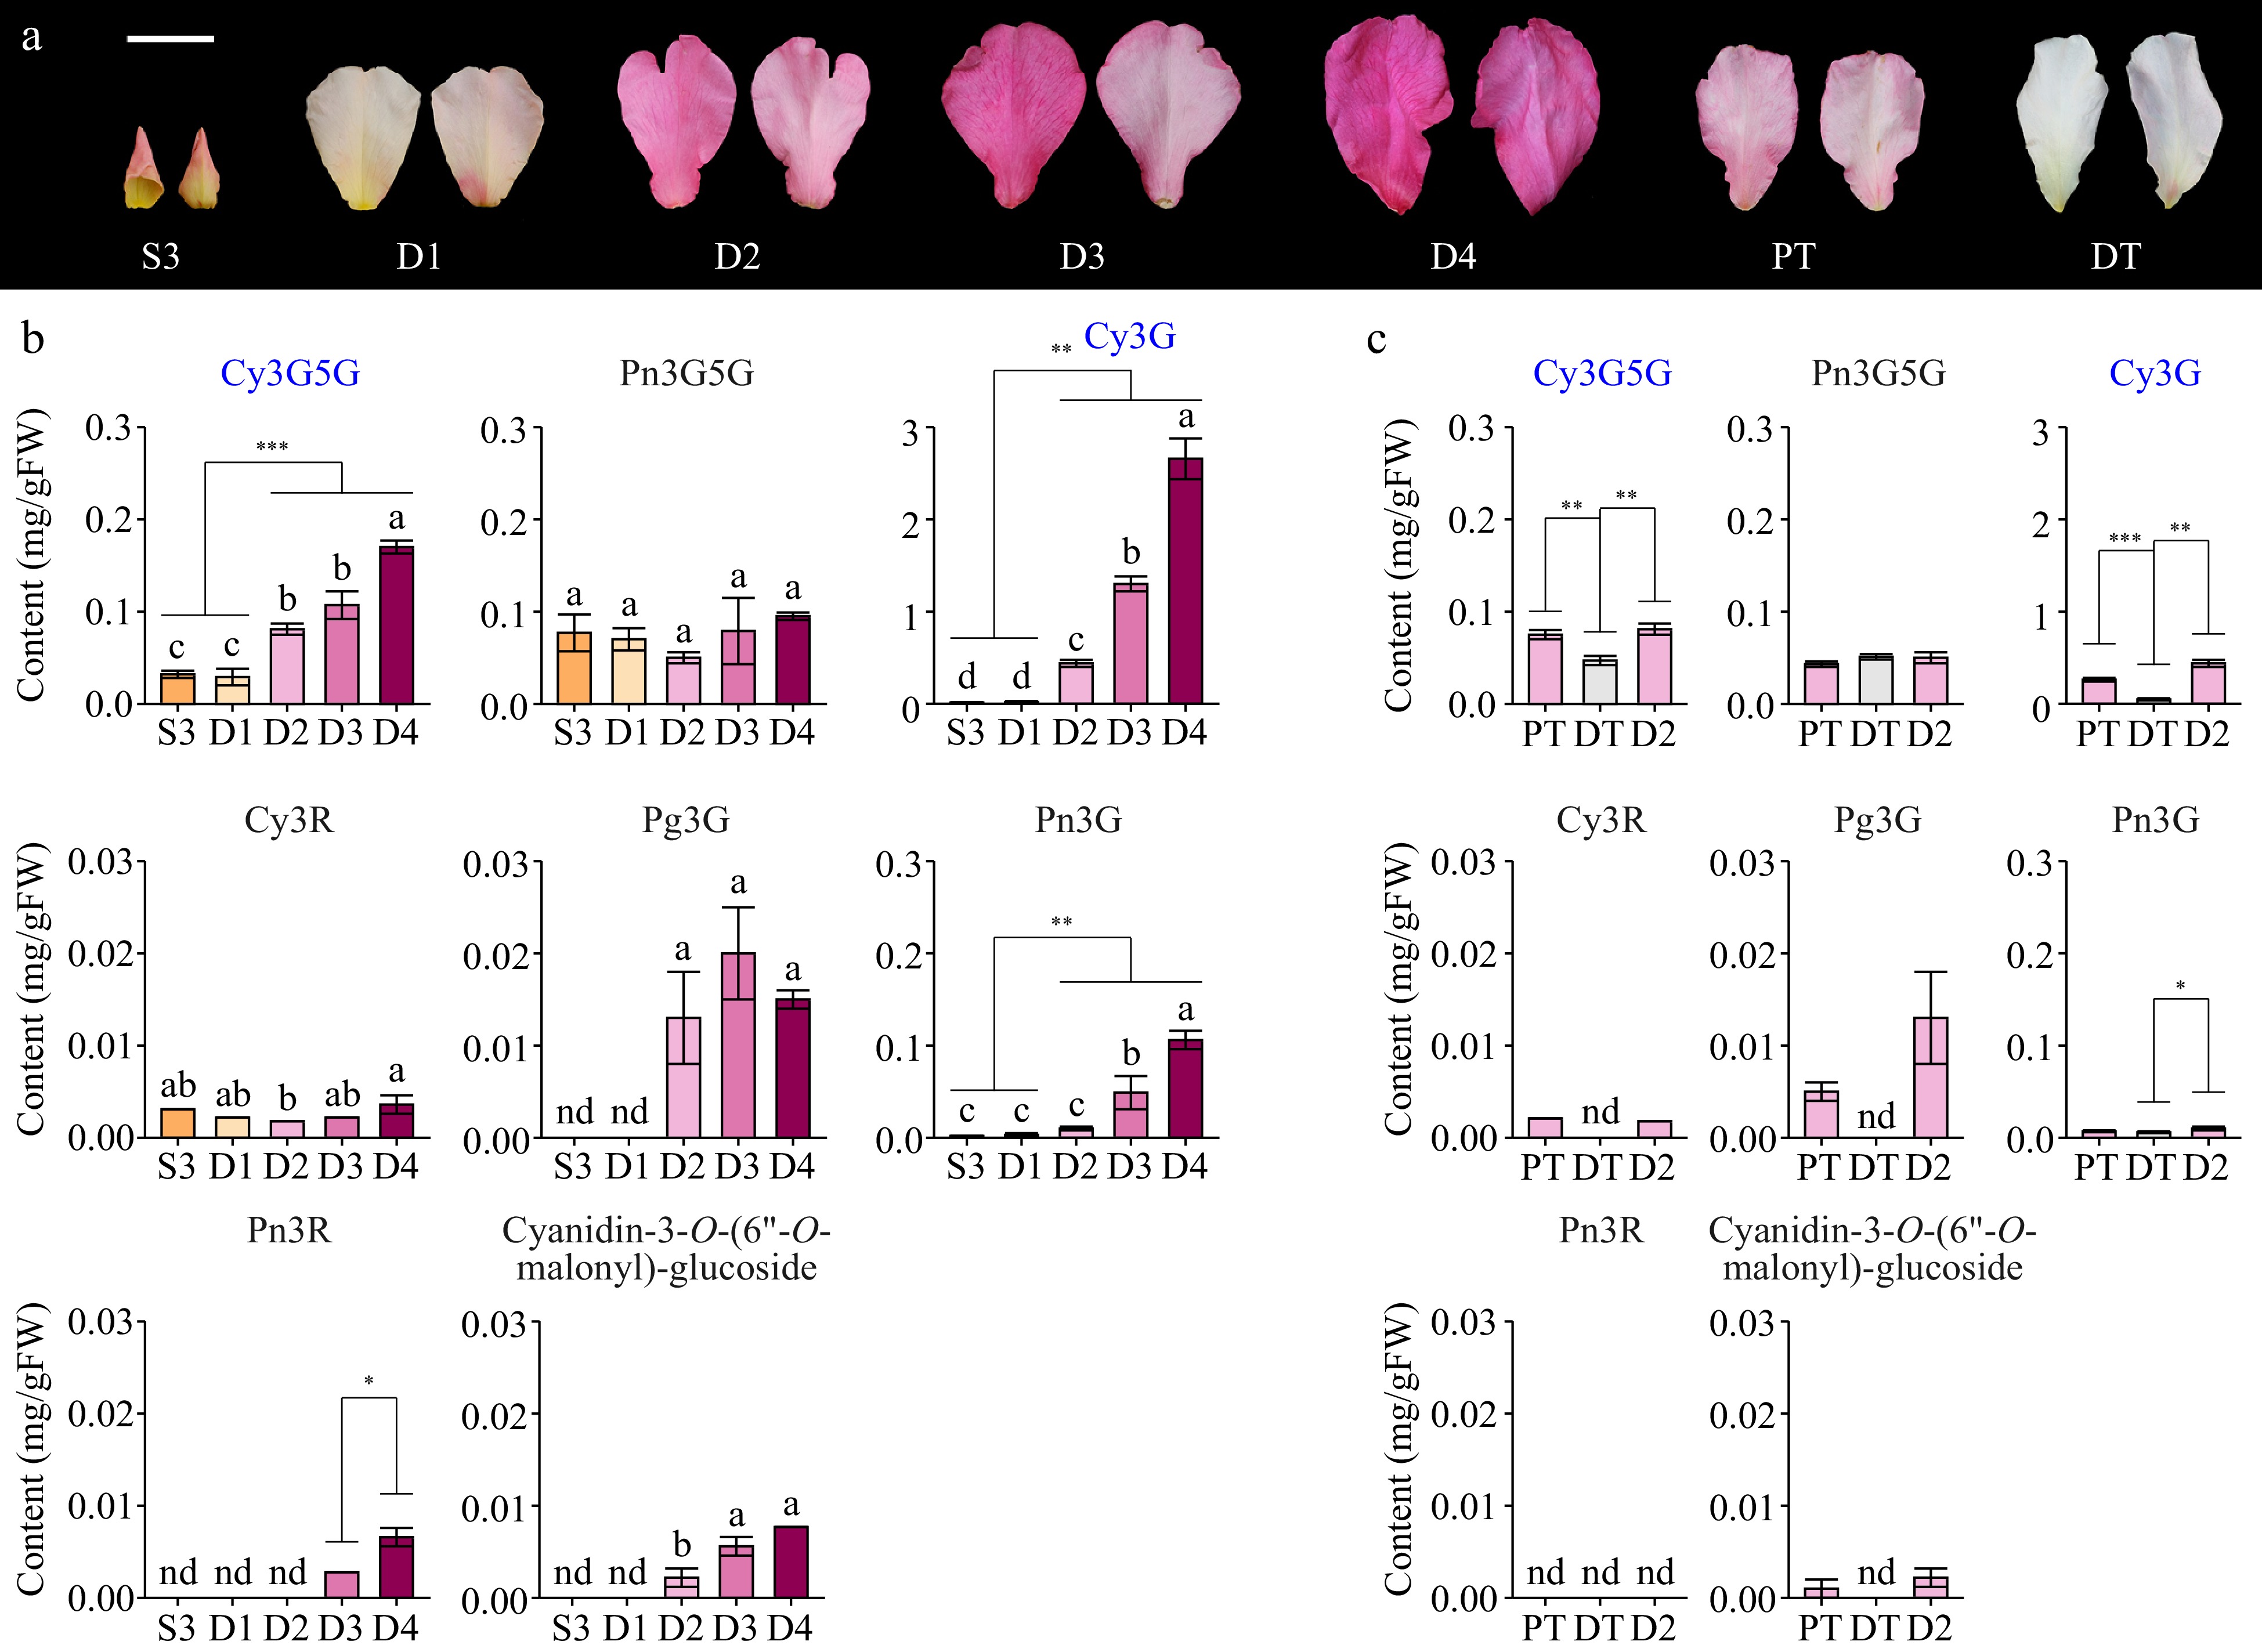
Figure 2.
Anthocyanin compositions in different butterfly rose samples. (a) Adaxial and abaxial surfaces of the petals are shown. Scale bar = 2 cm. (b) Anthocyanin contents of butterfly rose petals at different stages. (c) Anthocyanin contents of butterfly rose petals under different treatments. Data are presented as the mean ± standard error (n = 3–4). Pn3R, peonidin-3-O-rutinoside; Cy3R, cyanidin-3-O-rutinoside. Key anthocyanins are highlighted in blue. Different lowercase letters indicate statistically significant differences (ANOVA test, p < 0.05). nd, not detected. *p < 0.05, **p < 0.01, ***p < 0.001 by Student's t-test.
-
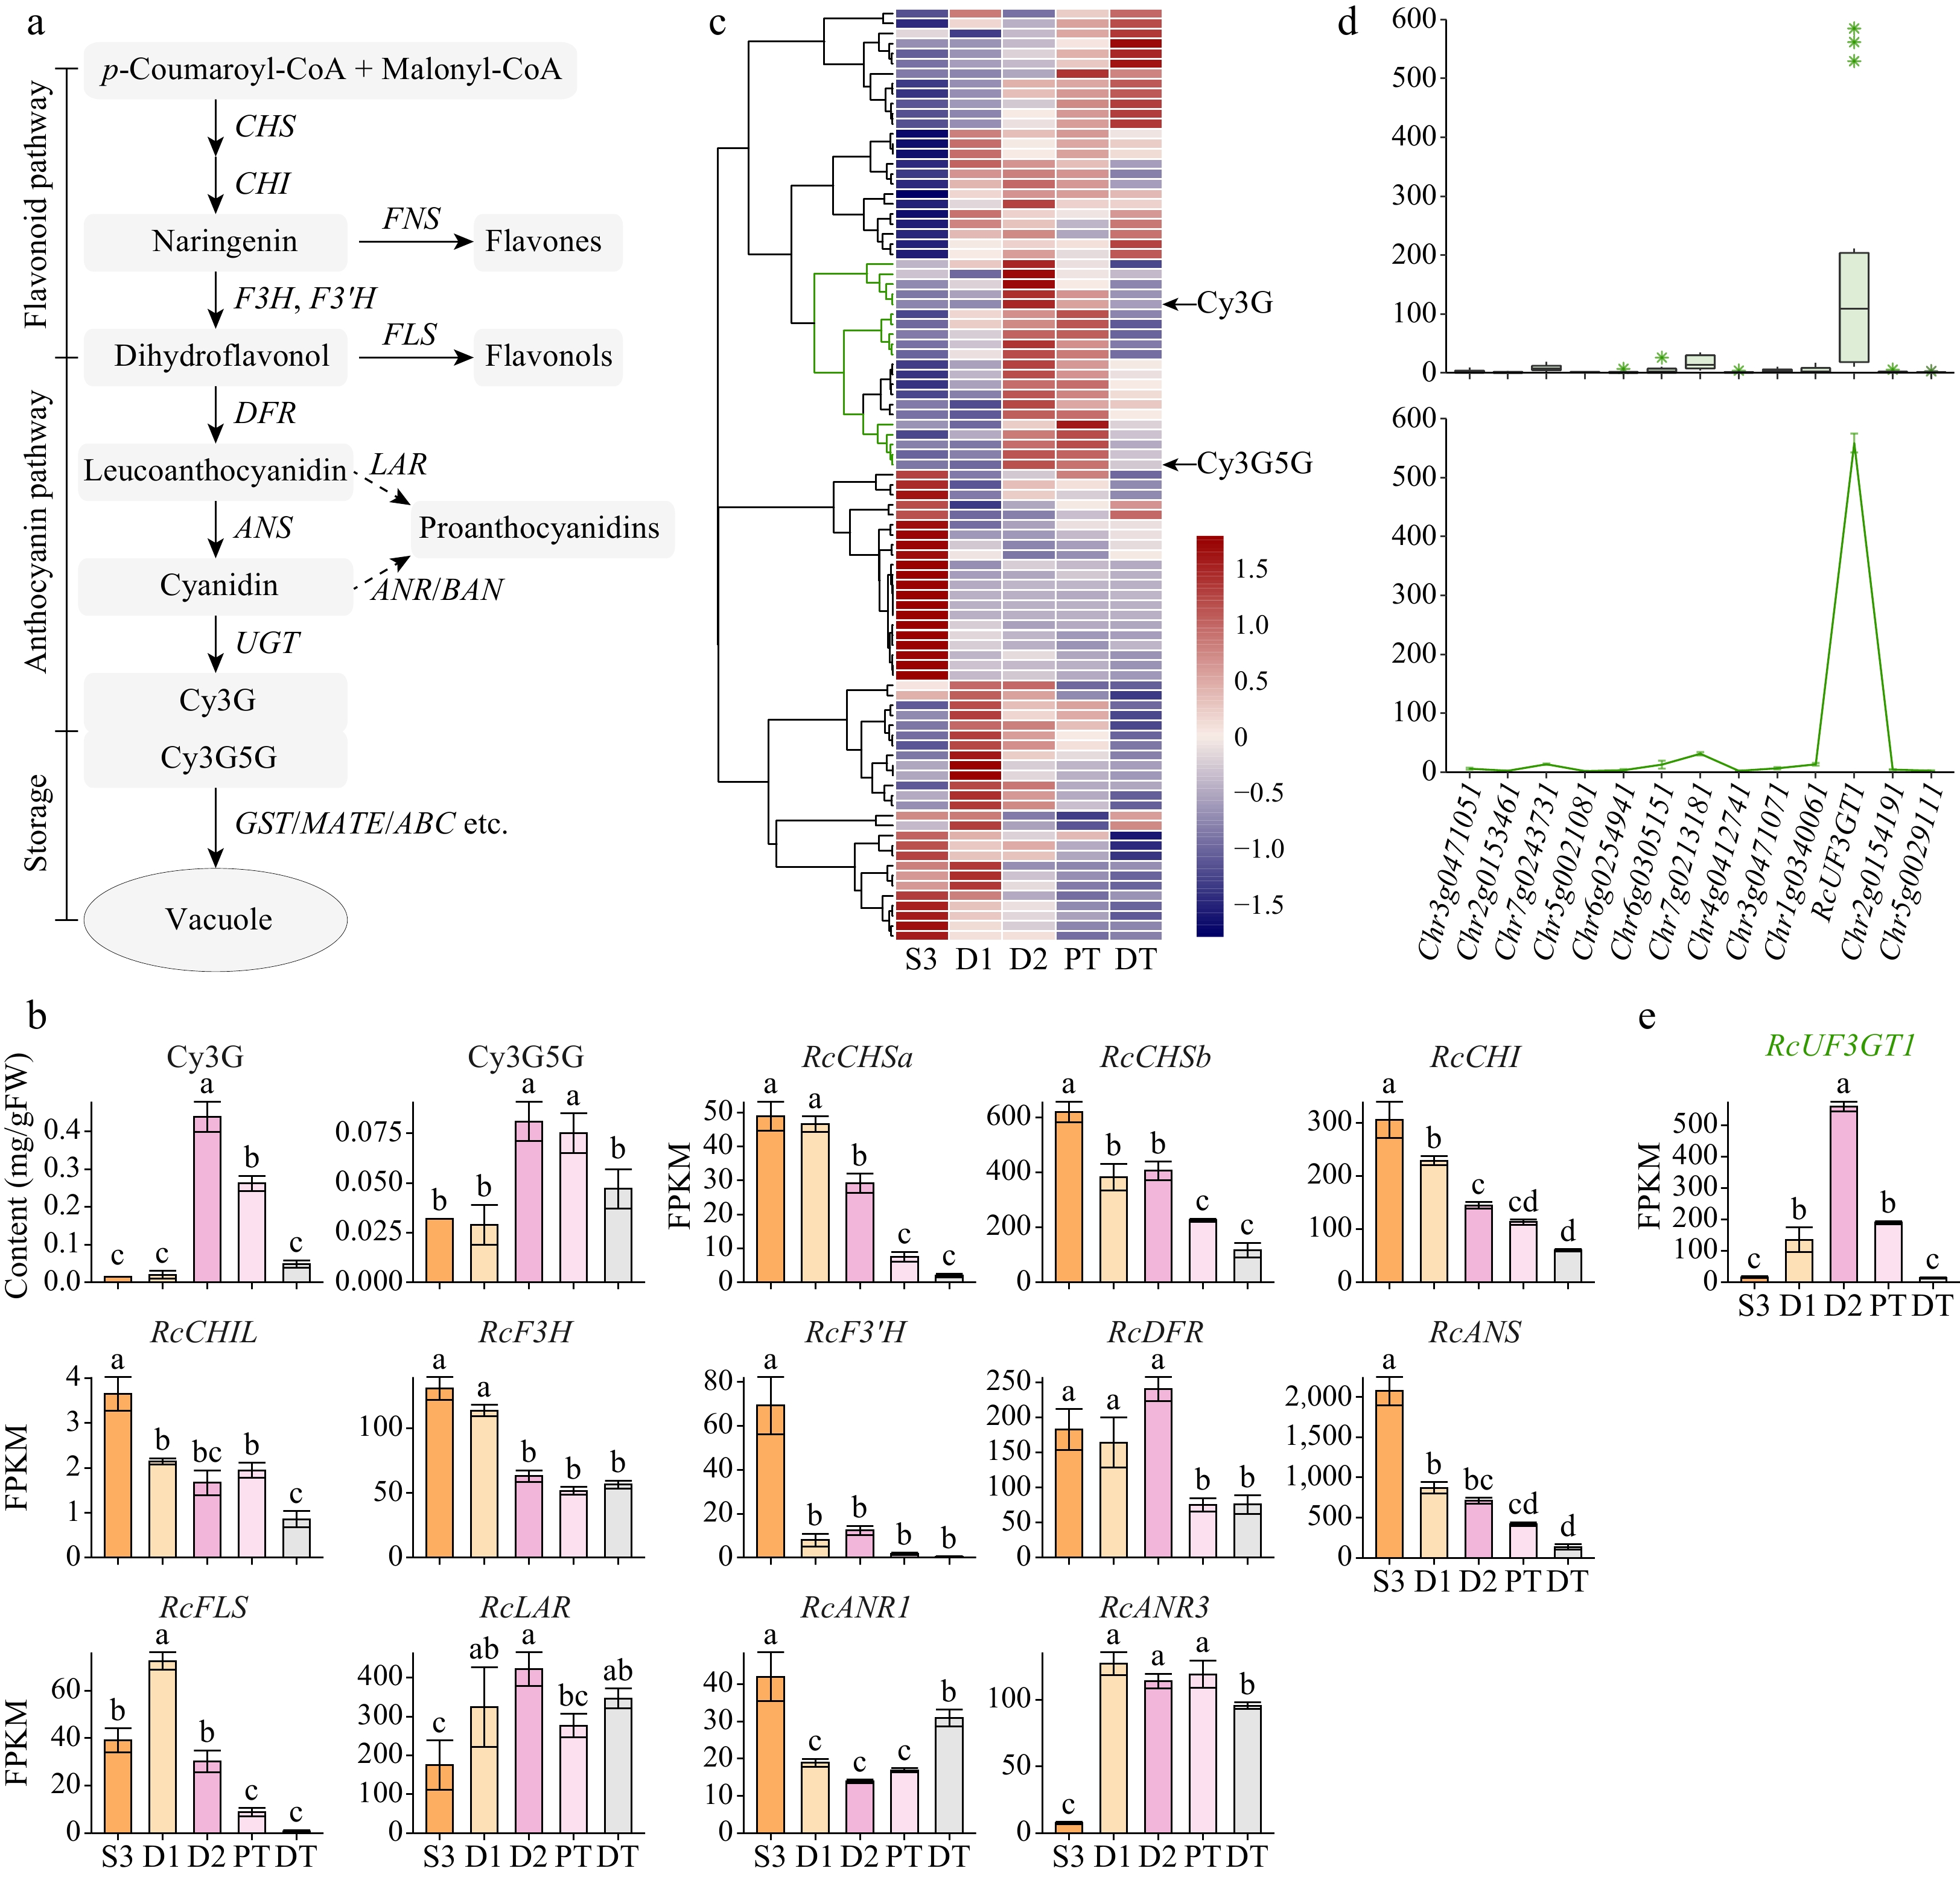
Figure 3.
Expression patterns of structural genes involved in the anthocyanin biosynthetic pathway. Data are presented as the mean ± standard error (n = 3). Different lowercase letters indicate statistically significant differences (ANOVA test, p < 0.05). (a) Schematic representation of the anthocyanin biosynthetic pathway in plant cells[23]. CHS, chalcone synthase; CHI, chalcone isomerase; FNS, flavone synthase; F3H, flavanone 3-hydroxylase; F3'H, flavonoid 3'-hydroxylase; FLS, flavonol synthase; DFR, dihydroflavonol reductase; ANS, anthocyanidin synthase; UGT, UDP-glycosyltransferase; LAR, leucoanthocyanidin reductase; ANR, anthocyanidin reductase; BAN, BANYULS. (b) Expression profiles of two key anthocyanins and structural genes in anthocyanin biosynthetic pathway (excluding UGT genes). (c) Clustering heatmap of UGT genes expressed in petals (Pearson correlation, clustering_method = 'complete'). (d) Expression levels of candidate UGT genes. Boxplot, average expression levels in five samples; line plot, expression levels in D2 samples. RcUF3GT1, RchiOBHmChr1g0383951. (e) Expression patterns of RcUF3GT1 in five samples.
-
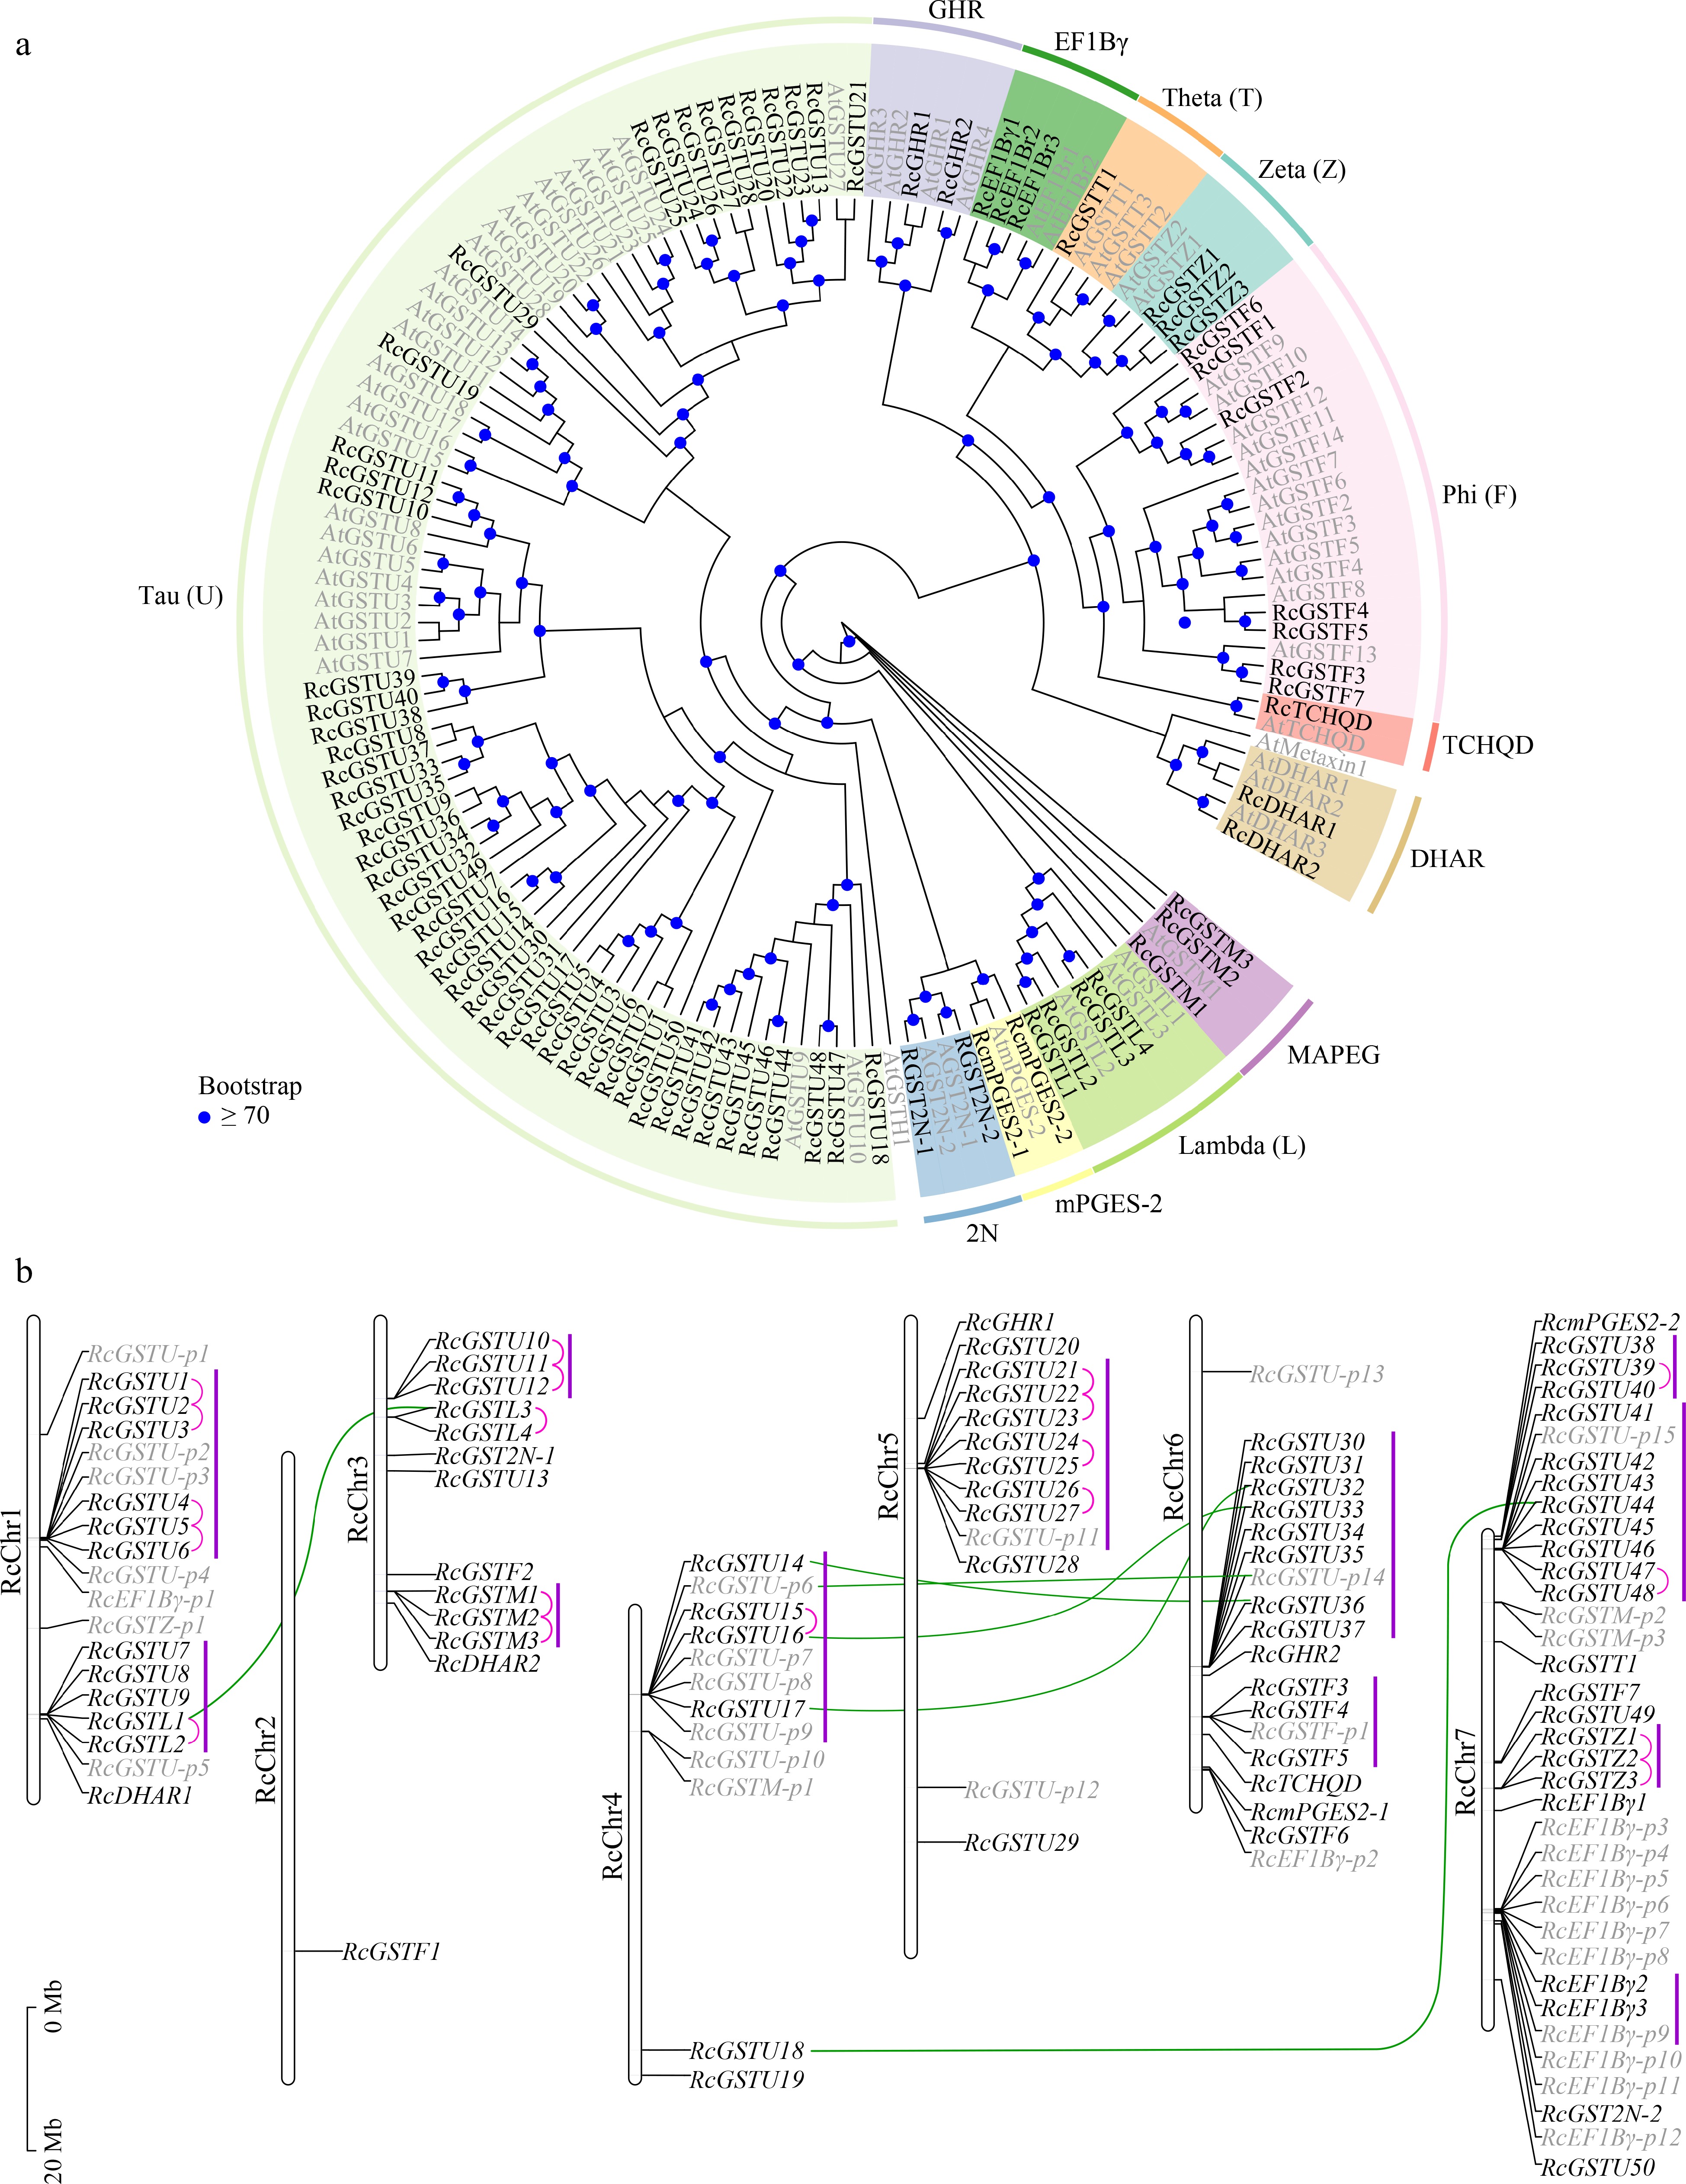
Figure 4.
Identification and analysis of GSTs in the R. chinensis genome. (a) Maximum likelihood phylogenetic analysis and classification of putative full-length RcGST genes. Genome IDs of AtGSTs (shown in gray) are listed in Supplemental Table S2. (b) Chromosomal distribution of full-length and partial RcGST genes. Full-length GST genes are represented by black letters; putative partial GST (GST-p) genes are represented by gray letters. Pink lines indicate tandemly duplicated genes; green lines indicate segmentally duplicated genes. Gene clusters are indicated by purple lines.
-
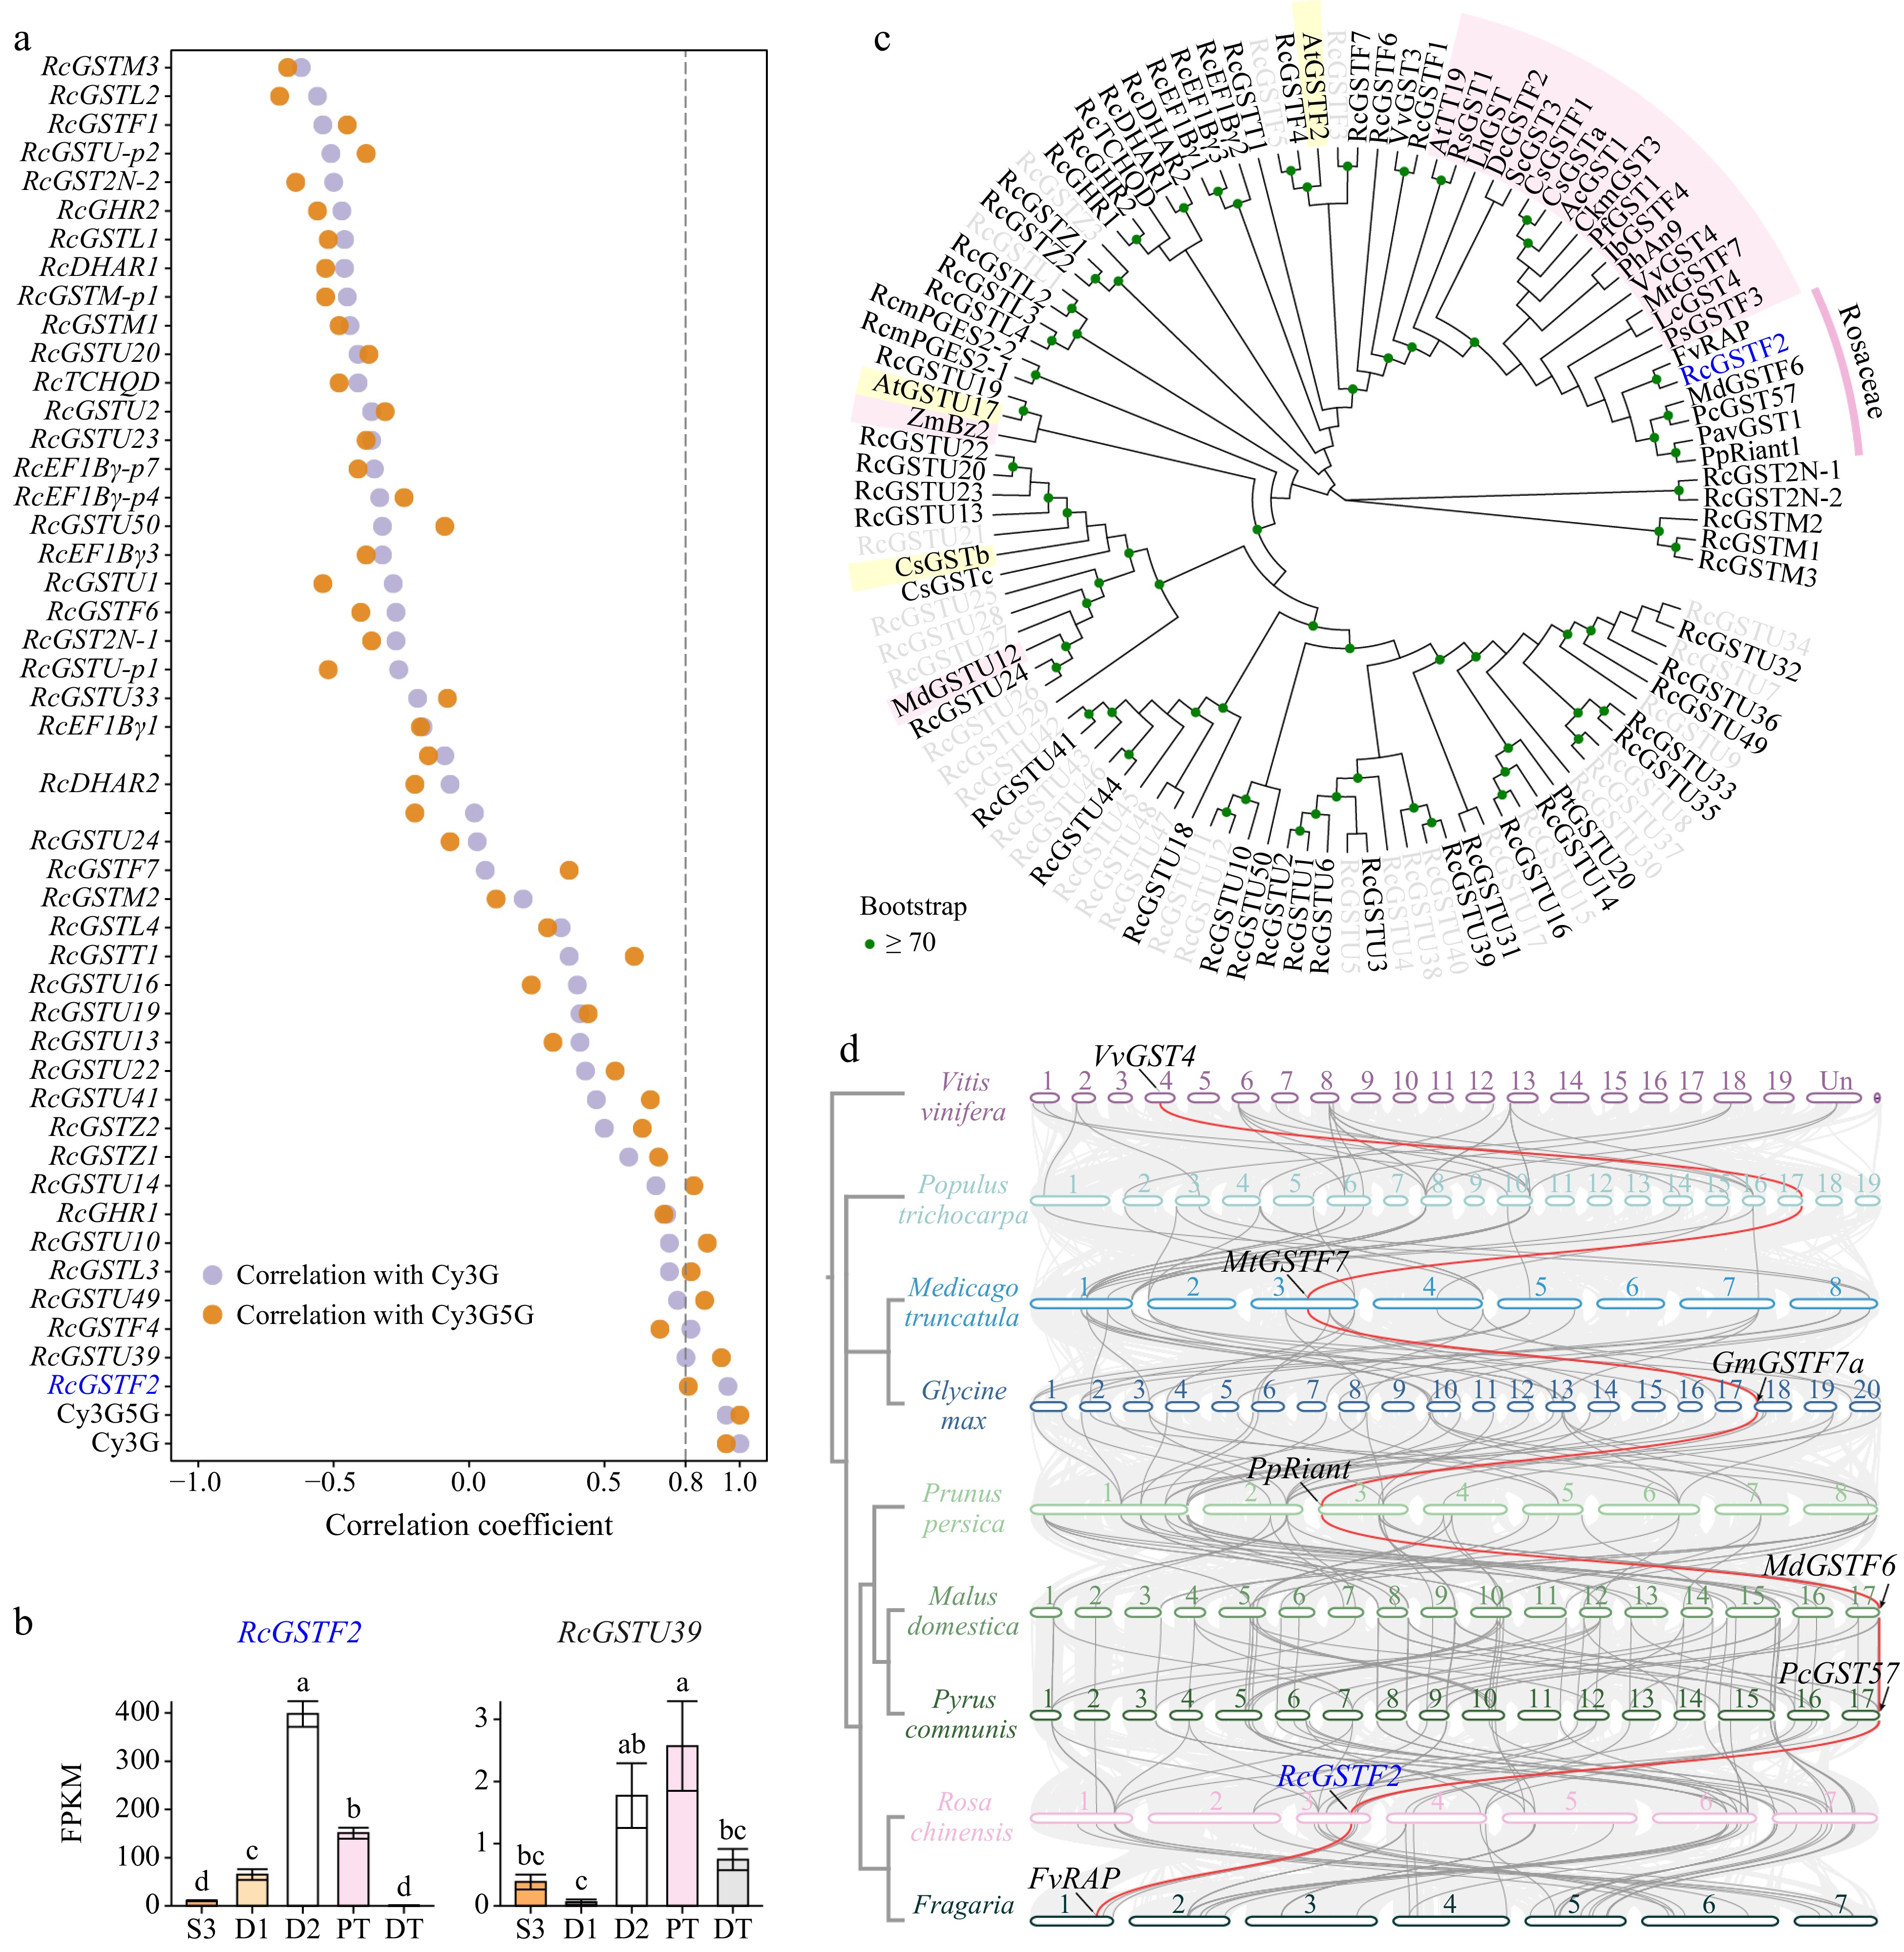
Figure 5.
GST(s) involved in anthocyanin transport. (a) Pearson correlation coefficient between petal-expressed RcGSTs and two key anthocyanins in five samples. (b) Expression profiles of two key anthocyanins and two candidate RcGSTs in different samples. Data are presented as the mean ± standard error (n = 3). Different lowercase letters indicate statistically significant differences (ANOVA test, p < 0.05). (c) Neighbor-joining phylogenetic tree of full-length RcGSTs and other characterized GST proteins. Encoding proteins of the RcGSTs that were not expressed in butterfly rose petals are represented by gray letters. GSTs involved in anthocyanin transport and flavonoid transport are highlighted with pink and yellow backgrounds, respectively. GST sequences used in this analysis are listed in Supplemental Table S6. (d) Inter-species collinearity analysis among eight fabid plants and grapevine. Collinear blocks are represented by light gray lines in the background; collinear GST genes are represented by gray lines; collinear genes of RcGSTF2 are highlighted in red. GSTs characterized in these species were labeled as follows: VvGST4, NP_001267869.1 (VIT_13s0067g03420); MtGSTF7, Medtr3g064700[35]; GmGSTF7a, Glyma.18G043700[35]; PpRiant (PpGST1), Prupe.3G013600[28,29]; MdGSTF6, MD17G1272100[22]; PcGST57, pycom17g27080[78]; FvRAP, FvH4_1g27460[32].
-
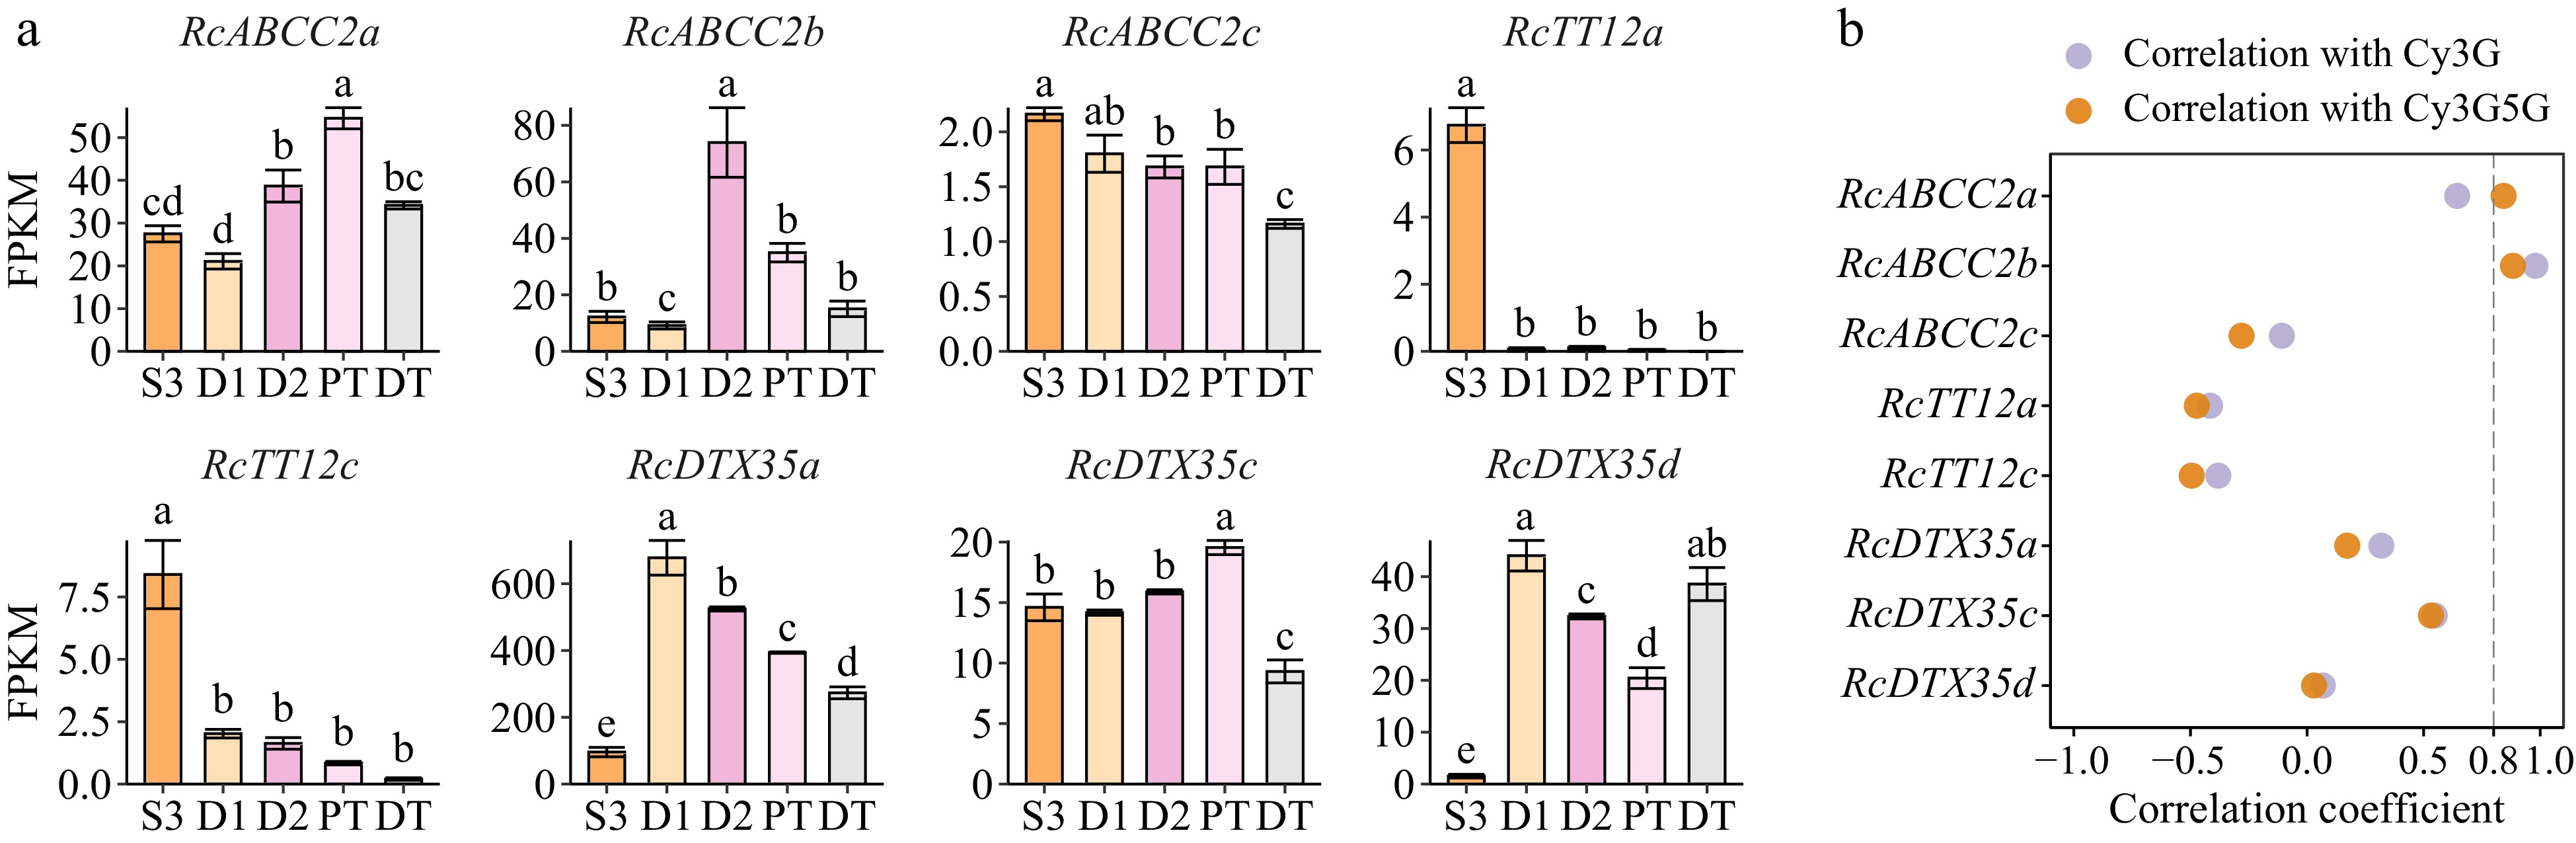
Figure 6.
Orthologs of anthocyanin-related MATE and ABCC transporters in butterfly rose petals. Their genome IDs are listed in Supplemental Table S7. (a) Expression patterns of ABC and MATE genes in different samples of butterfly rose. Data are presented as the mean ± standard error (n = 3). Different lowercase letters indicate statistically significant differences (ANOVA test, p < 0.05). (b) Pearson correlation coefficient between candidate genes and two key anthocyanins in five samples.
-
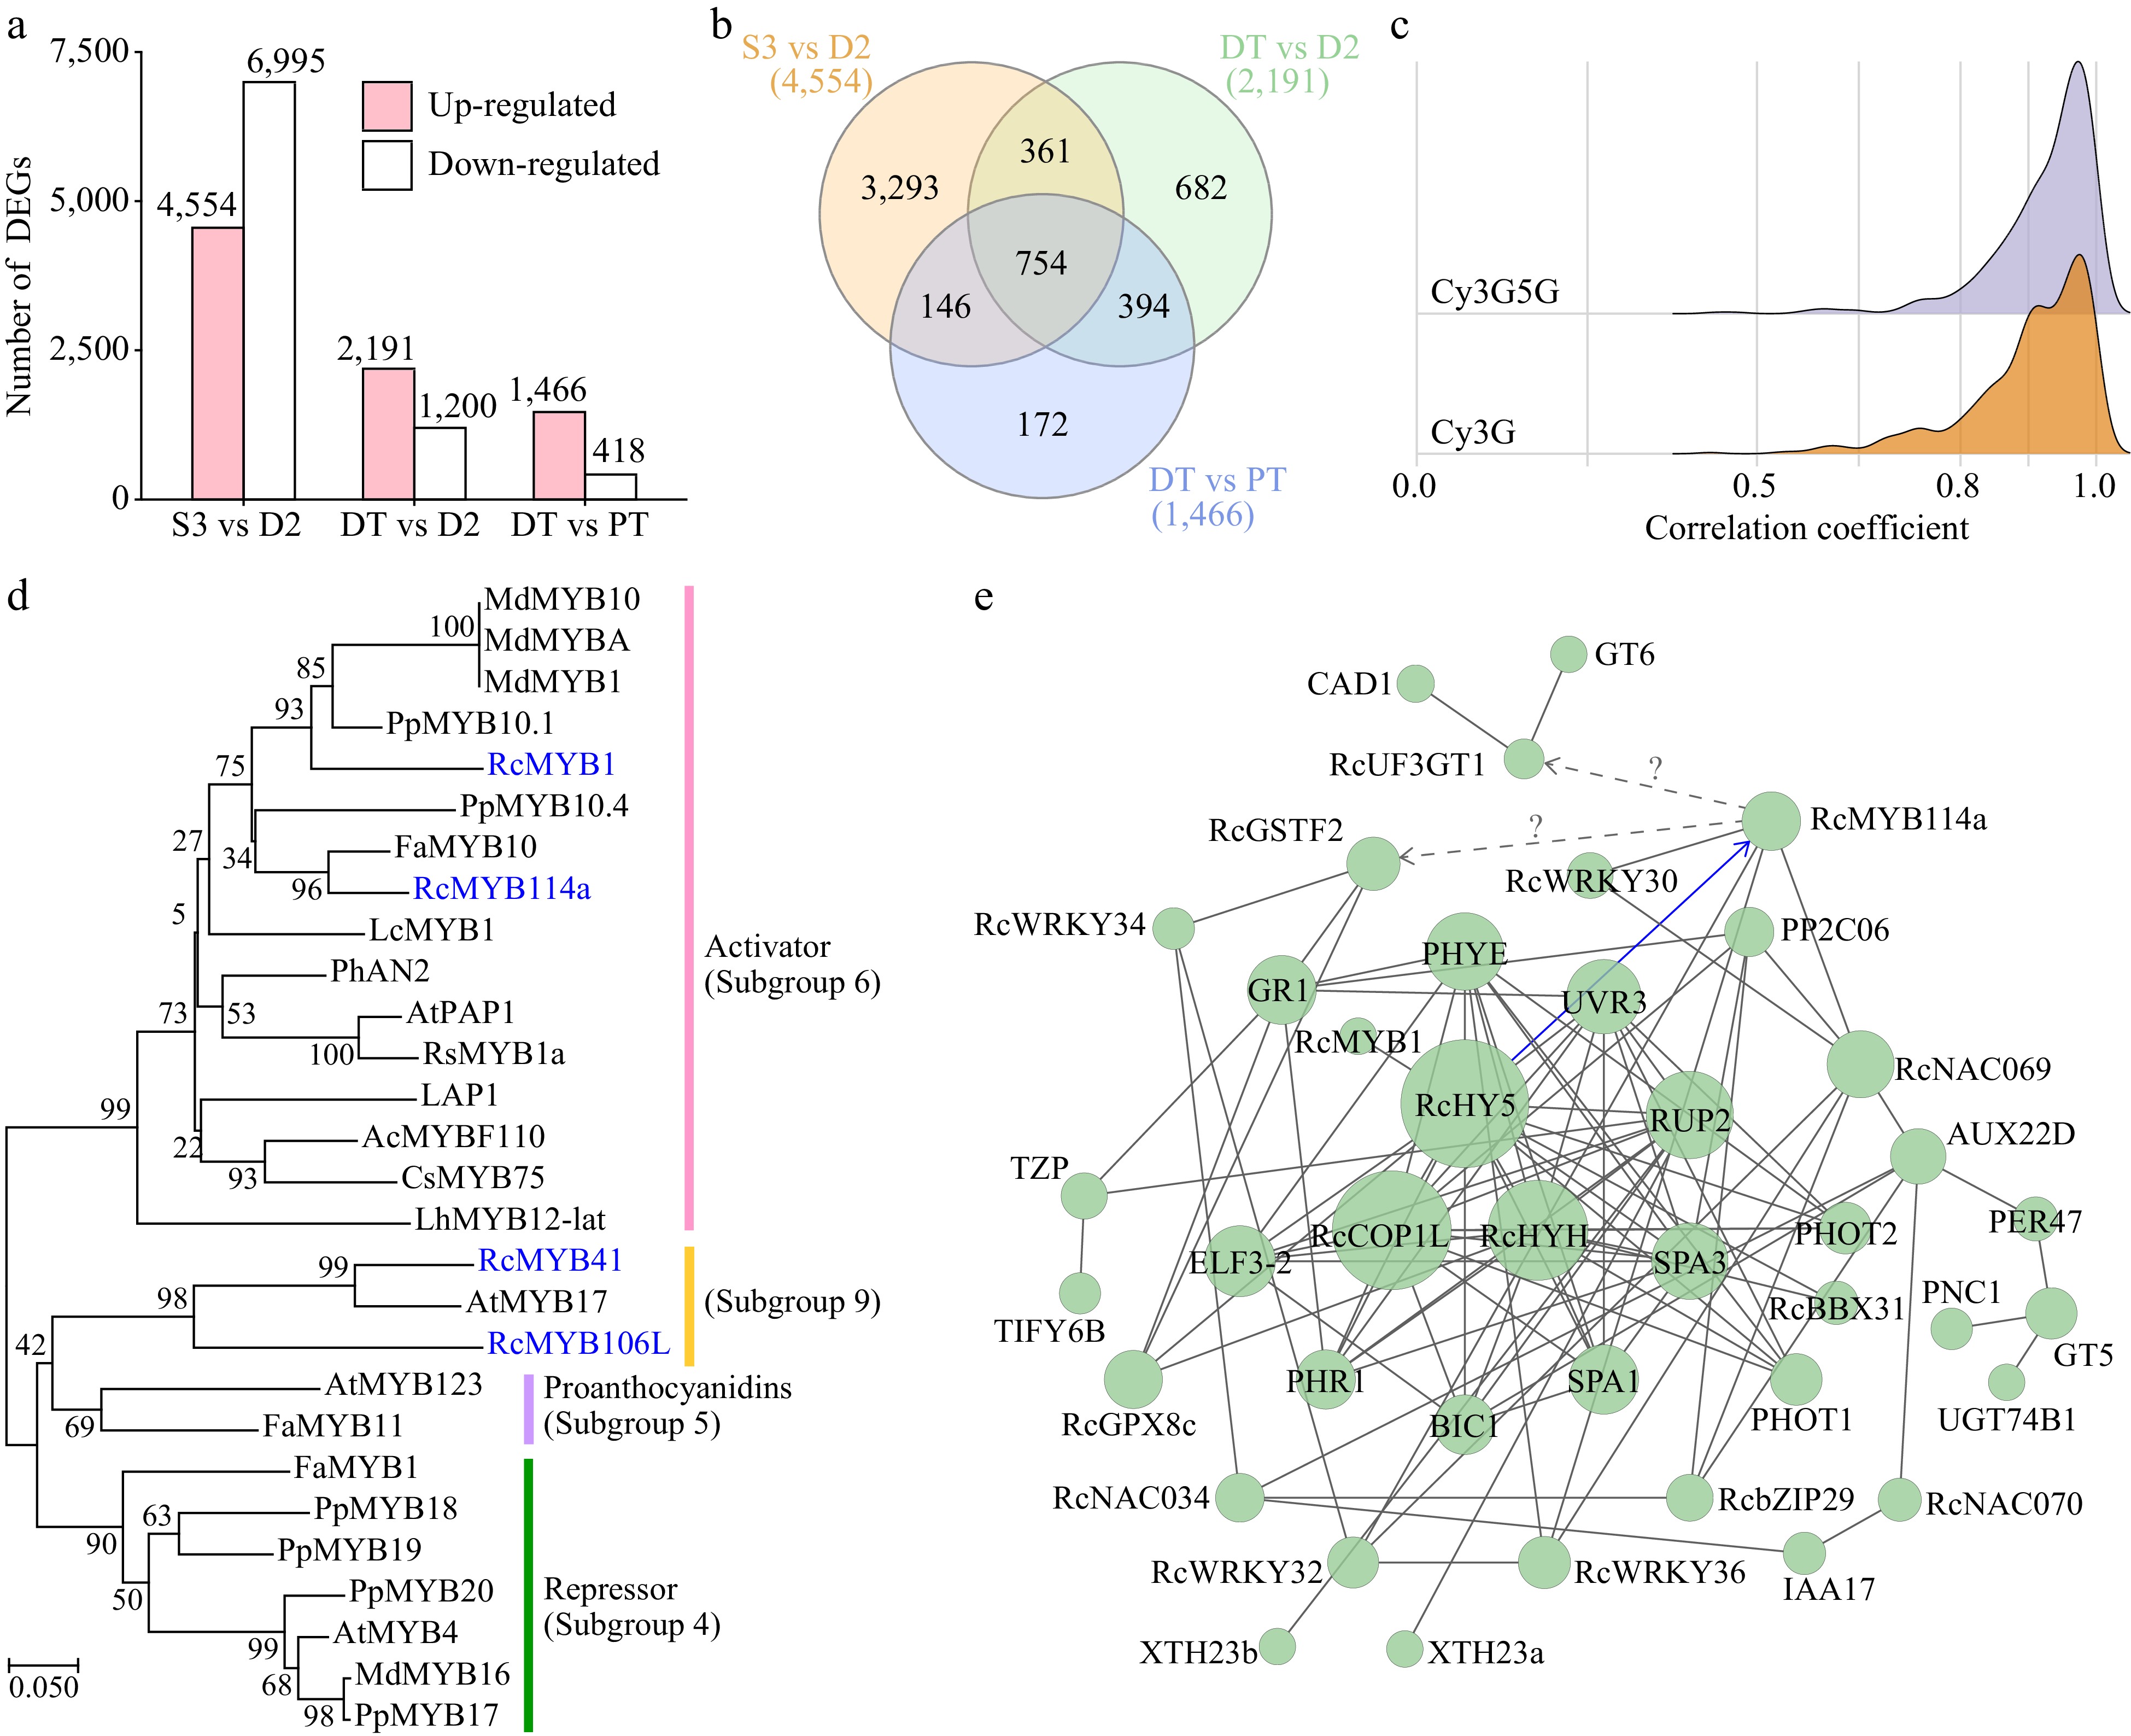
Figure 7.
Differentially expressed genes (DEGs) during the post-anthesis color transition. (a) Number of DEGs between different samples. (b) Venn analysis of the number of DEGs. (c) Correlation coefficients between DEGs (average FPKM ≥ 2 in four samples) and key anthocyanins. (d) Neighbor-joining phylogenetic tree of four candidate R2R3-MYB proteins (highlighted in blue) with other characterized R2R3-MYBs. Protein sequences used in this analysis are listed in Supplemental Table S9. (e) Protein–protein interaction network of DEGs (confidence = 0.20). Their genome IDs are listed in Supplemental Table S10. The identified interaction is displayed as a blue line.
-
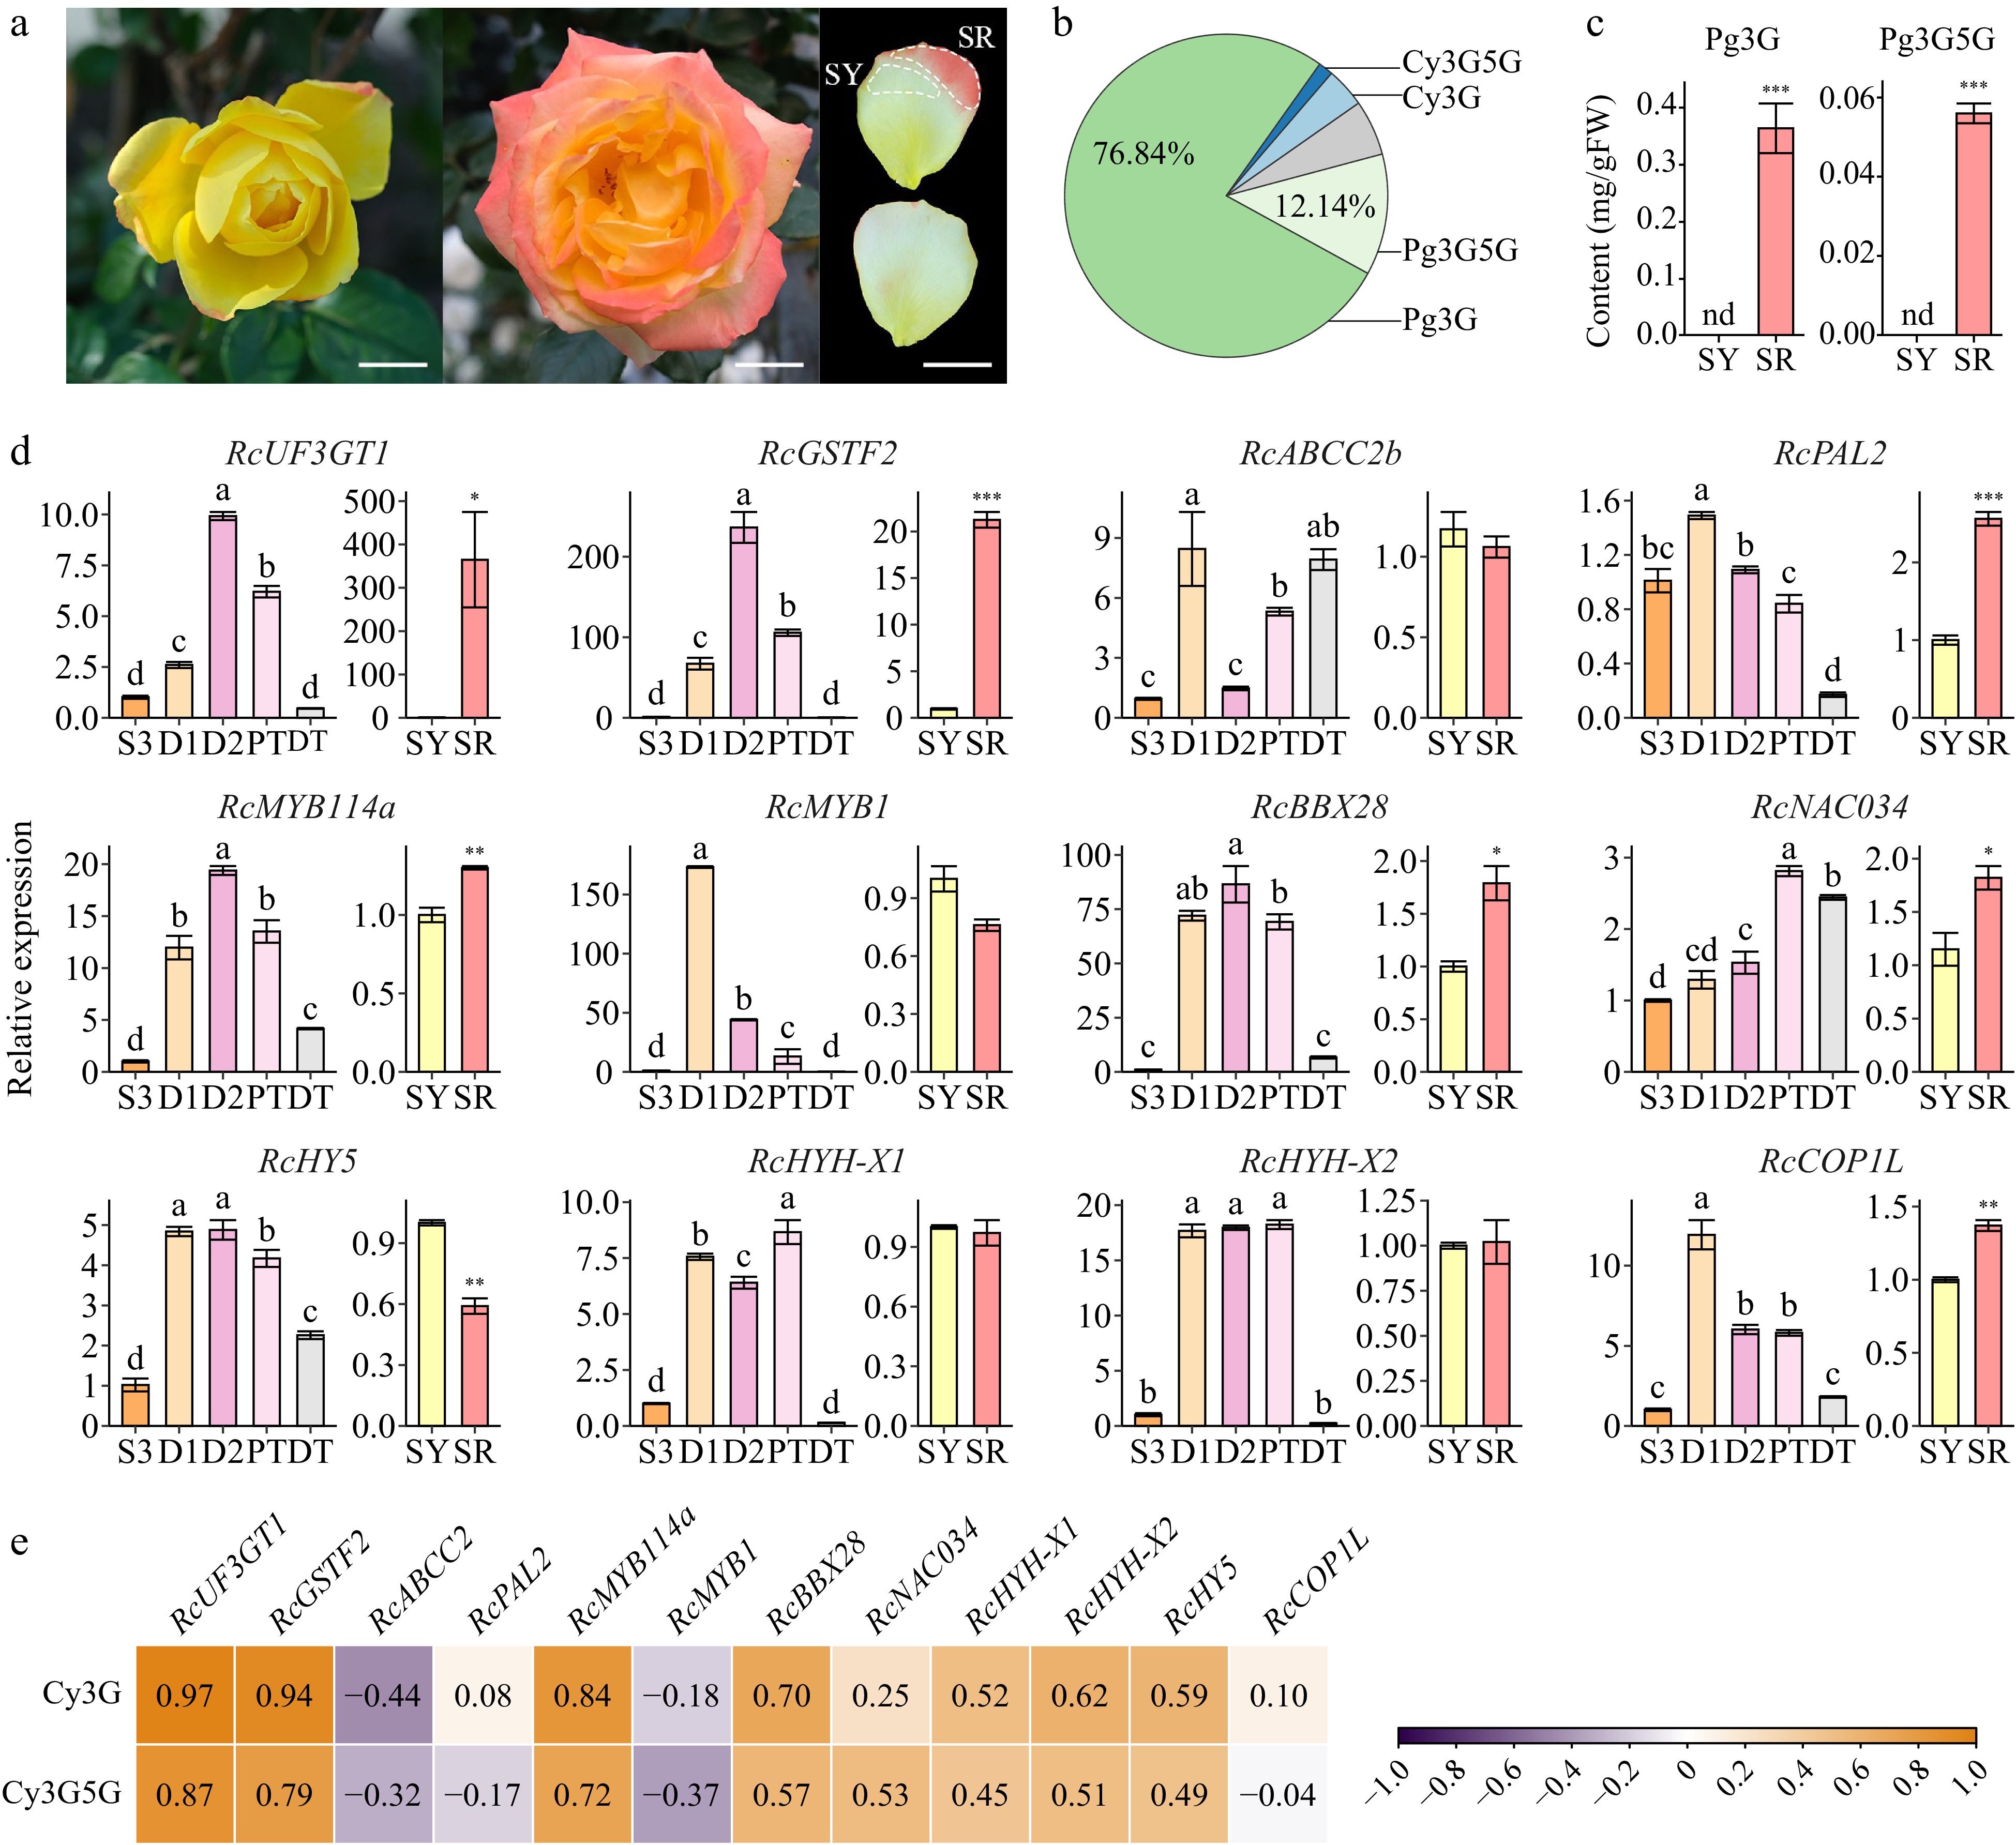
Figure 8.
Analysis of candidate DEGs. Data are presented as the mean ± standard error (n = 3). (a) Photos of R. hybrida 'Spectra'. Scale bars = 2 cm. Left, newly opened flower; middle, full-bloom flower (fourth or fifth day of anthesis); upper right, adaxial surface of collected petal; lower right, abaxial surface of collected petal. (b) Two key anthocyanin contents in different samples of R. hybrida 'Spectra'. (c) Anthocyanin components in the red part of middle-layer petals of R. hybrida 'Spectra' (SR). (d) Expression levels of candidate DEGs in different samples of R. chinensis (ANOVA test, p < 0.05). and R. hybrida 'Spectra' (Student's t-test, *p < 0.05, **p < 0.01). (e) Correlation analysis between the expression of candidate DEGs and key anthocyanins in butterfly rose samples.
Figures
(8)
Tables
(0)