-
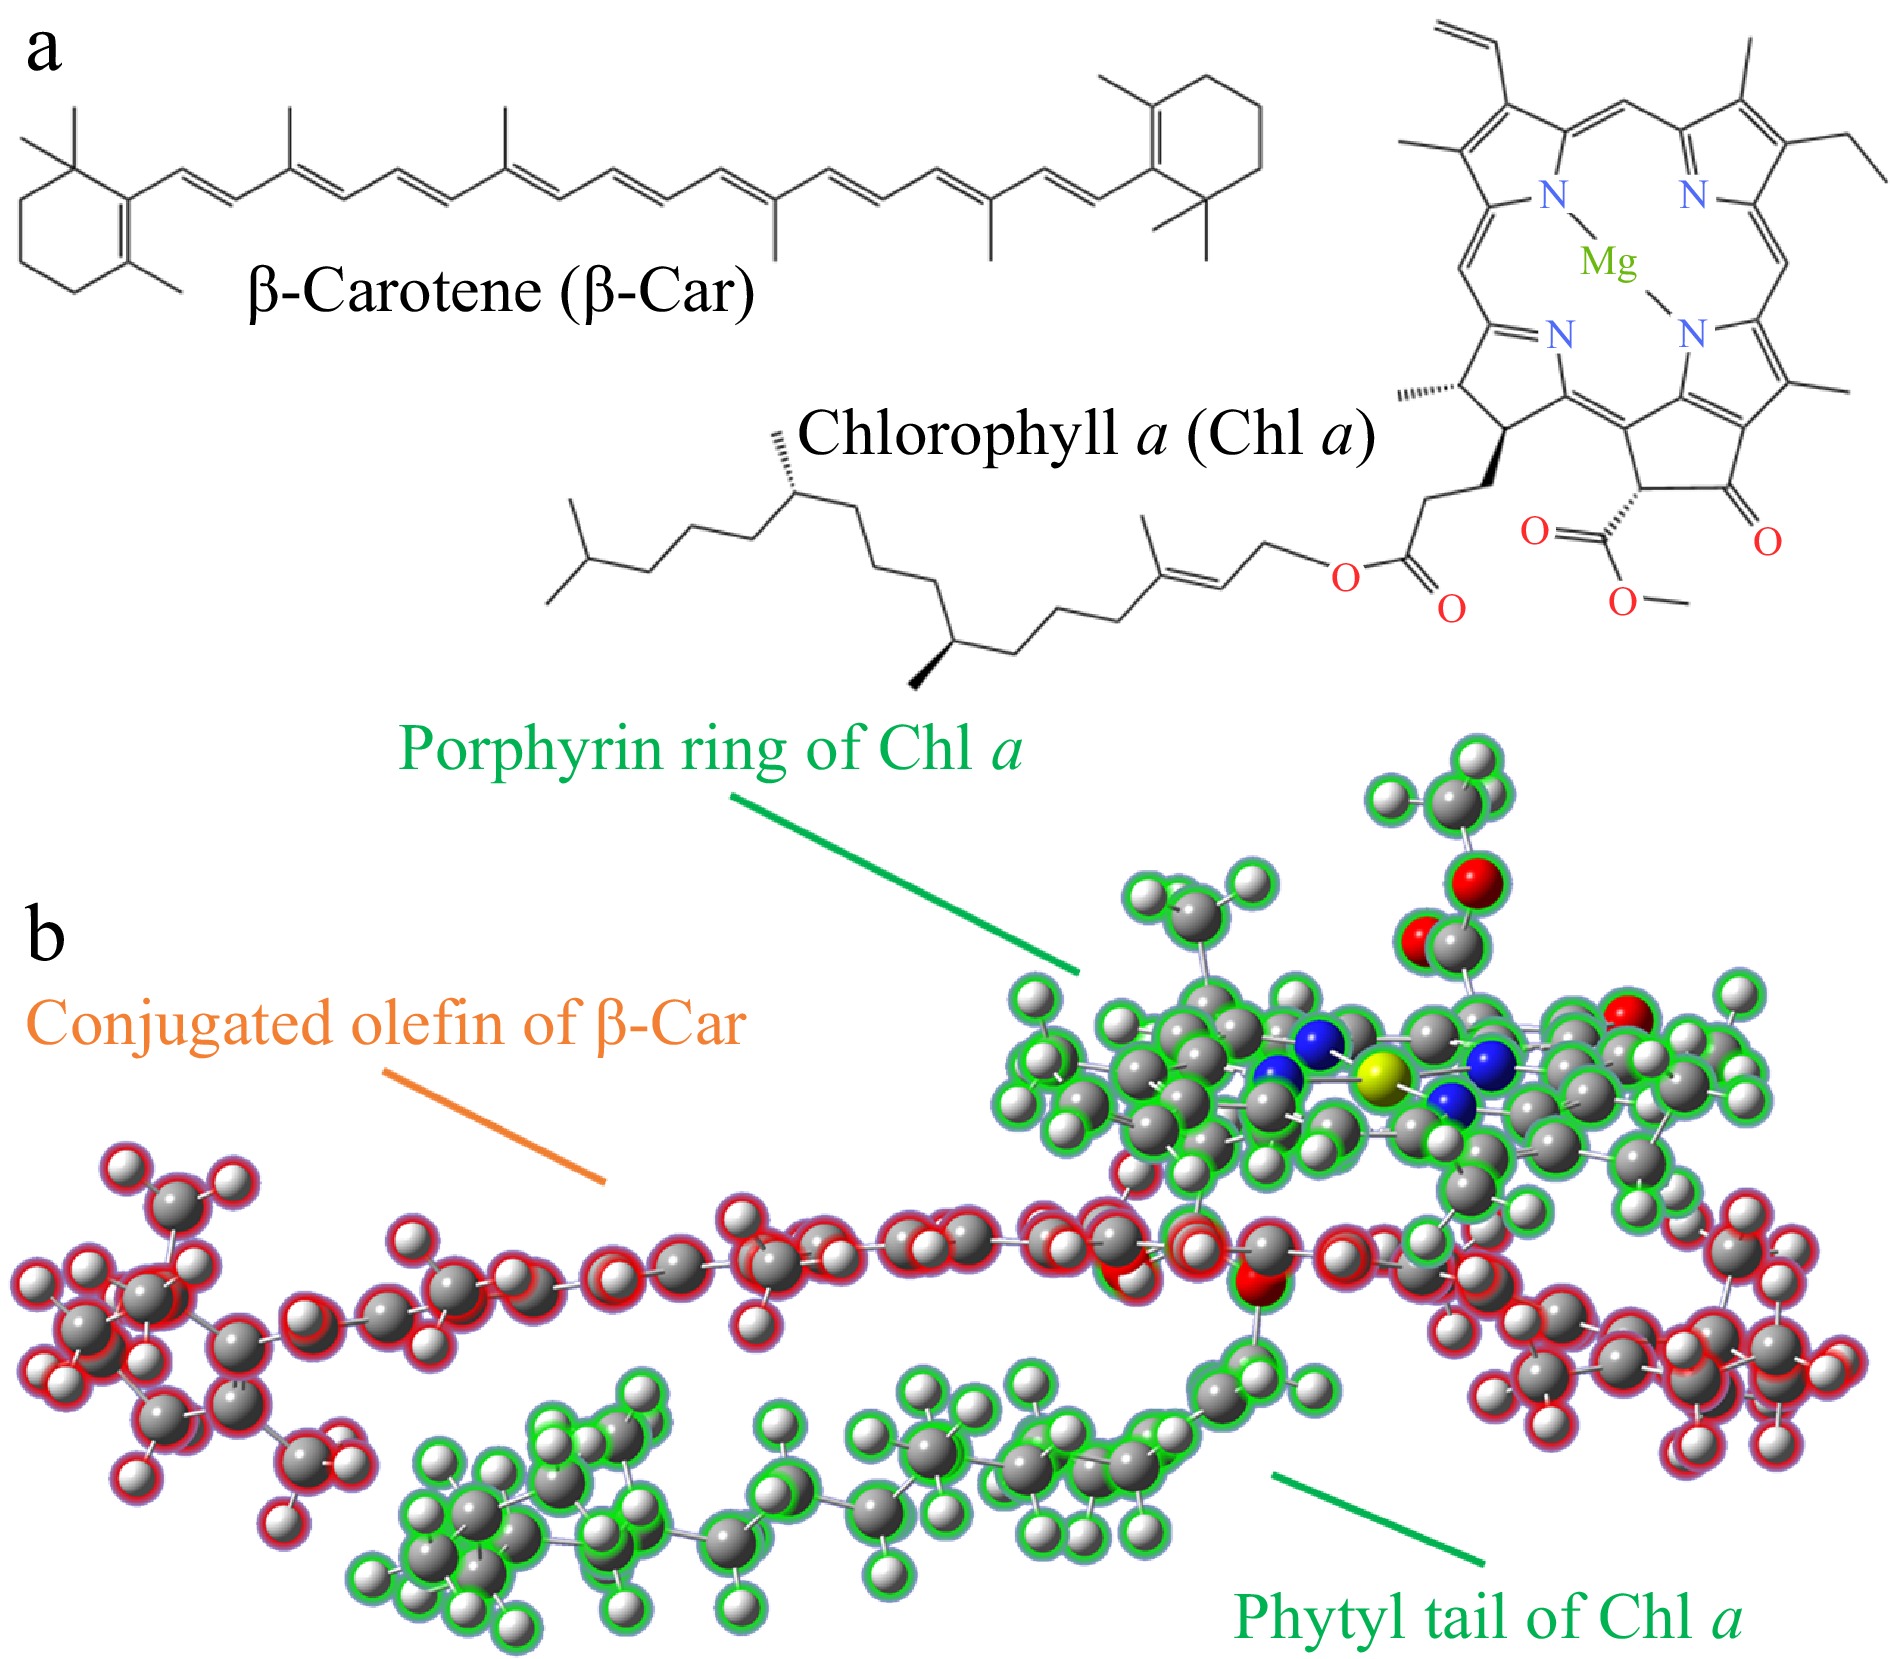
Figure 1.
(a) Molecular structures of Chl and Car. (b) Aggregation configuration of Chl/Car.
-
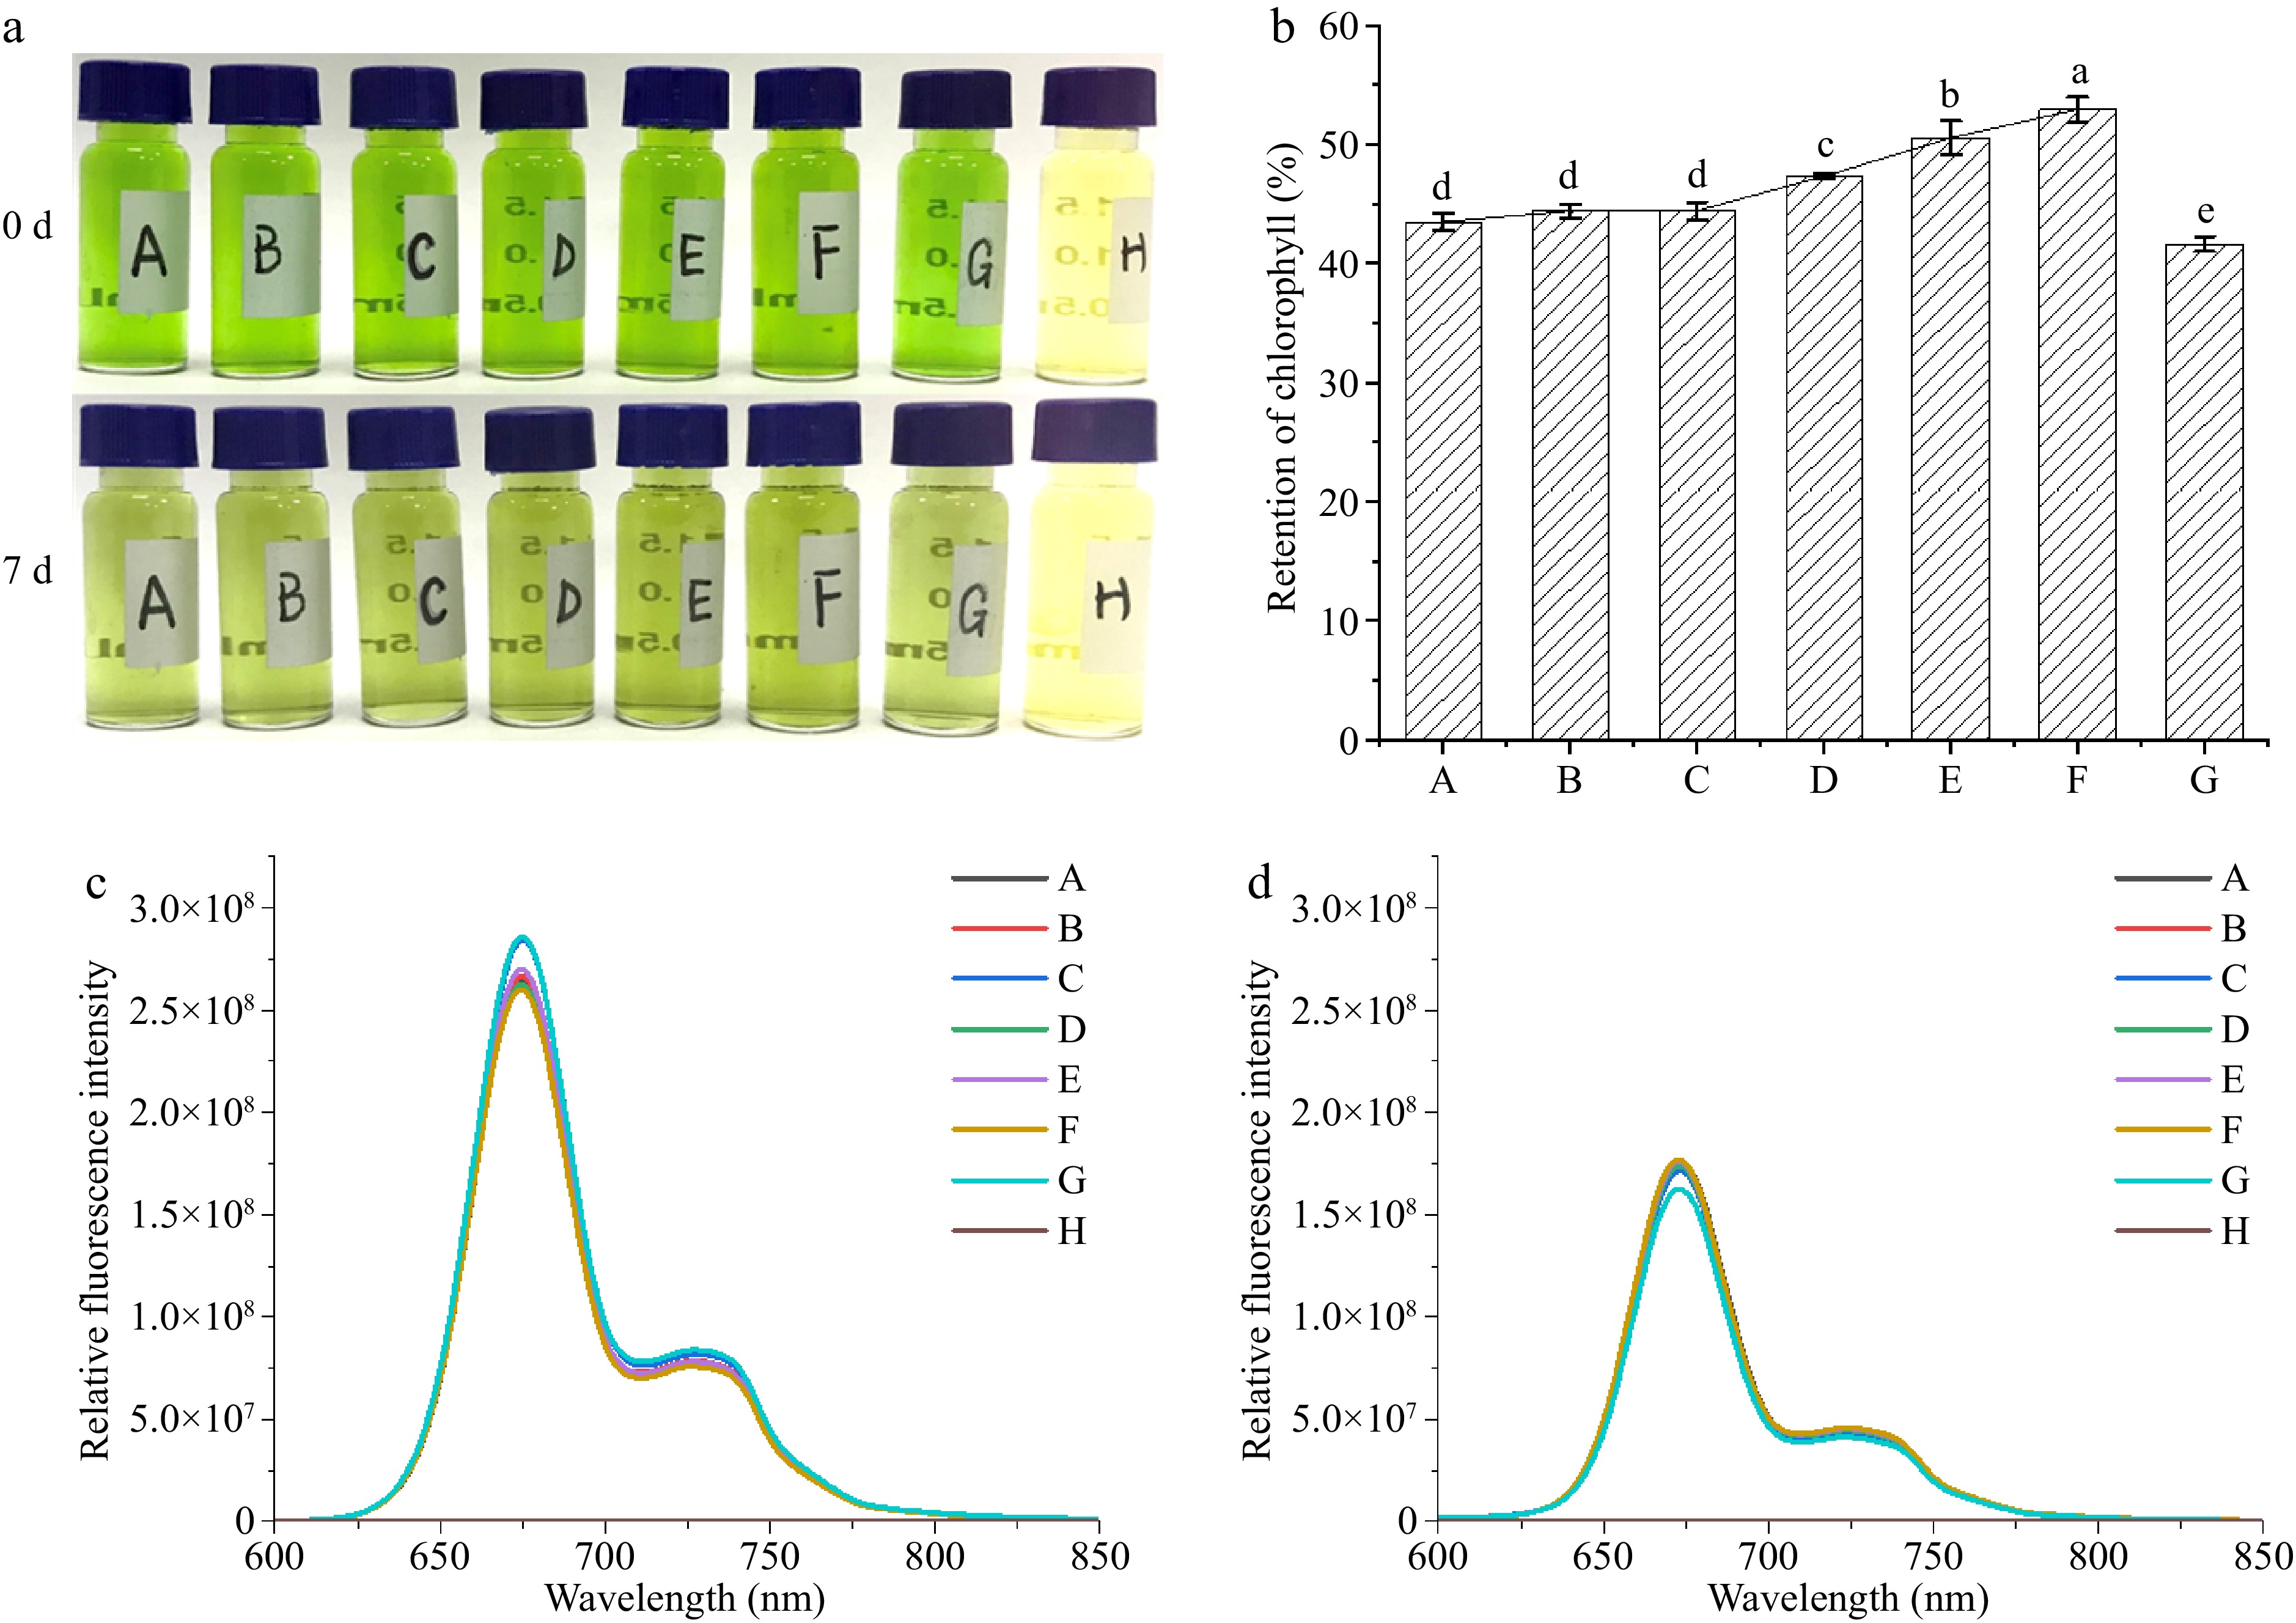
Figure 2.
Changes in Chl/Car mixture exposed for 7 d. (a) Images of samples; (b) retention of Chl; (c) fluorescence emission spectra before light exposure; (d) fluorescence emission spectra after light exposure. (Chl concentrations for samples A, B, C, D, E, F are 19.93 mg/L, and β-Car concentrations are 1.20, 2.40, 3.60, 4.80, 6.00, 7.20 mg/L respectively. G: Chl 19.93 mg/L; H: Car 3.60 mg/L).
-
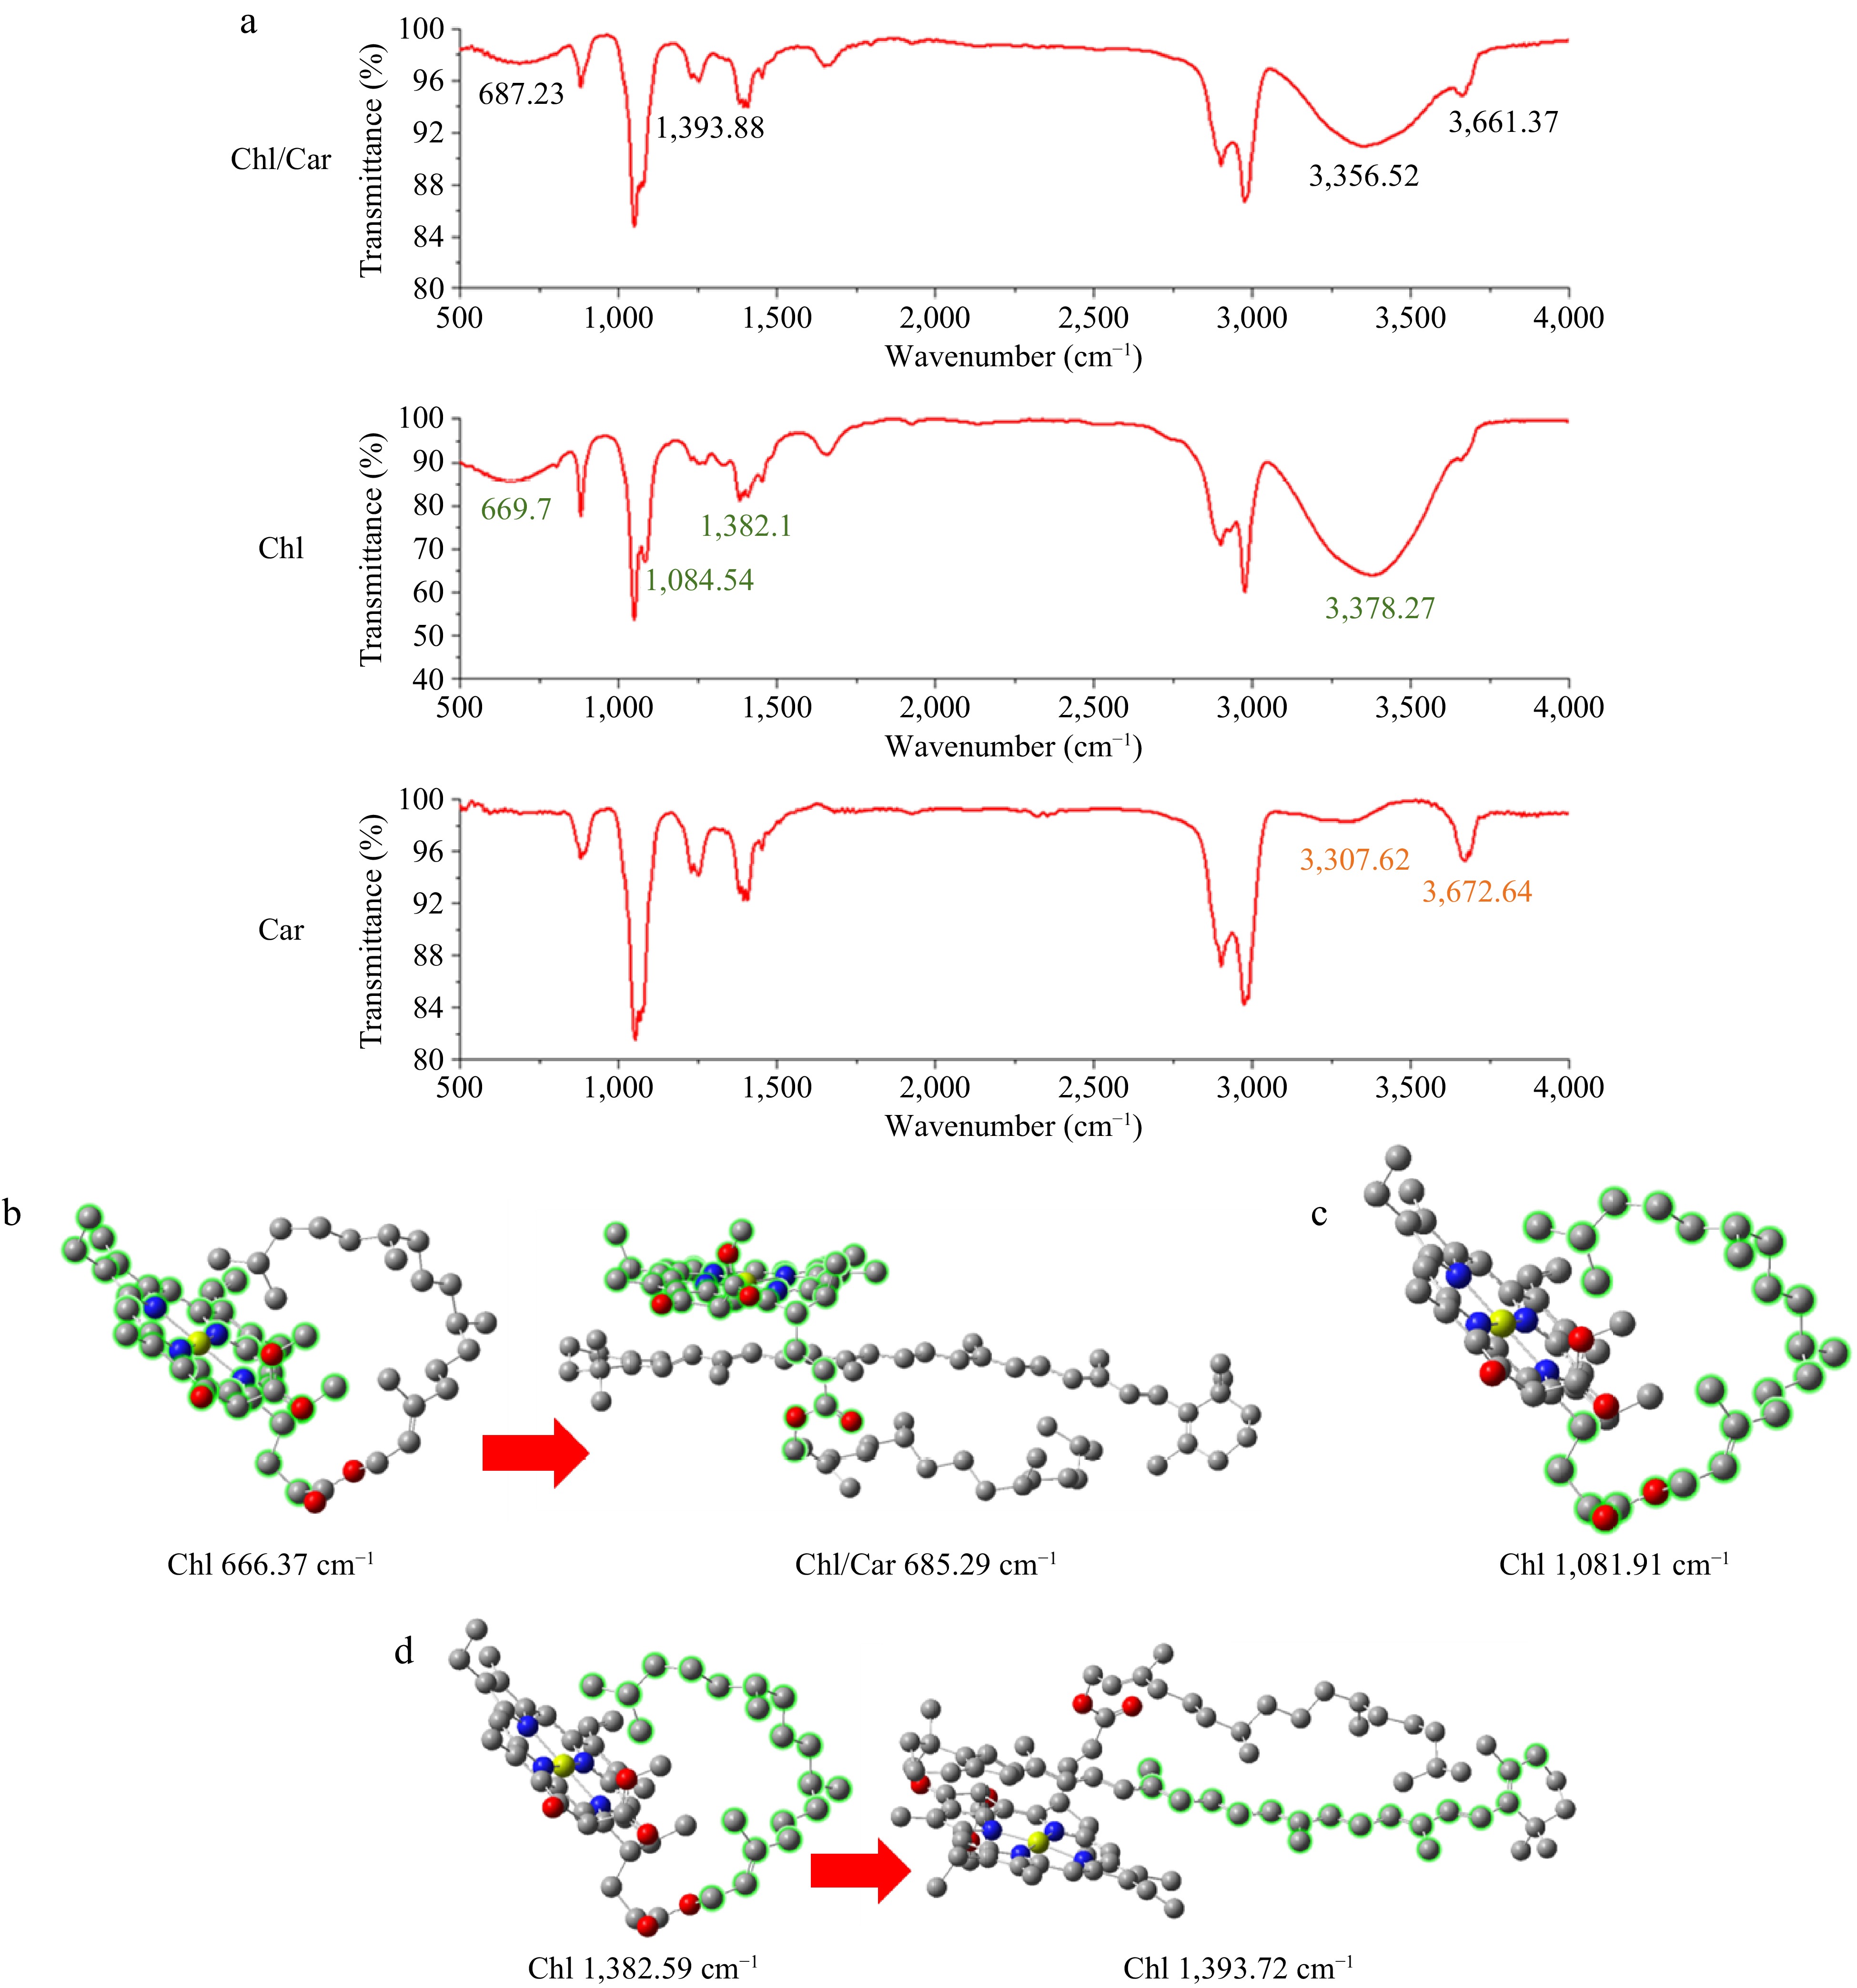
Figure 3.
Changes in infrared spectra before and after mixing Chl and Car. (a) Infrared spectra, (b)−(d) corresponding characteristic fragments vibration.
-
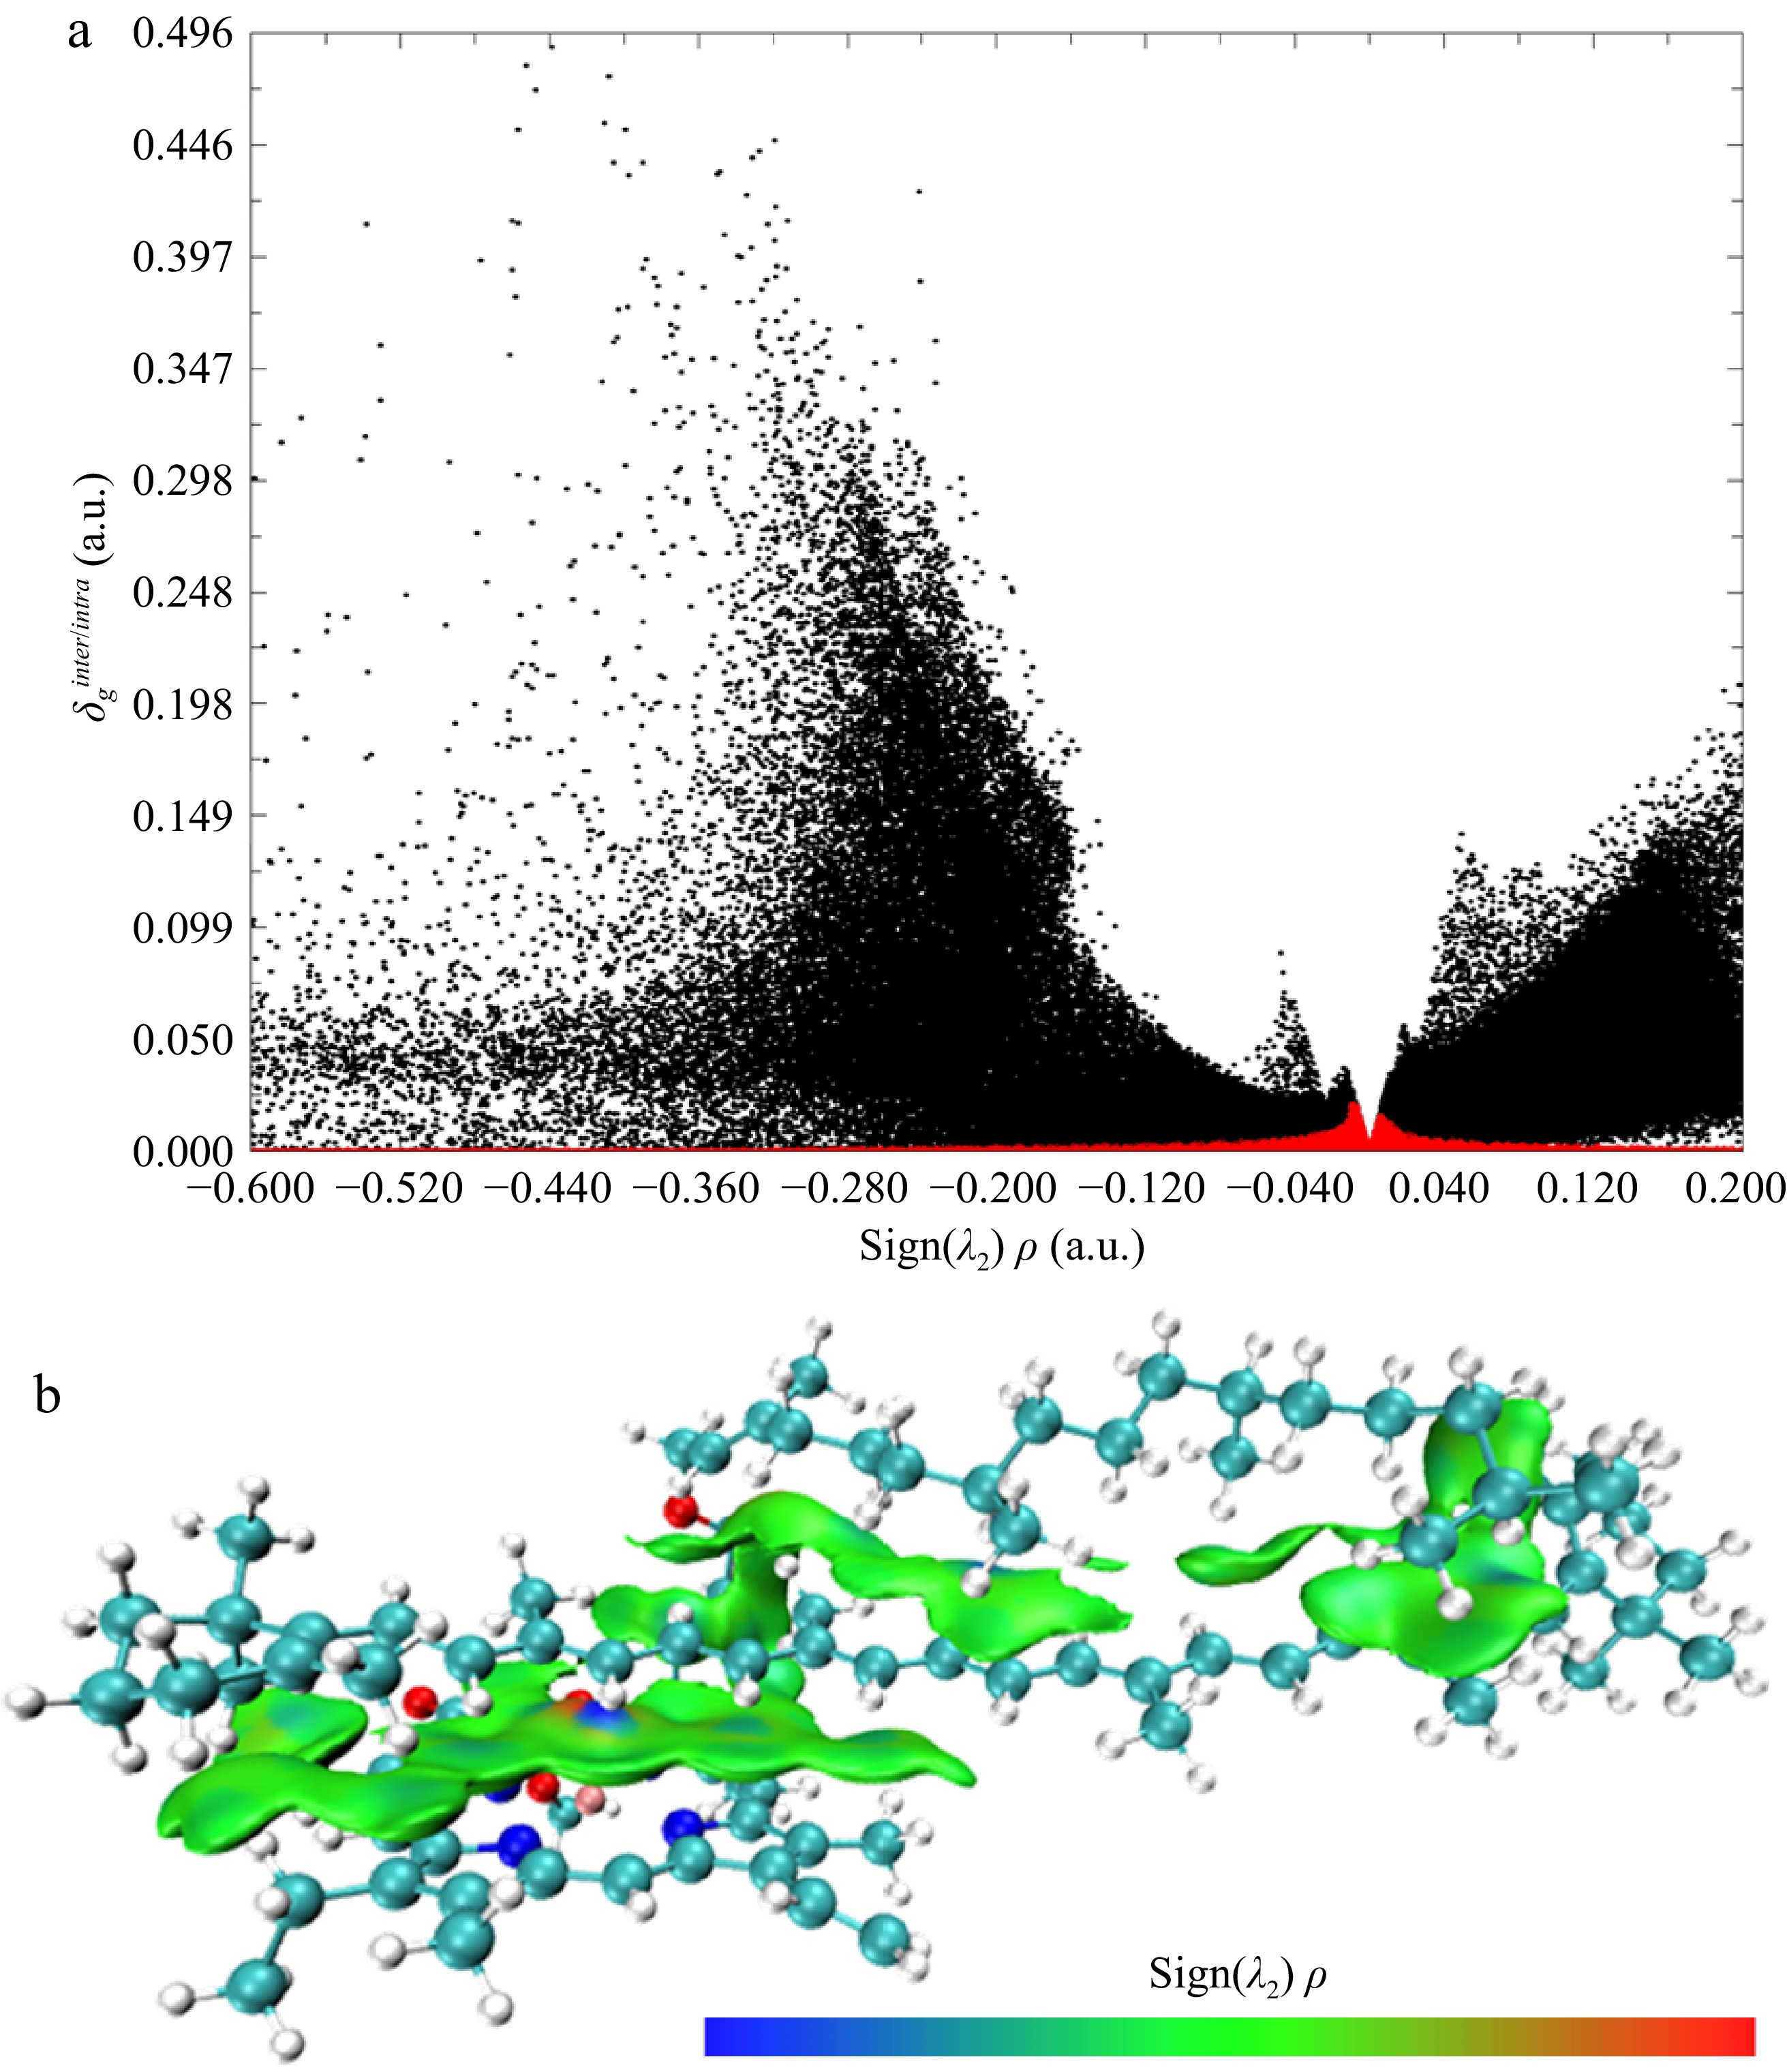
Figure 4.
(a) Scatter plot and (b) schematic diagram of intermolecular interaction of IGM analysis for Chl/Car aggregation (Isovalue = 0.005).
-
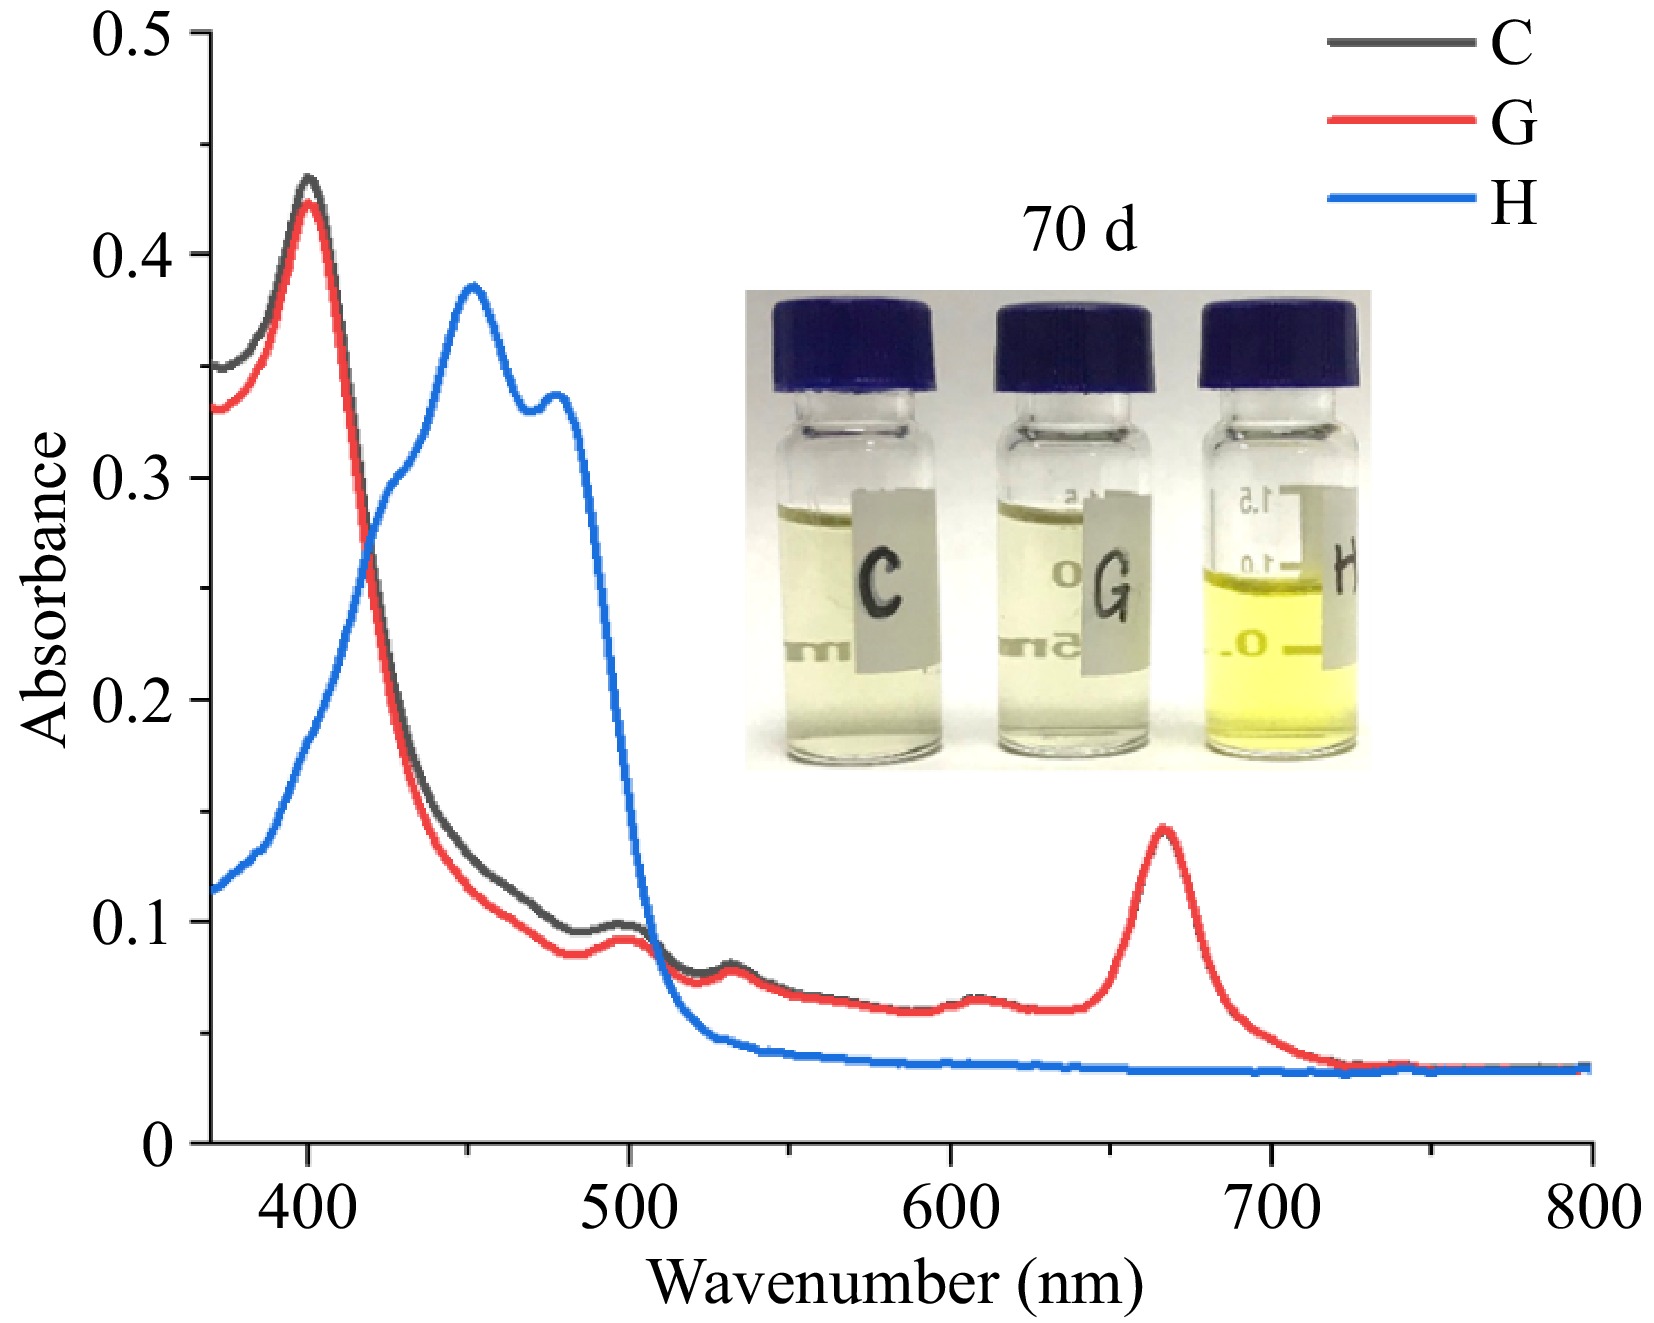
Figure 5.
UV-Vis spectrum of Chl/Car solution exposed for 70 d (C: Chl 19.93 mg/L, β-Car 3.60 mg/L; G: Chl 19.93 mg/L; H: Car 3.60 mg/L).
-
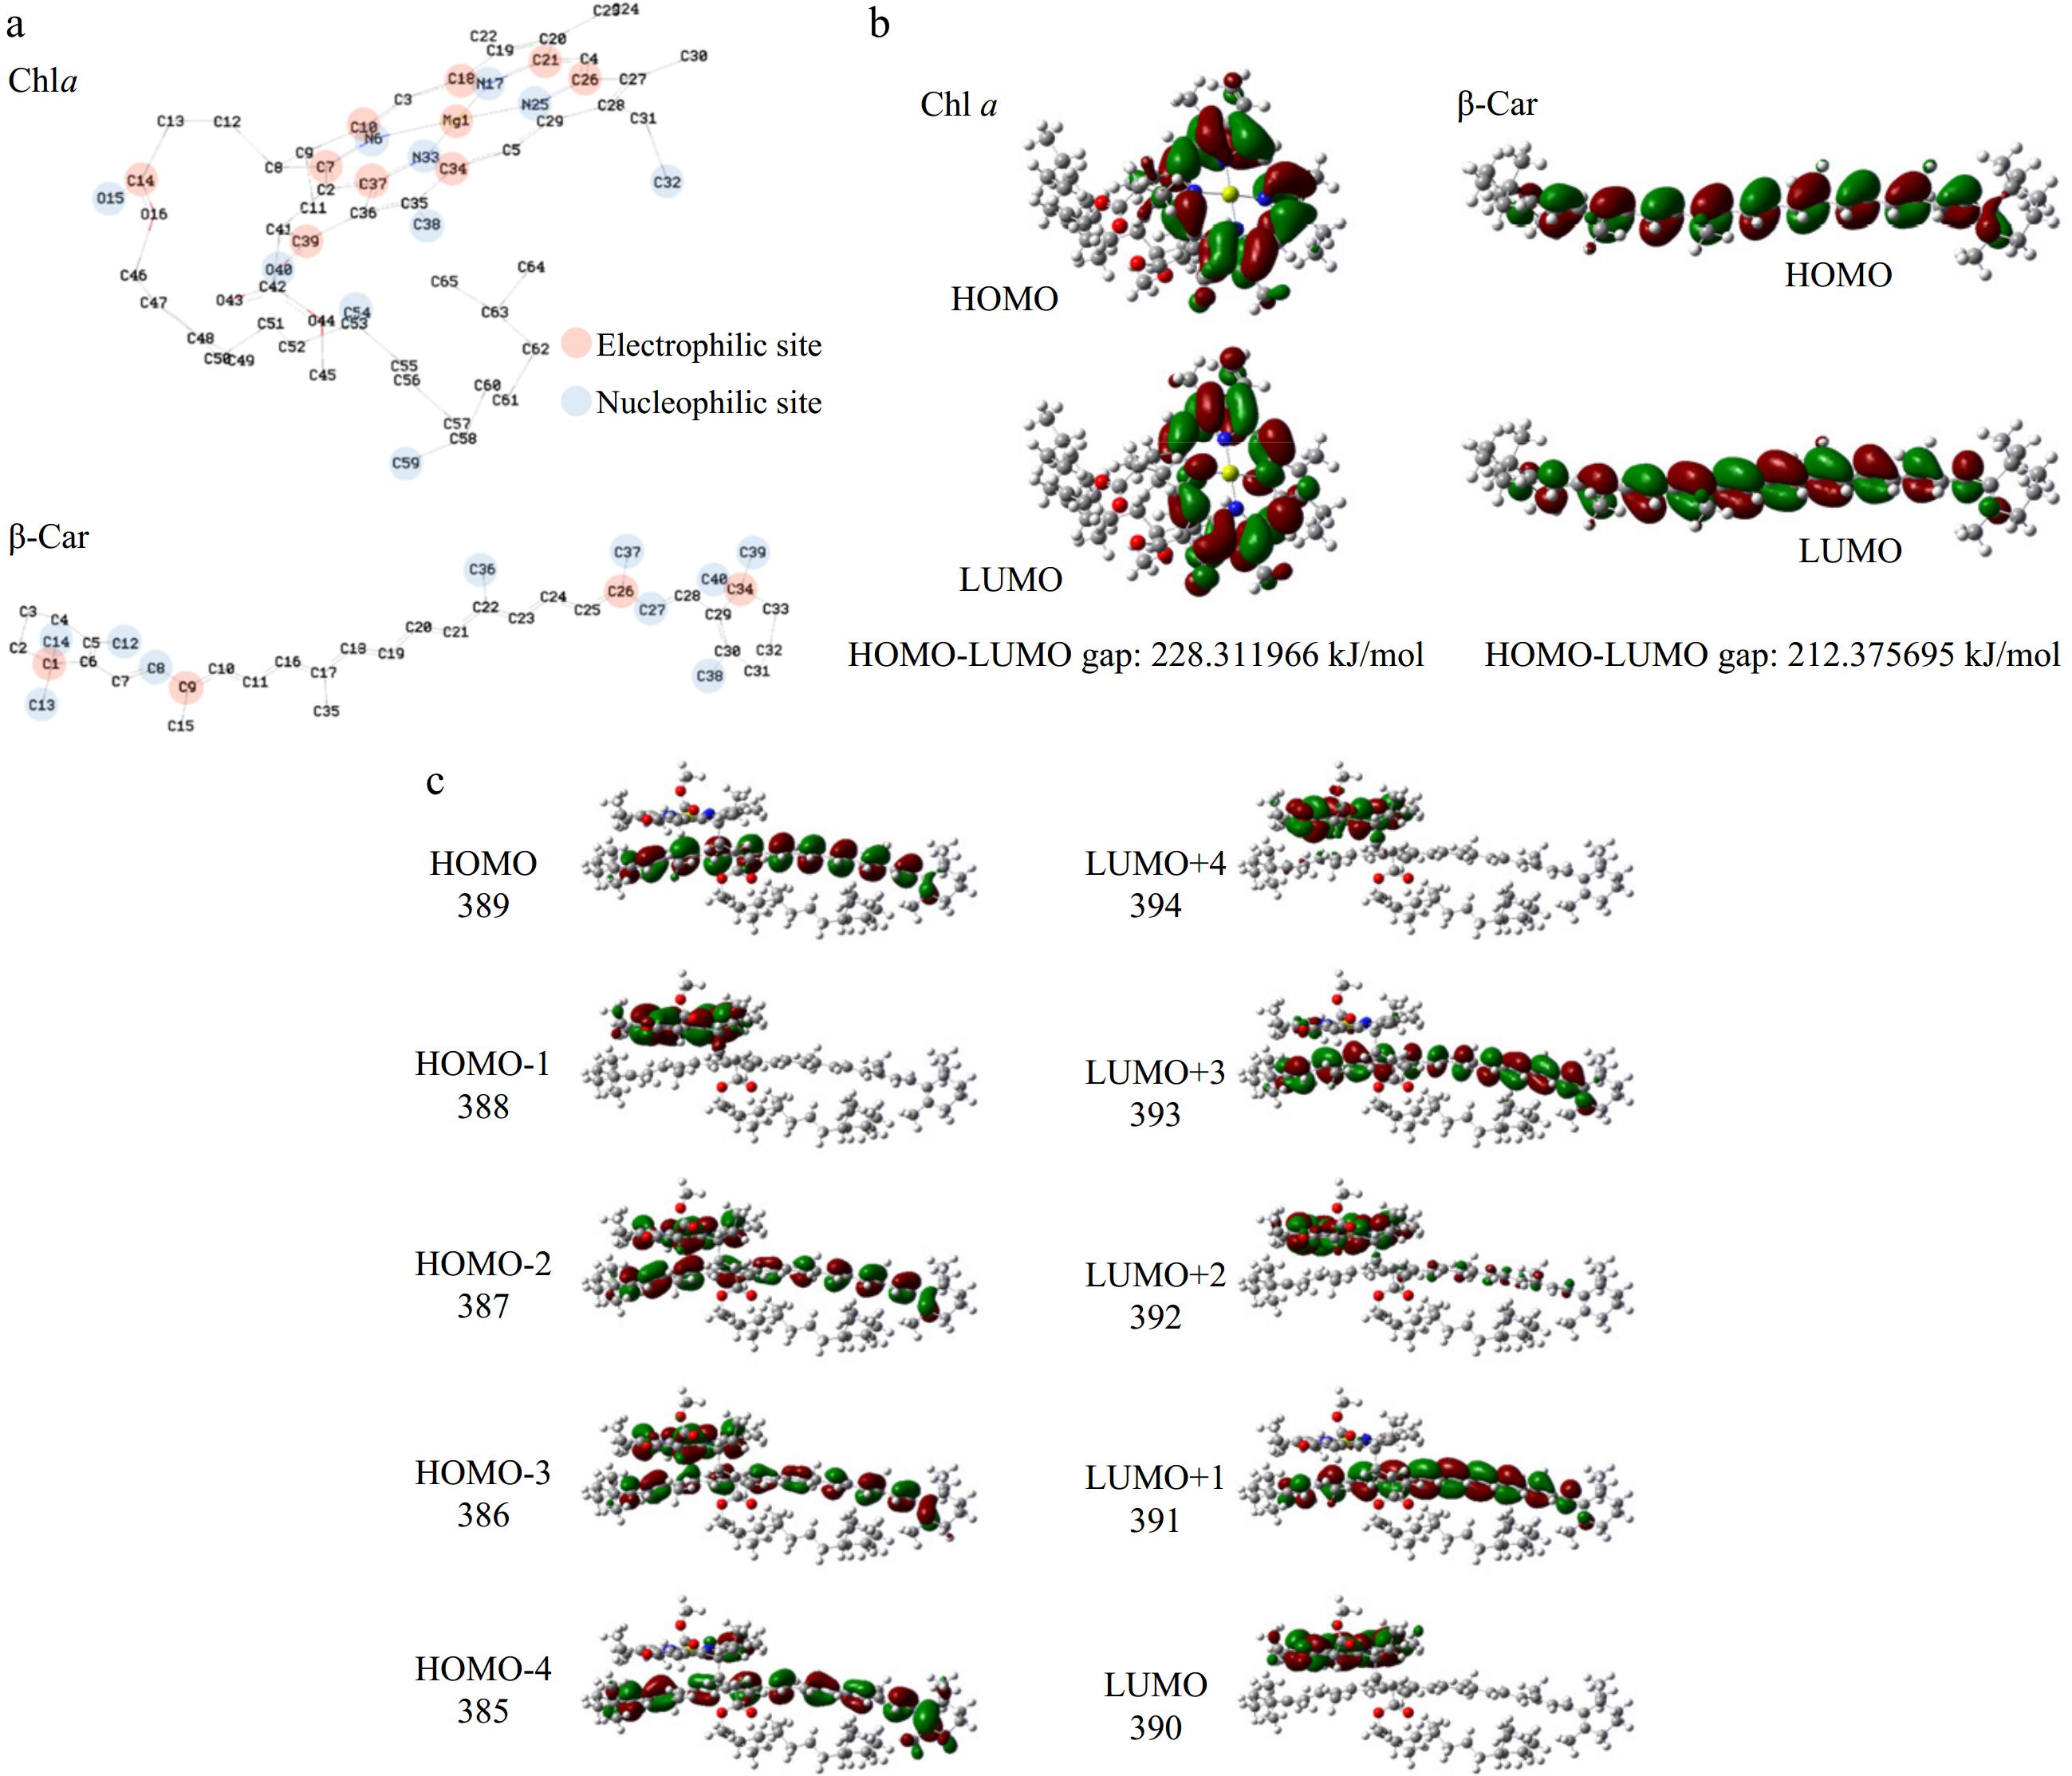
Figure 6.
Reactivity of Chl a and β-Car. (a) Molecular configuration, atom number, electrophilic site, nucleophilic site; (b) HOMO-LUMO gap; (c) HOMO-4 to LUMO+4 of aggregate.
Figures
(6)
Tables
(0)