-
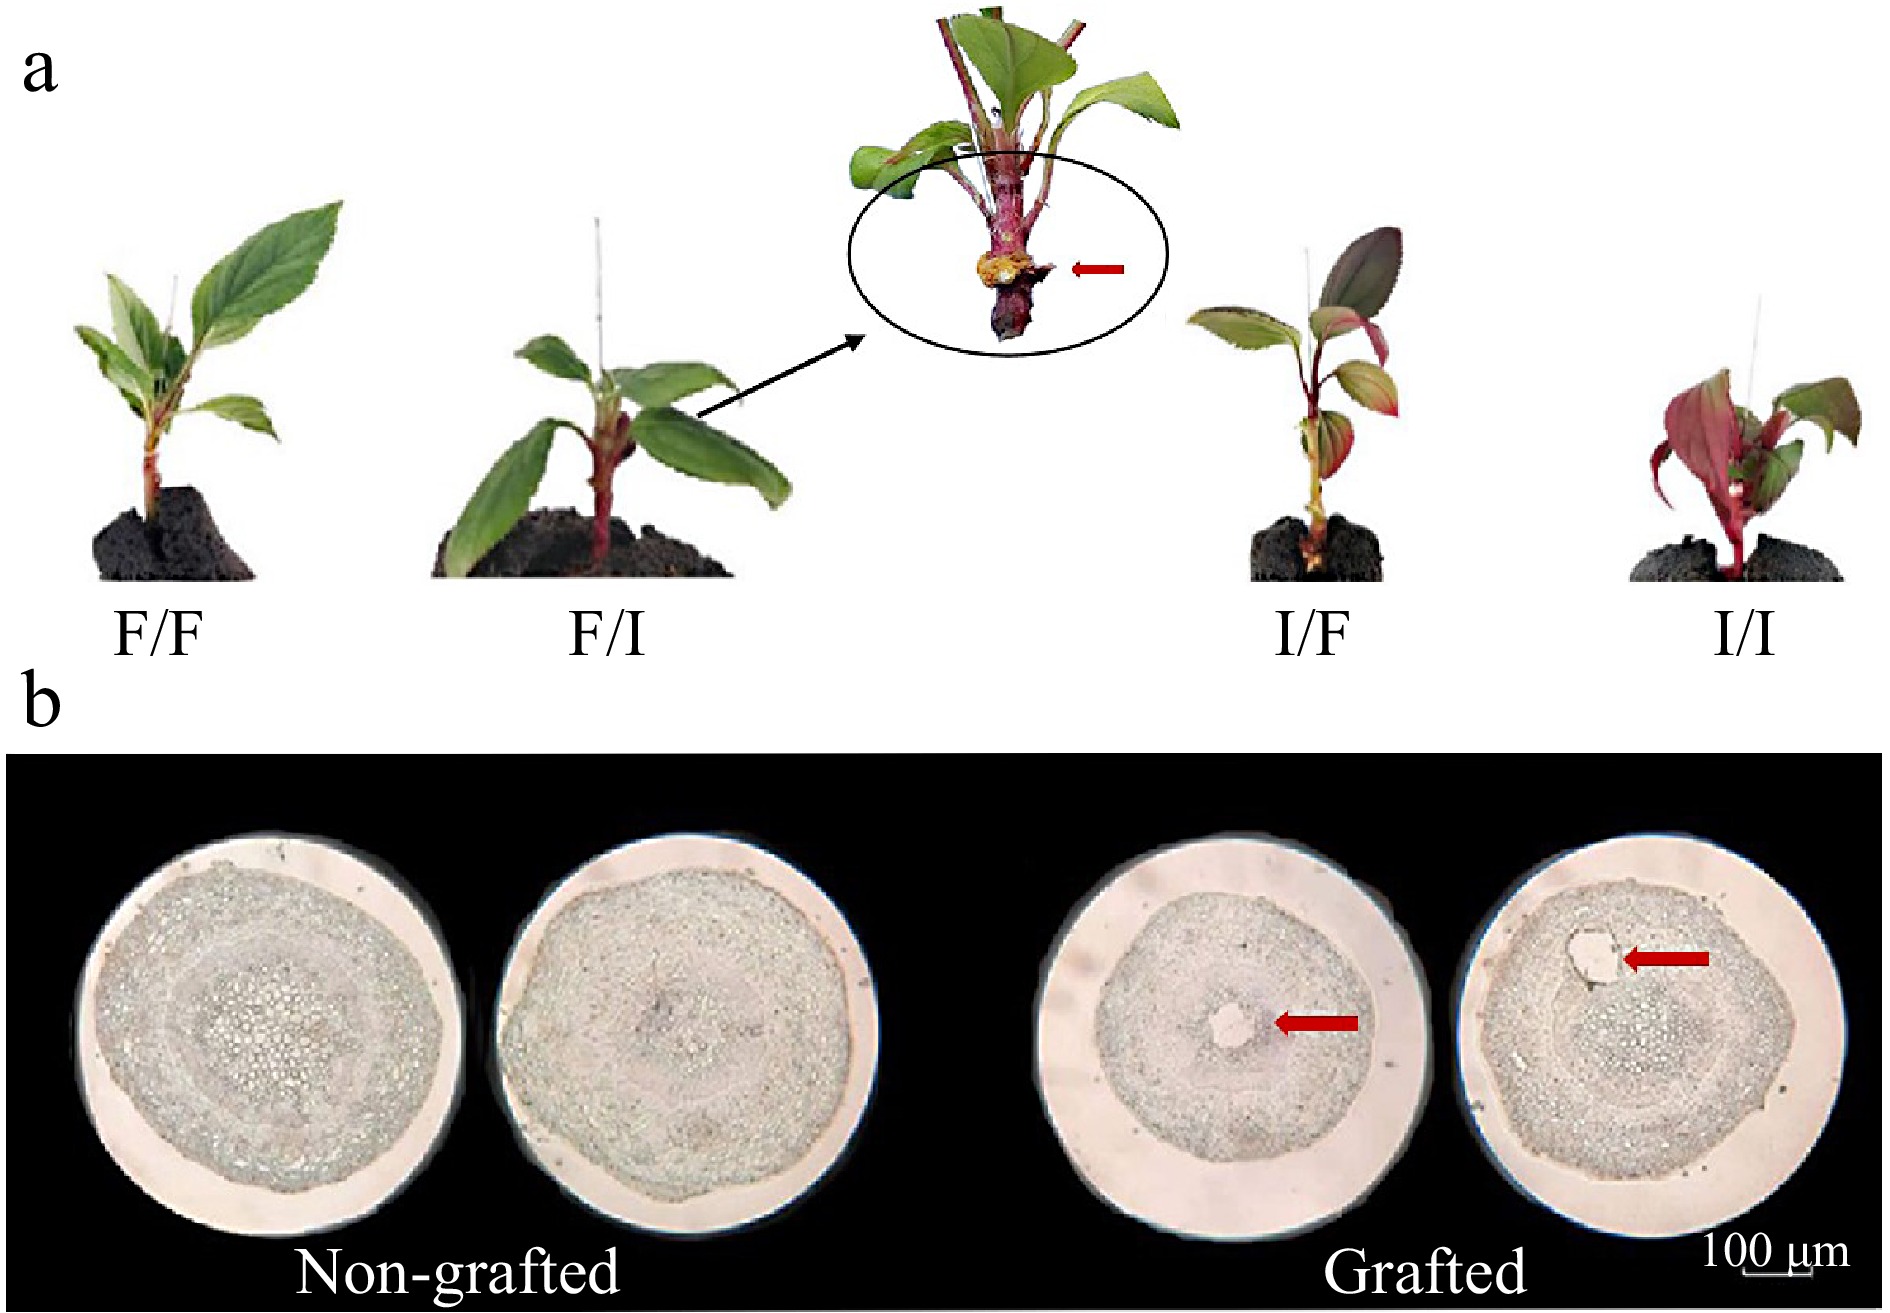
Figure 1.
Grafting affects anthocyanin accumulation in F/I combination. (a) Phenotype of grafted seedlings with differential grafting combinations (red arrows indicate the bonding sites of scion and rootstock, the black circle is the anthocyanin accumulation area) (F/F: Malus crabapple cv. 'Flame' as scion and Malus crabapple cv. 'Flame' as rootstock; F/I: Malus crabapple cv. 'Flame' as scion and Malus crabapple cv. 'Indian Magic' as rootstock; I/F: Malus crabapple cv. 'Indian Magic' as scion and Malus crabapple cv. 'Flame' as rootstock; I/I: Malus crabapple cv. 'Indian Magic' as scion and rootstock). (b) Paraffin section of the interface in non-grafted and grafted seedlings.
-
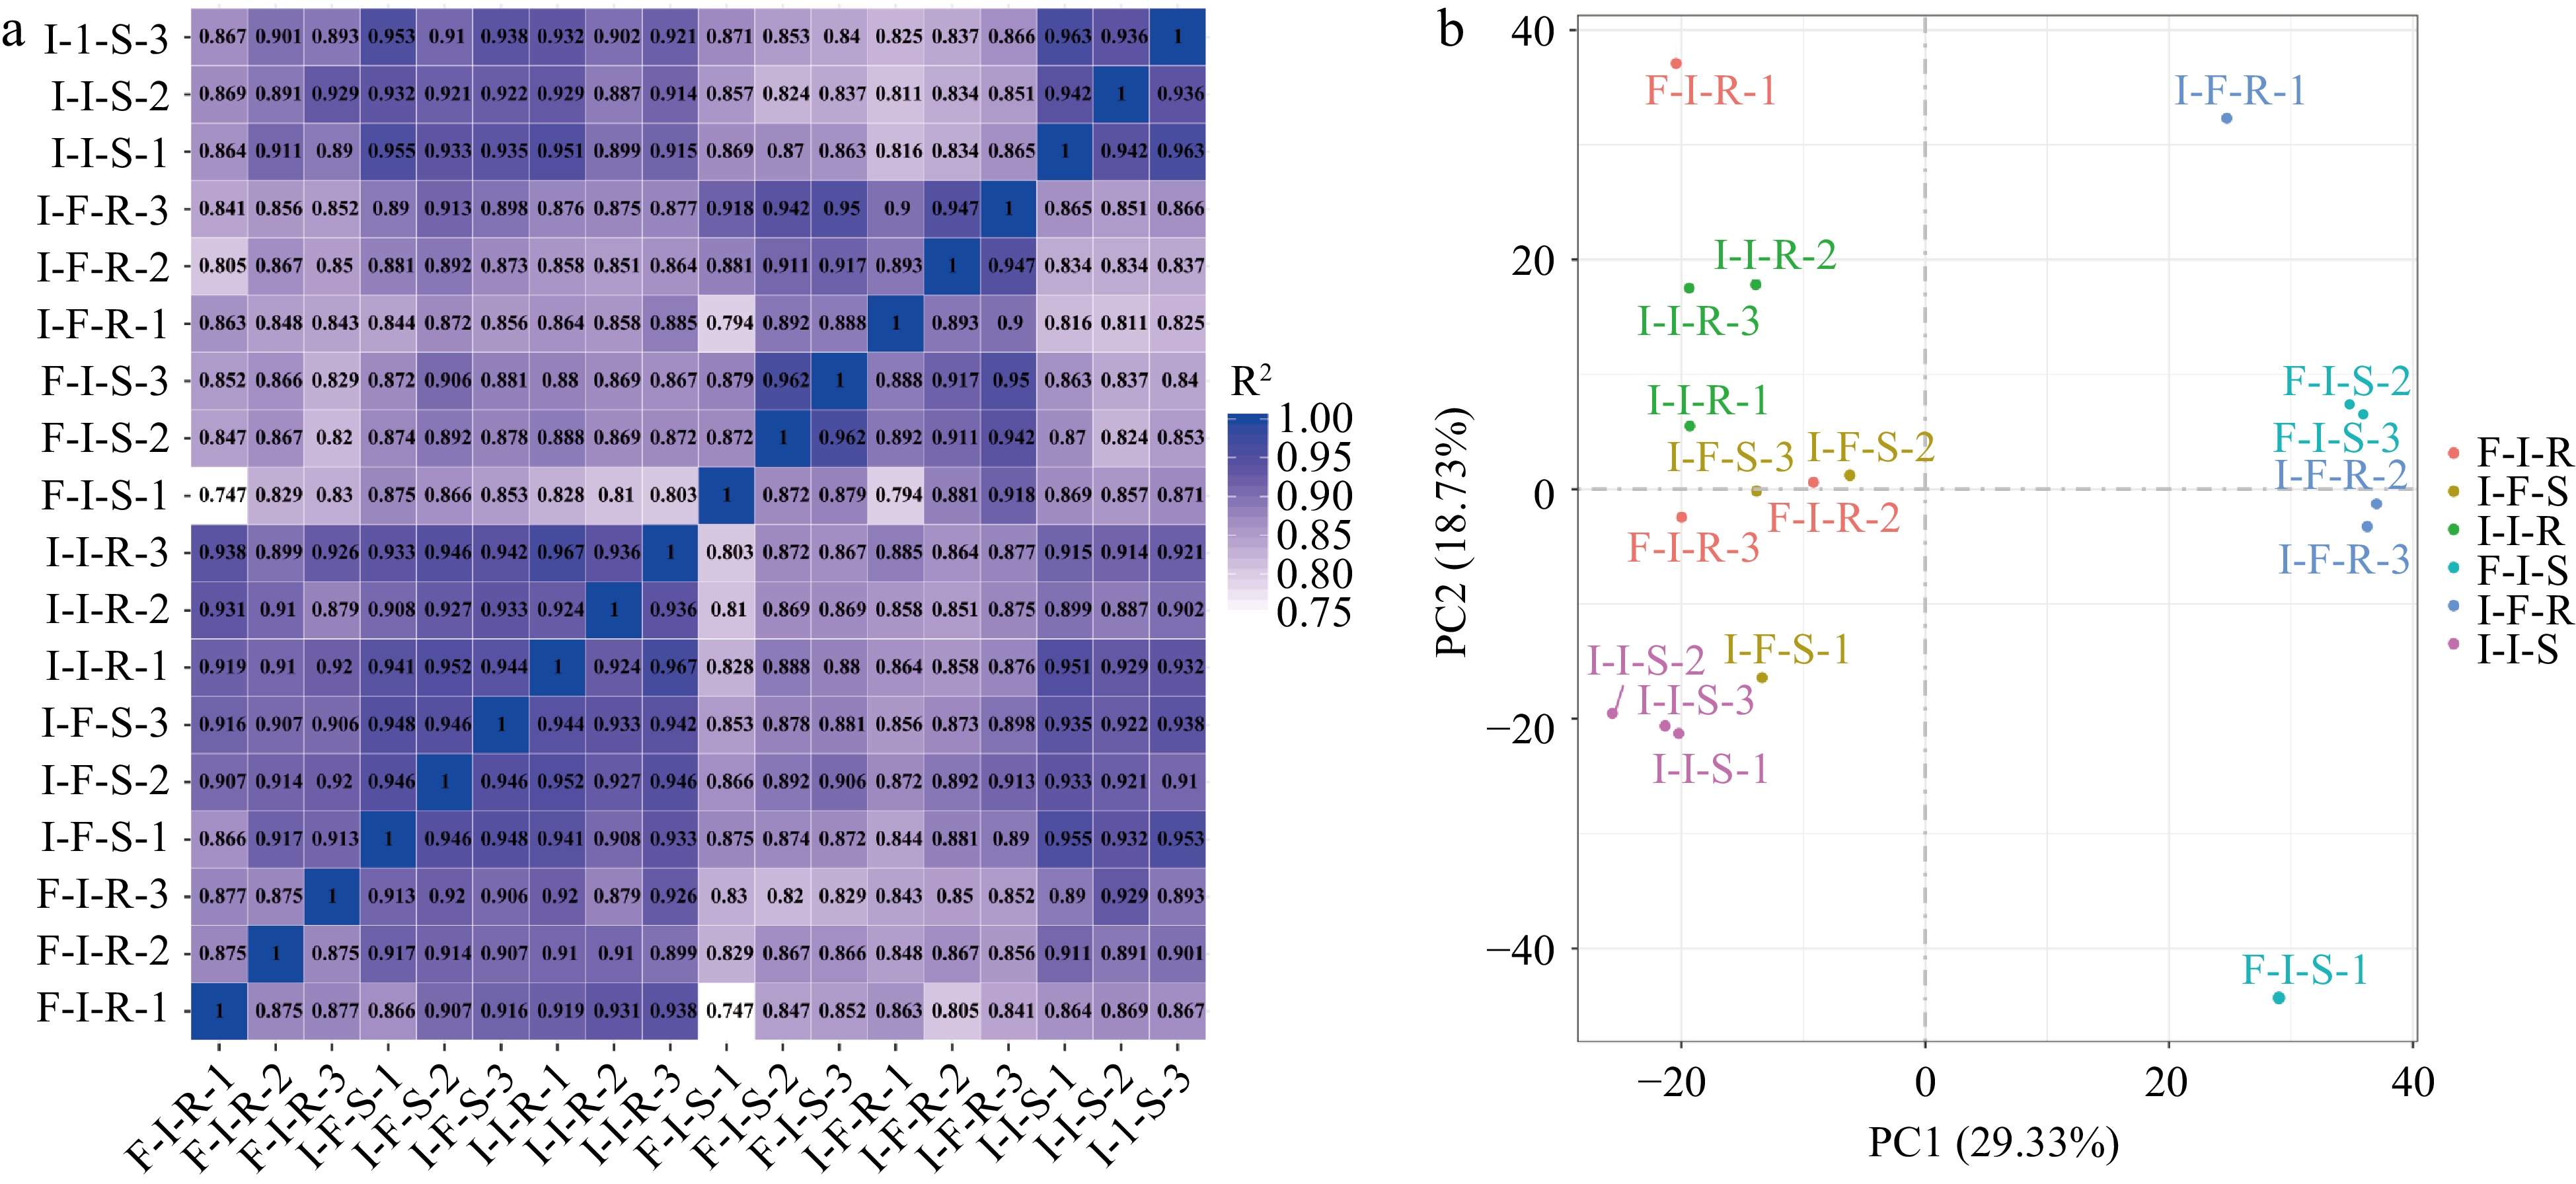
Figure 2.
Transcriptome analyses of stem of scions and rootstock in different grafting combinations. (a) Pearson correlation between samples (the horizontal and vertical coordinates of the graph are the square of the correlation coefficient of each sample). (b) Principal component analysis of samples.
-
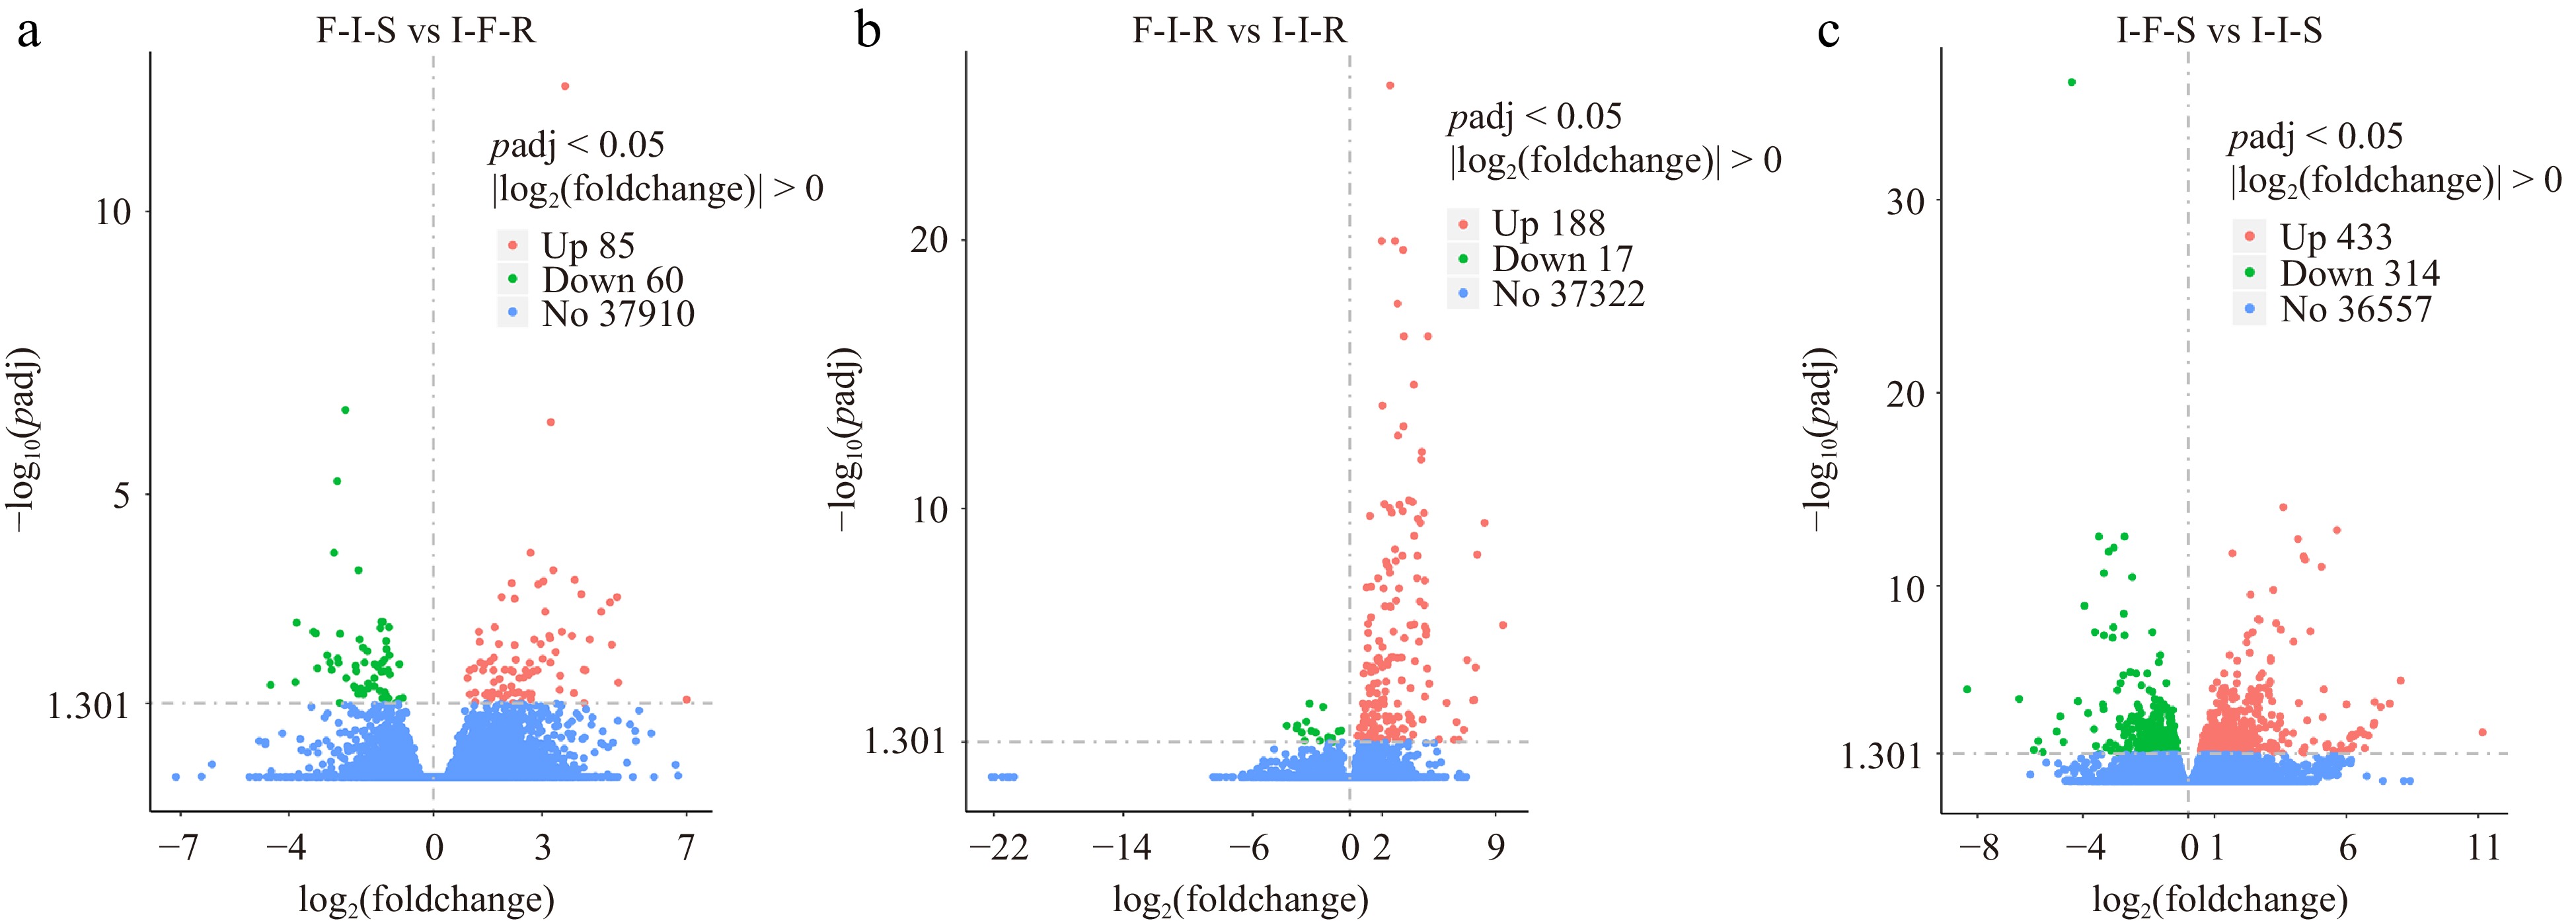
Figure 3.
The number of differential expressed genes for compare group. The horizontal coordinate is the log2(foldchange) value, the vertical coordinate is −log10(padj) or −log10(pvalue), and the threshold line for the differential gene screening criteria.
-
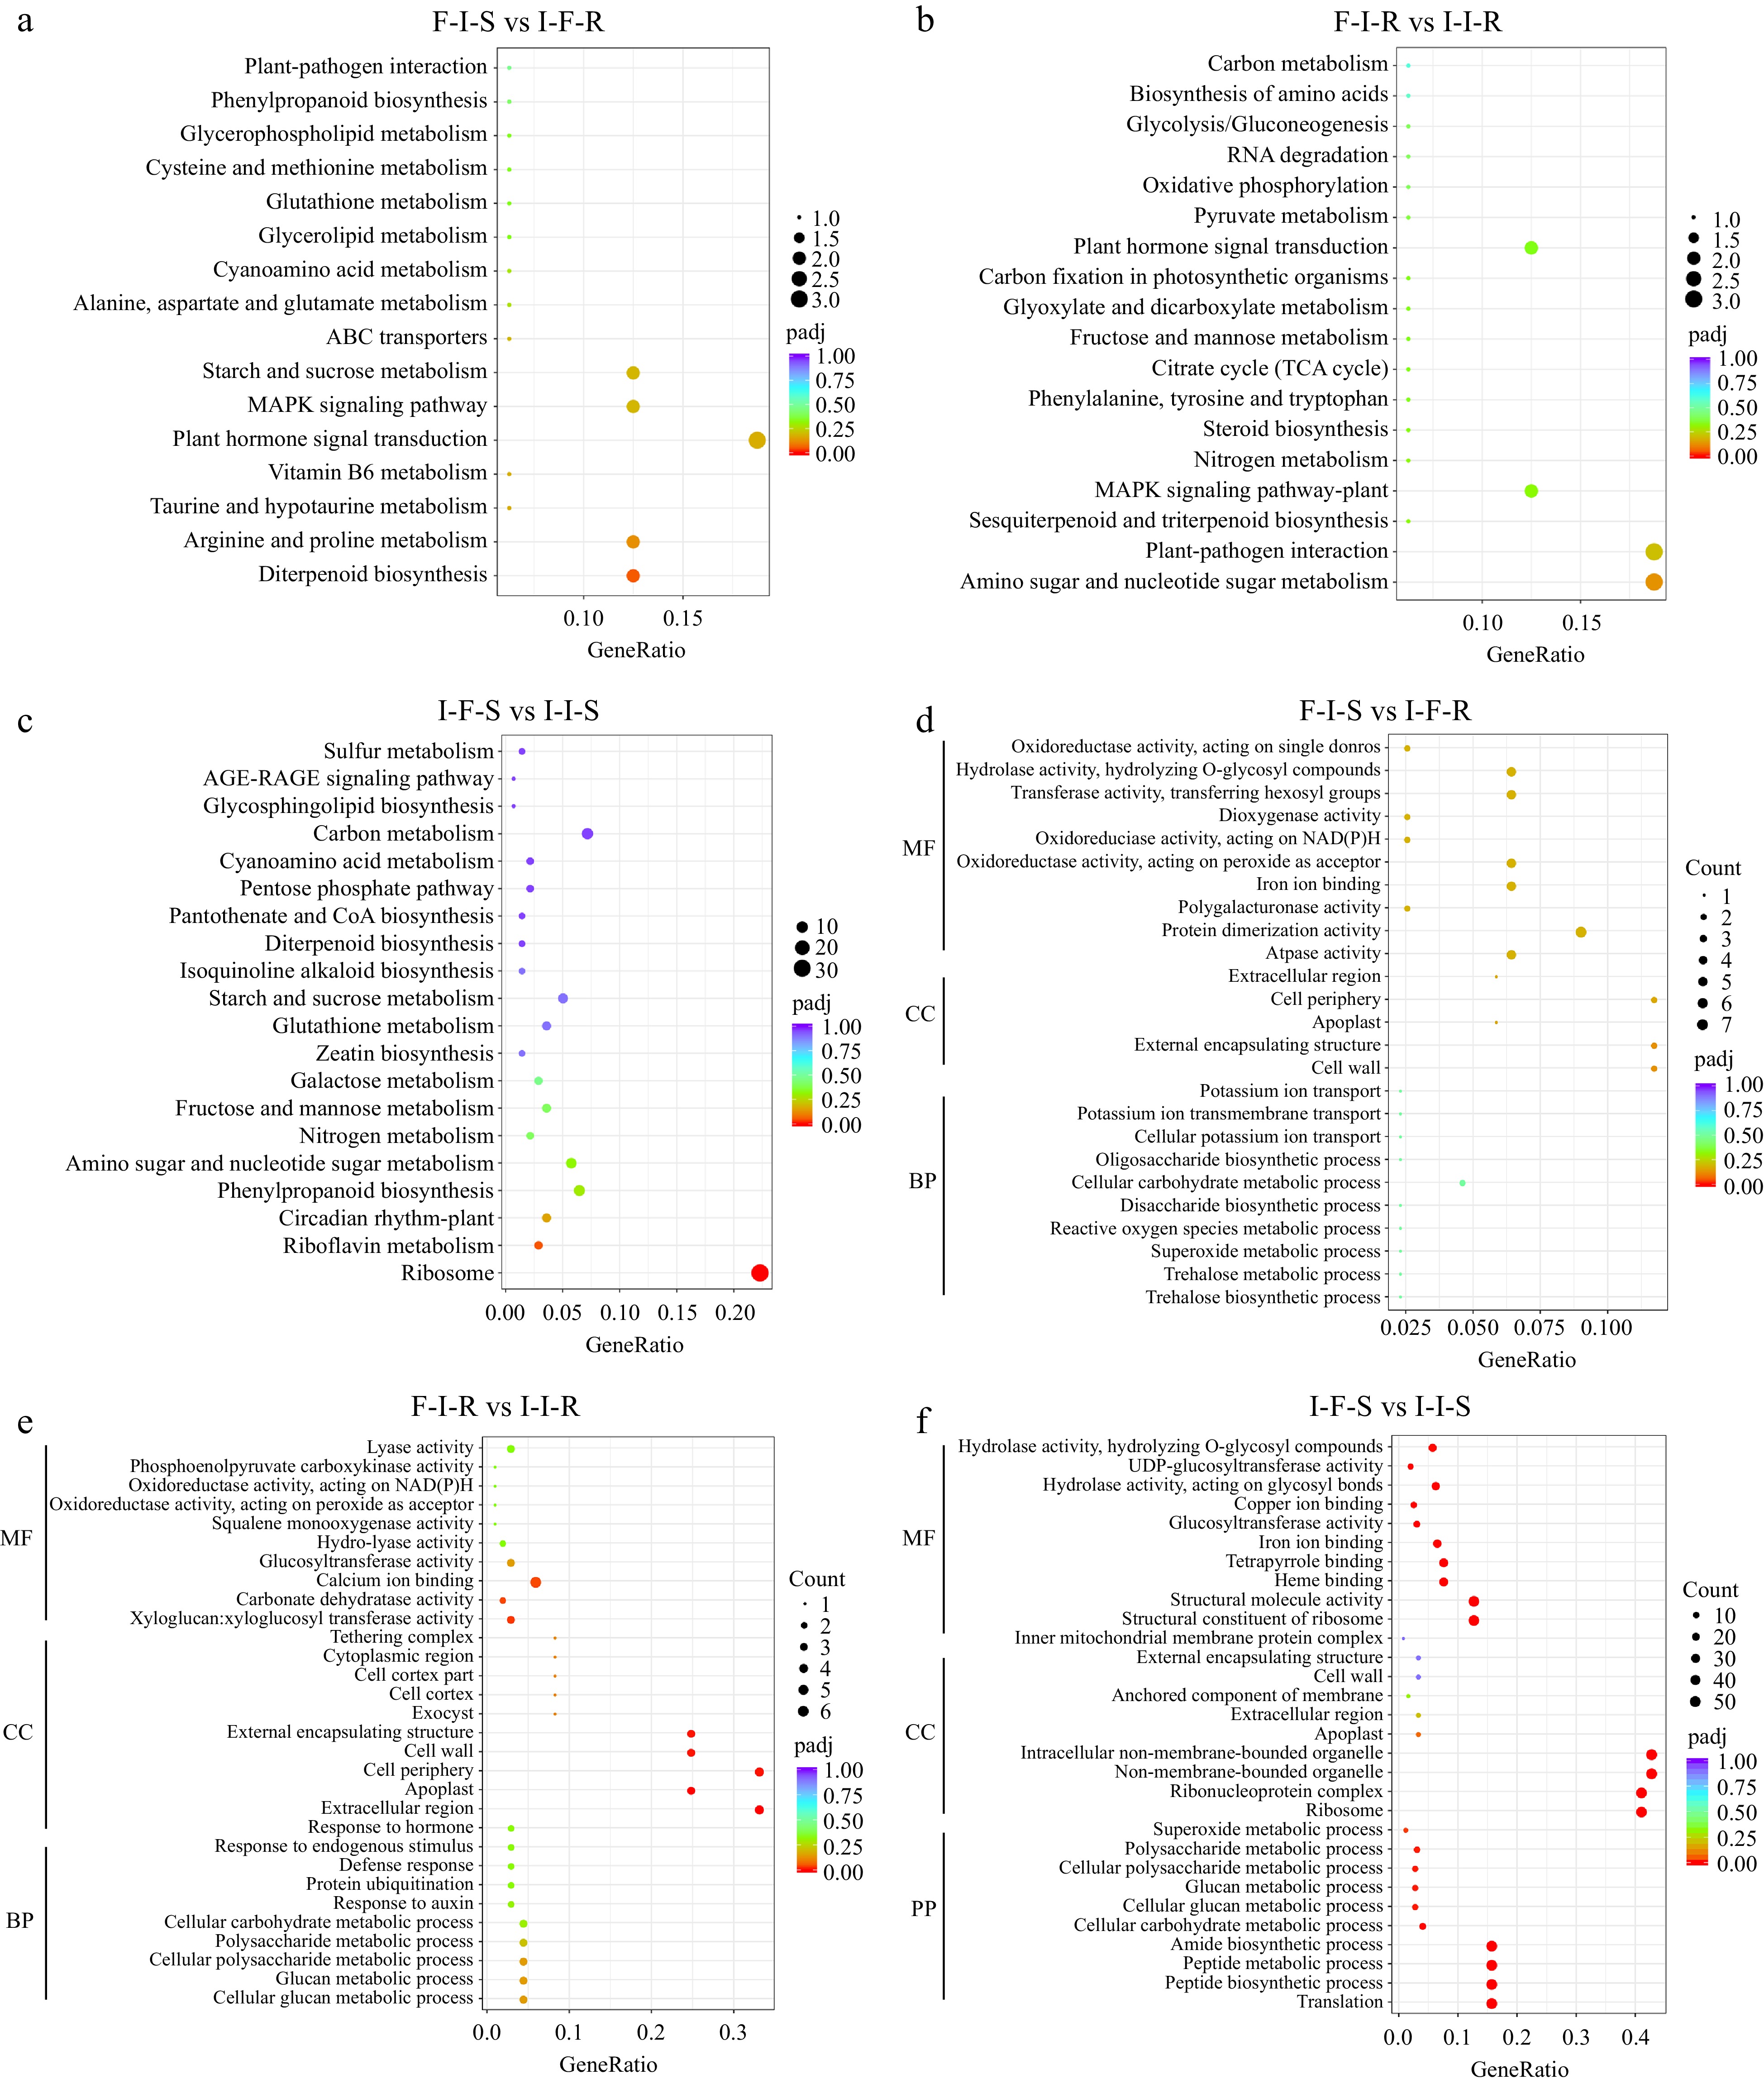
Figure 4.
Functional analysis of differentially expressed genes between grafting combinations. (a) KEGG enrich analyses in F-I-S vs I-F-R, (b) KEGG enrich analyses in F-I-R vs I-I-R, (c) KEGG enrich analyses in I-F-S vs I-I-S, (d) GO enrich analyses in F-I-S vs I-F-R, (e) GO enrich analyses in F-I-R vs I-I-R, (f) GO enrich analyses in I-F-S vs I-I-S.
-
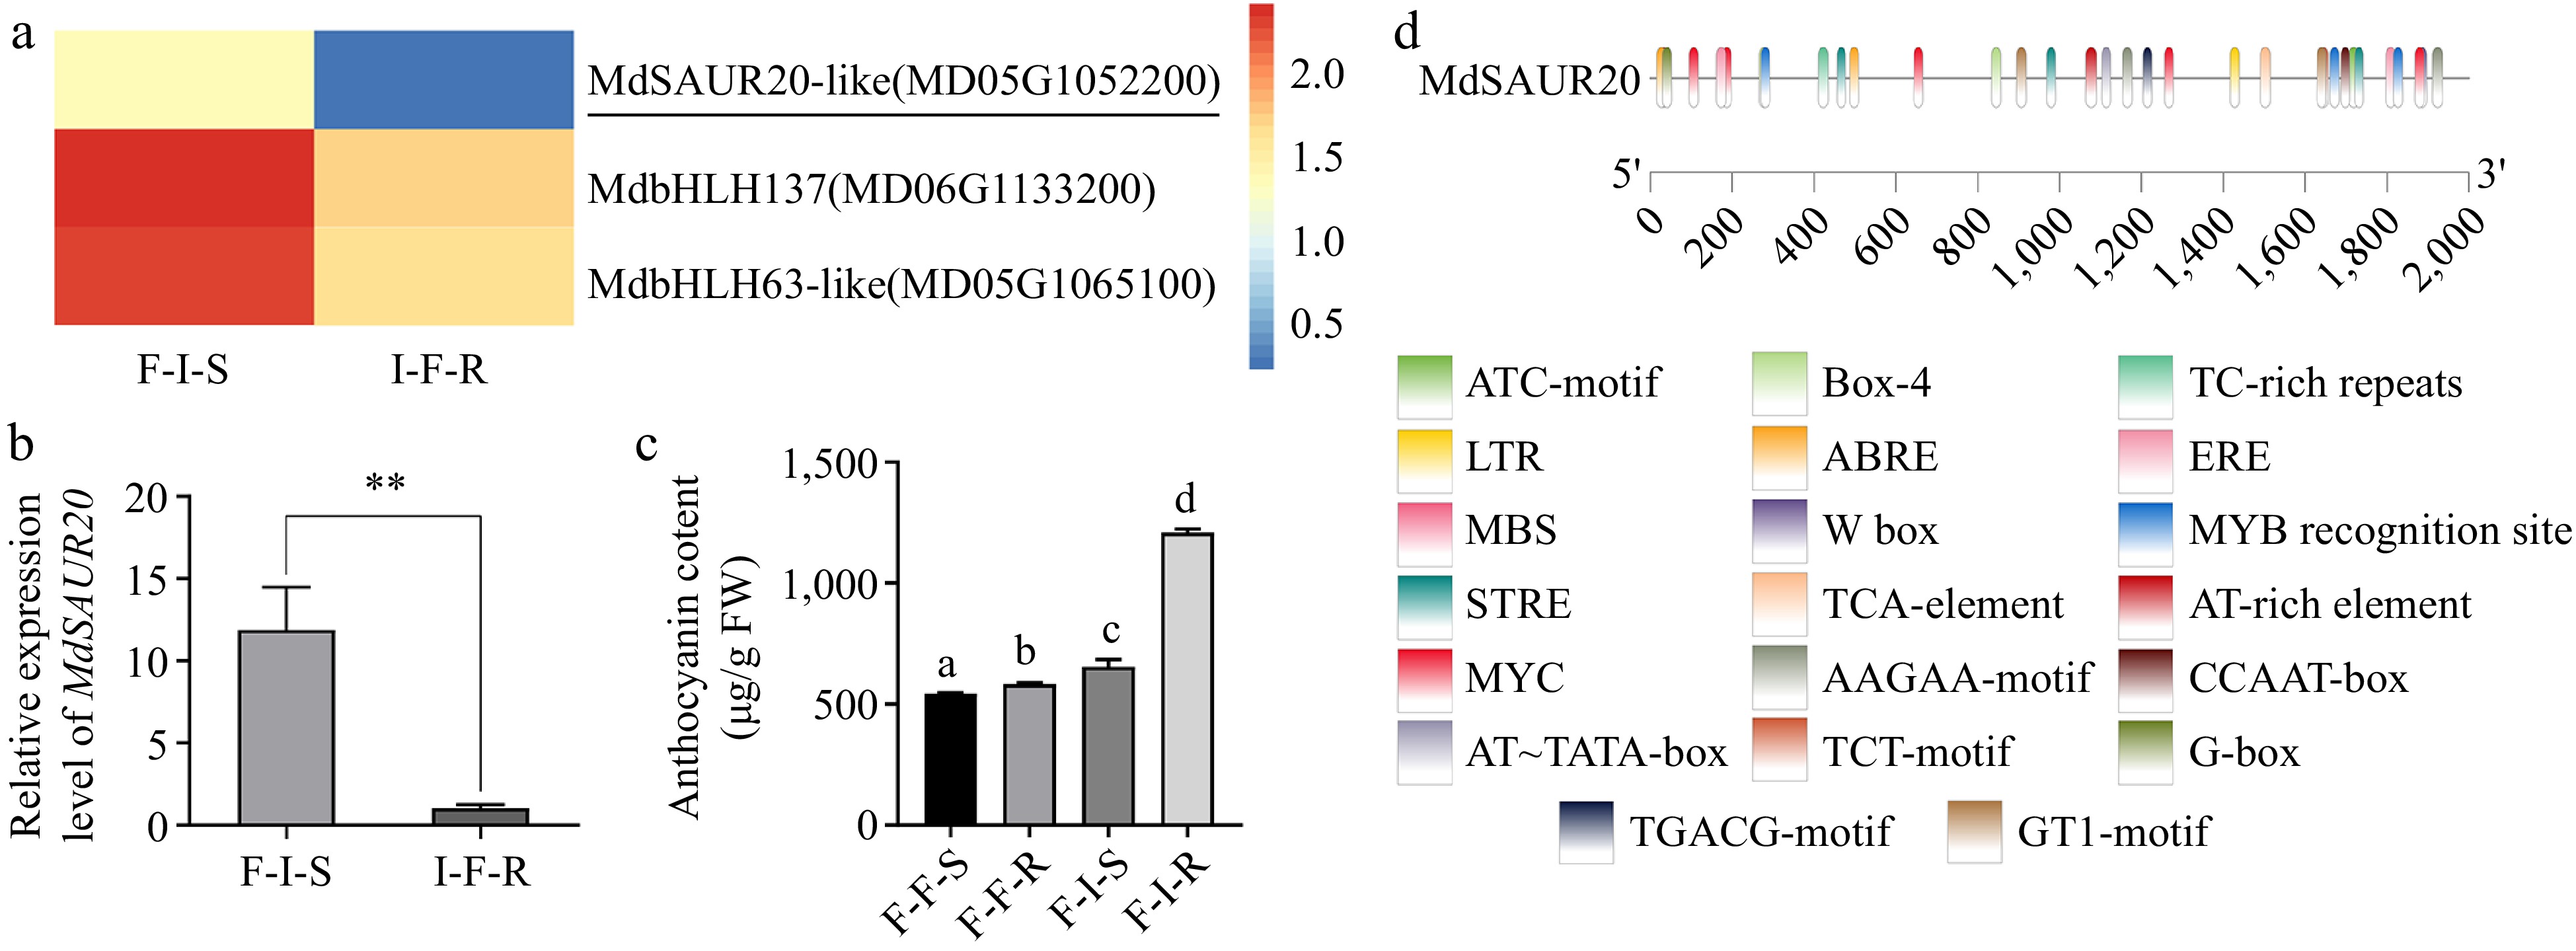
Figure 5.
Analysis of genes associated with anthocyanin biosynthesis during grafting. (a) Heatmap describing the expression of candidate transcription factors. (b) Relative expression levels of MdSAUR20 in F-I-S and I-F-R. (c) The content of anthocyanin in F/F vs F/I. (d) Schematic diagrams of the MdSAUR20 promoters. The error bars indicate the SD of three biological replicates. Asterisks indicate statistically significant differences (*p < 0.05; **p < 0.01) according to Student's t test.
-
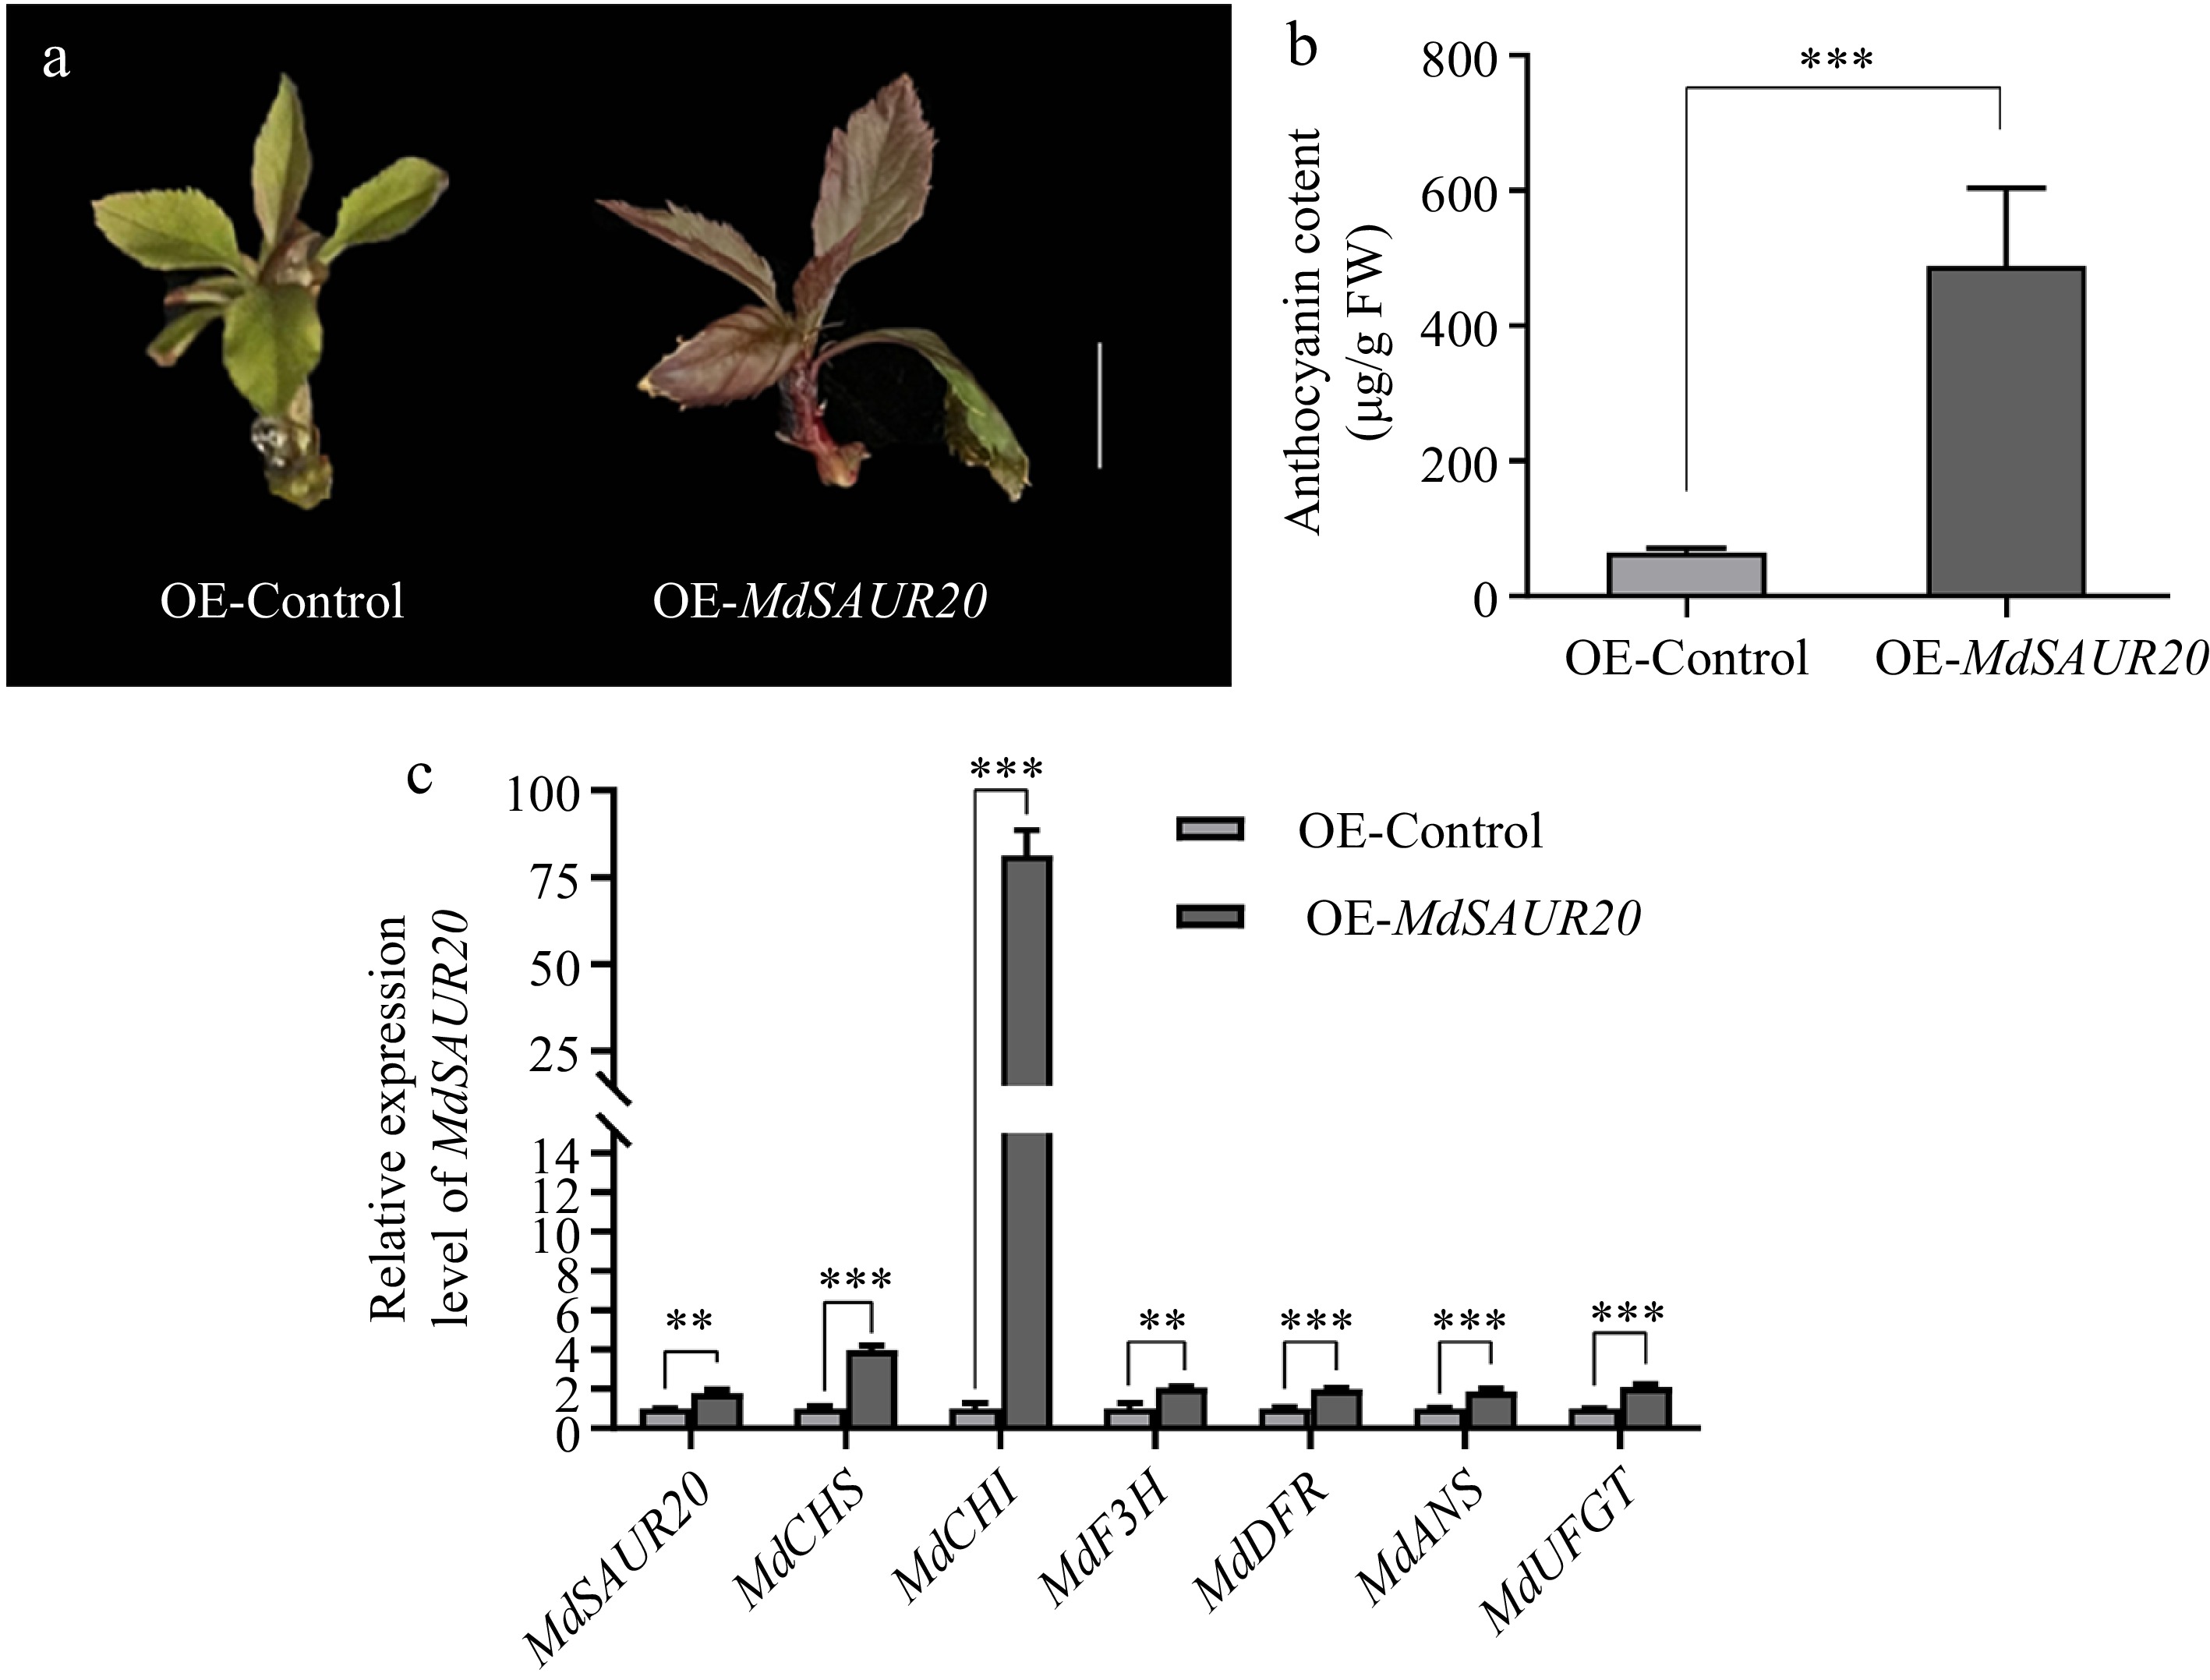
Figure 6.
Functional assay of in MdSAUR20. (a) Pigmented transgenic cells were formed in seedling transformed with OE-MdSAUR20. Scale bar = 1 cm (b) Anthocyanin content in inoculated apple tissue culture seedlings. (c) Relative expression levels of MdSAUR20 in seedlings and anthocyanin biosynthesis genes. Data are presented as mean values ± SD of three independent biological replicates. Asterisks indicate significant difference by Student's t-test.
-
Sample
nameClean reads % ≥ Q30 Total reads Mapped reads I-I-R-1 26,367,340 93.26 52,734,680 45,507,642 (86.3%) I-I-R-2 22,928,739 93.21 45,857,478 39,118,647 (85.3%) I-I-R-3 22,104,191 93.99 44,208,382 38,710,947 (87.56%) I-I-S-1 23,790,350 93.89 47,580,700 41,410,502 (87.03%) I-I-S-2 23,041,216 93.29 46,082,432 40,172,269 (87.17%) I-I-S-3 23,120,817 93.00 46,241,634 40,433,561 (87.44%) I-F-S-1 23,048,140 94.00 46,096,280 40,314,380 (87.46%) I-F-S-2 22,692,497 93.90 45,384,994 40,033,821 (88.21%) I-F-S-3 19,344,387 93.00 38,688,774 33,125,491 (85.62%) I-F-R-1 22,931,226 94.37 45,862,452 40,818,713 (89.0%) I-F-R-2 22,311,552 93.06 44,623,104 38,436,230 (86.14%) I-F-R-3 22,713,776 93.84 45,427,552 39,092,461 (86.05%) F-I-S-1 22,724,018 94.15 45,448,036 40,037,863 (88.1%) F-I-S-2 23,260,096 93.93 46,520,192 39,871,870 (85.71%) F-I-S-3 22,846,841 94.05 45,693,682 40,535,794 (88.71%) F-I-R-1 23,151,622 94.06 46,303,244 41,035,064 (88.62%) F-I-R-2 25,981,536 94.19 51,963,072 45,465,386 (87.5%) F-I-R-3 23,629,467 94.19 47,258,934 41,551,698 (87.92%) Clean reads: number of reads after raw data filtering; % ≥ Q30: Percentage of total bases with Phred values greater than 30; Total reads: number of clean reads of sequencing data after quality control; Mapped reads: number of reads matched to the genome and their percentages. Table 1.
RNA sequencing data.
Figures
(6)
Tables
(1)