-
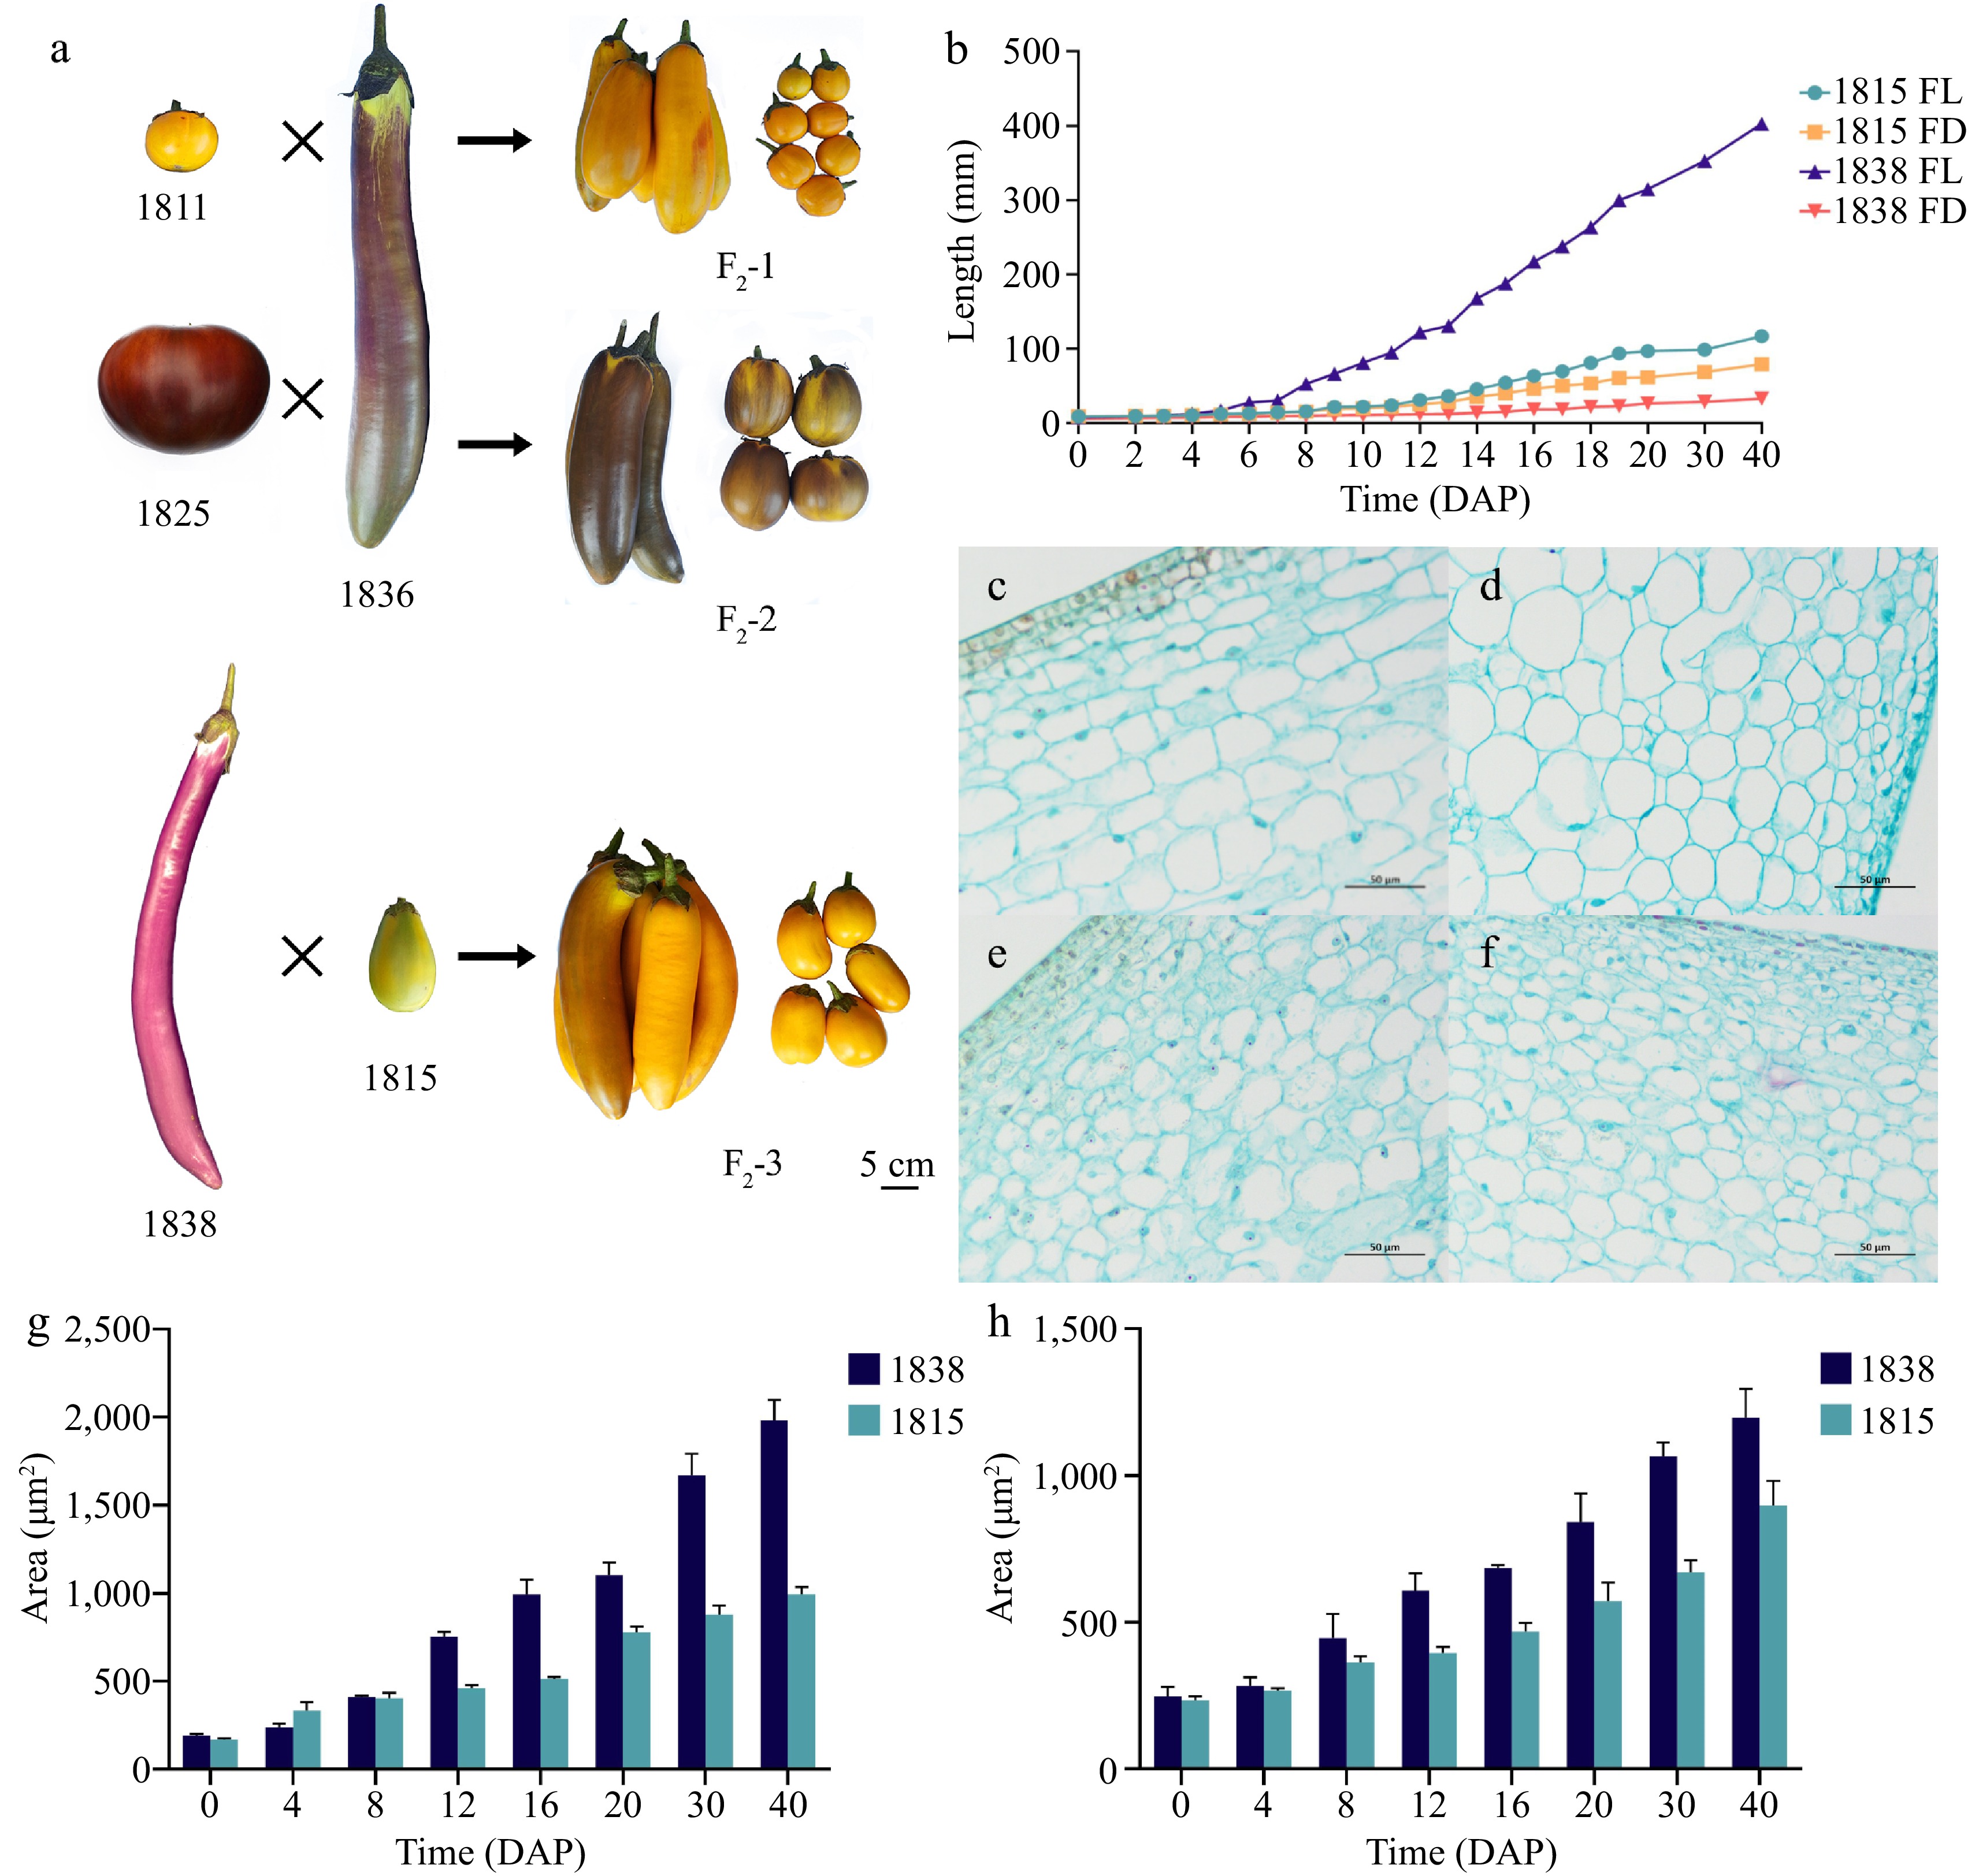
Figure 1.
Fruit length phenotypic analysis of five parents and selected extreme-fruit length individuals of three F2 populations (bar = 5 cm). (a) Parents of three QTL populations and extreme individual plants of F2 at 40 DAP. (b) Fruit length and diameter statistics of 1838 and 1815. (c), (d) Longitudinal and transverse sections of fruit cells of 1838 at 12 DAP. (e), (f) Longitudinal and transverse sections of fruit cells of 1815 at 12 DAP. (g), (h) Comparison of the longitudinal and transverse cell area in 1838 and 1815.
-
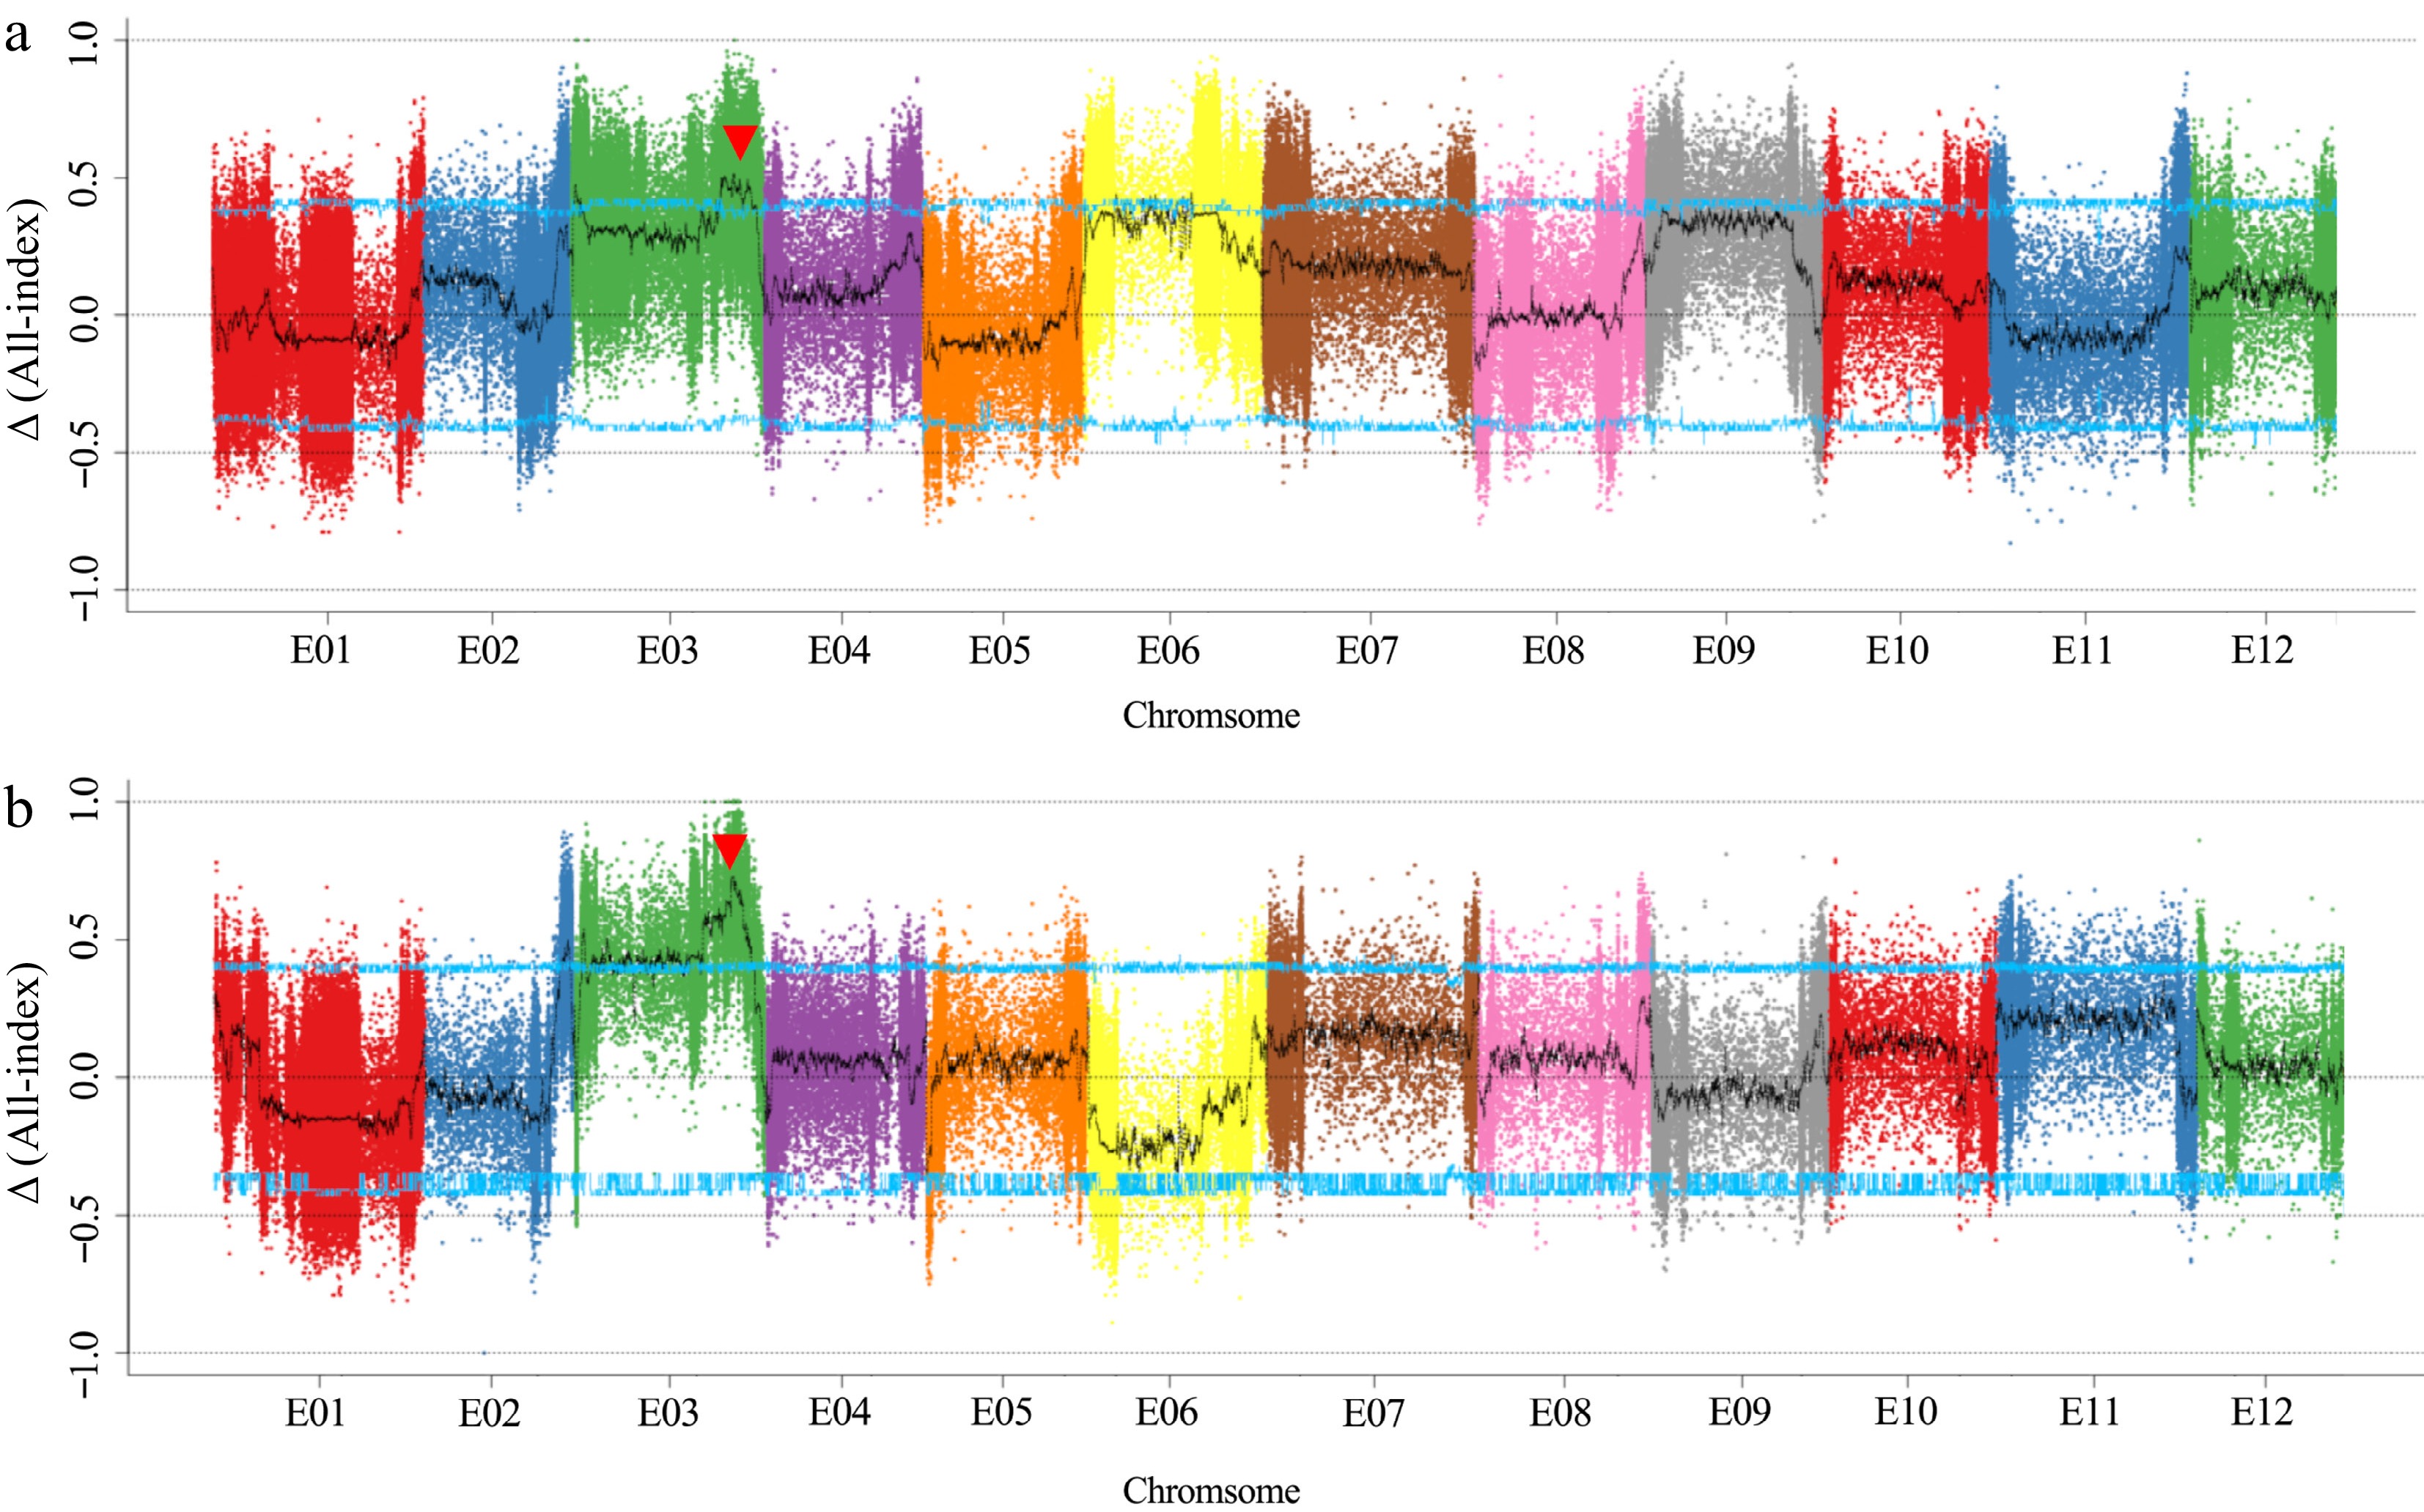
Figure 2.
Δ All-index mapping of fruit length QTLs in F2-1 and F2-2, where the blue line represents the 95% threshold.
-
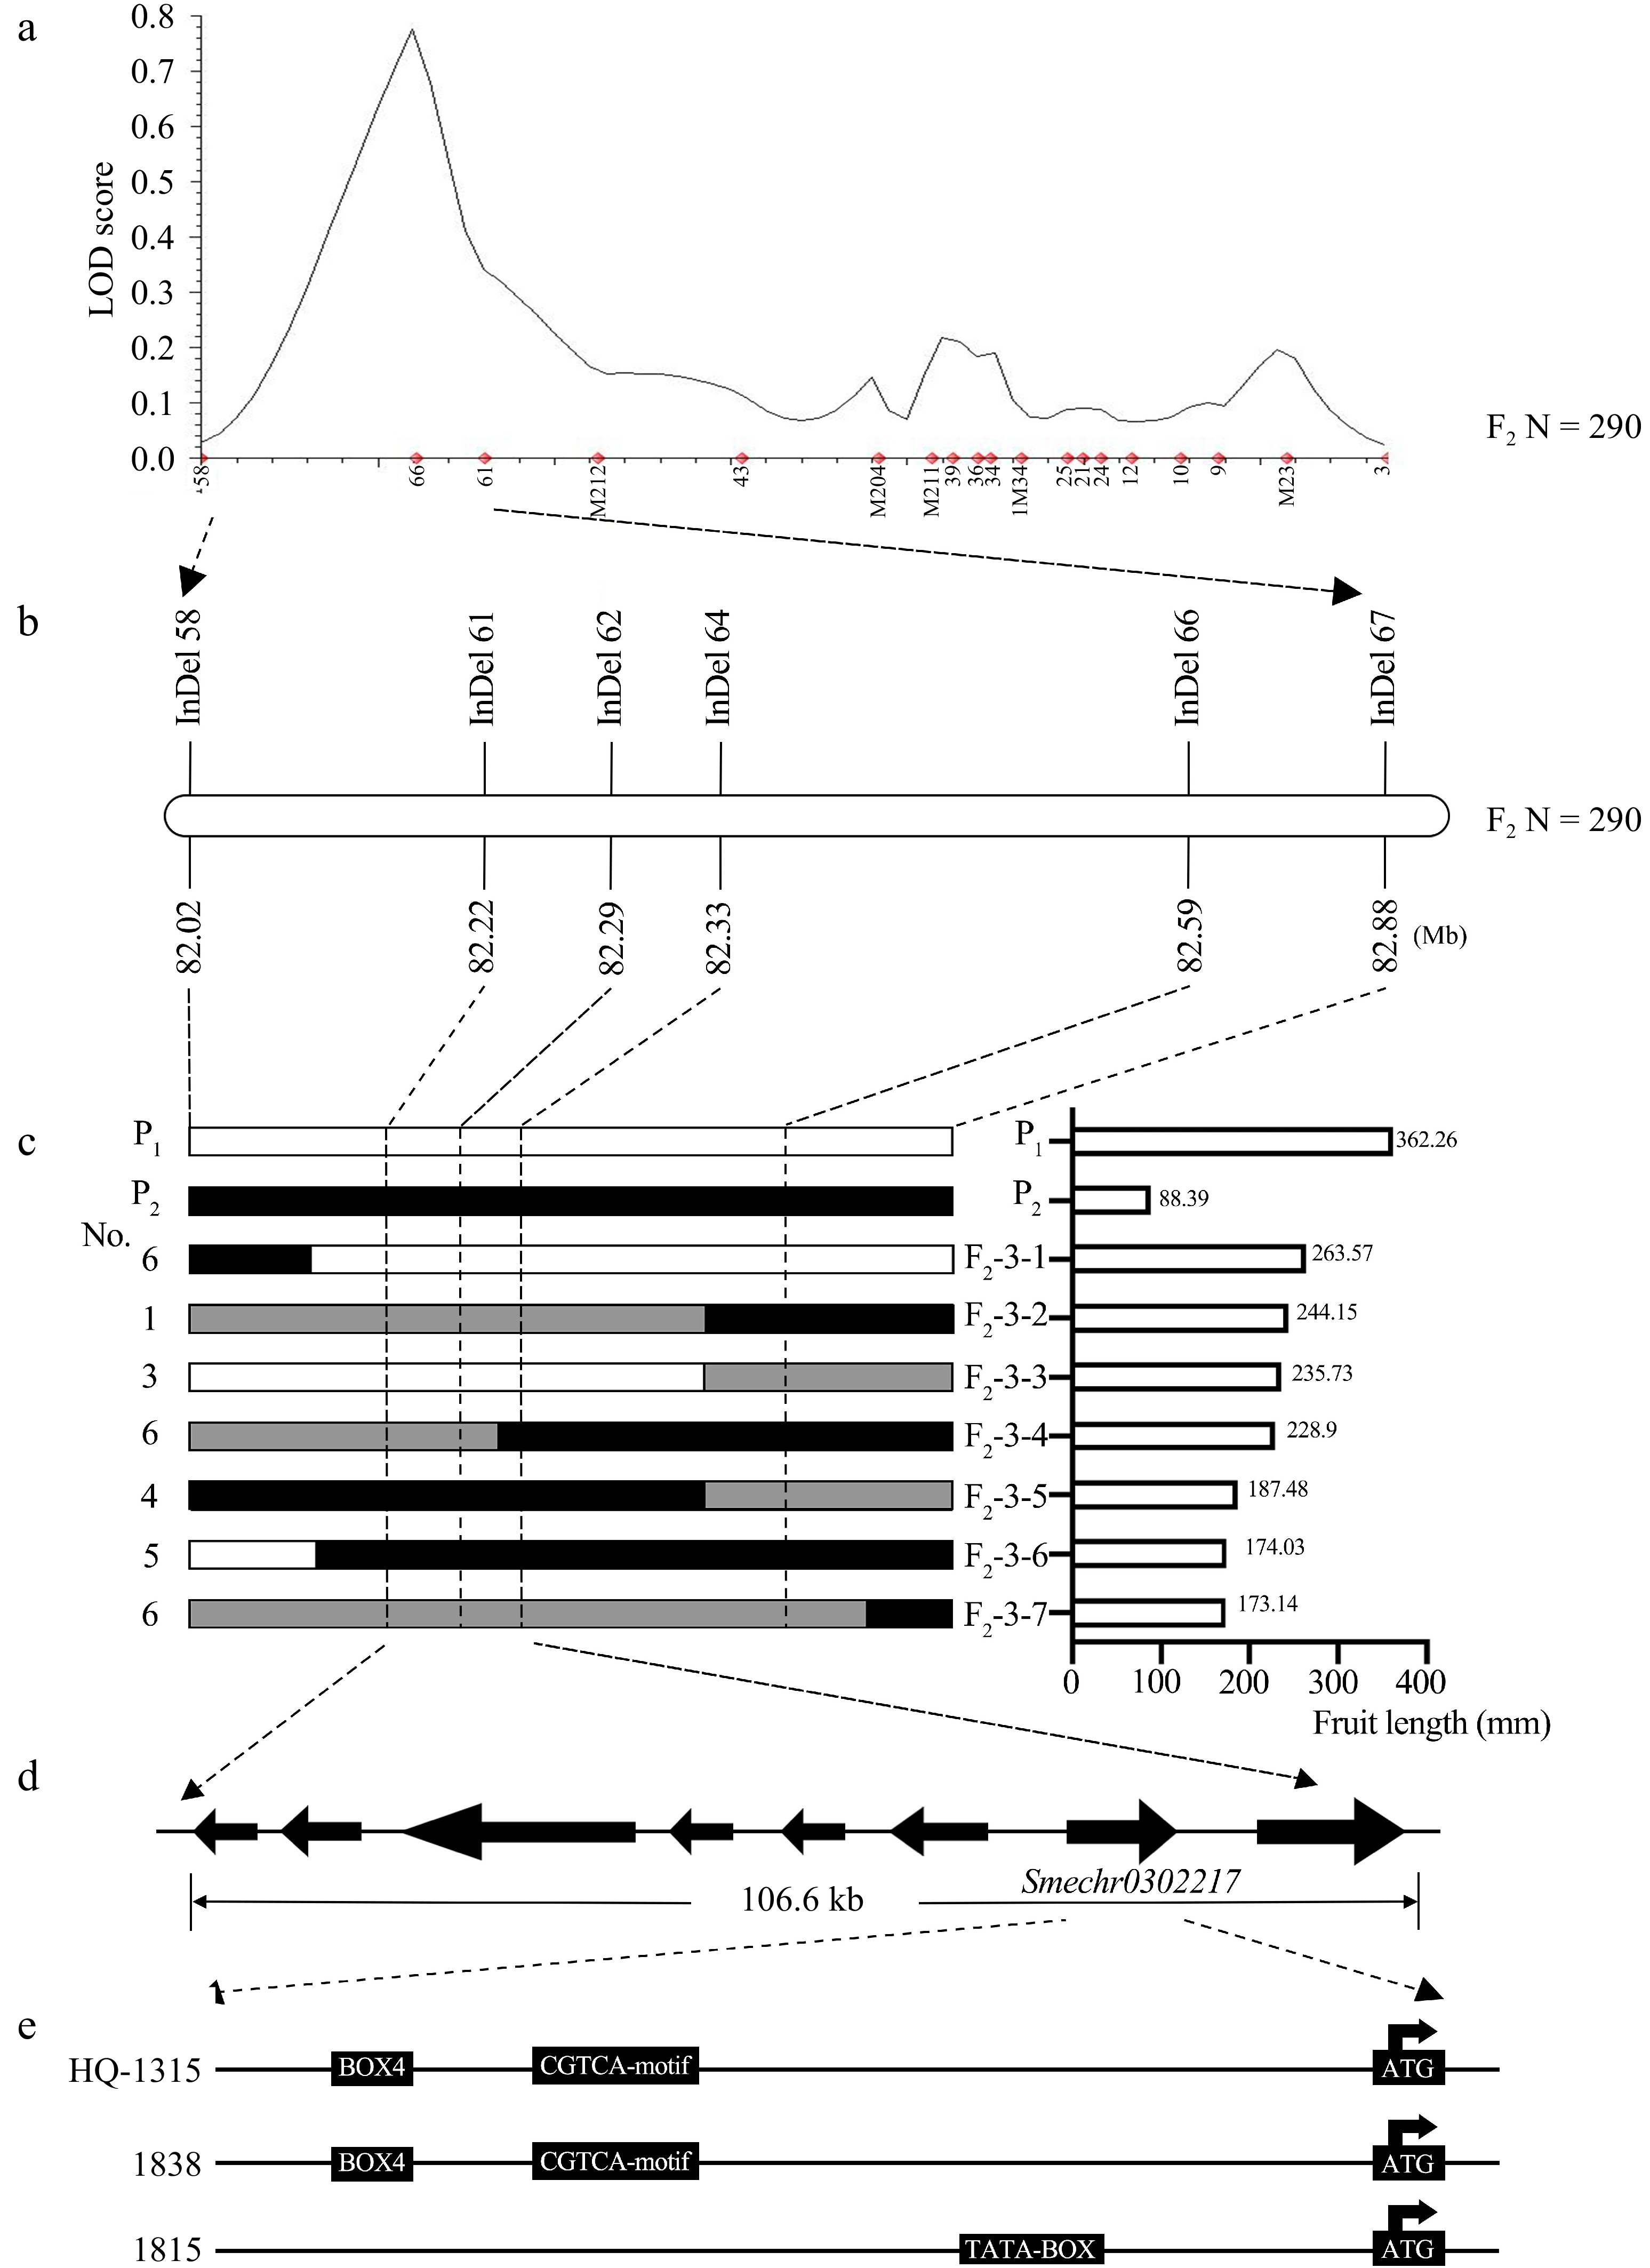
Figure 3.
Fine mapping of fl3.1. (a) Fine mapping based on 290 F2 individual plants. (b) fl3.1 was mapped to a 568 kb region between the InDel 58 and InDel 66 markers. (c) The numbers on the left indicate the number of recombinants. The white filled and black bars represent segments homozygous for the 1838 and 1815 alleles, respectively. Fruit length is shown for the recombinant plants (3-F2-1-7) and parents on the right. (d) Eight genes in the 106.6 kb region. (e) Three promoter element differences according to sequencing analysis.
-
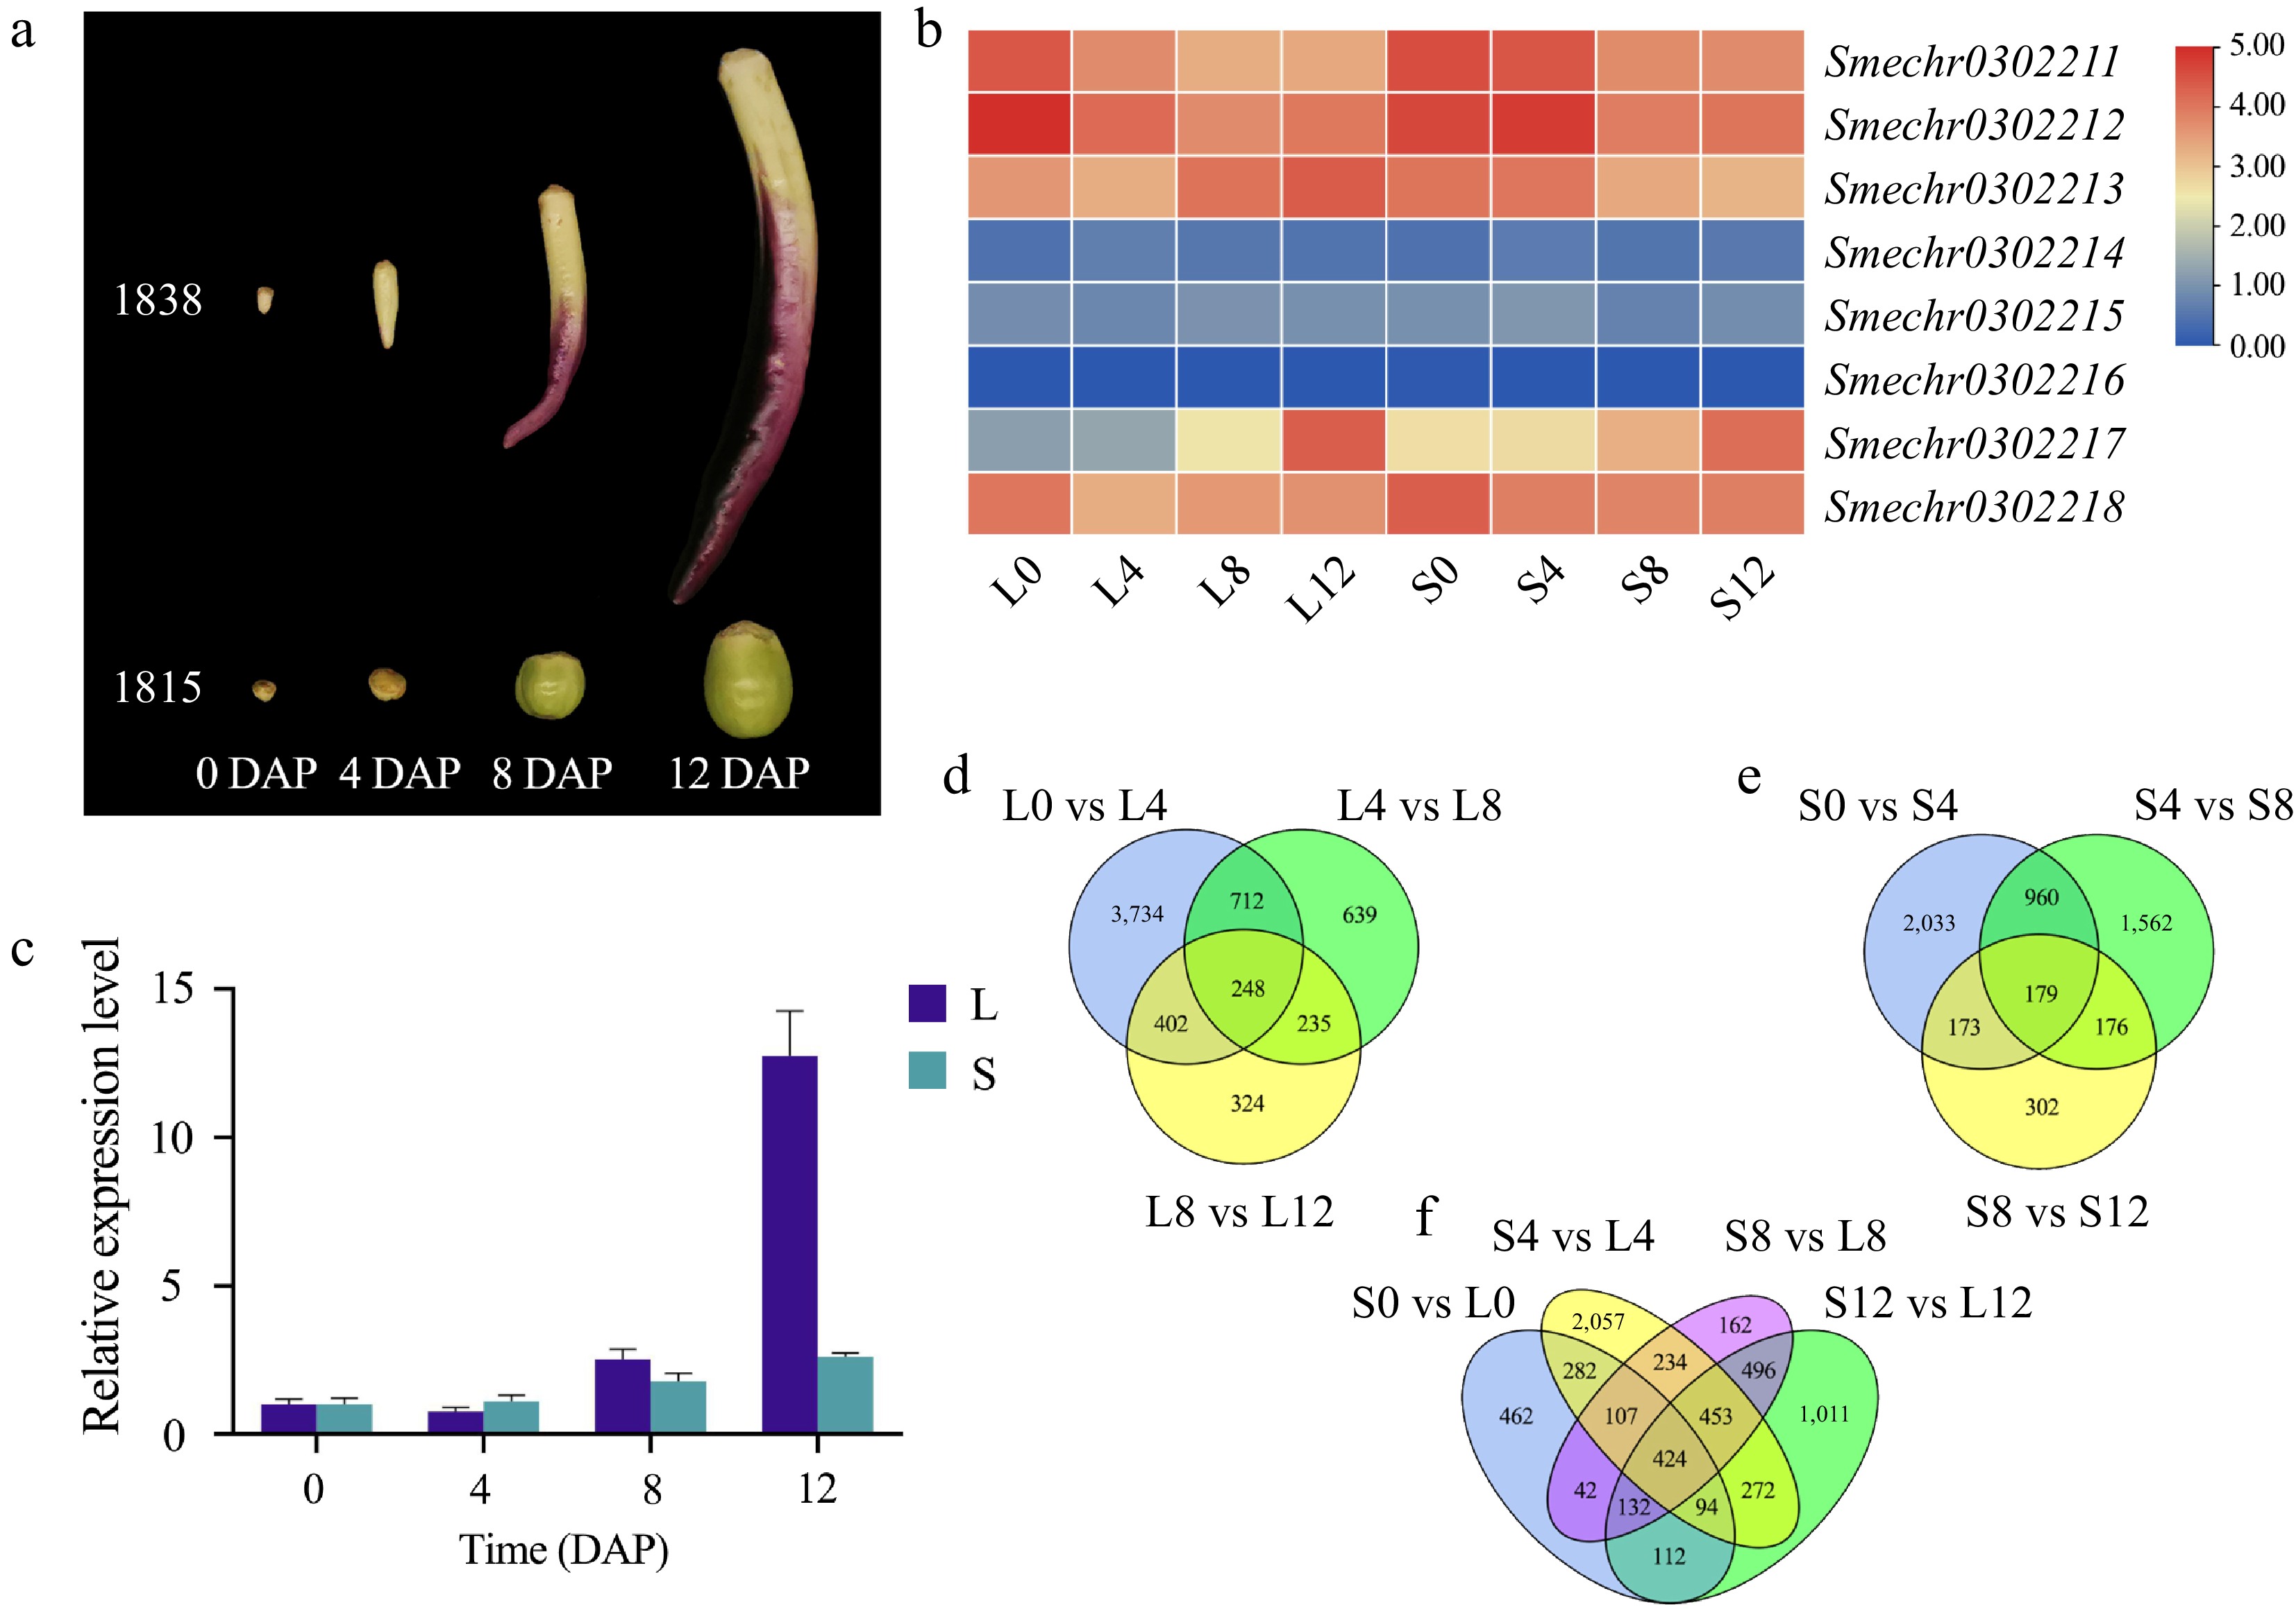
Figure 4.
RNA-seq samples and data analysis. (a) Four sampling periods of RNA-seq samples. (b) Heatmap of eight genes. (c) qRT-PCR results for Smechr0302217. (d)−(f) Venn diagram of the 10 comparison groups.
-
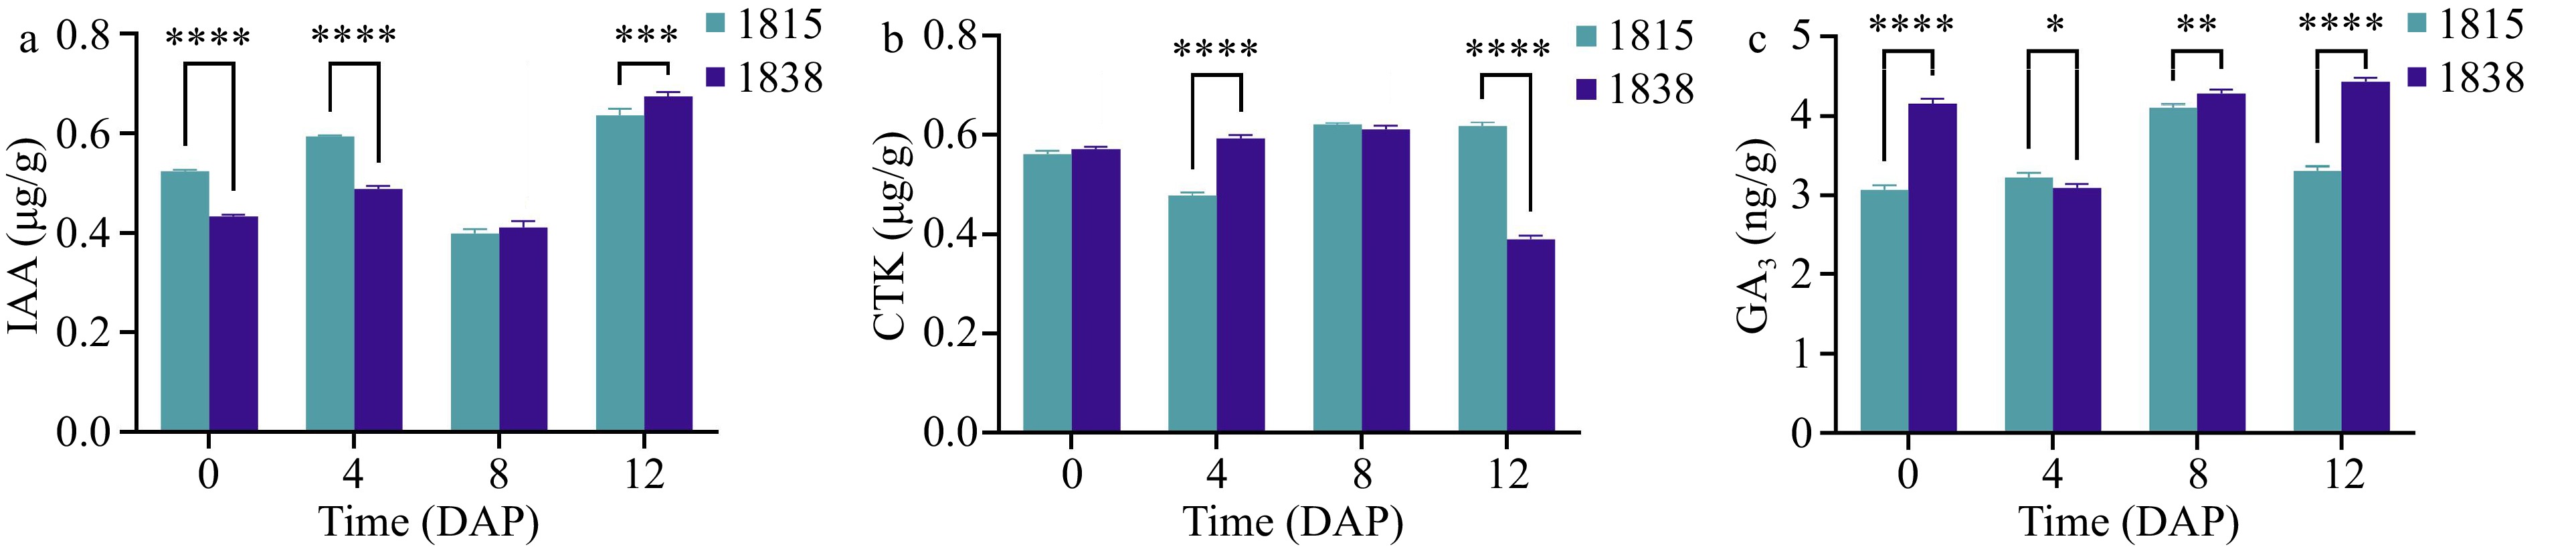
Figure 5.
Expression assay of IAA, CTK and GA3. (a)−(c) IAA, CTK and GA3 expression at 0, 4, 8, and 12 DAP in 1838 and 1815.
-
Population Chr. QTL Start (bp) End (bp) Confidence interval F2-1 E03 fl3.1 75,049,001 88,261,000 99 F2-2 E02 fl2.1 71,623,001 71,907,000 99 F2-2 E03 fl3.2 3,597,001 4,470,000 99 F2-2 E03 fl3.1 64,218,001 87,415,000 99 F2-3 E03 fl3.1 71,286,001 78,262,000 99 Table 1.
QTLs detected in the mapping populations.
-
Gene ID Position Gene annotation Smechr0302211 82,225,171−82,225,560 Protein defective in meristem silencing 3 Smechr0302212 82,226,053−82,234,339 — Smechr0302213 82,245,138−82,280,629 Protein GMI1 Smechr0302214 82,290,277−82,291,199 Beta-galactosidase 9 Smechr0302215 82,291,354−82,291,908 — Smechr0302216 82,295,773−82,298,371 AP2/ERF and B3 domain-containing transcription factor Smechr0302217 82,302,722−82,306,030 Protein IQ-DOMAIN 1 Smechr0302218 82,314,017−82,328,336 Soluble starch synthase 1 Table 2.
The information of genes in fine mapping region.
Figures
(5)
Tables
(2)