-
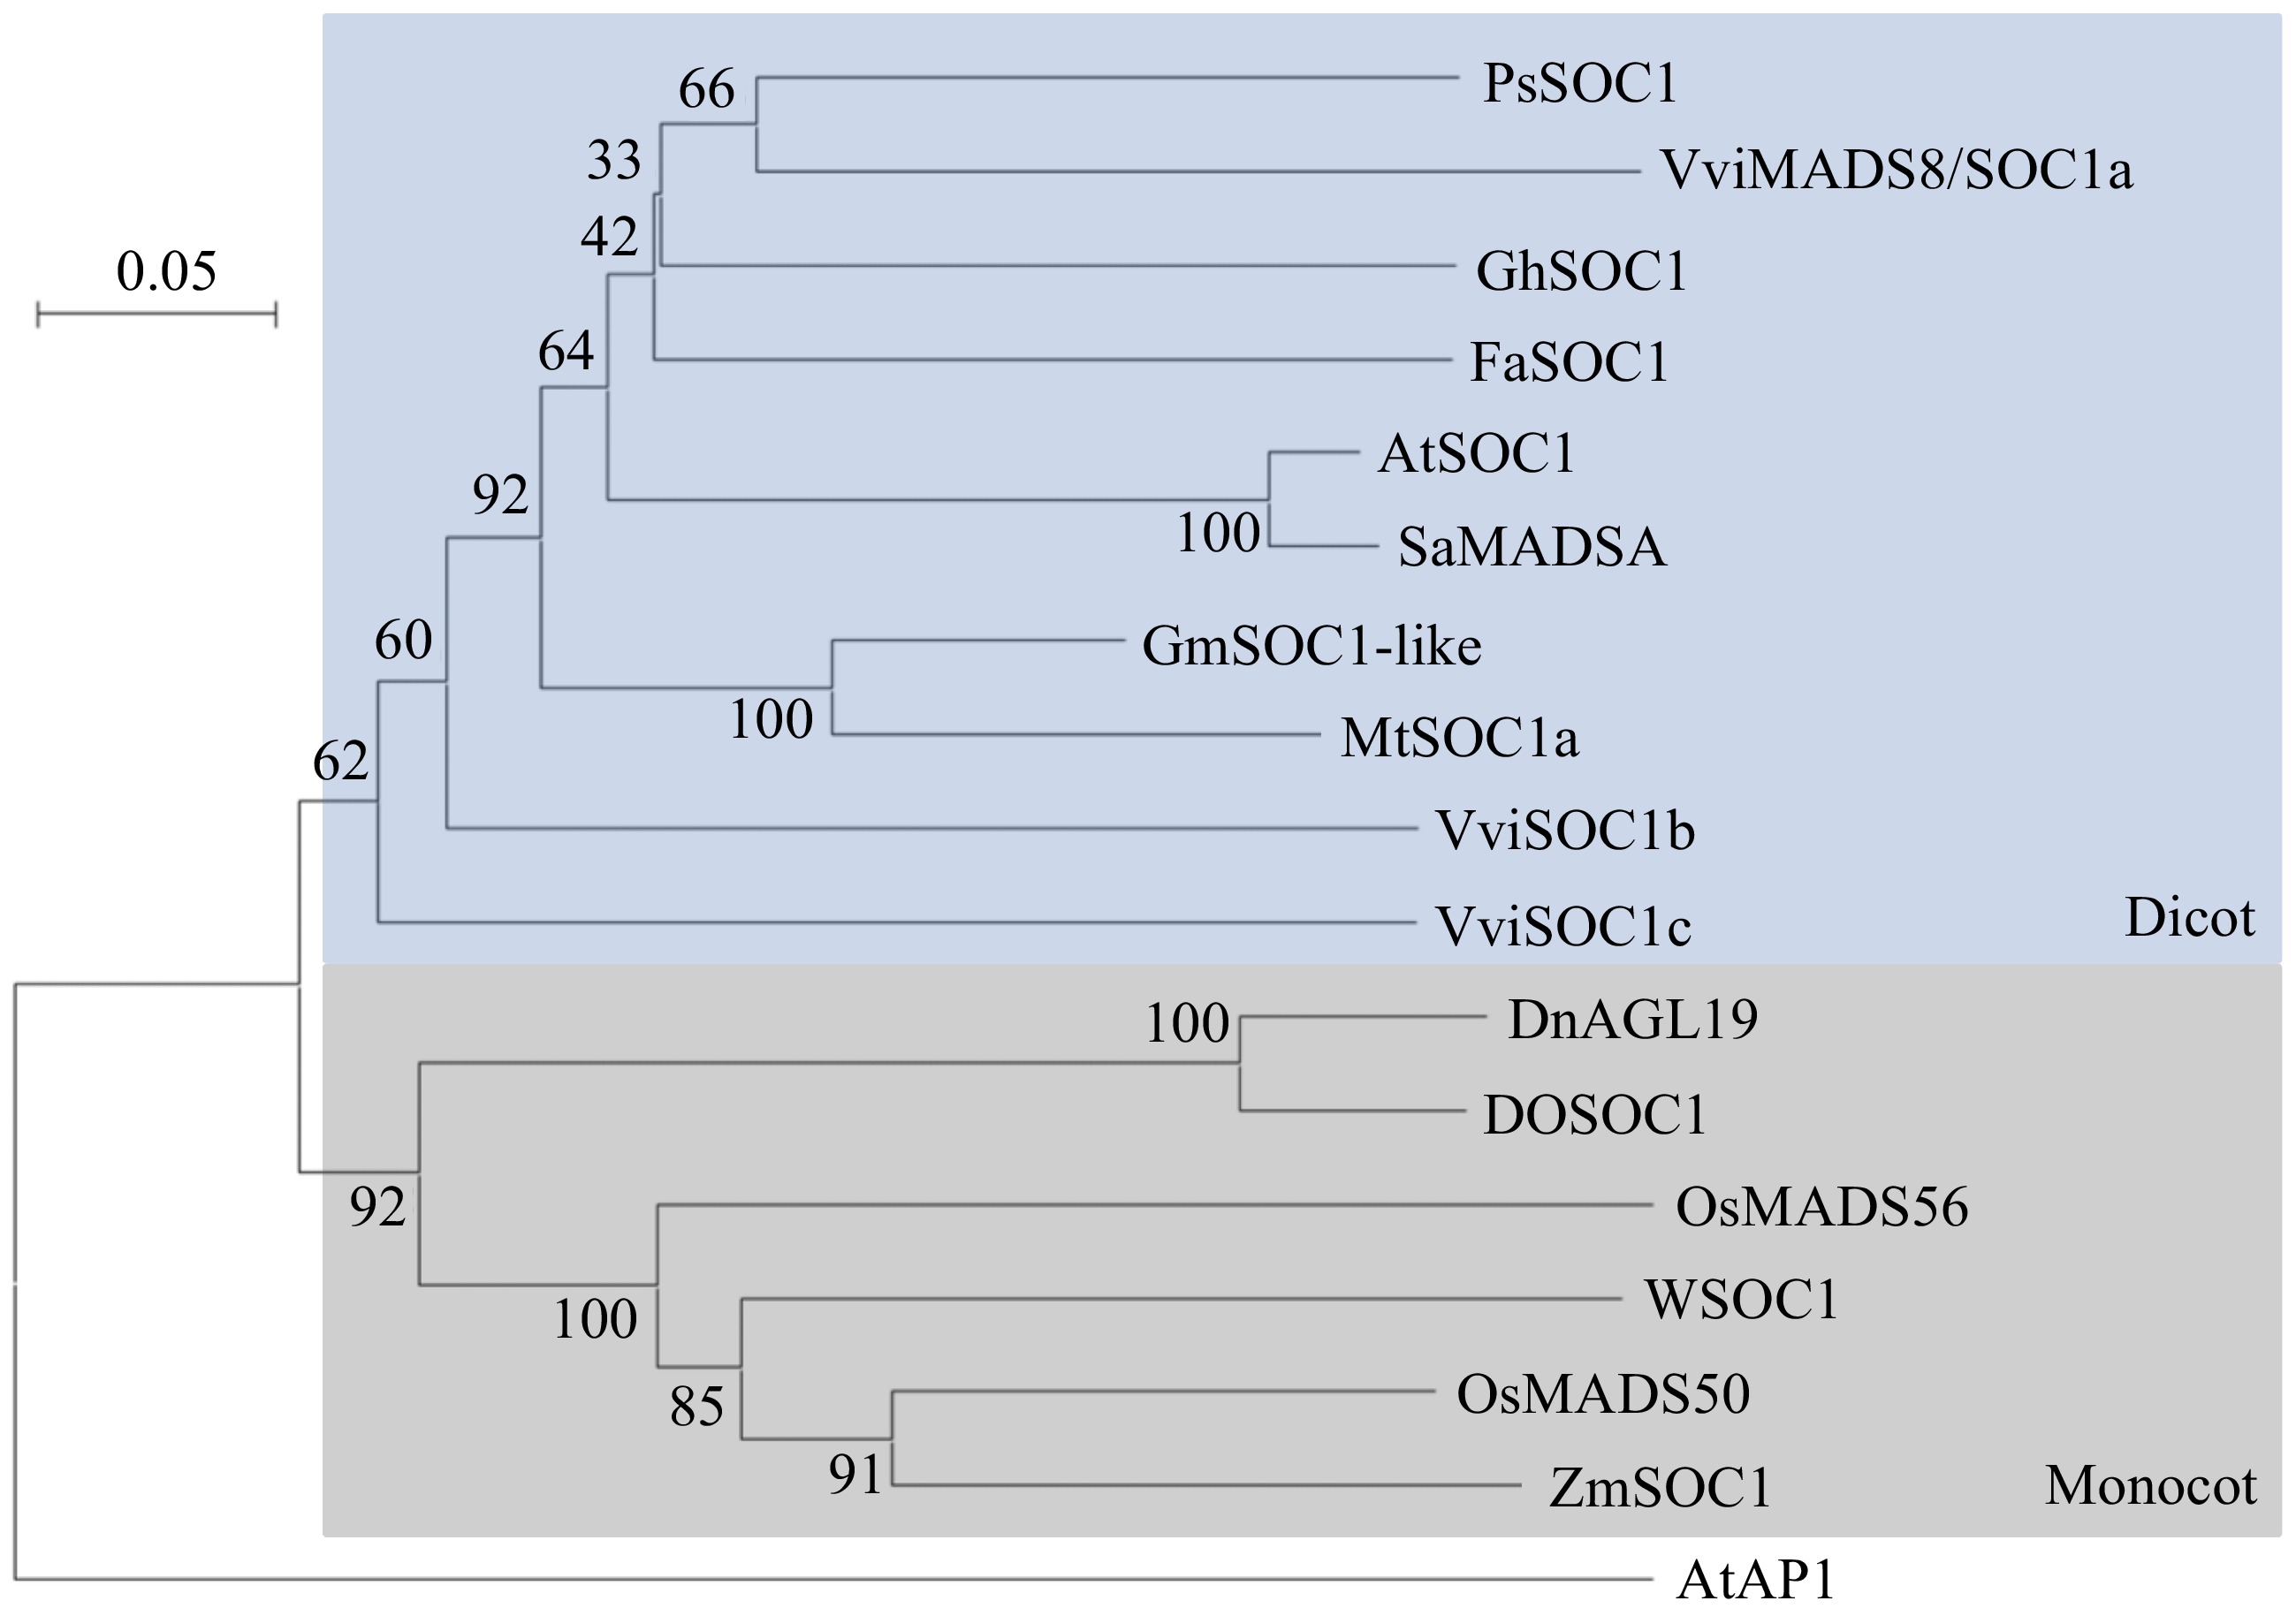
Figure 1.
Phylogenetic analysis of VviMADS8/SOC1a with functionally characterised proteins of the Type II MIKCc MADS-box family SOC1 clade, including SlSISTER OF TOMATO MADS-box gene 3 (SlSTM3, Solyc01g092950), SlTM3 (XP_025887600), PsSOC1 (AHJ60268), GhSOC1 (NP_001314583), FaSOC1 (AFR90178), SaMADSA (U25696), AtSOC1 (NP_182090), GmSOC1-like (NP_001236377), MtSOC1a (XP_003623808), ZmSOC1 (NP_001105152), OsMADS50 (NP_001388955), TaSOC1 (AB281427), OsMADS56 (NP_001390992), DnAGL19 (AMO66151), and DoSOC1 (AGK07583), as well as the closely related VviSOC1b (VIT_16s0022g02400) and VviSOC1c (VIT_02s0025g04650). AtAP1 (NP_177074) was selected as the outgroup. The scale bar represents the number of amino acid differences per site. The tree was generated using the Neighbor-Joining method and p-distance model[22,23]. Numbers at each node indicate bootstrap values calculated from 100 replicates[24]. At, Arabidopsis thaliana; Dn, Dendrobium nobile; Do, Dendrobium orchid; Fa, Fragaria × ananassa; Gh, Gossypium hirsutum; Gm, Glycine max; Mt, Medicago truncatula; Os, Oryza sativa; Ps, Paeonia suffruticosa; Sa, Sinapis alba; Sl, Solanum lycopersicum; Vvi, Vitis vinifera; Ta, Triticum aestivum; Zm, Zea mays.
-
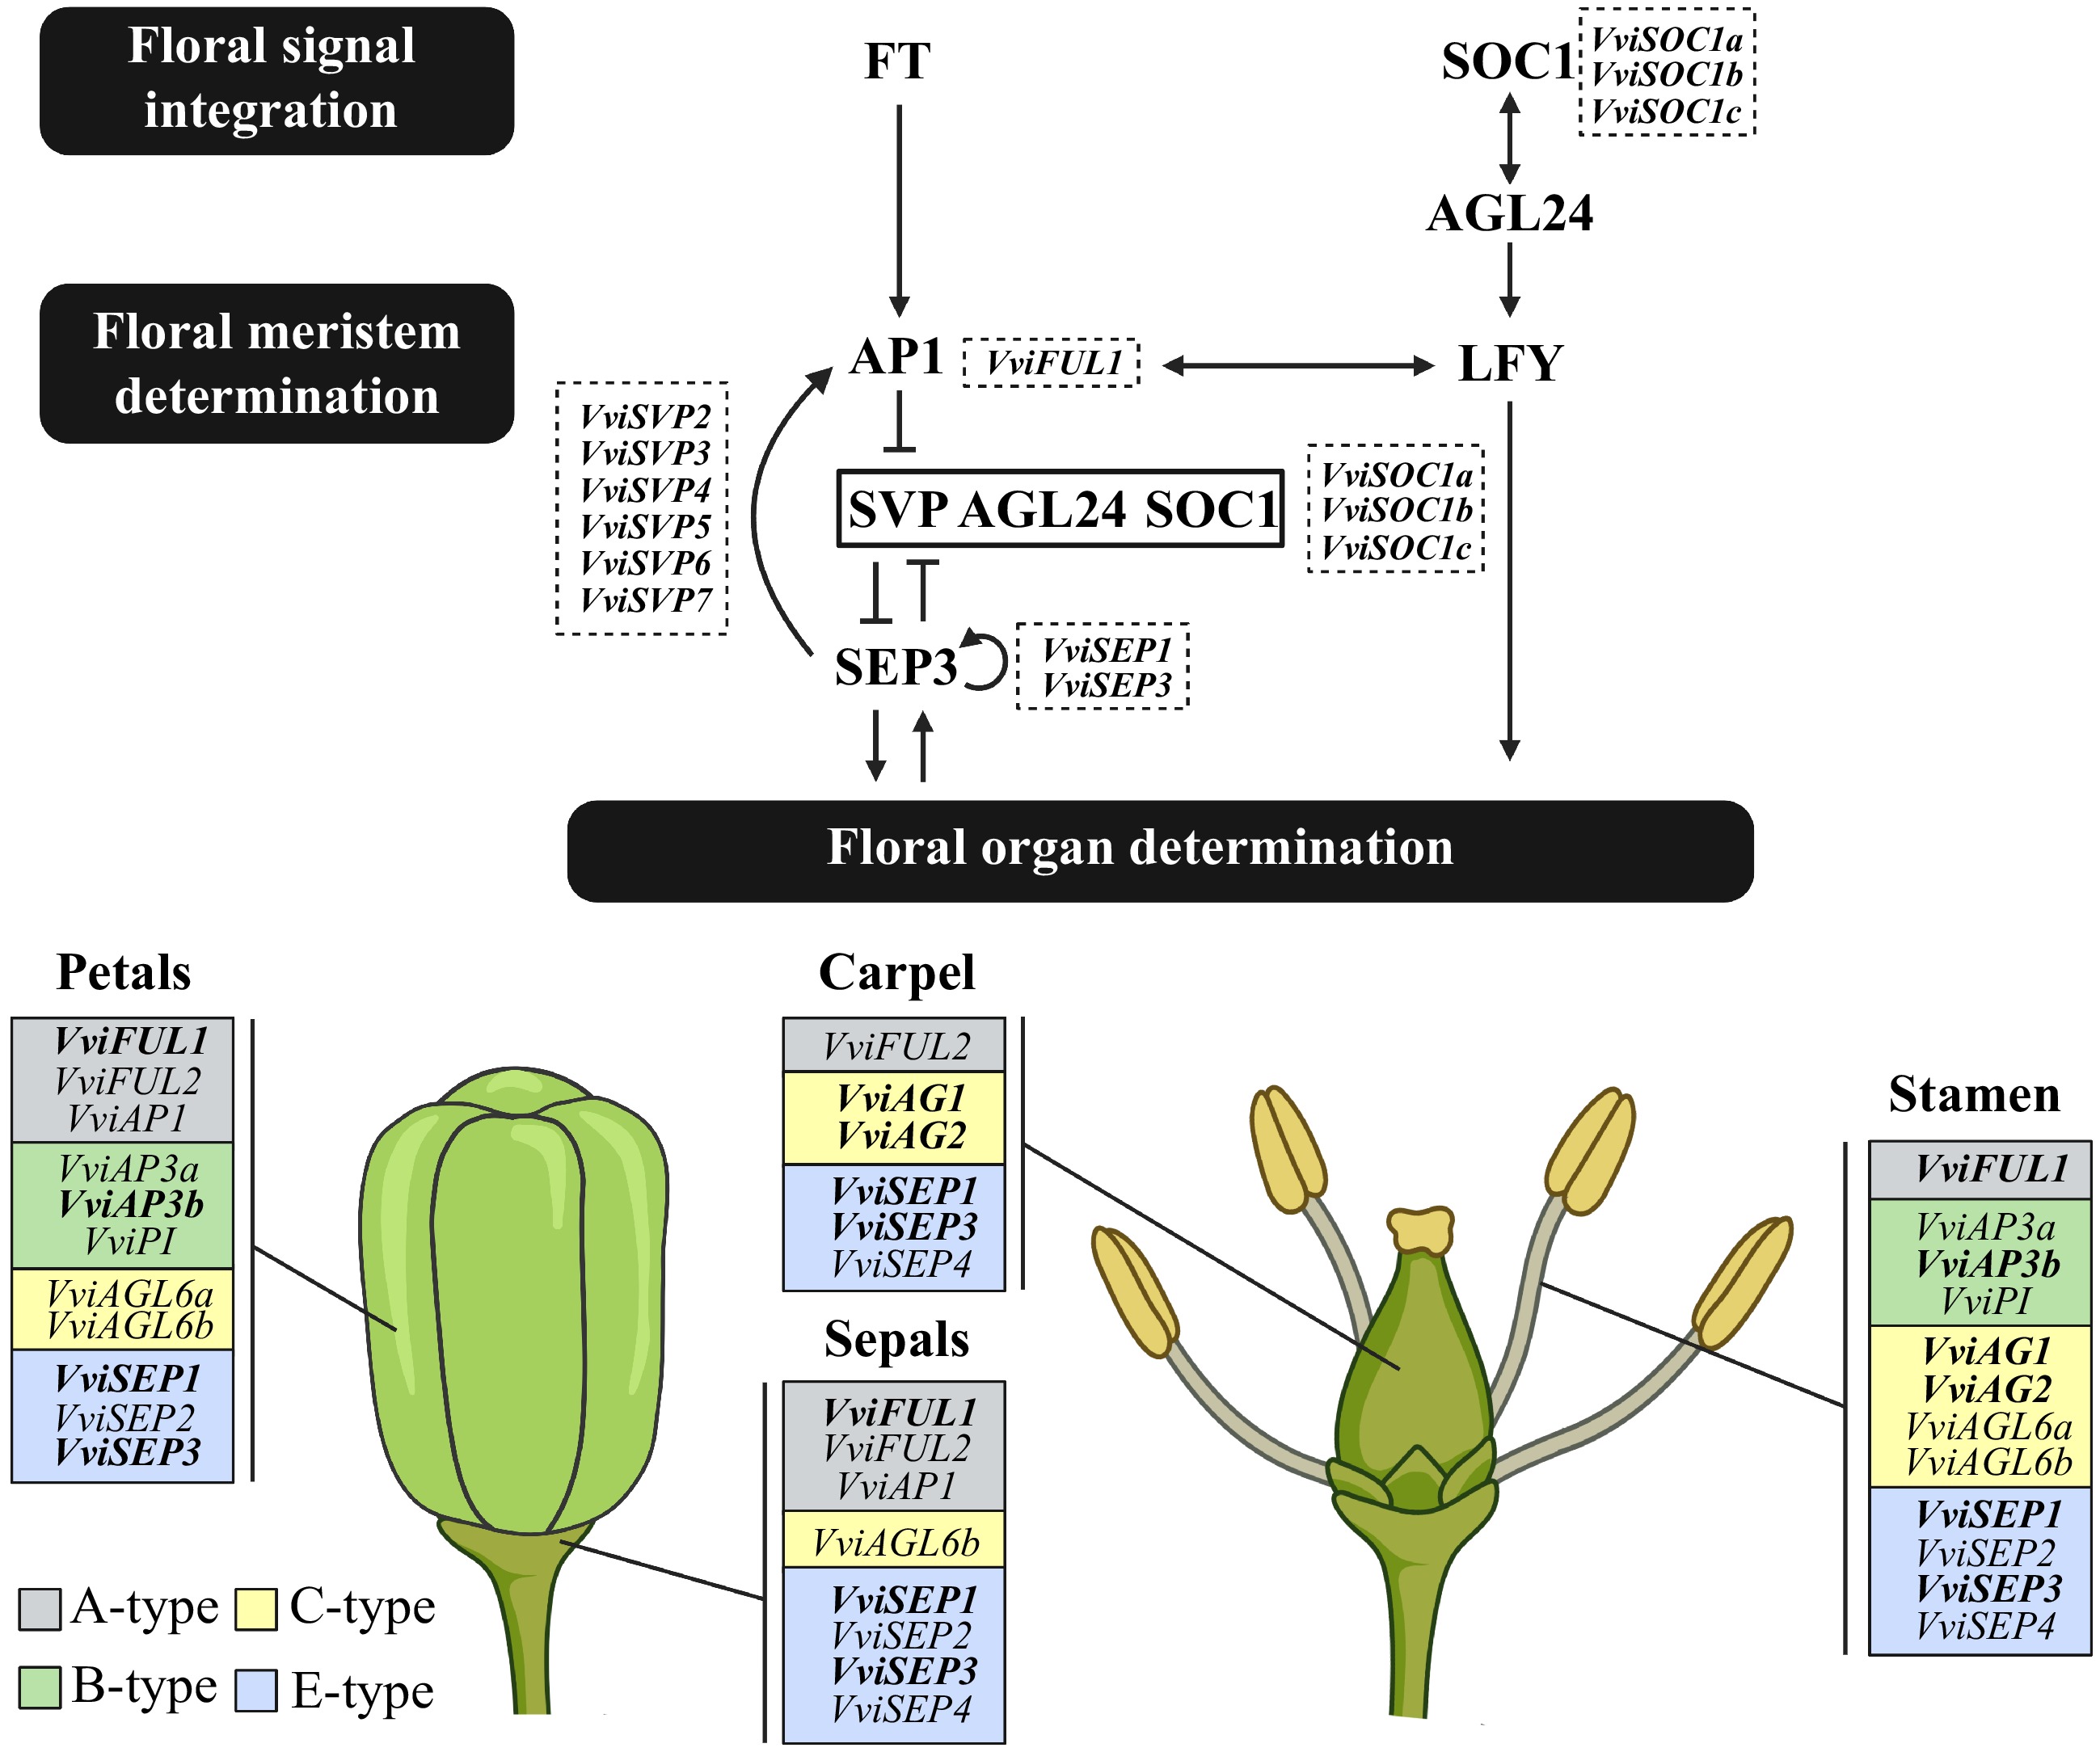
Figure 2.
Schematic diagram highlighting the flowering-related genes (featured in bold) present in the VviSOC1a association network, computed using the Vitis OneGenE method. This general flowering pathway, from floral signal integration to floral organ determination, is adapted from Wagner[37], Lee & Lee[2], and Palumbo et al.[17]. Grapevine homologs of floral signal integration and meristem determination genes are placed in the dotted boxes, while those associated with floral organ determination are categorised as either A-type (grey boxes), B-type (green boxes), C-type (yellow boxes) or E-type (blue boxes), based on the predicted ABCE flower model[15]. Created using
BioRender.com . -
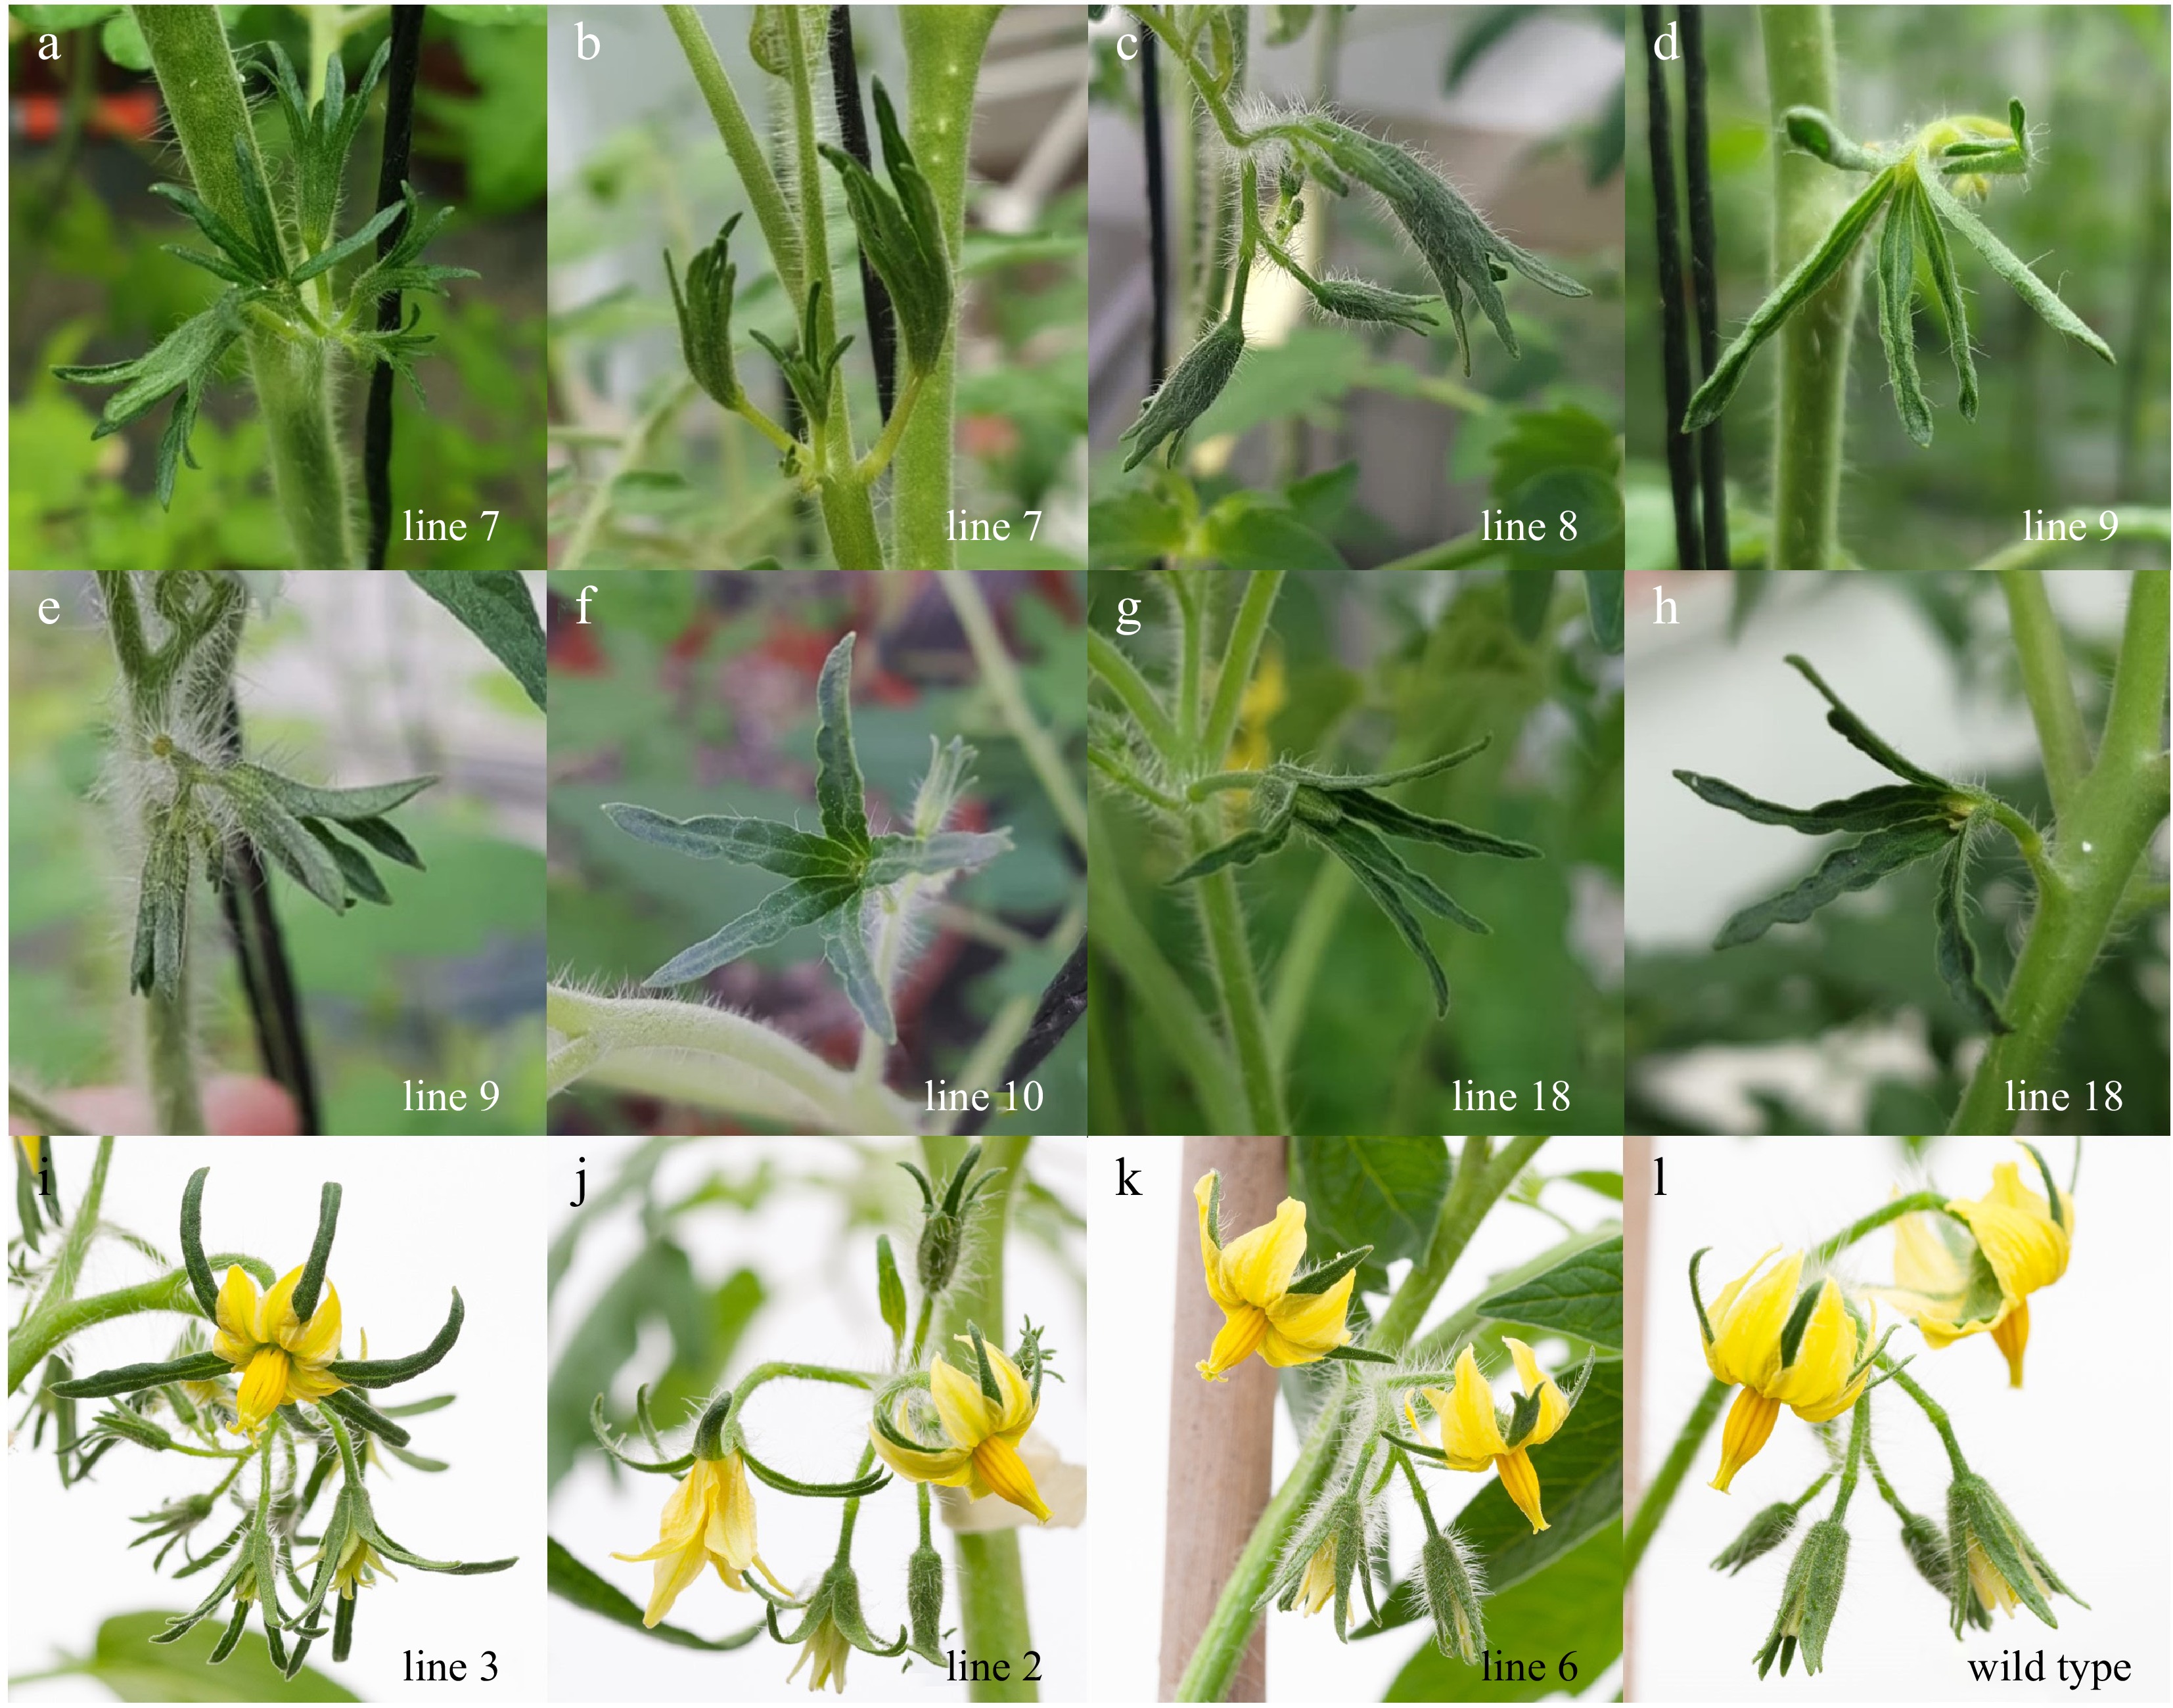
Figure 3.
Whole-flower phenotypes of tomato lines overexpressing VviSOC1a. (a)−(h) Transgenic lines developed leaf-like sepals and displayed severe floral dwarfing phenotypes resulting in plant sterility. Transgenic lines displayed moderate floral phenotypes of (i), (j) sepal extension and curling compared to (k) line 6 and (l) wild type plants.
-
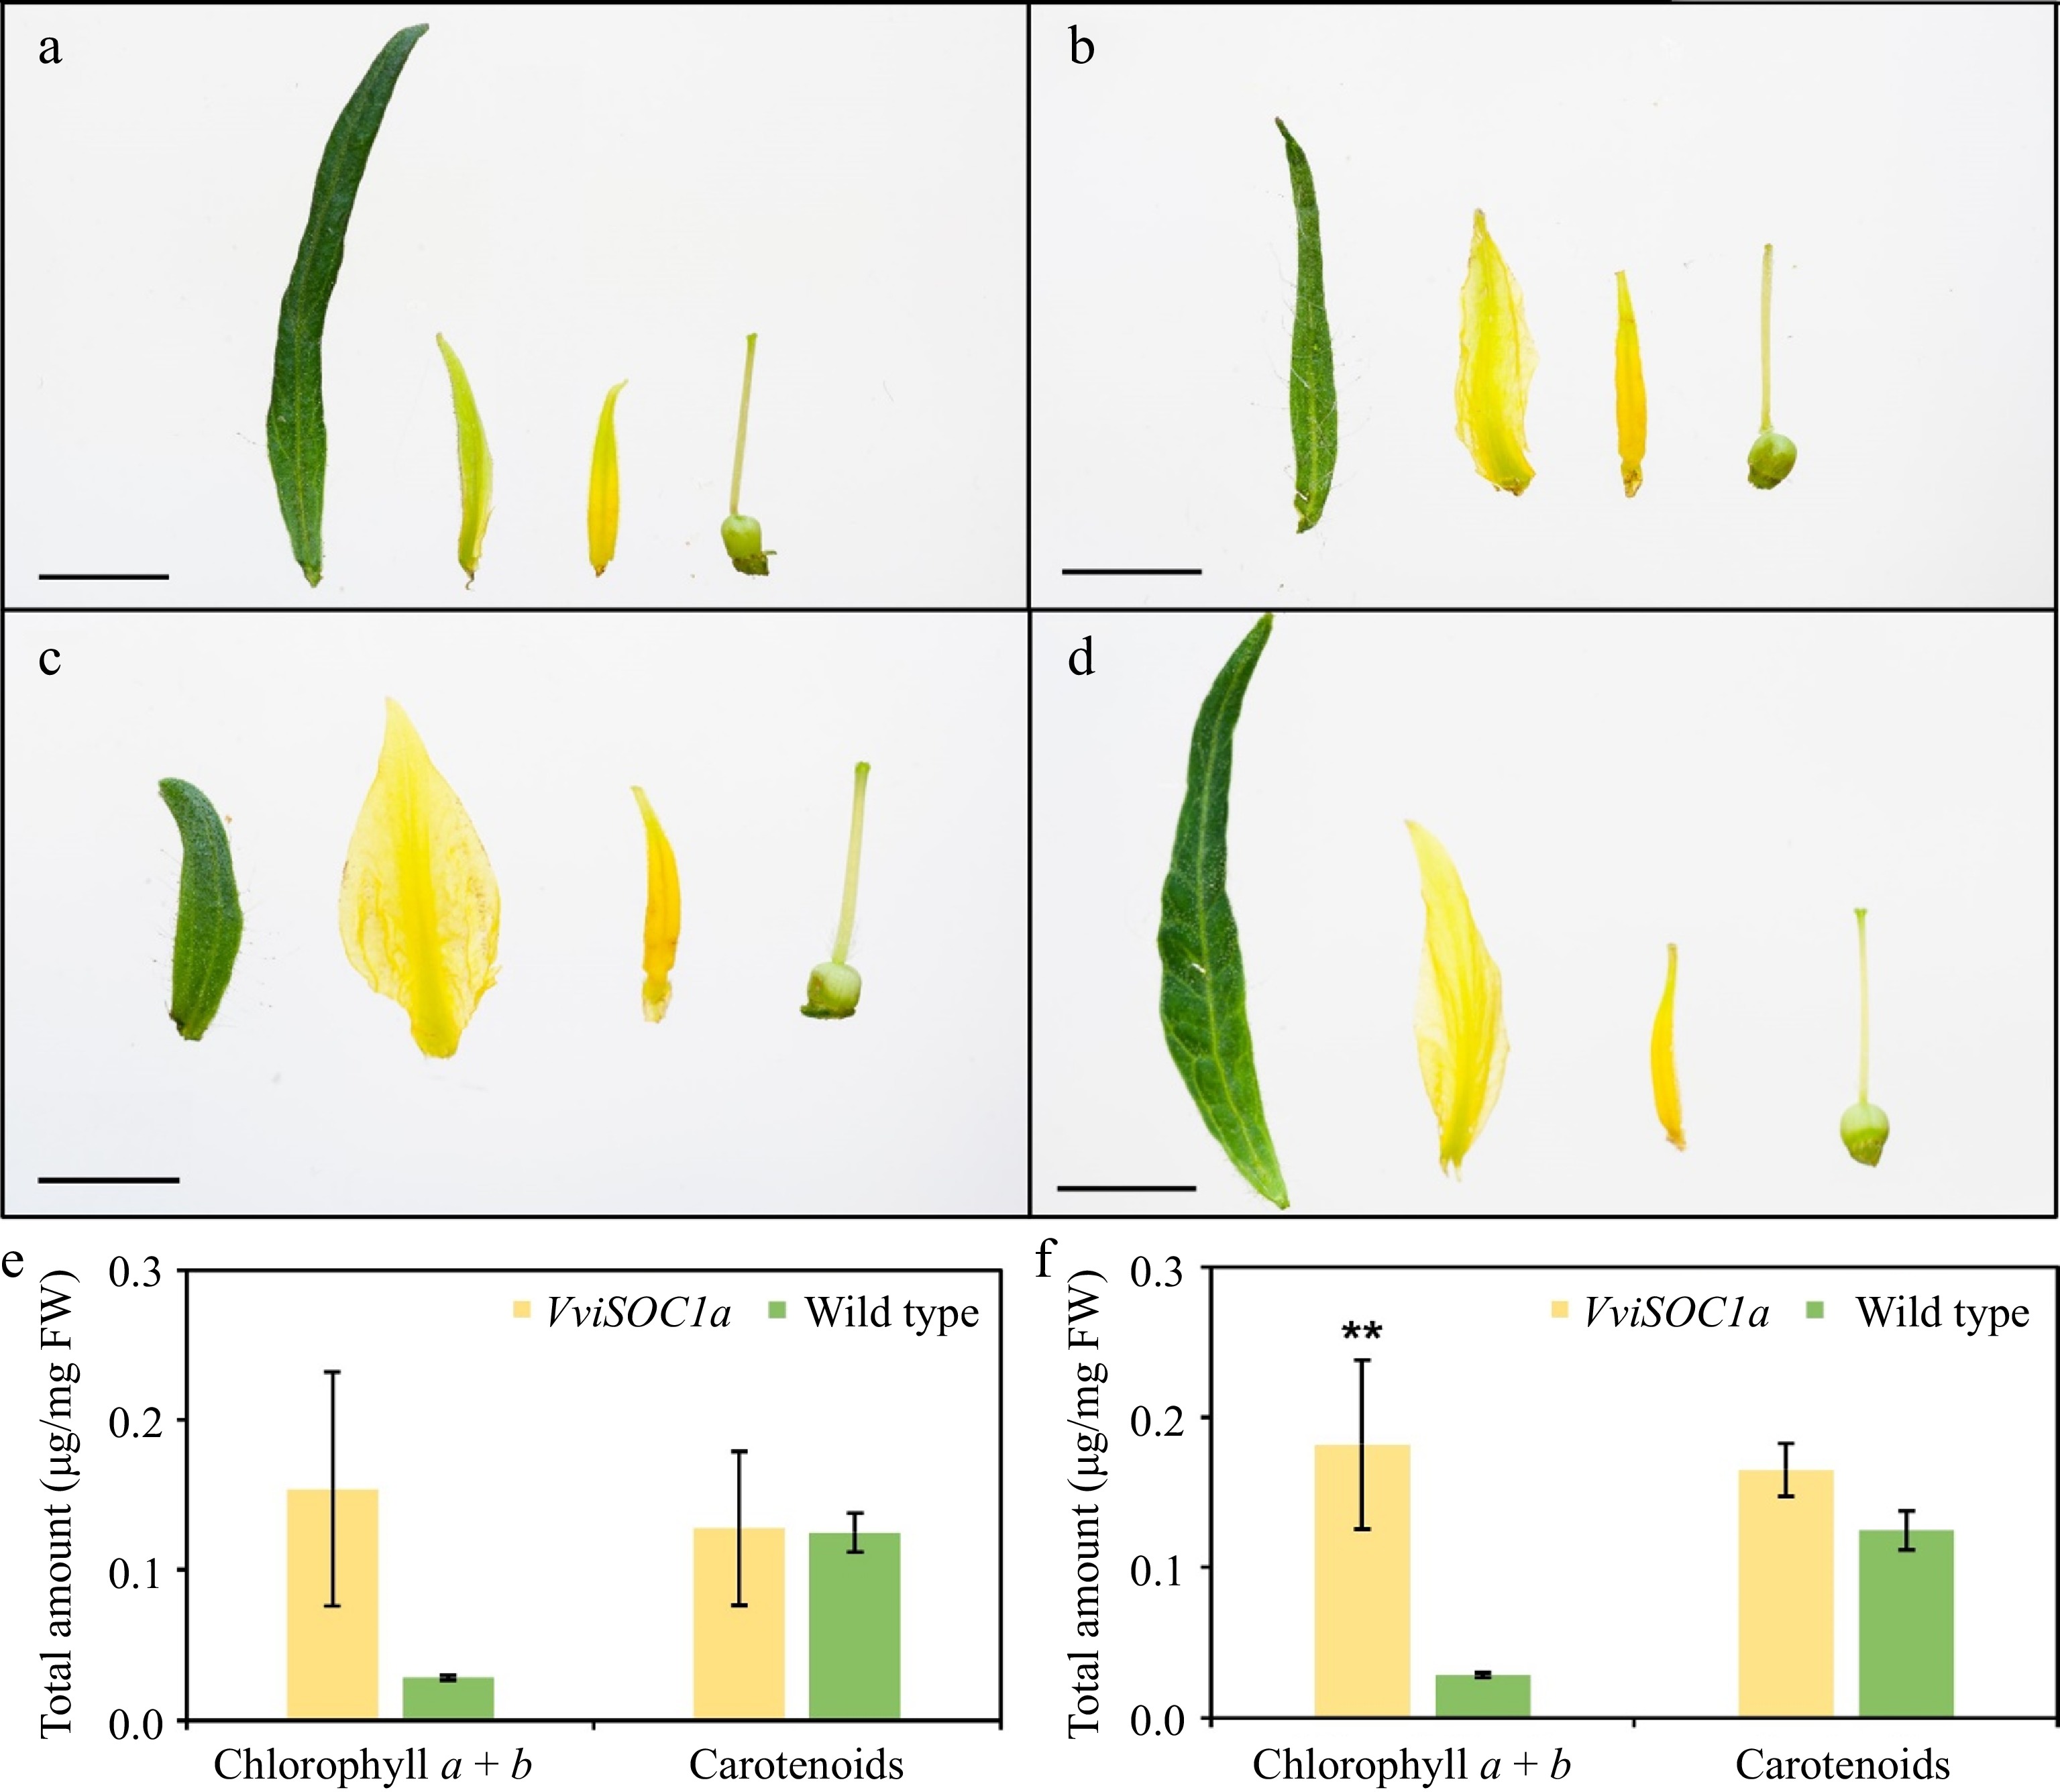
Figure 4.
Floral organ phenotypes of tomato lines overexpressing VviSOC1a. Dissected floral organs (left to right: sepal, petal, stamen, and carpel) of (a) line 3 and (b) line 2 developed greener petals than (c) wild type, as well as (d) longer sepals that resemble the flowers of the rin mutant[30]. Scale bars represent 0.5 cm. Total chlorophyll (a + b) and carotenoid petal content of (e) three independently transformed lines and (f) two high expressing lines. Bars represent the mean and standard error of three biological replicates (n = 3), where (**) indicates moderate (p ≤ 0.05) significant differences compared to wild type.
-
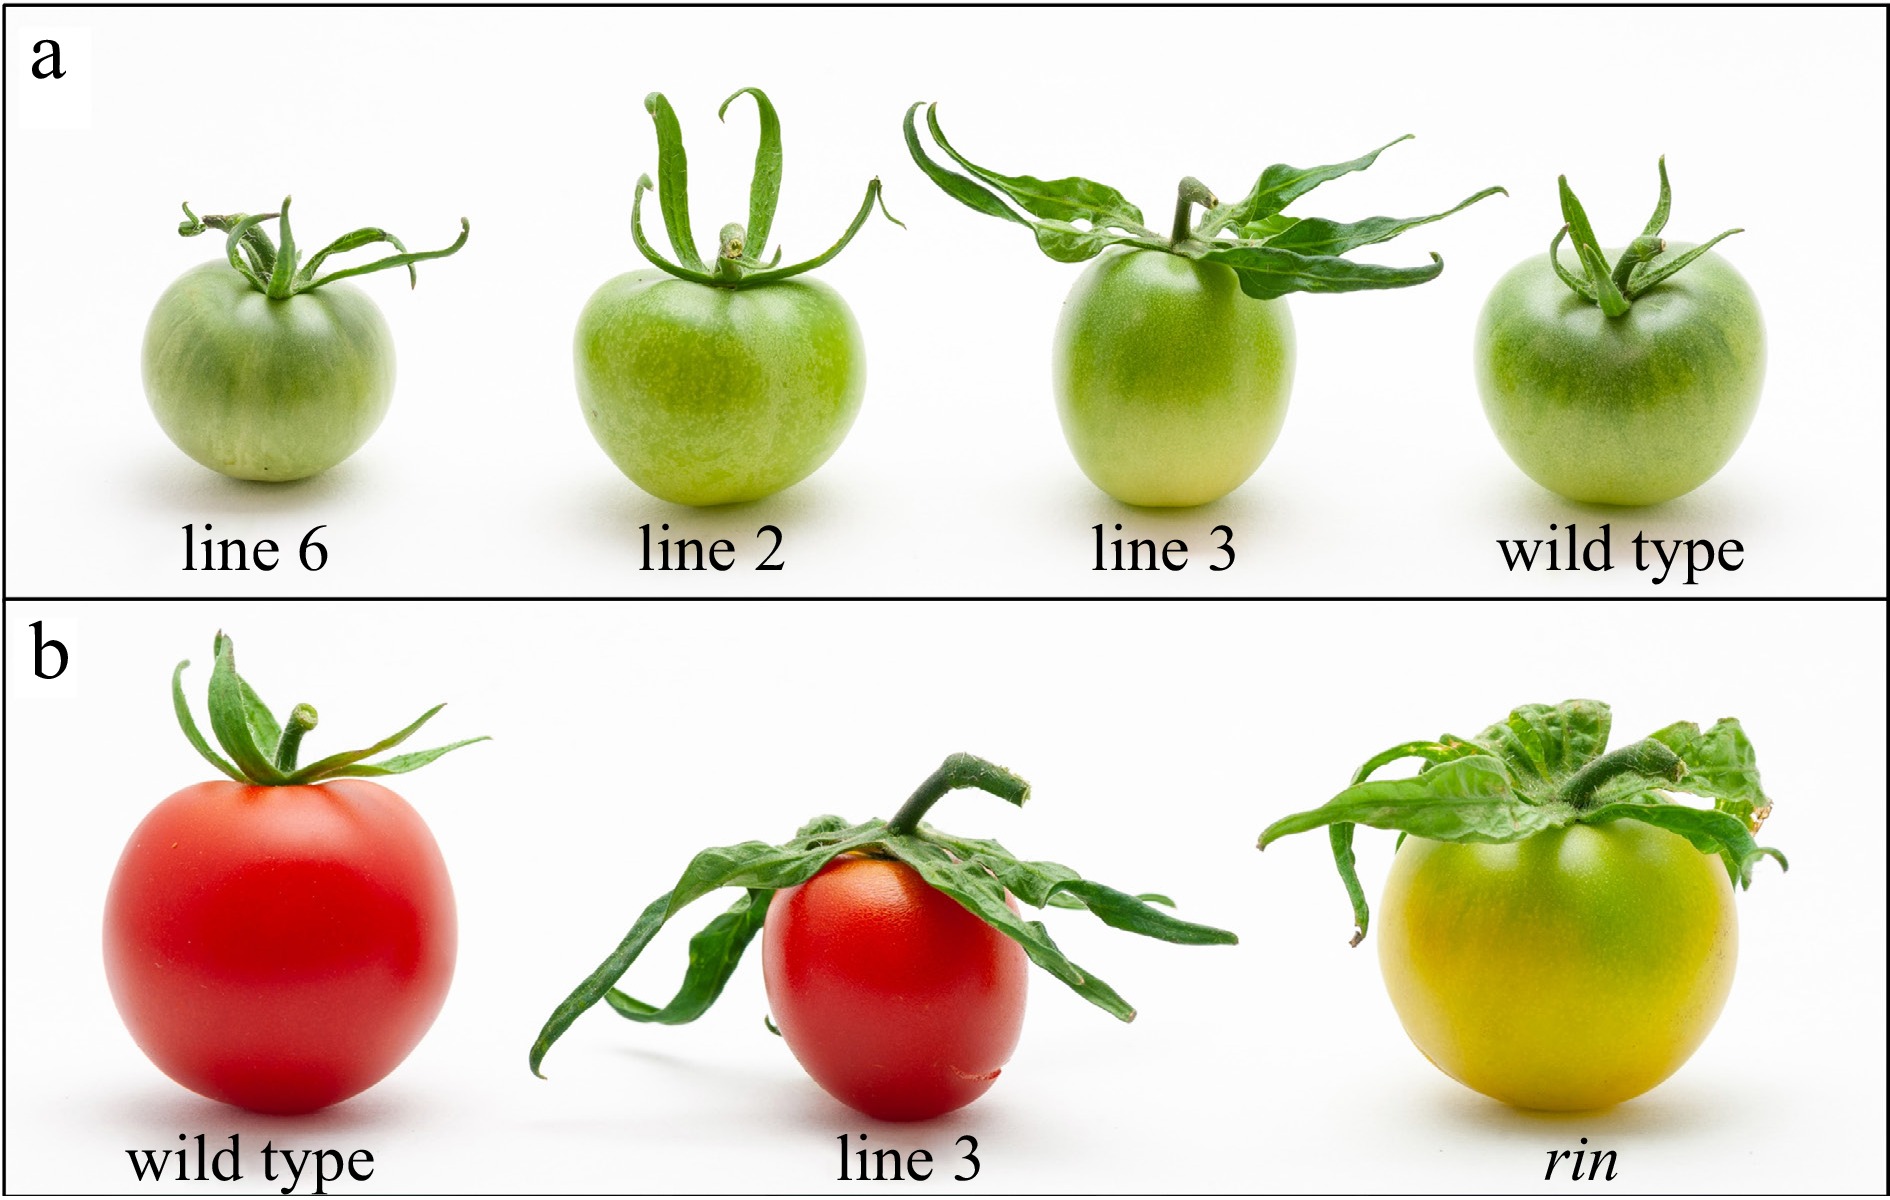
Figure 5.
Fruit sepal phenotypes of tomato lines overexpressing VviSOC1a. Sepal development is displayed at two different fruit developmental stages, including (a) mature green and (b) red ripe. (a) Elongated sepals observed for lines 2 and 3 compared to line 6 and wild type. (b) Comparable sepal extension observed for line 3 and the rin mutant[30] in relation to wild type.
-
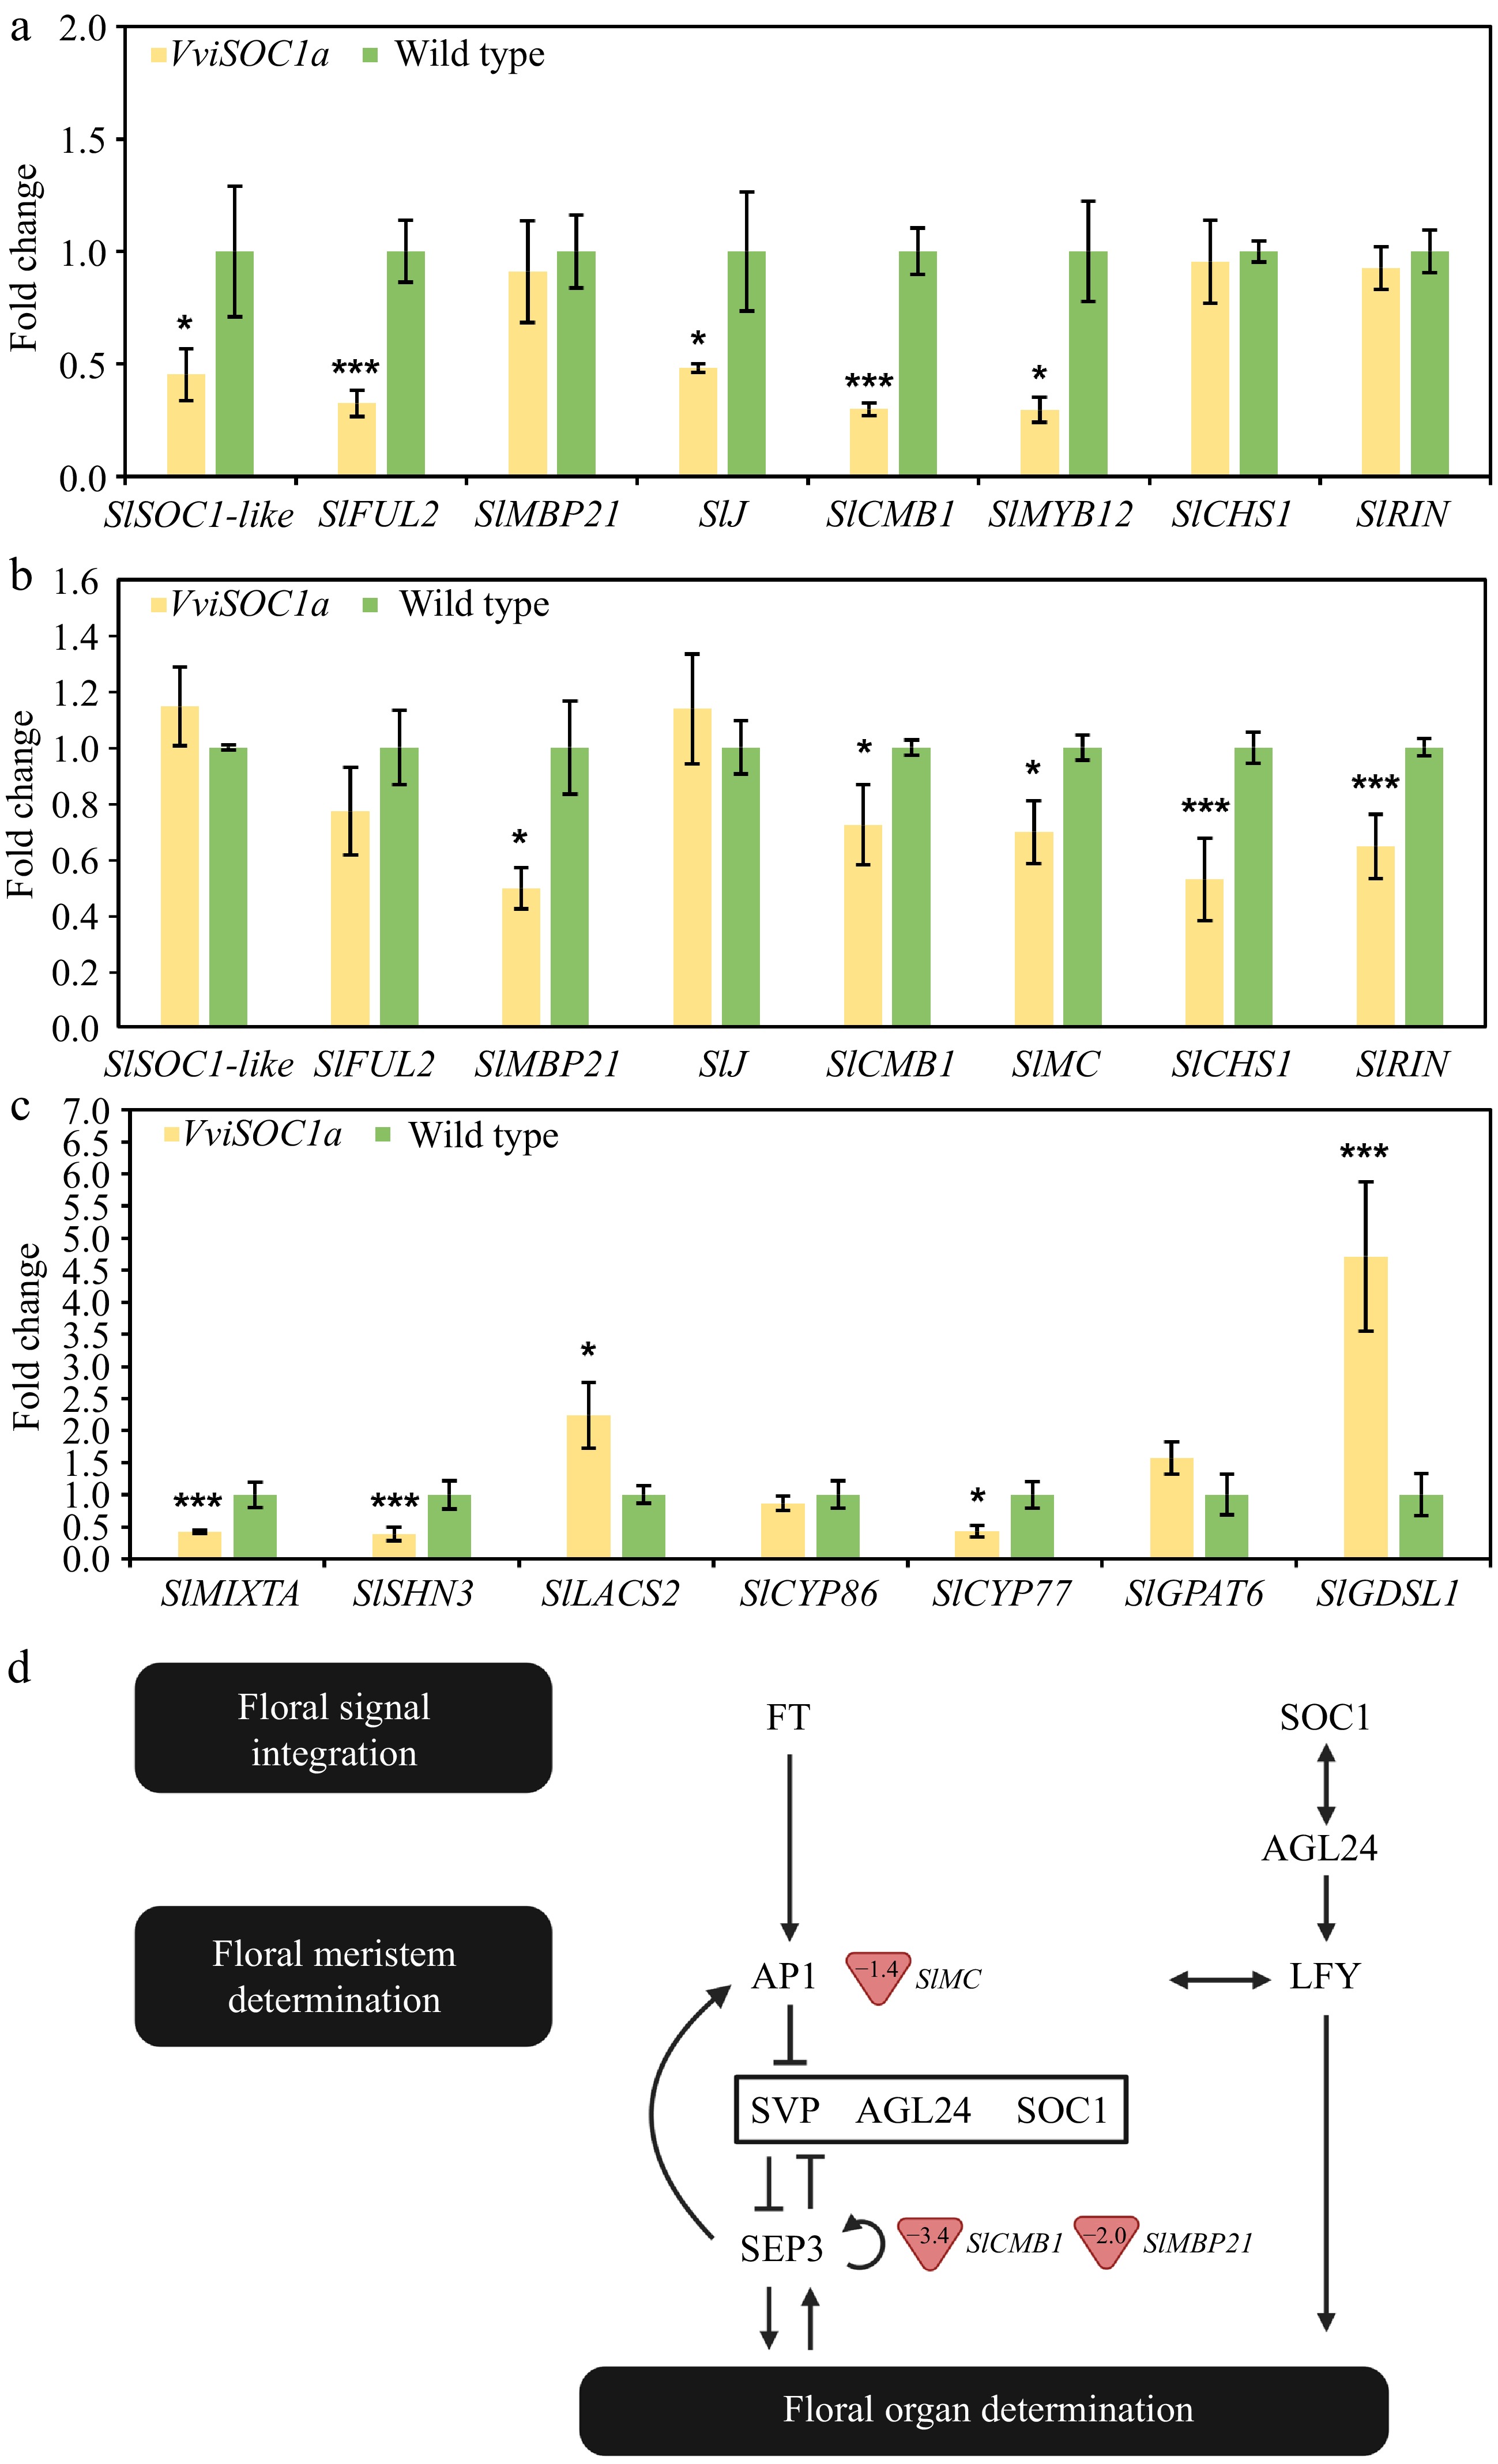
Figure 6.
Expression analysis of putative VviSOC1a downstream target genes in acclimated overexpressing tomato lines using real-time qPCR analysis. Flowering and ripening-related gene expression in (a) young leaves and (b) open-flower sepals. (c) Cuticle-related gene expression in young leaf tissues. Bars represent the mean and standard error of three independently transformed biological replicates (n = 3), where (*) and (***) indicate low (p ≤ 0.1) and high (p ≤ 0.01) significant differences compared to wild type, respectively. (d) Schematic diagram of the general flowering pathway[2,37] showing tomato homologs involved in sepal size regulation with altered expression in the VviSOC1a-OE lines. Values in red triangles represent fold change.
Figures
(6)
Tables
(0)