-
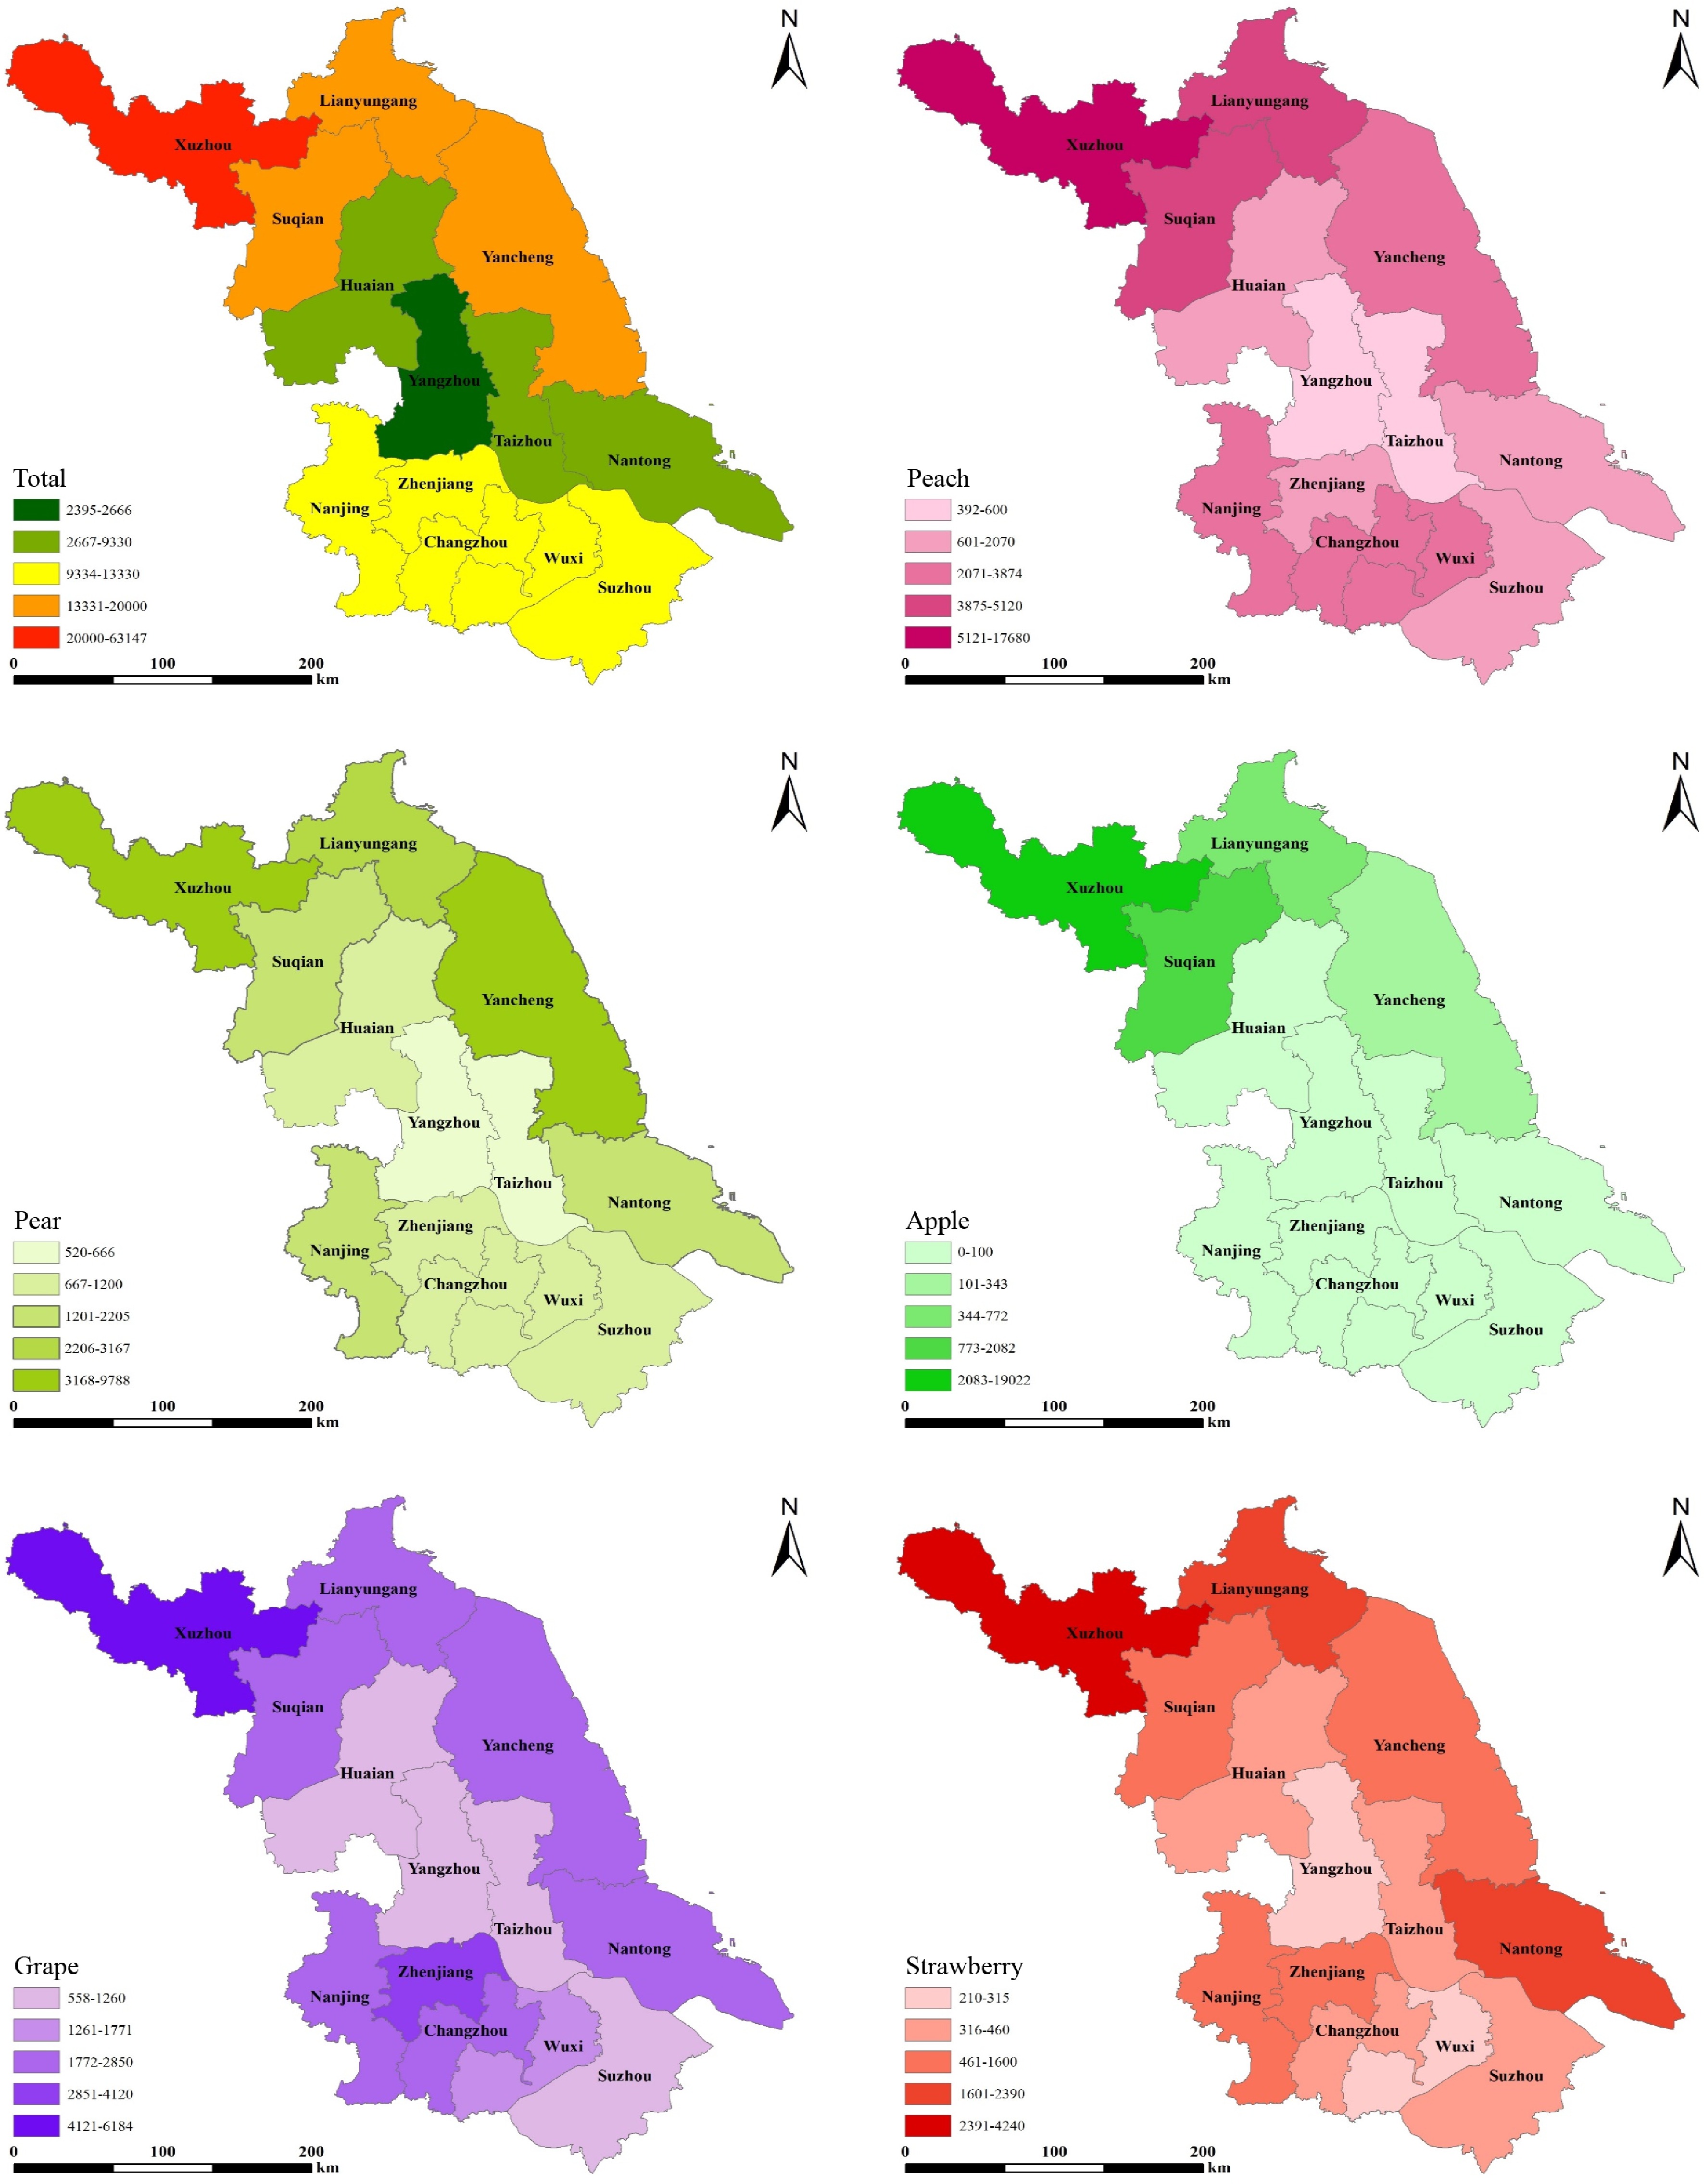
Figure 1.
Distribution of major fruit trees in Jiangsu.
-
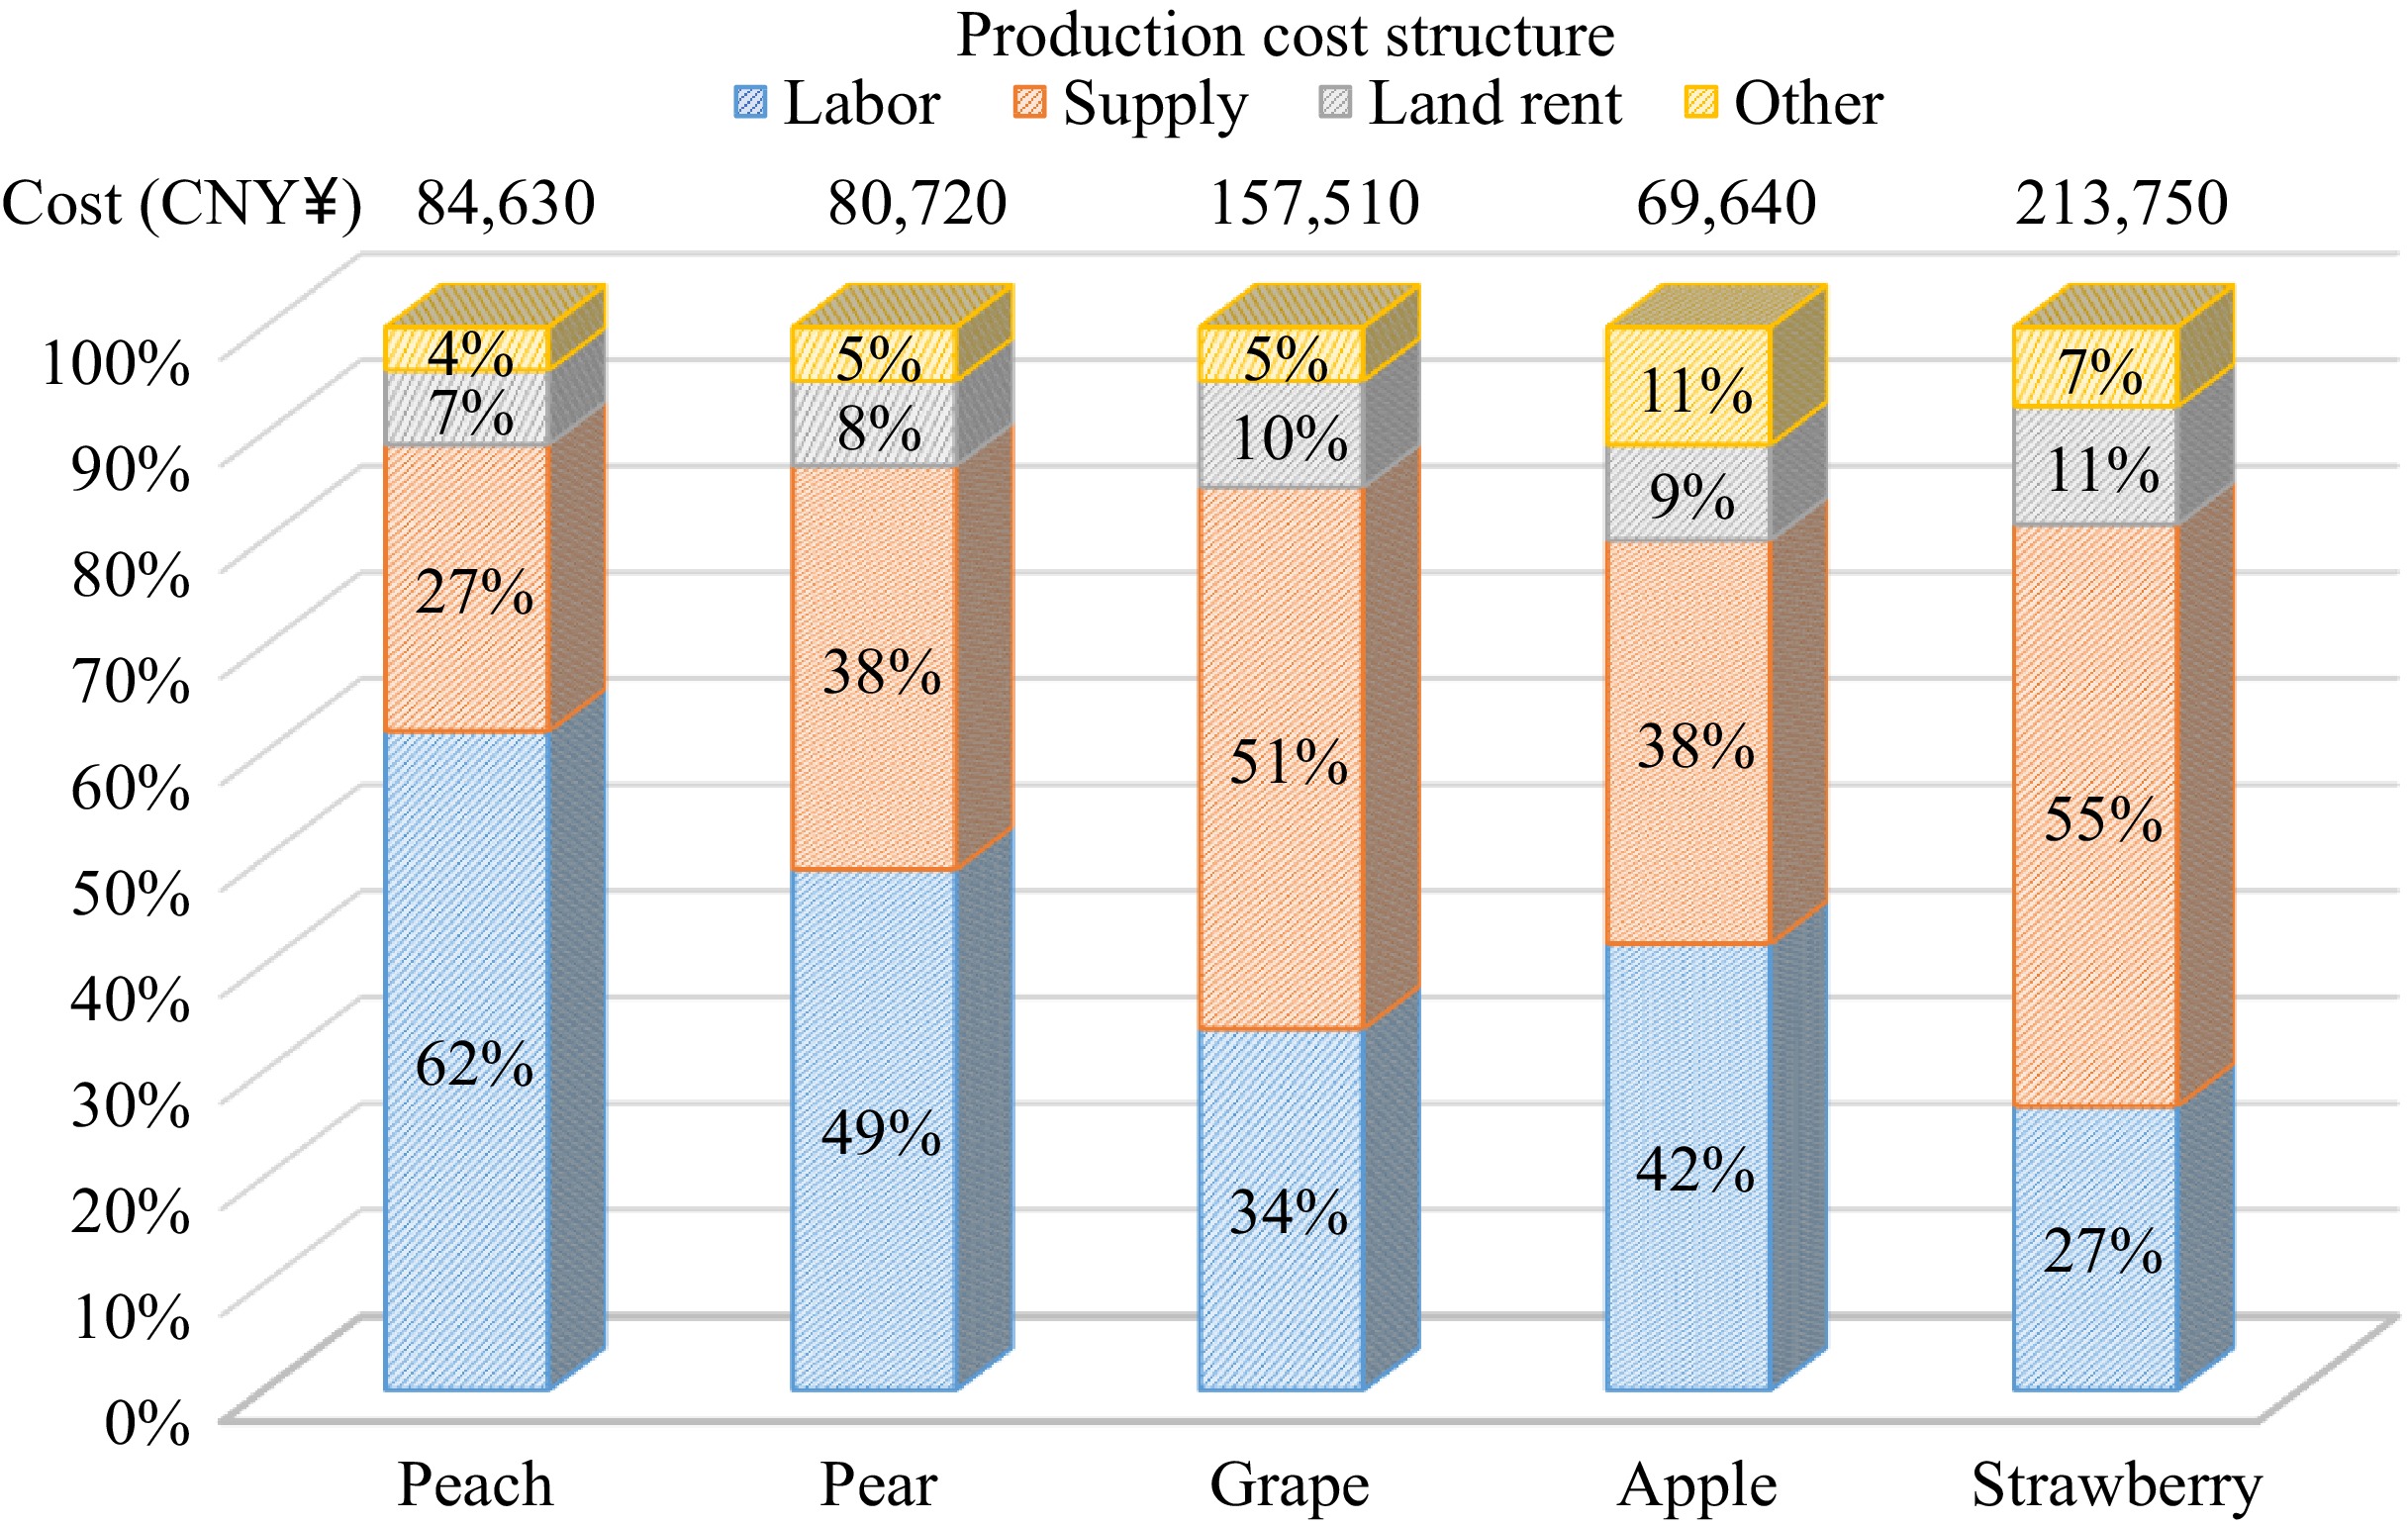
Figure 2.
Orchard production cost structure (per hectare).
-
Tree species Area (hm2) Yield (ton) Main production area Peach 48,492.5 973,660.7 Xuzhou, Suqian, Wuxi,
Zhenjiang, Yancheng, NanjingPear 32,022.1 775,309.2 Xuzhou, Yancheng,
Lianyungang, Nantong,
Nanjing, SuqianGrape 31,163.3 653,021.9 Xuzhou, Zhenjiang,
Changzhou, Lianyungang,
YanchengApple 22,335.1 571,645.8 Xuzhou, Suqian,
LianyungangStrawberry 16,244.6 529,754.2 Nantong, Xuzhou,
Nanjing, Suqian,
Yancheng, ZhenjiangOther 47,198.7 299,187.1 Nanjing, Yangzhou, Suzhou, Changzhou, Wuxi, Nantong Total 197,456.2 3,802,578.9 Table 1.
Primary cultivation areas and production centers of key fruit trees.
-
Type of machinery Price (CNY¥) Area covered (hm2) Application ratio Note Ditching and fertilizing machine 6,000−40,000 3,750 68.6% Small fertilizer tanks, frequent loading, not suitable for mountainous areas Plant protection sprayer 1,600−15,000 1,500 86.9% Wide variation across orchards Grass cutter 3,000−50,000 2,250 90.8% Mainframe suitable for orchard with large row spacing and low application probability Rotary tiller 4,000−20,000 3,450 69.4% Only suitable for larger spacing, destroys shallow roots Trenching machine 3,000−7,000 3,450 72.4% Higher use of new parks and fertilizers Unmanned spraying machine 3,000−10,000 2,250 87.5% Most tree forms are unsuitable Tractor 25,000−50,000 1,500 15.3% Most models are too large Tracked transporter 10,000−35,000 600 90.6% Higher garden requirements Ditching and fertilizing machine 50,000−9,000 750 90.2% Most models are too large Ridge maker 1,500−4,000 7,500 20.3% Mostly used for gardening, mostly not procured Branch and twig grinder 1,000−4,000 4,500 6.2% More applications in peach, pear Water and fertilizer integrated system 20,000−50,000 5,250 30.8% Most orchard are not equipped Table 2.
Application of orchard mechanization.
-
Type Yield per kg/hm2 Price out of the garden (CNY¥/kg) Peach 22,500−67,500 5−24 Pear 45,000−112,500 3−24 Strawberry 37,500−82,500 12−70 Apple 33,000−52,500 3−8 Grape 33,000−52,500 8−24 Loquat 9,000−12,000 24−48 Waxberry 6,000−13,500 16−28 Sweet cherry 18,000−28,500 28−44 Blueberry 15,000−22,500 14−30 Kiwi 12,000−27,000 12−24 Table 3.
Production and price of major fruit trees.
-
Managerial labour (person/hm2) Average wage of employees (¥/day) Agricultural expenditure (¥/hm2) Fertilization 30 Pruning 45 Permanent workers 80−200 Pesticides 15,000−30,000 Pesticide application 30 Weeding 30 Temporary/seasonal workers Men: 100−200; women: 80−120 Fertilizers 37,500−90,000 Thinning fruit 45 Harvesting 45−75 Other 120−300 Irrigation facilities 1,500−3,000 Bagging 45 Other 45 Other 18,000−45,000 Table 4.
Orchard cost expenditures.
Figures
(2)
Tables
(4)