-
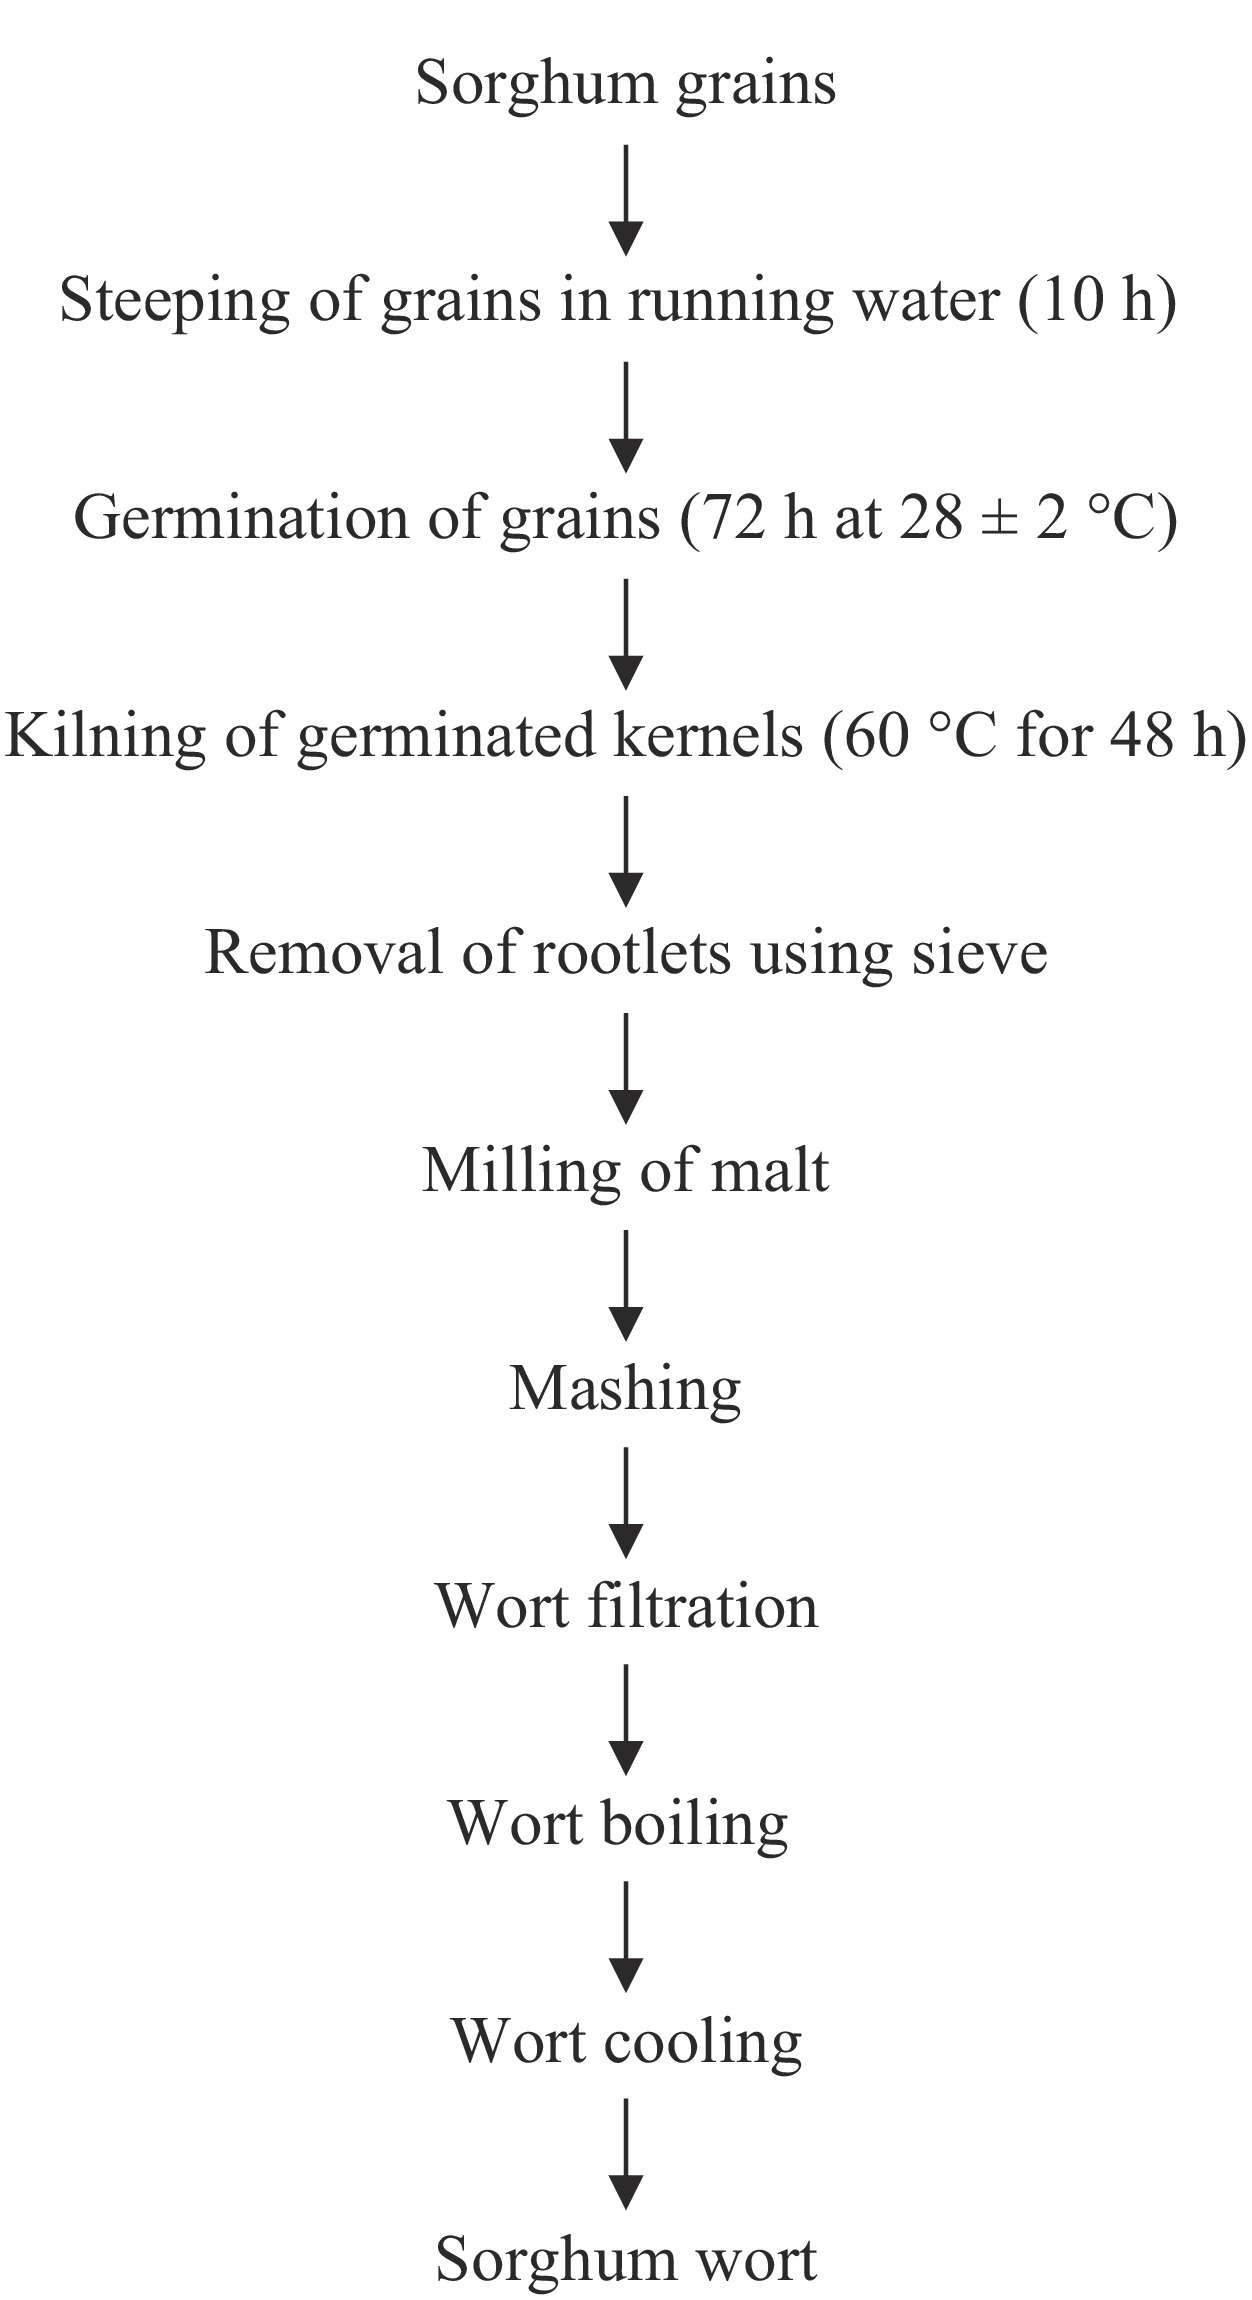
Figure 1.
Production of sorghum wort.
-
Nitrogen content (% w/v) Nitrogen source Fermentation period (h) 0 24 48 72 0.025 Ammonium nitrate 5.20 ± 0.00 4.86 ± 0.01b 4.29 ± 0.01b 3.85 ± 0.01b Ammonium sulfate 5.29 ± 0.00 4.61 ± 0.01a 4.21 ± 0.01a 3.83 ± 0.02b Urea 5.39 ± 0.00 4.90 ± 0.01c 4.38 ± 0.01c 3.86 ± 0.01b Control 5.90 ± 0.00 5.50 ± 0.01d 4.90 ± 0.01d 4.20 ± 0.01a 0.05 Ammonium nitrate 5.28 ± 0.00 4.58 ± 0.01c 3.99 ± 0.01b 3.79 ± 0.01 Ammonium sulfate 5.34 ± 0.00 4.56 ± 0.01c 3.95 ± 0.02c 3.74 ± 0.01 Urea 5.42 ± 0.00 4.67 ± 0.01b 4.02 ± 0.01b 3.85 ± 0.01 Control 5.90 ± 0.00 5.50 ± 0.01a 4.90 ± 0.00a 4.20 ± 0.01 Values are expressed as mean ± standard deviation of triplicates. Note: All similar lower case letters within a column show means that are not significantly different (p > 0.05). Table 1.
Effect of different nitrogen sources on pH of wort during fermentation by S. cerevisiae.
-
Nitrogen content (% w/v) Nitrogen source Fermentation period (h) 0 24 48 72 0.025 Ammonium nitrate 15.80 ± 0.00 12.73 ± 0.01b 9.10 ± 0.02b 6.57 ± 0.01b Ammonium sulfate 15.80 ± 0.00 11.50 ± 0.12d 8.40 ± 0.06d 6.10 ± 0.23b Urea 15.80 ± 0.00 12.00 ± 0.12c 10.77 ± 0.02c 6.40 ± 0.23b Control 15.80 ± 0.00 13.20 ± 0.06a 11.80 ± 0.01a 8.80 ± 0.06a 0.05 Ammonium nitrate 15.80 ± 0.00 11.90 ± 0.02b 8.73 ± 0.01b 5.77 ± 0.04b Ammonium sulfate 15.80 ± 0.00 10.60 ± 0.02c 7.50 ± 0.06c 4.93 ± 0.02b Urea 15.80 ± 0.00 11.53 ± 0.22b 8.30 ± 0.06b 5.20 ± 0.06b Control 15.80 ± 0.00 13.20 ± 0.01a 11.80 ± 0.06a 8.77 ± 0.04a Values are expressed as mean ± standard deviation of triplicates. Note: All similar lower case letters within a column show means that are not significantly different (p > 0.05). Table 2.
Effect of different nitrogen sources on total soluble sugar ( °Brix) of wort during Fermentation by S. cerevisiae.
-
Nitrogen content (% w/v) Nitrogen source Fermentation period (h) 0 24 48 72 0.025 Ammonium nitrate 1.07 ± 0.00 1.05 ± 0.00b 1.04 ± 0.00b 1.02 ± 0.00c Ammonium sulfate 1.07 ± 0.00 1.05 ± 0.00b 1.03 ± 0.00c 1.02 ± 0.00c Urea 1.07 ± 0.00 1.05 ± 0.00b 1.04 ± 0.00b 1.03 ± 0.00b Control 1.07 ± 0.00 1.06 ± 0.00a 1.05 ± 0.00a 1.04 ± 0.00a 0.05 Ammonium nitrate 1.07 ± 0.00 1.05 ± 0.00b 1.03 ± 0.00c 1.02 ± 0.00c Ammonium sulfate 1.07 ± 0.00 1.04 ± 0.00c 1.03 ± 0.00c 1.02 ± 0.00c Urea 1.07 ± 0.00 1.05 ± 0.00b 1.04 ± 0.00b 1.03 ± 0.00b Control 1.07 ± 0.00 1.06 ± 0.00a 1.05 ± 0.00a 1.04 ± 0.00a Values are expressed as mean ± standard deviation of triplicates. Note: All similar lower case letters within a column show means that are not significantly different (p > 0.05). Table 3.
Effect of different nitrogen sources on specific gravity of wort during fermentation by S. cerevisiae.
-
Nitrogen content (% w/v) Nitrogen source Fermentation period (h) 0 24 48 72 0.025 Ammonium nitrate 1.45 ± 0.01b 2.27 ± 0.01c 2.83 ± 0.02b 3.26 ± 0.01a Ammonium sulfate 1.40 ± 0.00c 2.39 ± 0.01b 2.93 ± 0.02b 3.34 ± 0.02a Urea 1.36 ± 0.00d 2.22 ± 0.01d 2.68 ± 0.01c 3.17 ± 0.02b Control 1.58 ± 0.00a 2.50 ± 0.01a 3.04 ± 0.02a 3.05 ± 0.03b 0.05 Ammonium nitrate 1.20 ± 0.00d 2.51 ± 0.01b 3.25 ± 0.03a 3.57 ± 0.01a Ammonium sulfate 1.38 ± 0.01b 2.55 ± 0.01a 3.35 ± 0.03a 3.65 ± 0.03a Urea 1.34 ± 0.01c 2.42 ± 0.01c 2.97 ± 0.04b 3.17 ± 0.07b Control 1.58 ± 0.00a 2.52 ± 0.01b 3.00 ± 0.06b 3.03 ± 0.04c Values are expressed as mean ± standard deviation of triplicates. Note: All similar lower case letters within a column show means that are not significantly different (p > 0.05). Table 4.
Effect of different nitrogen sources on titratable acidity (%) of wort during fermentation by S. cerevisiae.
-
Nitrogen content (% w/v) Nitrogen source Fermentation period (h) 0 24 48 72 0.025 Ammonium nitrate 0.00 ± 0.00 2.77 ± 0.01a 3.01 ± 0.01b 3.91 ± 0.00b Ammonium sulfate 0.00 ± 0.00 2.89 ± 0.01a 3.25 ± 0.03a 4.25 ± 0.03a Urea 0.00 ± 0.00 2.73 ± 0.02b 3.10 ± 0.06c 3.77 ± 0.15c Control 0.00 ± 0.00 2.48 ± 0.01c 2.82 ± 0.02d 3.43 ± 0.08d 0.05 Ammonium nitrate 0.00 ± 0.00 2.89 ± 0.01b 3.24 ± 0.02c 4.21 ± 0.01b Ammonium sulfate 0.00 ± 0.00 3.05 ± 0.03a 3.55 ± 0.03a 4.47 ± 0.02a Urea 0.00 ± 0.00 2.93 ± 0.02b 3.35 ± 0.03b 4.05 ± 0.13c Control 0.00 ± 0.00 2.55 ± 0.03c 3.15 ± 0.03c 3.59 ± 0.05c Values are expressed as mean ± standard deviation of triplicates. Note: All similar lower case letters within a column show means that are not significantly different (p > 0.05). Table 5.
Effect of different nitrogen sources on alcohol content (%) of wort during fermentation by S. cerevisiae.
-
pH Fermentation period (h) 0 24 48 72 4.00 4.00 ± 0.00 3.97 ± 0.01c 3.90 ± 0.01b 3.51 ± 0.01b 4.50 4.50 ± 0.00 4.24 ± 0.02b 3.87 ± 0.01c 3.51 ± 0.01b 5.00 5.00 ± 0.00 3.97 ± 0.01c 3.67 ± 0.02e 3.43 ± 0.01c 5.50 5.50 ± 0.00 3.75 ± 0.01c 3.56 ± 0.01f 3.38 ± 0.01a 6.00 6.00 ± 0.00 4.06 ± 0.04b 3.74 ± 0.01d 3.46 ± 0.01c 6.50 6.50 ± 0.00 5.37 ± 0.01a 3.92 ± 0.01a 3.76 ± 0.03a Values are expressed as mean ± standard deviation of triplicates. Note: All similar lower case letters within a column show means that are not significantly different (p > 0.05). Table 6.
Effect of varied initial pH on pH of wort during fermentation by S. cerevisiae.
-
pH Fermentation period (h) 0 24 48 72 4.00 15.80 ± 0.00 13.57 ± 0.09a 9.70 ± 0.12b 7.83 ± 0.07b 4.50 15.80 ± 0.00 12.60 ± 0.12b 8.30 ± 0.06c 7.57 ± 0.03b 5.00 15.80 ± 0.00 11.15 ± 0.29c 7.90 ± 0.06d 6.30 ± 0.06c 5.50 15.80 ± 0.00 10.33 ± 0.09d 6.80 ± 0.06e 4.33 ± 0.09d 6.00 15.80 ± 0.00 11.43 ± 0.09c 8.08 ± 0.02c 7.03 ± 0.02b 6.50 15.80 ± 0.00 13.90 ± 0.06a 11.05 ± 0.03a 8.90 ± 0.06a Values are expressed as mean ± standard deviation of triplicates. Note: All similar lower case letters within a column show means that are not significantly different (p > 0.05). Table 7.
Effect of varied initial pH on total soluble sugar ( °Brix) of wort during fermentation by S. cerevisiae.
-
pH Fermentation period (h) 0 24 48 72 4.00 1.07 ± 0.00 1.06 ± 0.00a 1.04 ± 0.00b 1.03 ± 0.00b 4.50 1.07 ± 0.00 1.05 ± 0.00b 1.04 ± 0.00b 1.02 ± 0.00c 5.00 1.07 ± 0.00 1.05 ± 0.00b 1.03 ± 0.00c 1.02 ± 0.00c 5.50 1.07 ± 0.00 1.04 ± 0.00c 1.03 ± 0.00c 1.02 ± 0.00c 6.00 1.07 ± 0.00 1.05 ± 0.00b 1.03 ± 0.00c 1.02 ± 0.00c 6.50 1.07 ± 0.00 1.06 ± 0.00a 1.05 ± 0.00a 1.04 ± 0.00a Values are expressed as mean ± standard deviation of triplicates. Note: All similar lower case letters within a column show means that are not significantly different (p > 0.05). Table 8.
Effect of varied initial pH on specific gravity of wort during fermentation by S. cerevisiae.
-
pH Fermentation period (h) 0 24 48 72 4.00 1.39 ± 0.01d 1.76 ± 0.01d 3.22 ± 0.11b 3.61 ± 0.01b 4.50 1.52 ± 0.01c 2.26 ± 0.01c 3.27 ± 0.01b 3.76 ± 0.01b 5.00 2.55 ± 0.03a 2.93 ± 0.09b 3.39 ± 0.01b 3.82 ± 0.01a 5.50 2.84 ± 0.02a 3.52 ± 0.01a 3.75 ± 0.03a 3.88 ± 0.01a 6.00 1.78 ± 0.01b 2.48 ± 0.01b 3.29 ± 0.01b 3.79 ± 0.02b 6.50 1.22 ± 0.01 1.44 ± 0.01e 3.17 ± 0.01b 3.39 ± 0.01c Values are expressed as mean ± standard deviation of triplicates. Note: All similar lower case letters within a column show means that are not significantly different (p > 0.05). Table 9.
Effect of varied initial pH on titratable acidity (%) of wort during fermentation by S. cerevisiae.
-
pH Fermentation period (h) 0 24 48 72 4.00 0.00 ± 0.00 2.18 ± 0.01b 3.77 ± 0.01a 4.12 ± 0.01a 4.50 0.00 ± 0.00 2.41 ± 0.01b 3.49 ± 0.00b 4.25 ± 0.03a 5.00 0.00 ± 0.00 2.60 ± 0.01a 3.33 ± 0.02b 4.38 ± 0.01a 5.50 0.00 ± 0.00 2.79 ± 0.01a 3.76 ± 0.01a 4.43 ± 0.01a 6.00 0.00 ± 0.00 2.22 ± 0.01b 3.16 ± 0.01b 4.29 ± 0.01a 6.50 0.00 ± 0.00 2.19 ± 0.00b 2.89 ± 0.01c 3.61 ± 0.01b Values are expressed as mean ± standard deviation of triplicates. Note: All similar lower case letters within a column show means that are not significantly different (p > 0.05). Table 10.
Effect of varied initial pH on alcohol content (%) of wort during fermentation by S. cerevisiae.
-
Inoculum size
(cells/ml)Fermentation period (h) 0 24 48 72 1.24 × 10⁸ 5.50 ± 0.00 3.41 ± 0.01b 3.39 ± 0.01c 3.33 ± 0.01c 2.48 × 10⁸ 5.50 ± 0.00 3.46 ± 0.01b 3.40 ± 0.01b 3.37 ± 0.01b 3.72 × 10⁸ 5.50 ± 0.00 3.50 ± 0.01a 3.45 ± 0.01b 3.41 ± 0.01b 4.96 × 10⁸ 5.50 ± 0.00 3.52 ± 0.01a 3.46 ± 0.01b 3.44 ± 0.01b 6.20 × 10⁸ 5.50 ± 0.00 3.55 ± 0.01a 3.49 ± 0.00b 3.48 ± 0.00b 7.44 × 10⁸ 5.50 ± 0.00 3.58 ± 0.01a 3.52 ± 0.01a 3.51 ± 0.01a Values are expressed as mean ± standard deviation of triplicates. Note: All similar lower case letters within a column show means that are not significantly different (p > 0.05). Table 11.
Effect of varied inoculum size on pH of wort during fermentation by S. cerevisiae.
-
Inoculum size
(cells/ml)Fermentation period (h) 0 24 48 72 1.24 × 10⁸ 15.80 ± 0.00 10.47 ± 0.09c 7.17 ± 0.01d 6.30 ± 0.06b 2.48 × 10⁸ 15.80 ± 0.00 10.70 ± 0.06b 7.20 ± 0.12d 6.73 ± 0.07b 3.72 × 10⁸ 15.80 ± 0.00 10.77 ± 0.09b 7.43 ± 0.09c 6.67 ± 0.09b 4.96 × 10⁸ 15.80 ± 0.00 10.90 ± 0.06b 7.63 ± 0.15b 6.80 ± 0.06b 6.20 × 10⁸ 15.80 ± 0.00 11.53 ± 0.03a 7.77 ± 0.09b 6.80 ± 0.00b 7.44 × 10⁸ 15.80 ± 0.00 11.60 ± 0.06a 8.07 ± 0.07a 6.97 ± 0.12a Values are expressed as mean ± standard deviation of triplicates. Note: All similar lower case letters within a column show means that are not significantly different (p > 0.05). Table 12.
Effect of varied inoculum size on total soluble sugar ( °Brix) of wort during fermentation by S. cerevisiae.
-
Inoculum size
(cells/ml)Fermentation period (h) 0 24 48 72 1.24 × 10⁸ 1.07 ± 0.00 1.04 ± 0.00b 1.03 ± 0.00b 1.02 ± 0.01c 2.48 × 10⁸ 1.07 ± 0.00 1.04 ± 0.00b 1.03 ± 0.00b 1.03 ± 0.00b 3.72 × 10⁸ 1.07 ± 0.00 1.04 ± 0.00b 1.03 ± 0.00b 1.03 ± 0.00b 4.96 × 10⁸ 1.07 ± 0.00 1.05 ± 0.00a 1.03 ± 0.00b 1.03 ± 0.00b 6.20 × 10⁸ 1.07 ± 0.00 1.05 ± 0.00a 1.03 ± 0.00b 1.03 ± 0.00b 7.44 × 10⁸ 1.07 ± 0.00 1.05 ± 0.00a 1.04 ± 0.00a 1.04 ± 0.00a Values are expressed as mean ± standard deviation of triplicates. Note: All similar lower case letters within a column show means that are not significantly different (p > 0.05). Table 13.
Effect of varied inoculum size on specific gravity of wort during fermentation by S. cerevisiae.
-
Inoculum size
(cells/ml)Fermentation period (h) 0 24 48 72 1.24 × 10⁸ 2.86 ± 0.01a 3.81 ± 0.01a 3.90 ± 0.02a 4.18 ± 0.01a 2.48 × 10⁸ 2.82 ± 0.01a 3.69 ± 0.01b 3.87 ± 0.01a 4.11 ± 0.01a 3.72 × 10⁸ 2.71 ± 0.00c 3.64 ± 0.01b 3.78 ± 0.01a 3.91 ± 0.01b 4.96 × 10⁸ 2.56 ± 0.01d 3.61 ± 0.01b 3.74 ± 0.01a 3.79 ± 0.01b 6.20 × 10⁸ 2.50 ± 0.11d 3.49 ± 0.01c 3.64 ± 0.01b 3.74 ± 0.01b 7.44 × 10⁸ 1.88 ± 0.01a 3.42 ± 0.01c 3.52 ± 0.02b 3.66 ± 0.01b Values are expressed as mean ± standard deviation of triplicates. Note: All similar lower case letters within a column show means that are not significantly different (p > 0.05). Table 14.
Effect of varied inoculum size on titratable acidity (%) of wort during fermentation by S. cerevisiae.
-
Inoculum size
(cells/ml)Fermentation period (h) 0 24 48 72 1.24 × 10⁸ 0.00 ± 0.00 2.74 ± 0.01a 3.73 ± 0.01a 4.60 ± 0.01a 2.48 × 10⁸ 0.00 ± 0.00 2.39 ± 0.01b 3.43 ± 0.02b 4.53 ± 0.01a 3.72 × 10⁸ 0.00 ± 0.00 2.51 ± 0.01b 3.27 ± 0.02b 4.10 ± 0.06b 4.96 × 10⁸ 0.00 ± 0.00 2.33 ± 0.01b 3.18 ± 0.02b 3.88 ± 0.01c 6.20 × 10⁸ 0.00 ± 0.00 2.45 ± 0.01b 3.83 ± 0.01a 3.29 ± 0.01c 7.44 × 10⁸ 0.00 ± 0.00 2.48 ± 0.01b 3.22 ± 0.02b 3.12 ± 0.01c Values are expressed as mean ± standard deviation of triplicates. Note: All similar lower case letters within a column show means that are not significantly different (p > 0.05). Table 15.
Effect of varied inoculum size on alcohol content (%) of wort during fermentation by S. cerevisiae.
Figures
(1)
Tables
(15)