-
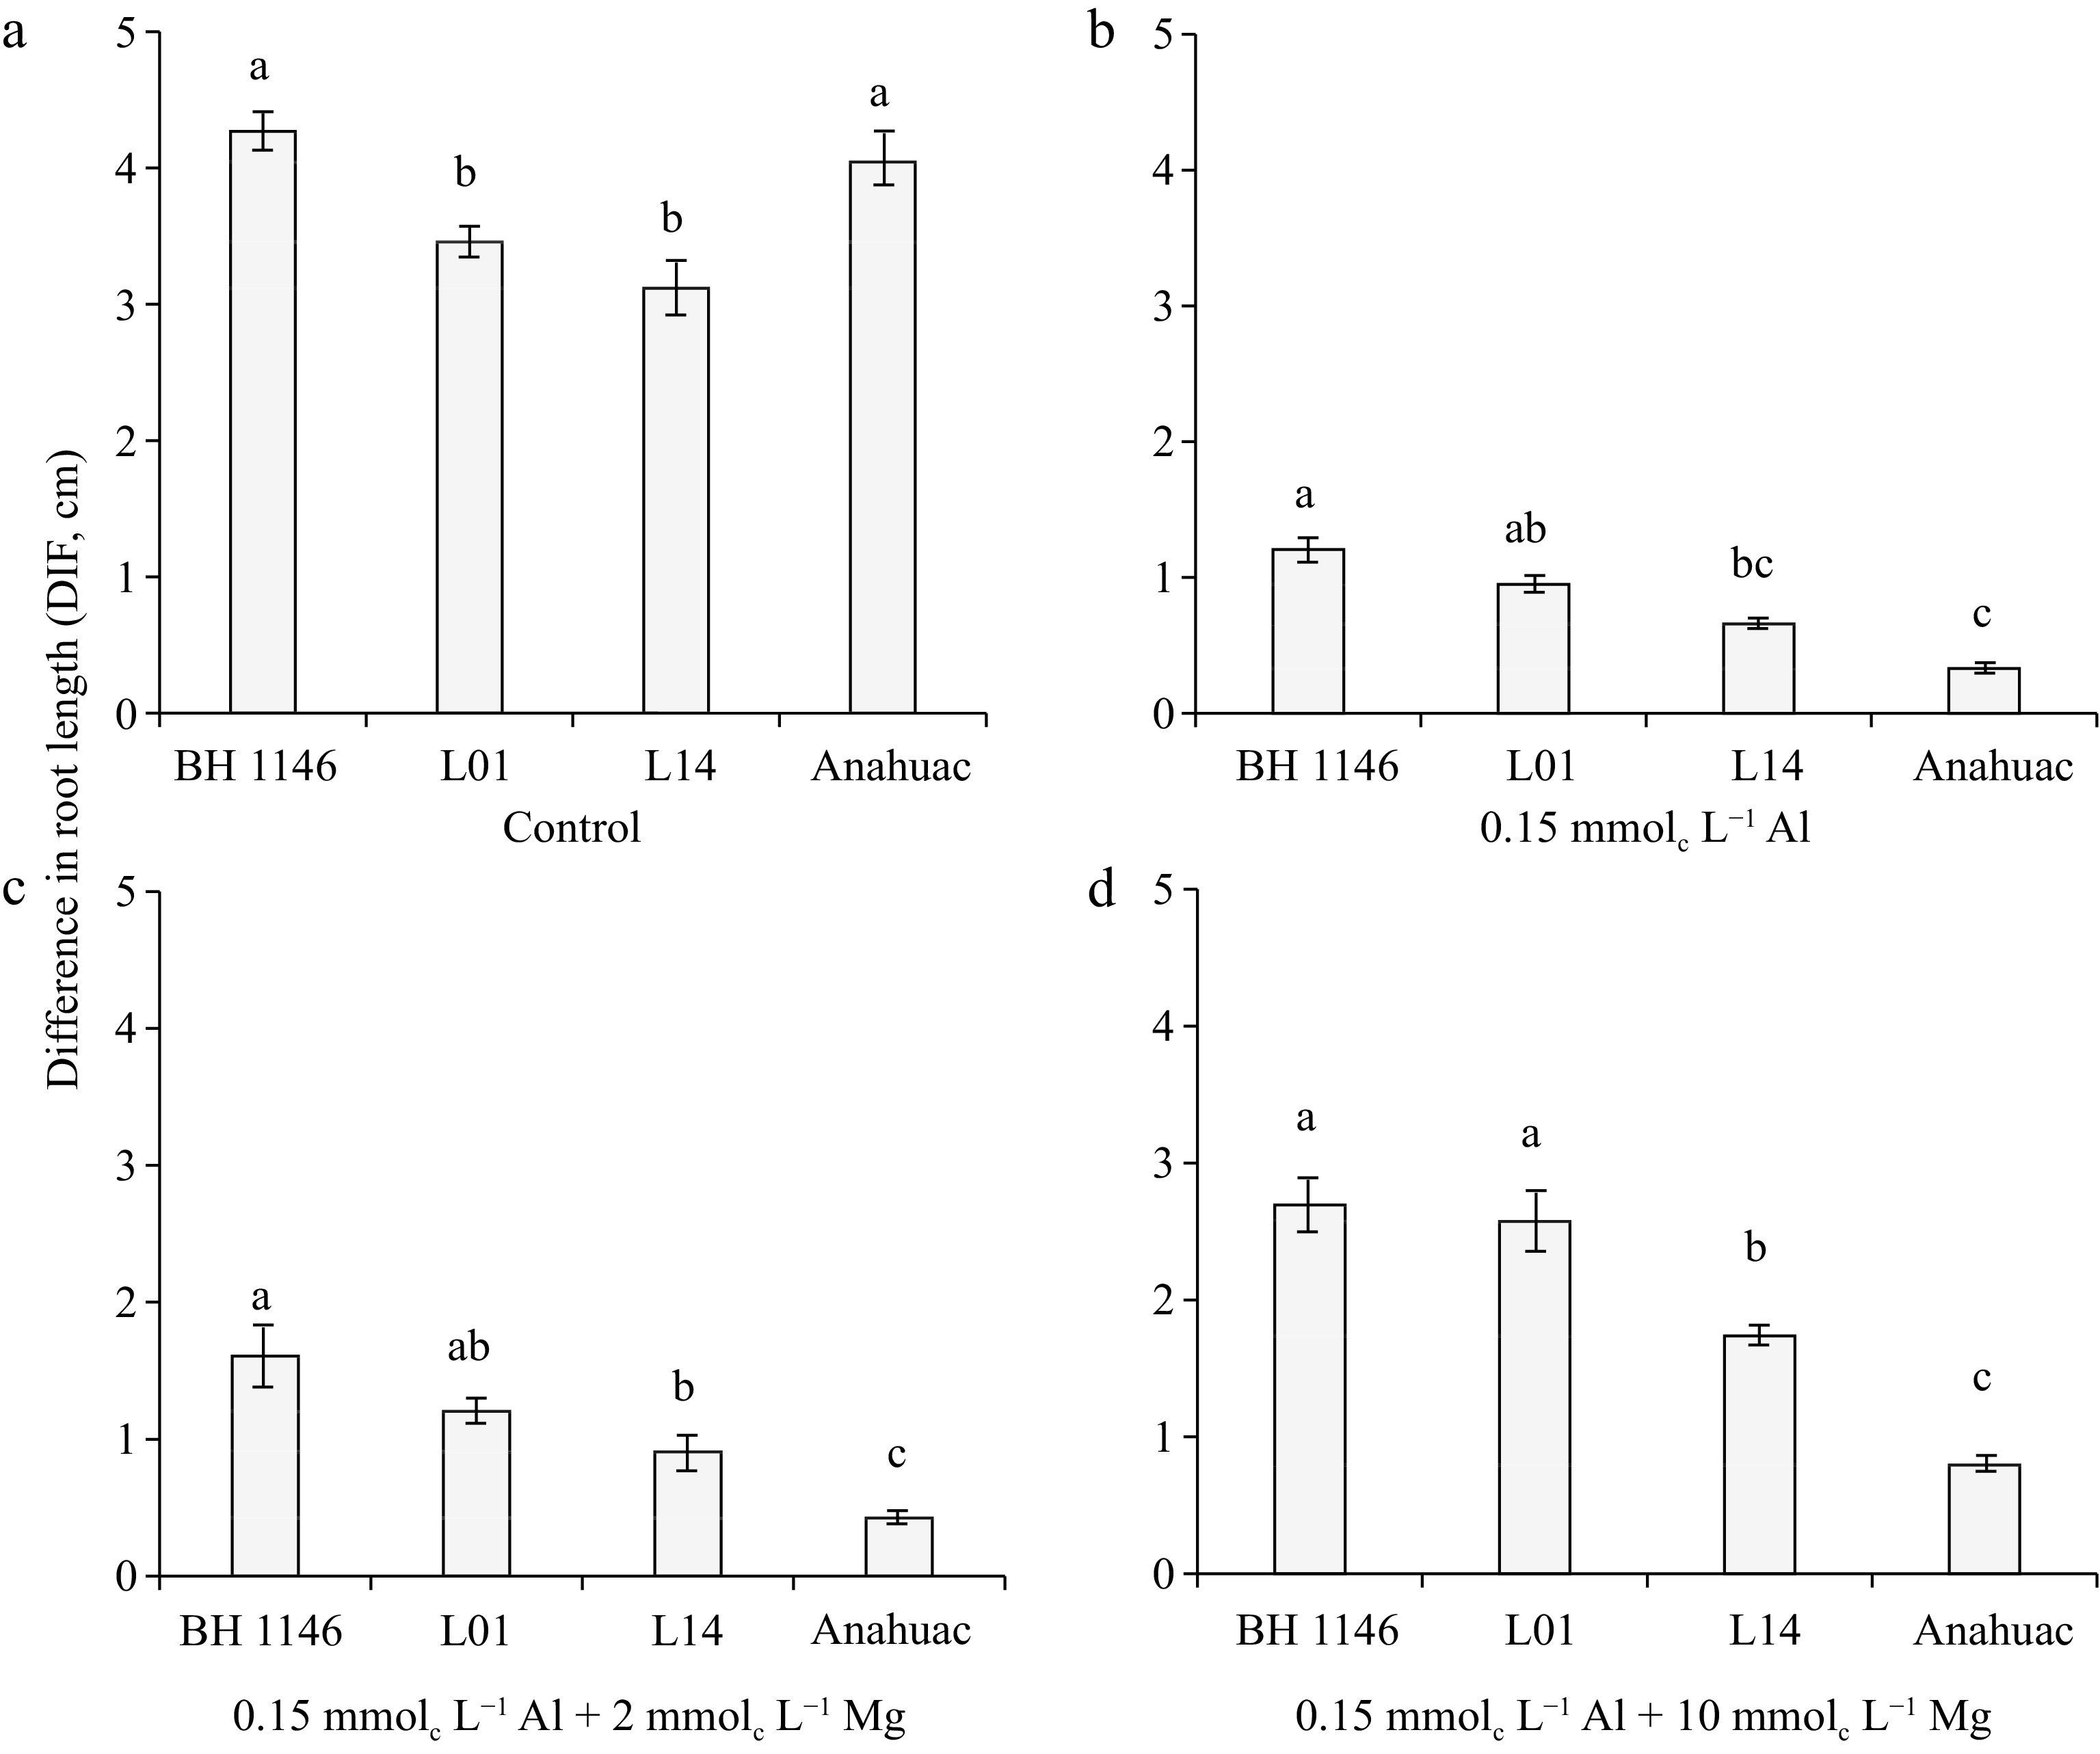
Figure 1.
Differential behavior of wheat genotypes within each minimal solution treatment: (a) control, (b) 0.15 mmolc L−1 of Al, (c) 0.15 mmolc L−1 of Al + 2 mmolc L−1 of Mg, and (d) 0.15 mmolc L−1 of Al + 10 mmolc L−1 of Mg, for the variable DIF after 48 h of exposure. Means followed by the same letters do not differ significantly by the LSD test at p < 0.01. Error bars express the standard error of the mean (n = 3).
-
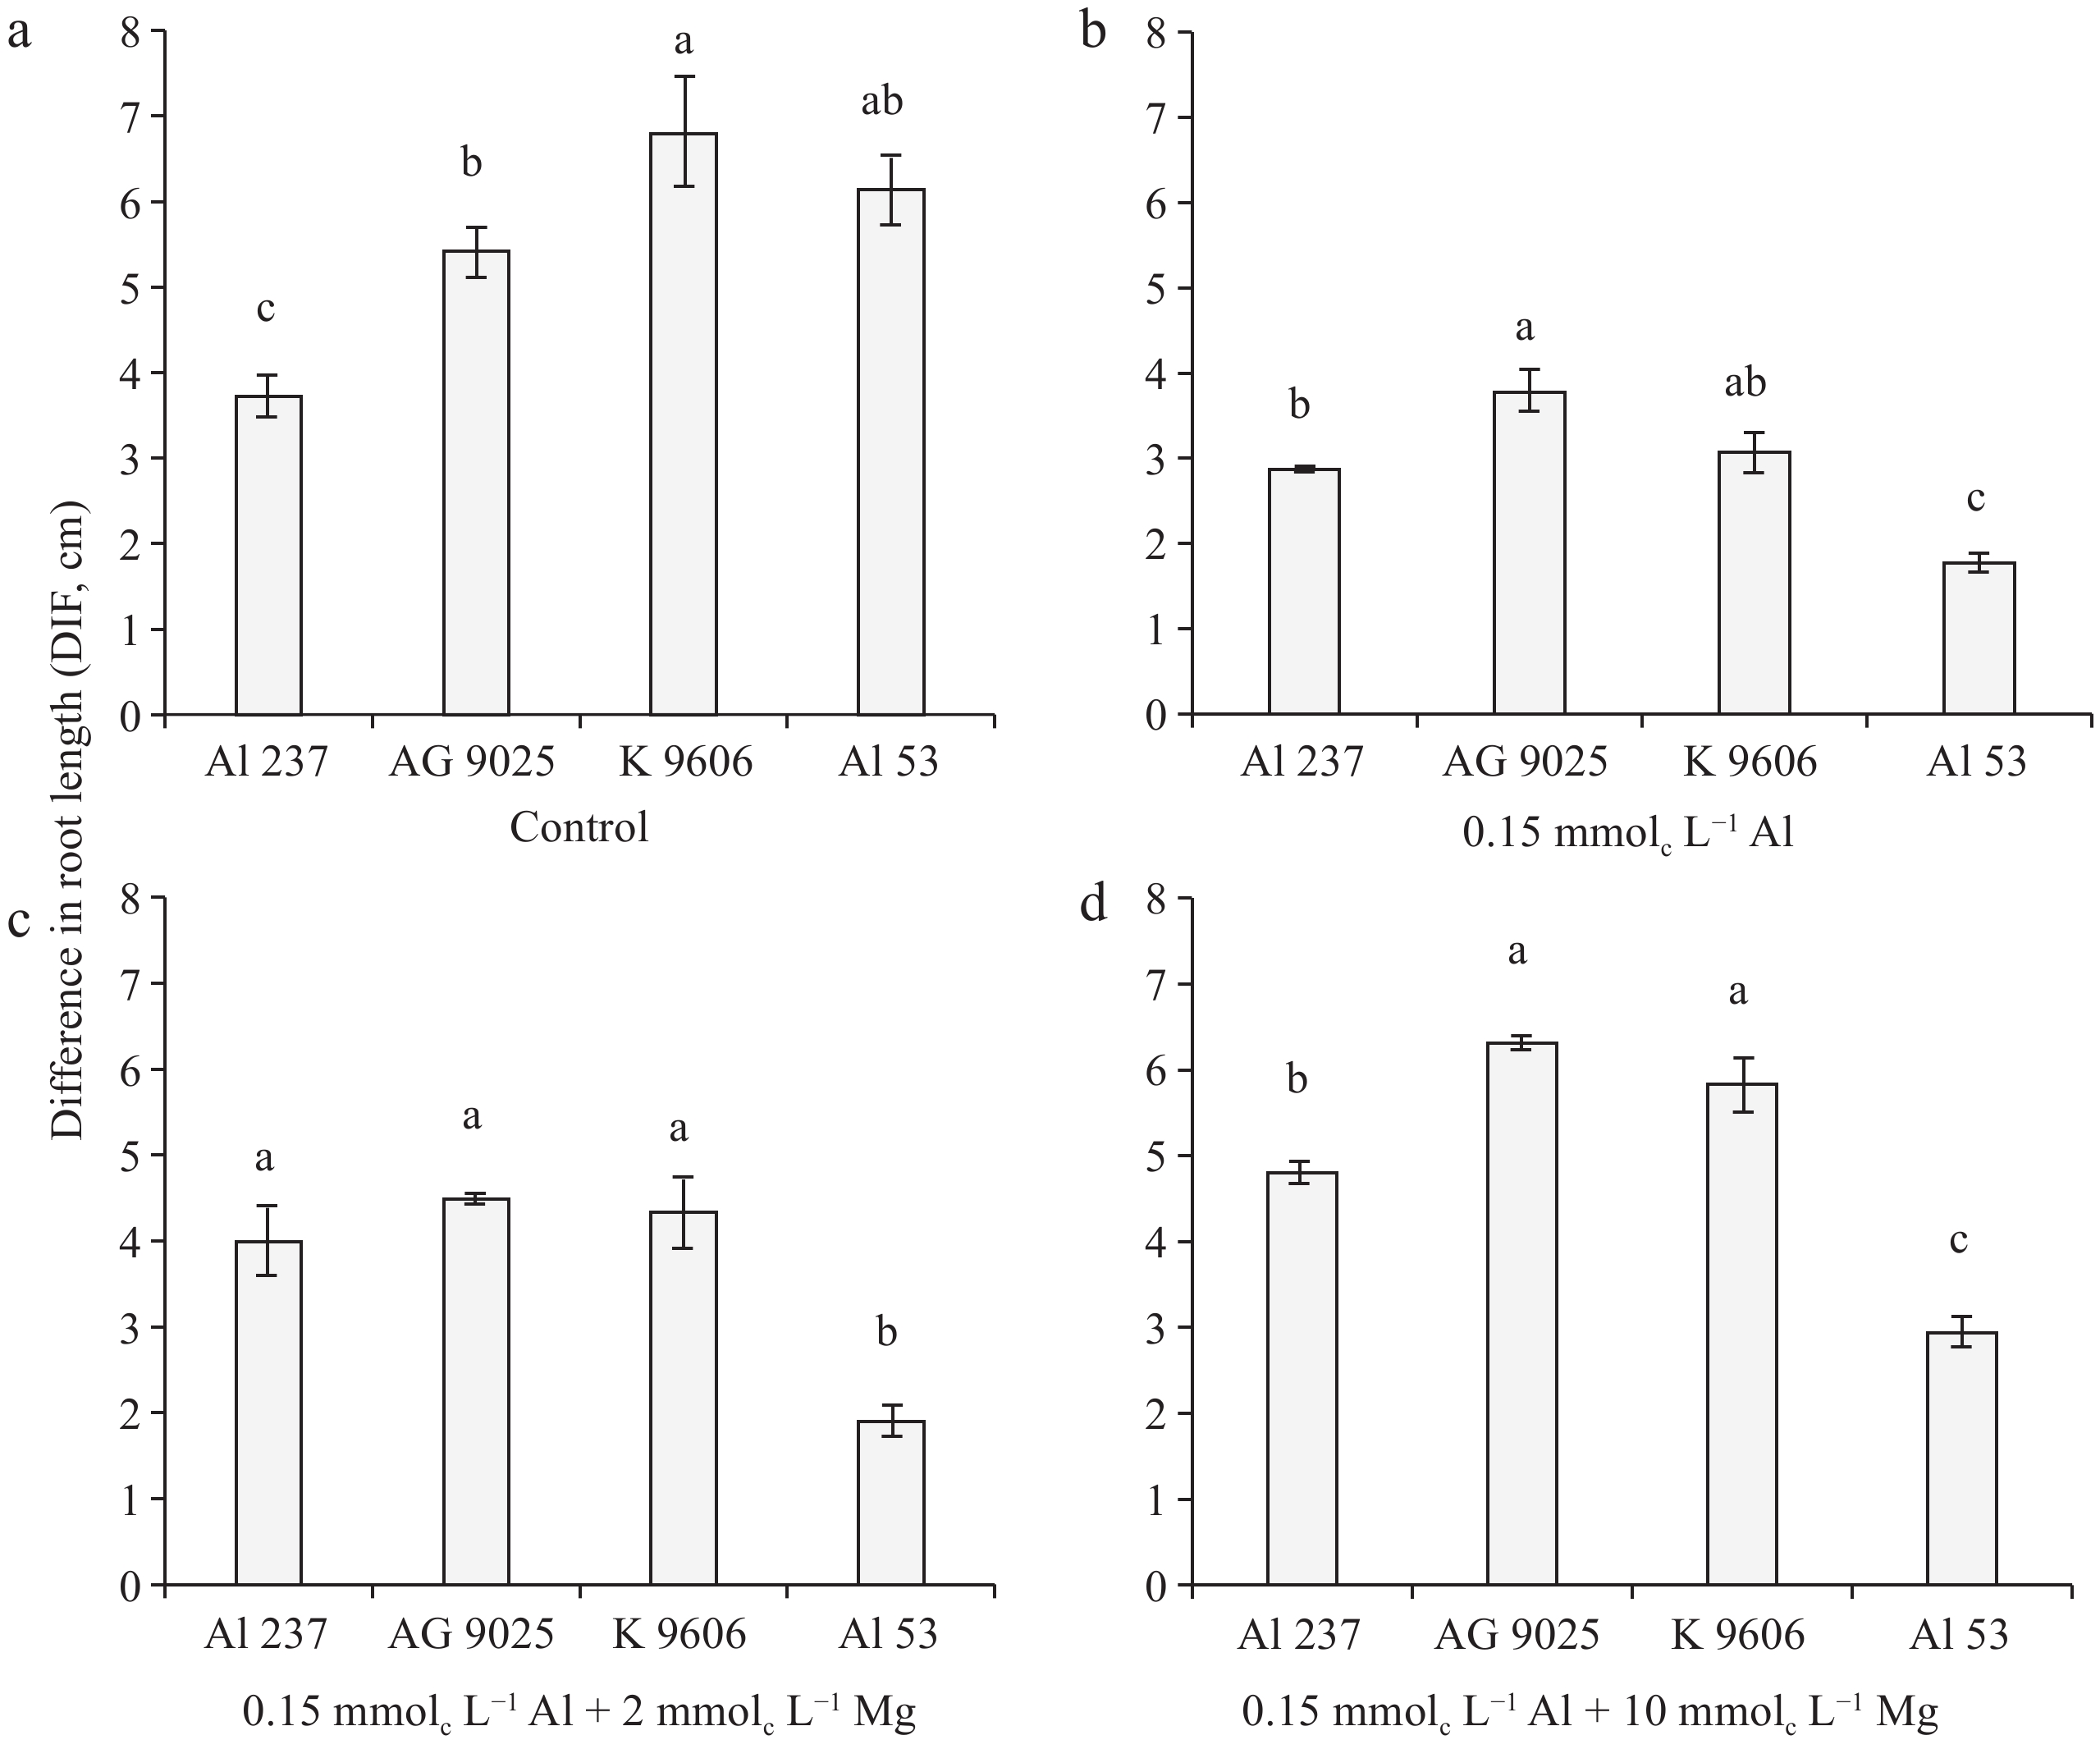
Figure 2.
Differential behavior of maize genotypes within each treatment in minimum solution: (a) control, (b) 0.15 mmolc L−1 of Al, (c) 0.15 mmolc L−1 of Al + 2 mmolc L−1 of Mg, and (d) 0.15 mmolc L−1 of Al + 10 mmolc L−1 of Mg, for the DIF variable after 48 h of exposure. Means followed by the same letters do not differ significantly by the LSD test at p < 0.01. Error bars express the standard error of the mean (n = 3).
-
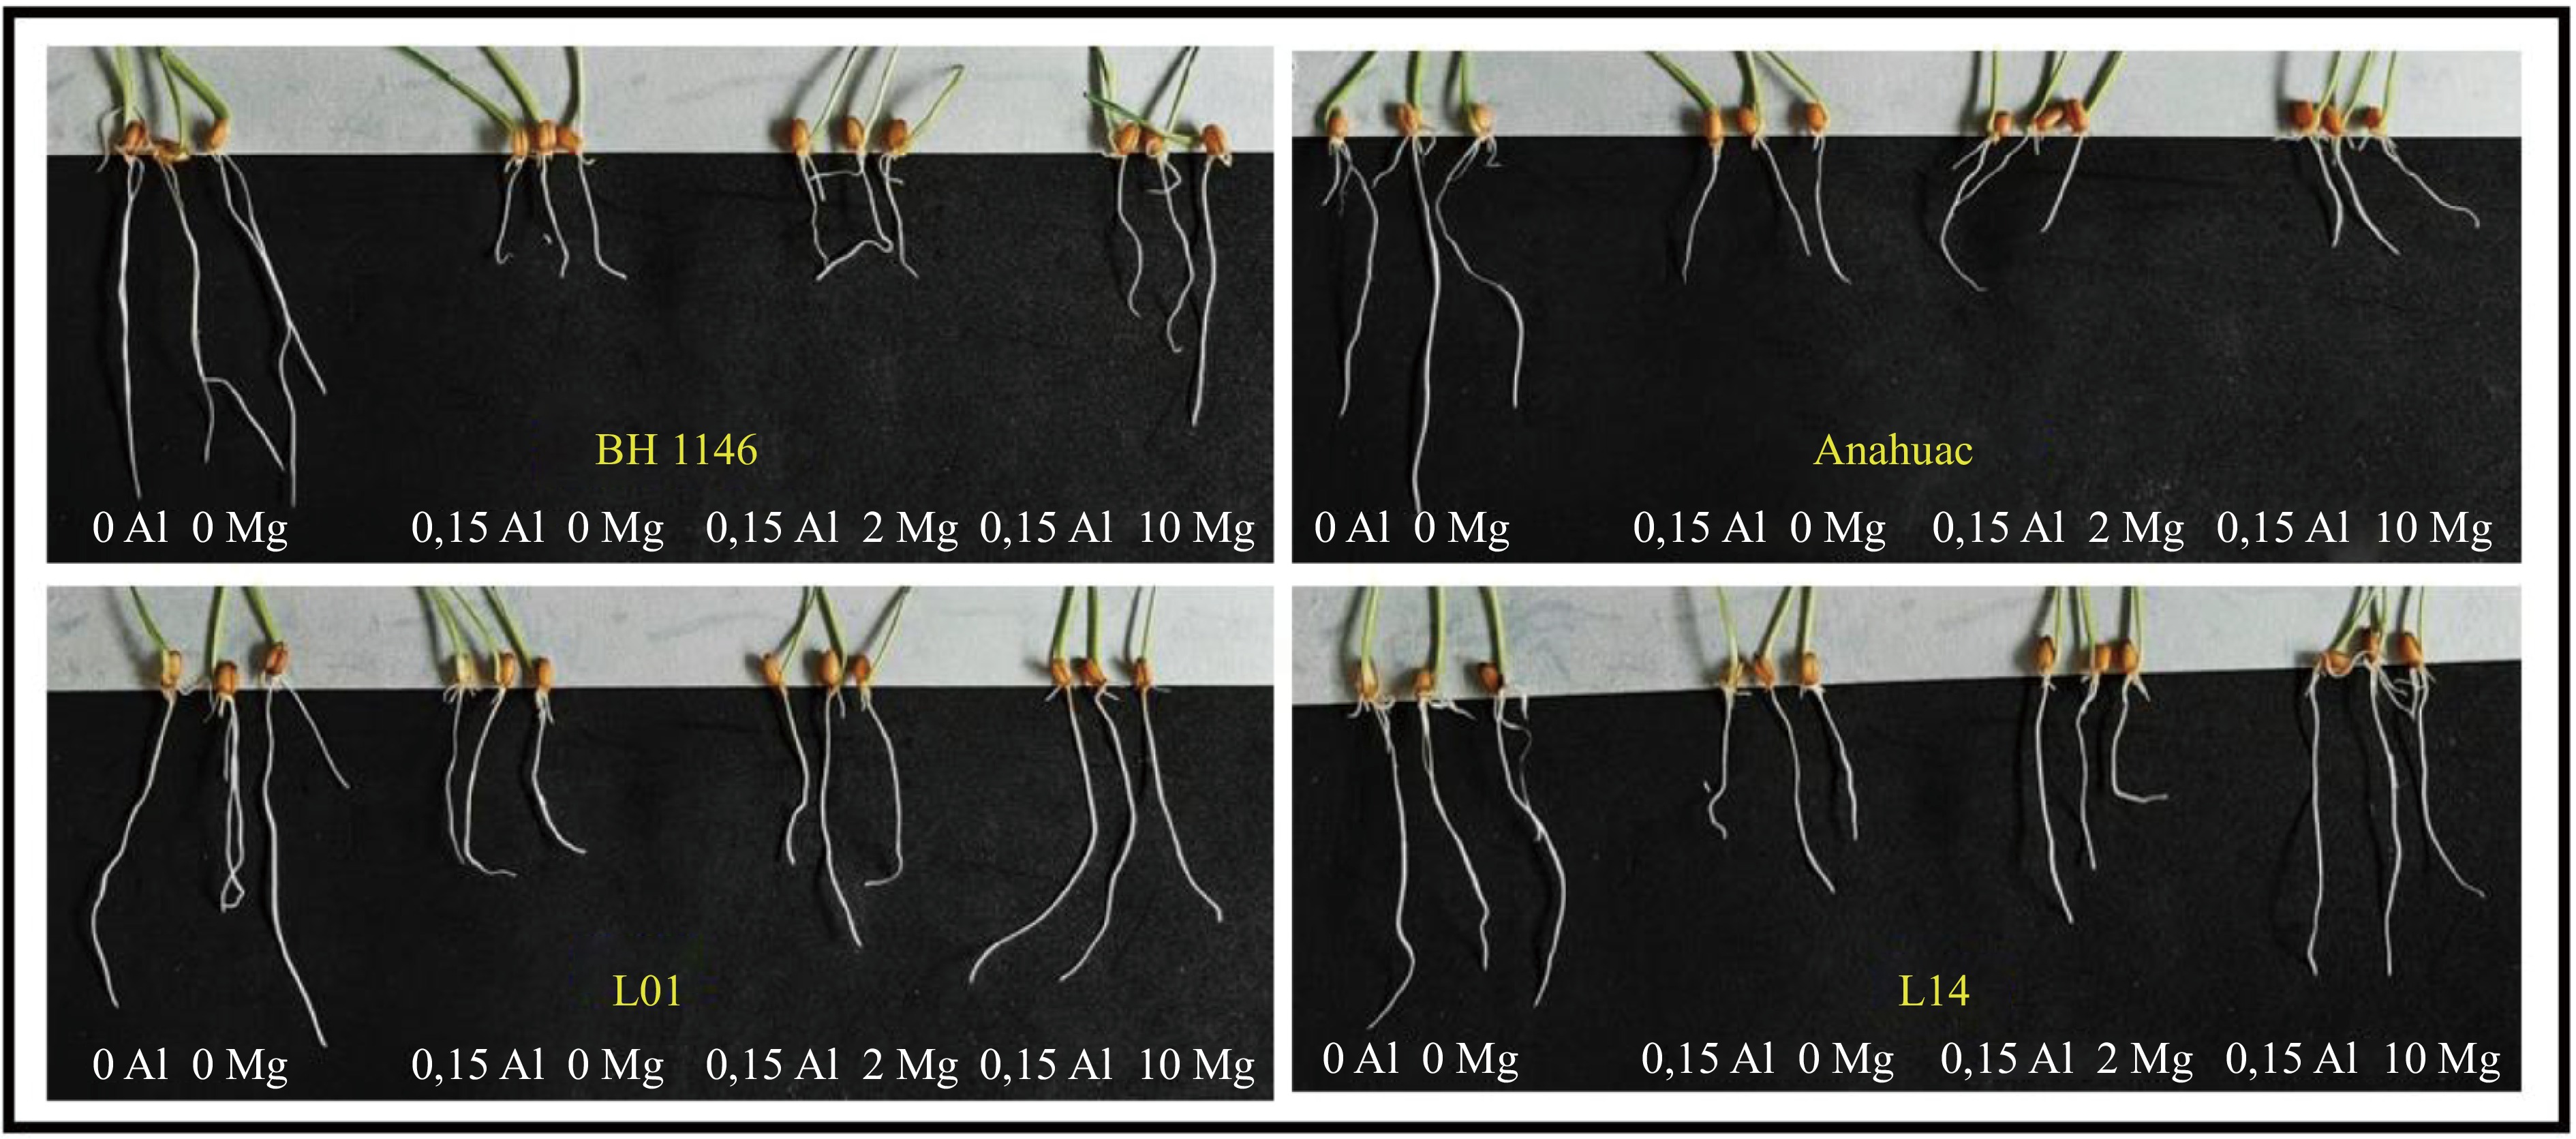
Figure 3.
Effects of Al and Mg concentrations on two wheat cultivars (BH 1146 and Anahuac) and two wheat lines (L01 and L14), after 48 h of exposure.
-
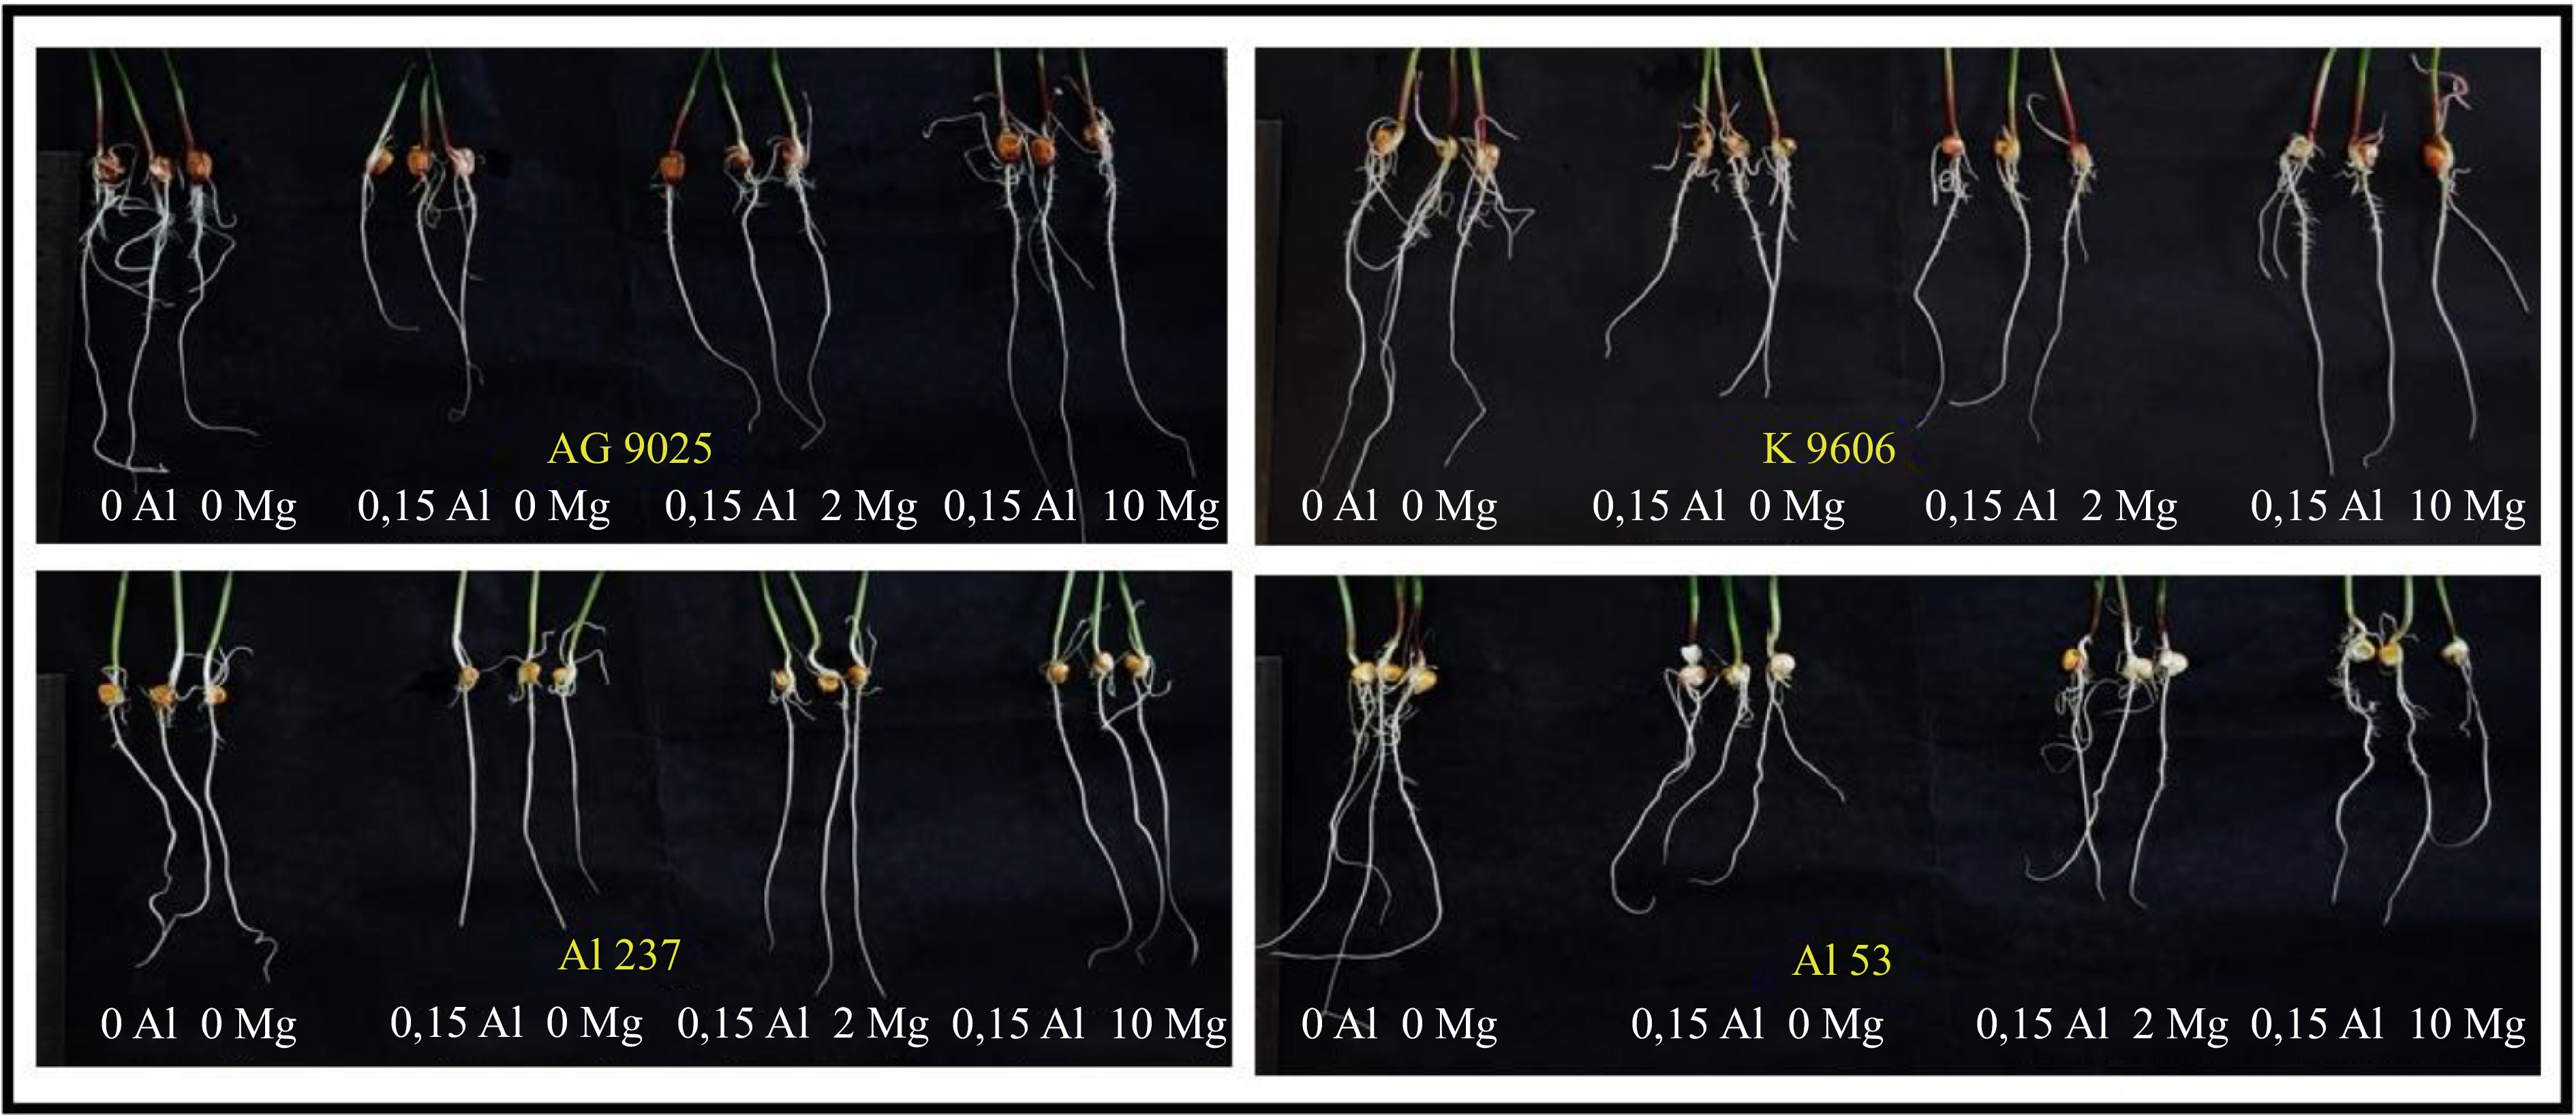
Figure 4.
Effects of Al and Mg concentrations on two maize hybrids (AG 9025 and K 9606) and two maize inbred lines (Al 237 and Al 53), after 48 h of exposure.
-
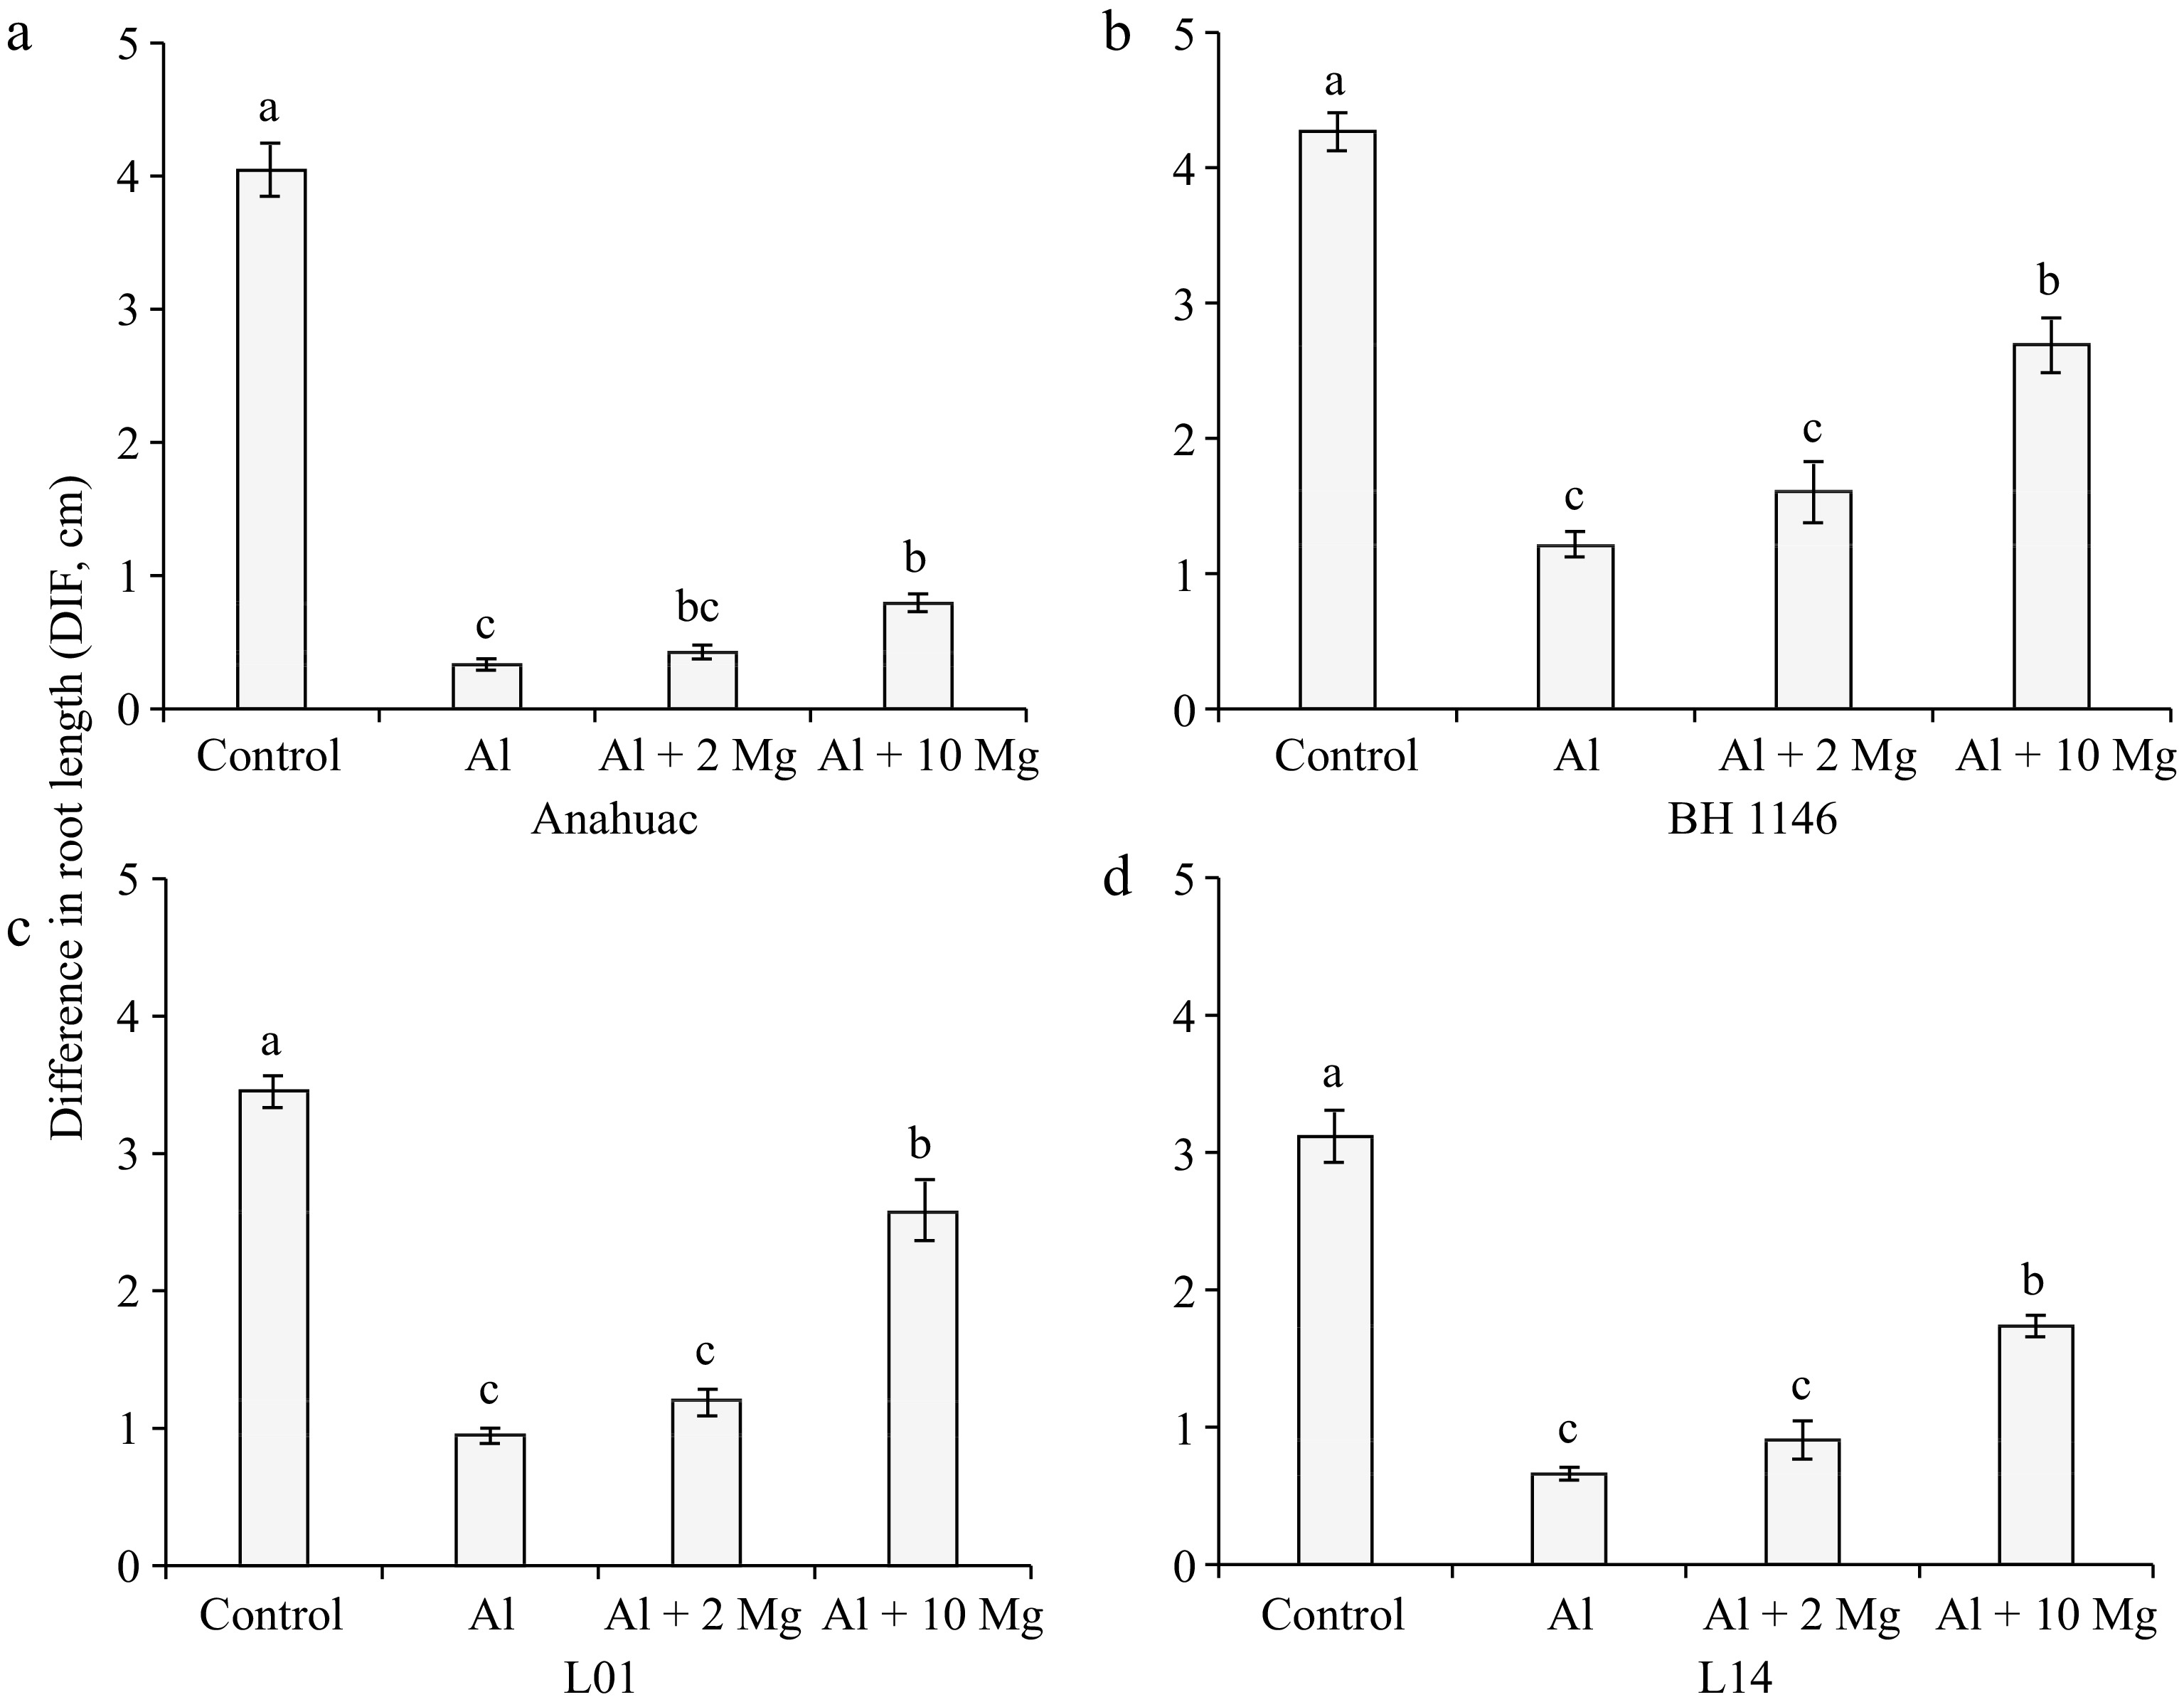
Figure 5.
Effect of solutions containing Al (0.15 mmolc L−1), without and with Mg (2 or 10 mmolc L−1), on the variable DIF after 48 h of exposure of wheat genotypes (a) Anahuac, (b) BH 1146, (c) L01, and (d) L14. Means followed by the same letters do not differ significantly by the LSD test at p < 0.01. Error bars express the standard error of the mean (n = 3).
-
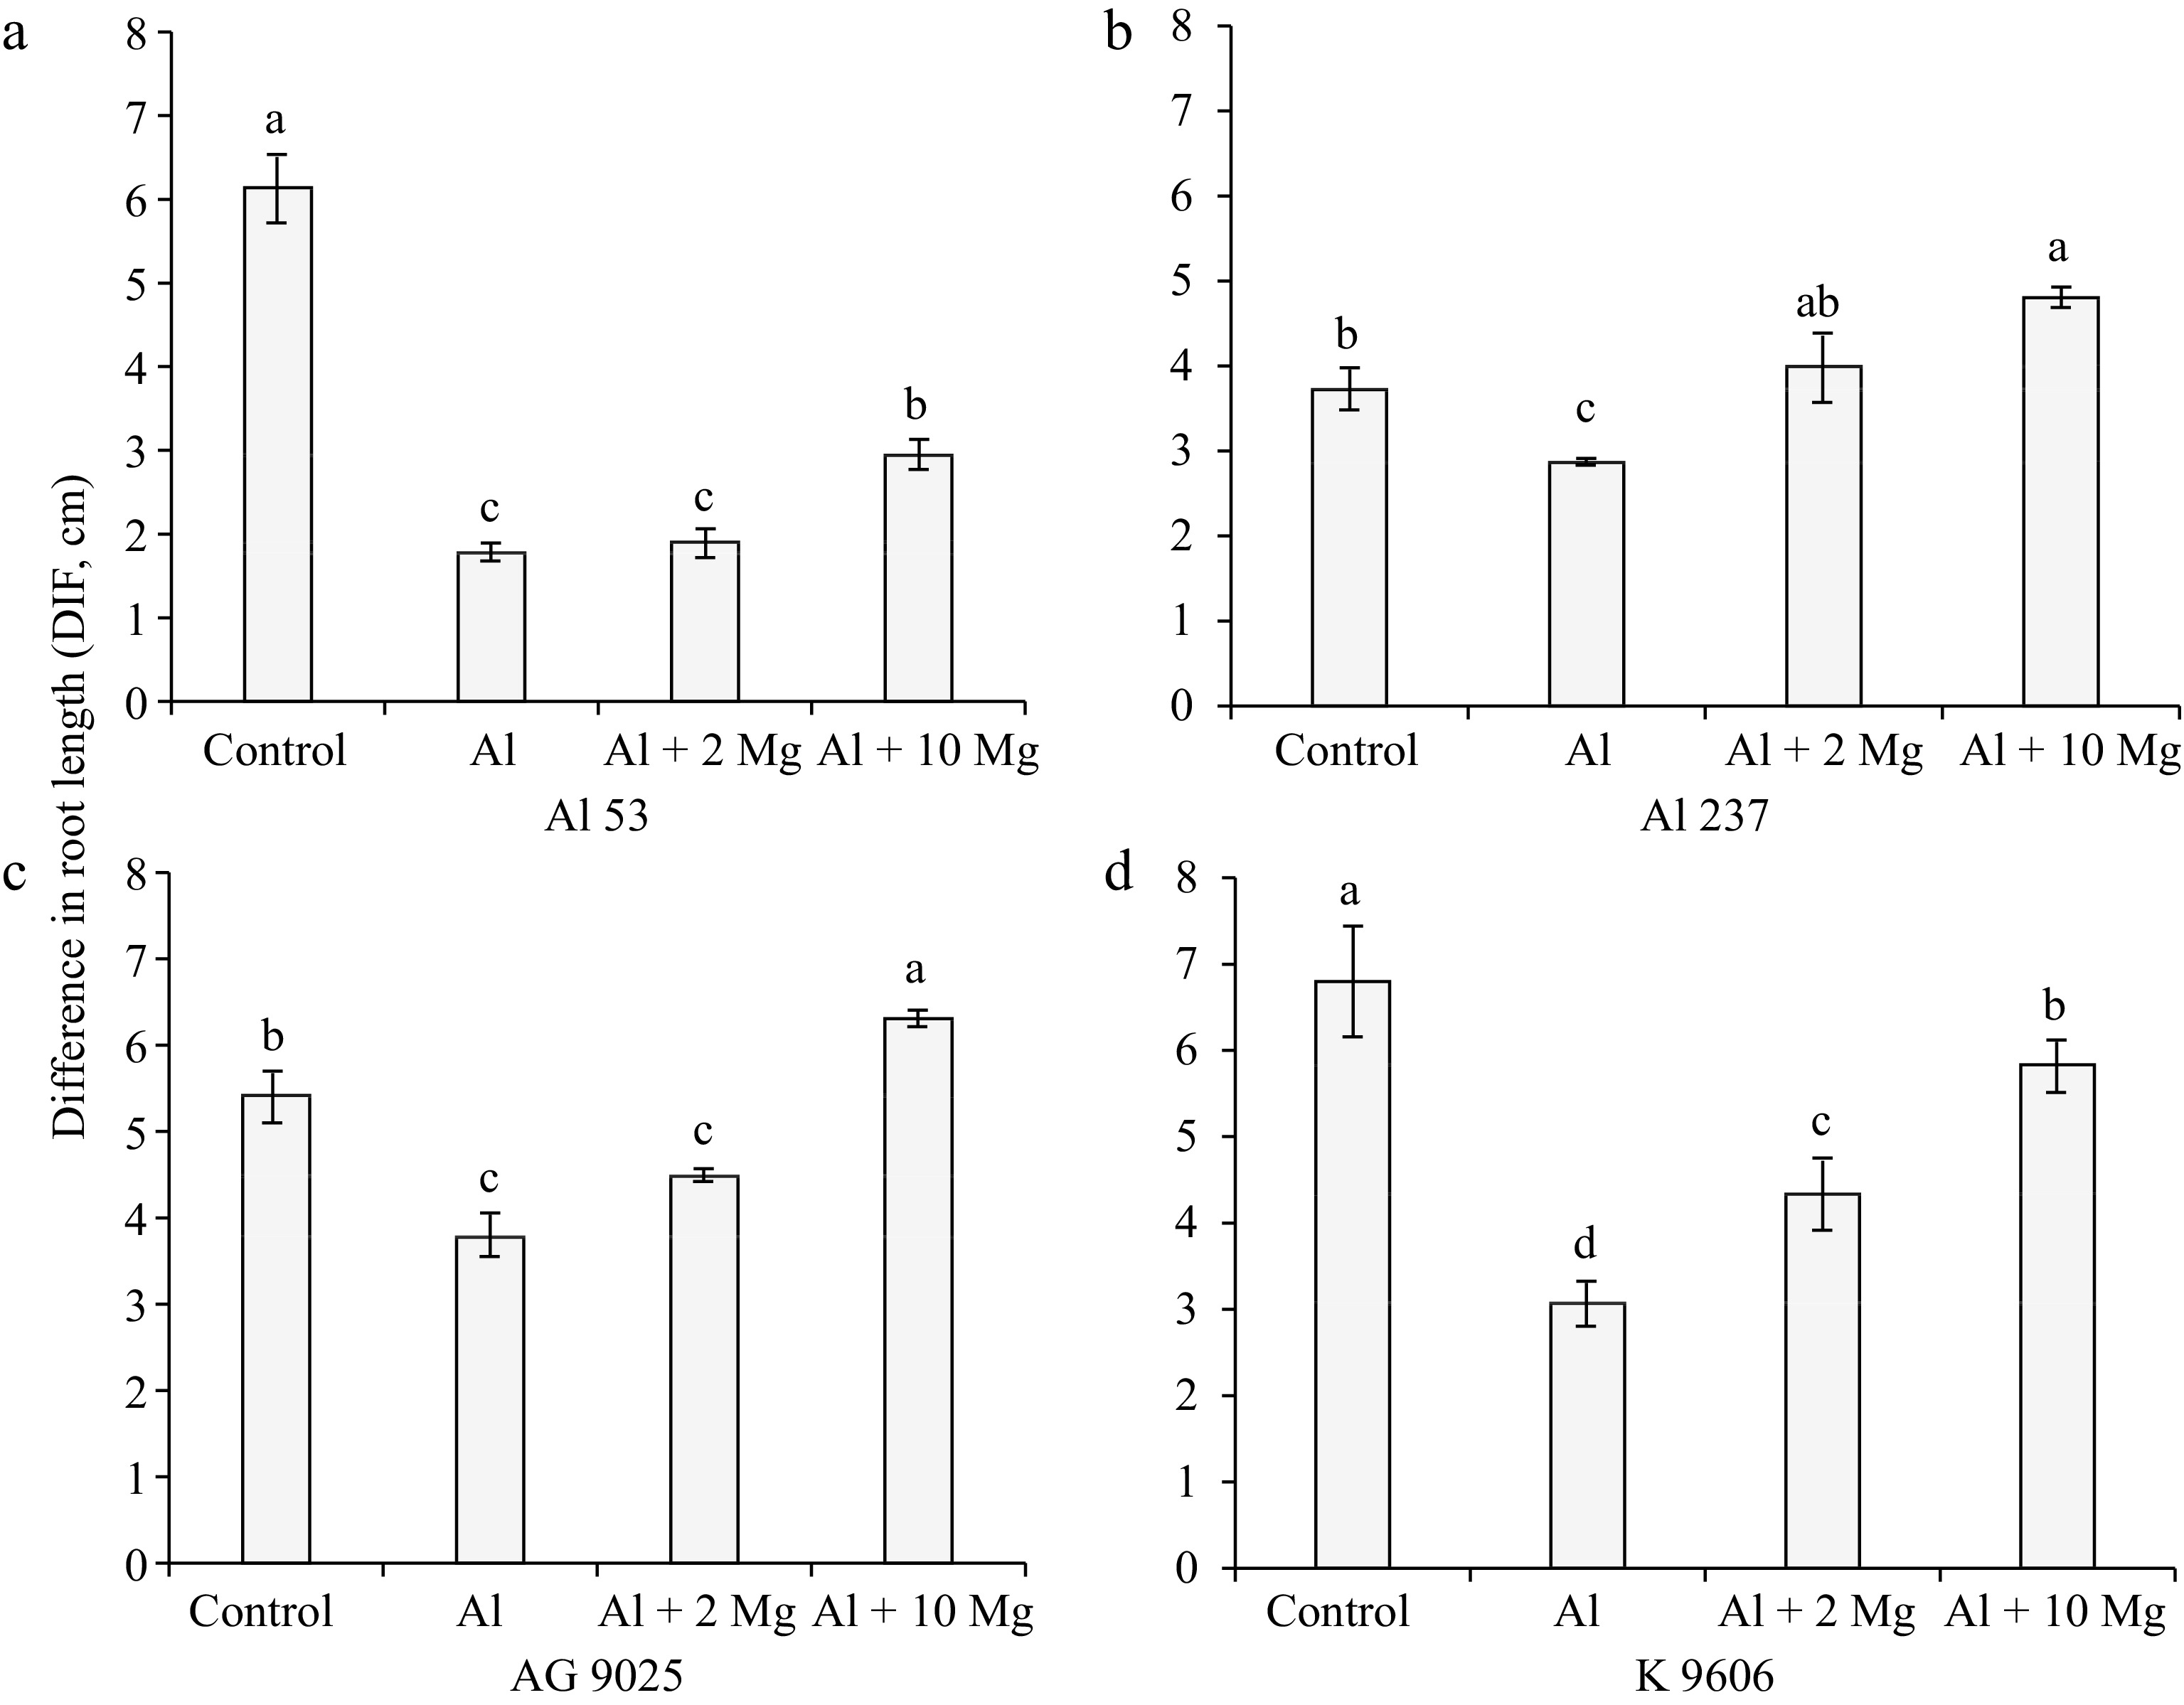
Figure 6.
Effect of solutions containing Al (0.15 mmolc L−1), without and with Mg (2 or 10 mmolc L−1), on the variable DIF after 48 h of exposure of maize genotypes (a) Al 53, (b) Al 237, (c) AG 9025, and (d) K 9606. Means followed by the same letters do not differ significantly by the LSD test at p < 0.01. Error bars express the standard error of the mean (n = 3).
-
Crop Source F-probability Wheat Solution (S) < 0.001 Genotype (G) < 0.001 S × G < 0.001 Maize Solution (S) 0.001 Genotype (G) < 0.001 S × G < 0.001 Table 1.
ANOVA F-test probabilities for the effects of solution containing Al and Mg, wheat and maize genotypes and their interactions effects on difference in root length (DIF).
Figures
(6)
Tables
(1)