-
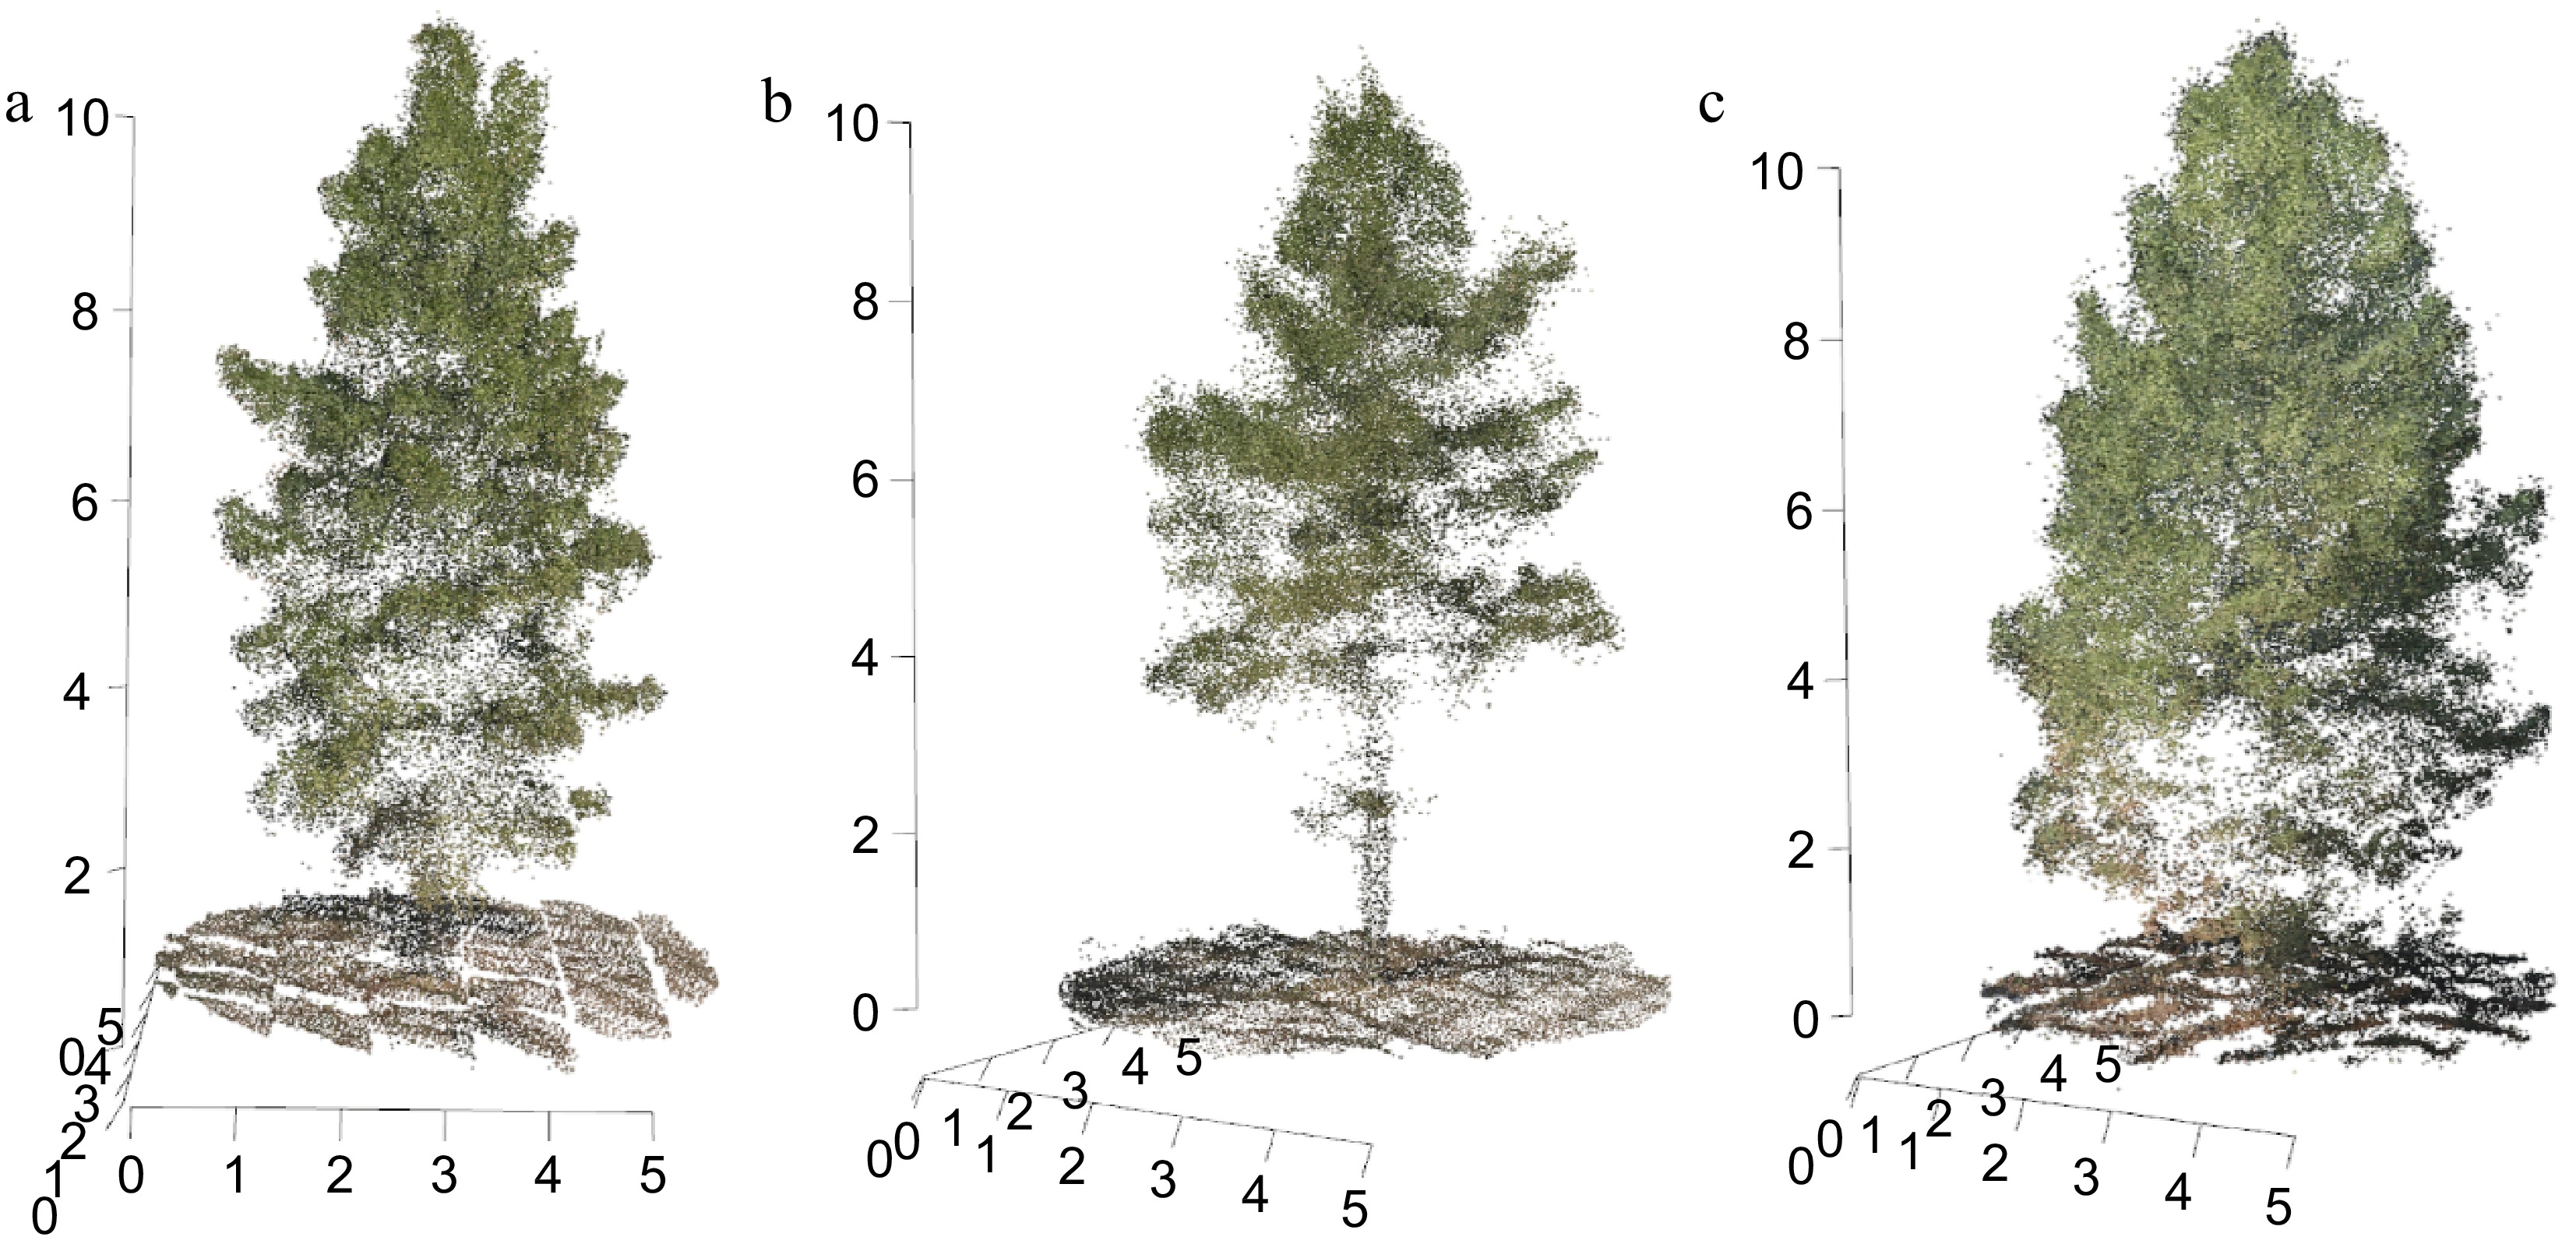
Figure 1.
Three-dimensional point cloud visualizations of slash pine trees derived from UAV imaging. (a) Tree with a lower canopy structure, (b) elevated canopy structure, and (c) lower crown with understory.
-
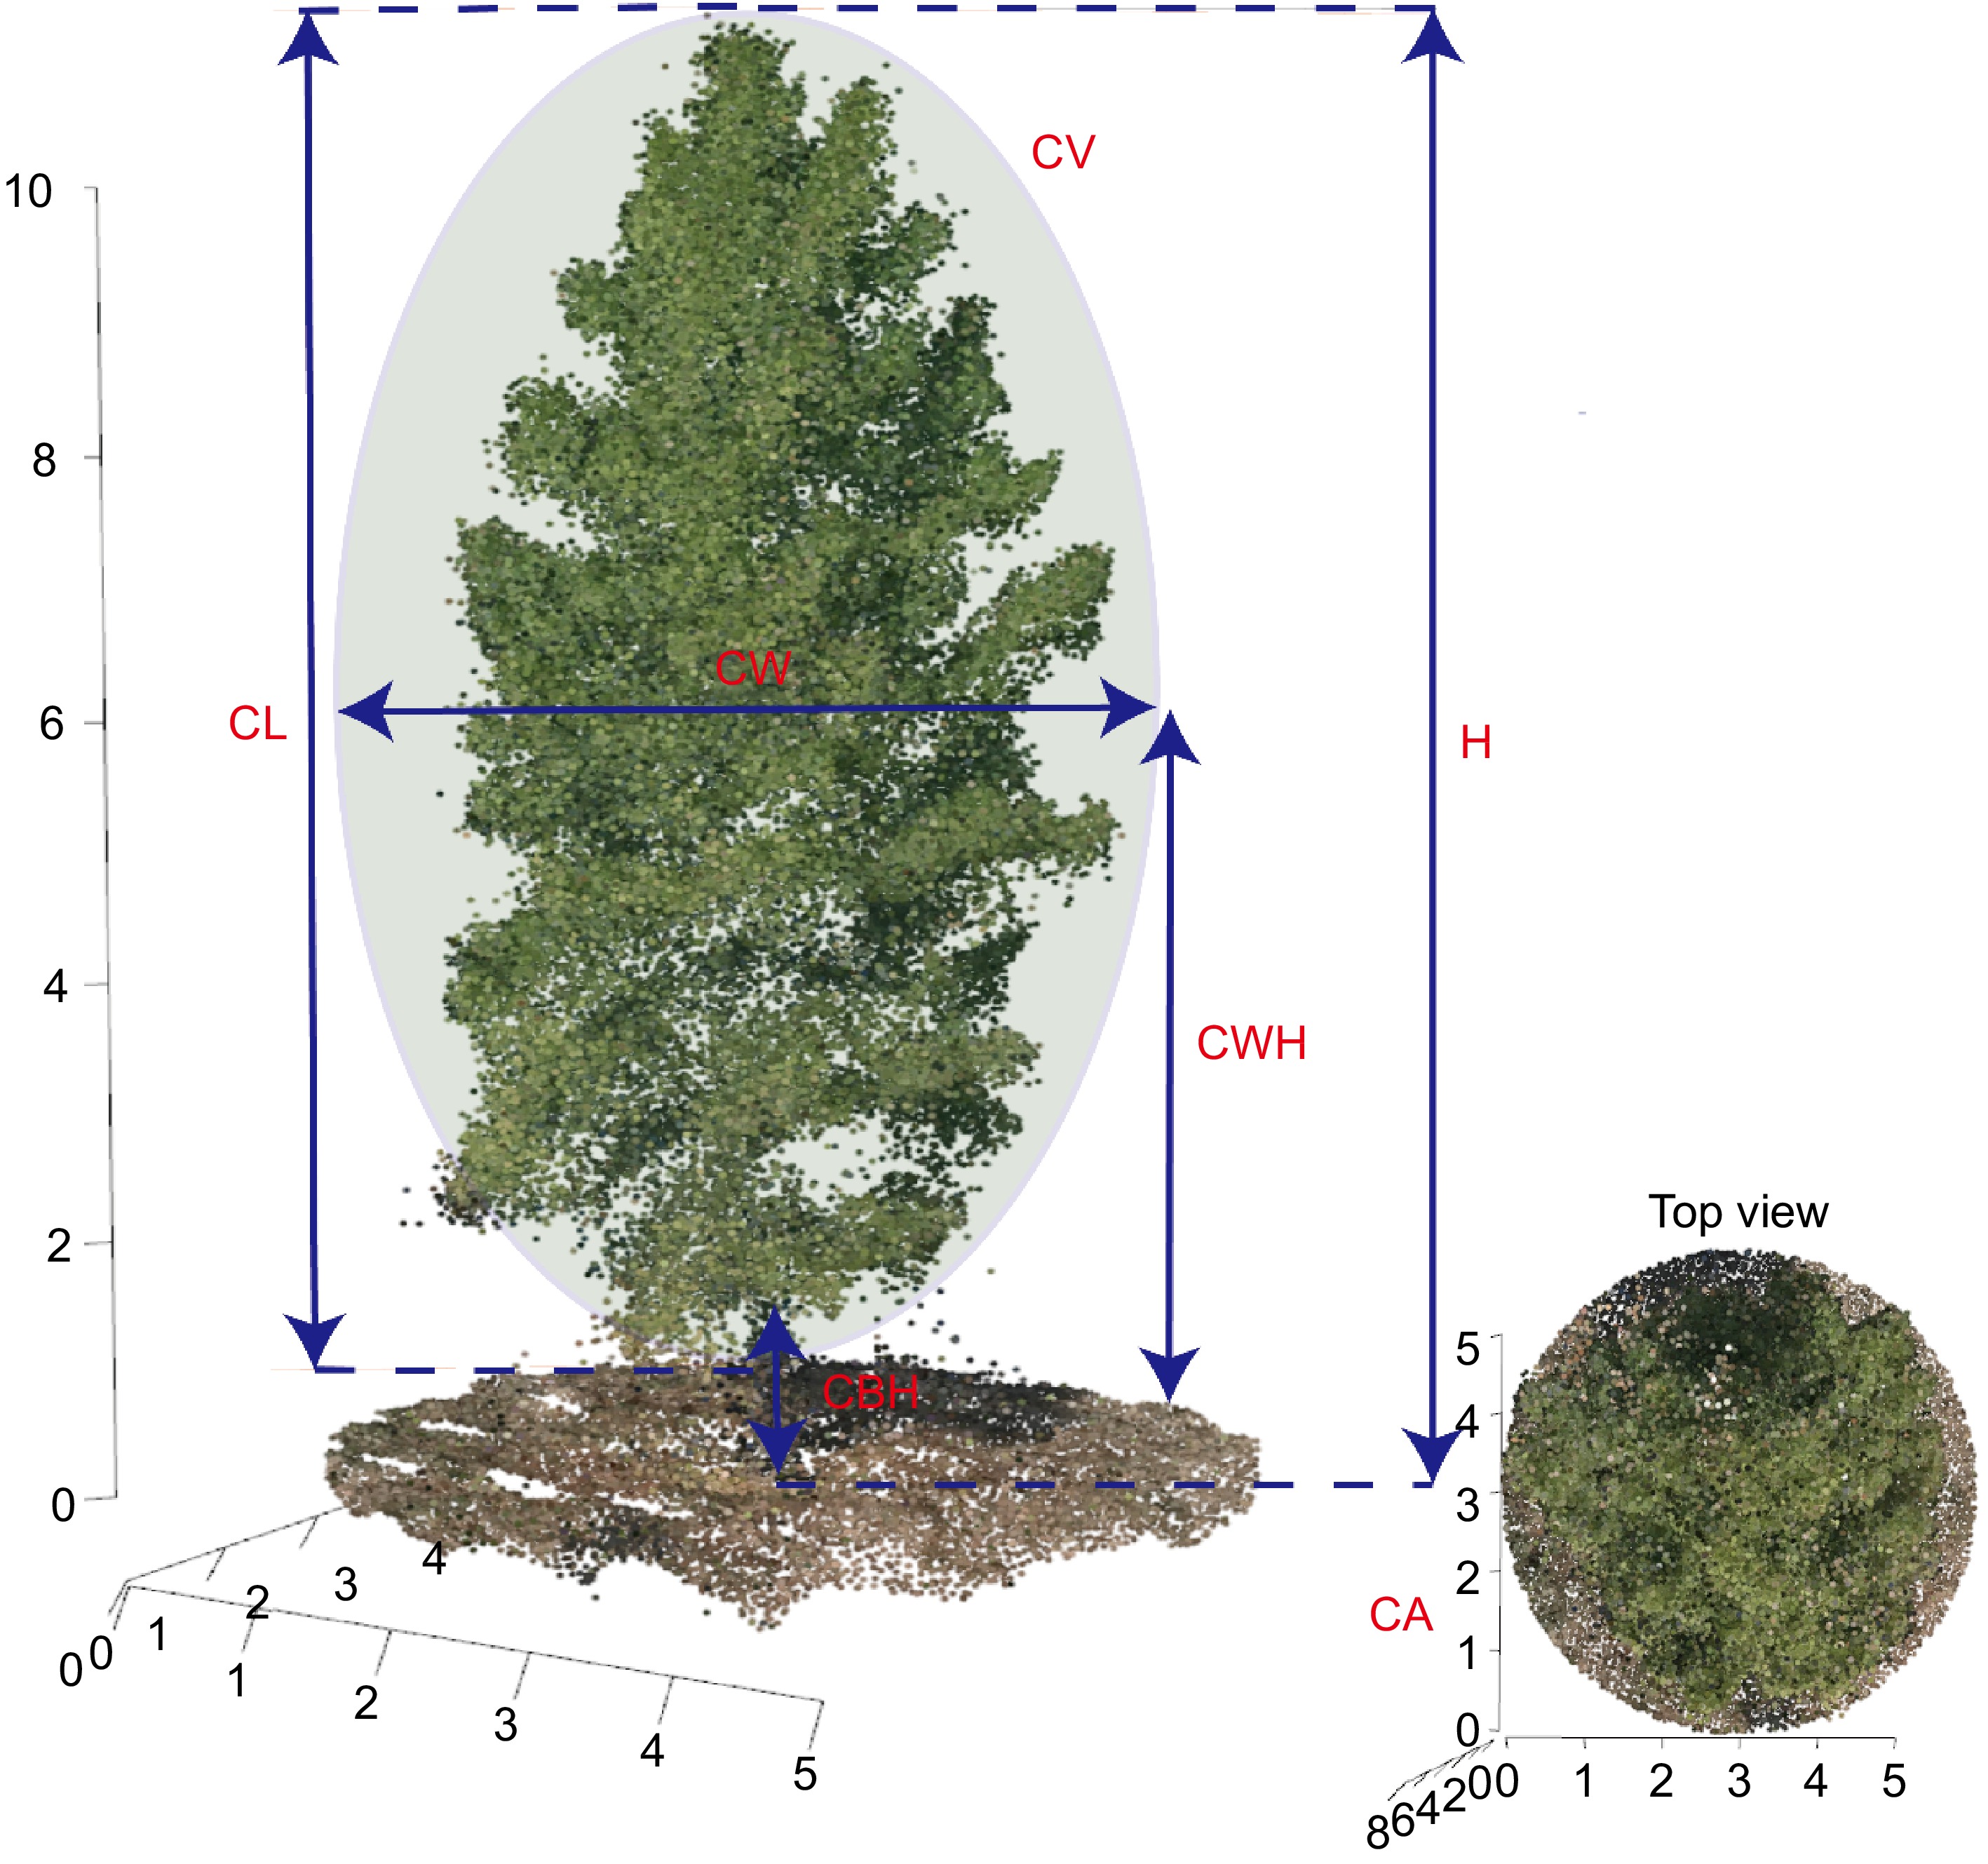
Figure 2.
Diagrammatic representation of morphological trait measurement methods in slash pine using UAV-derived 3D point blouds. CA: canopy area, CBH: crown base height, CL:crown length, CV: canopy volume, CW:crown width, CWH: crown width height, H: tree height.
-
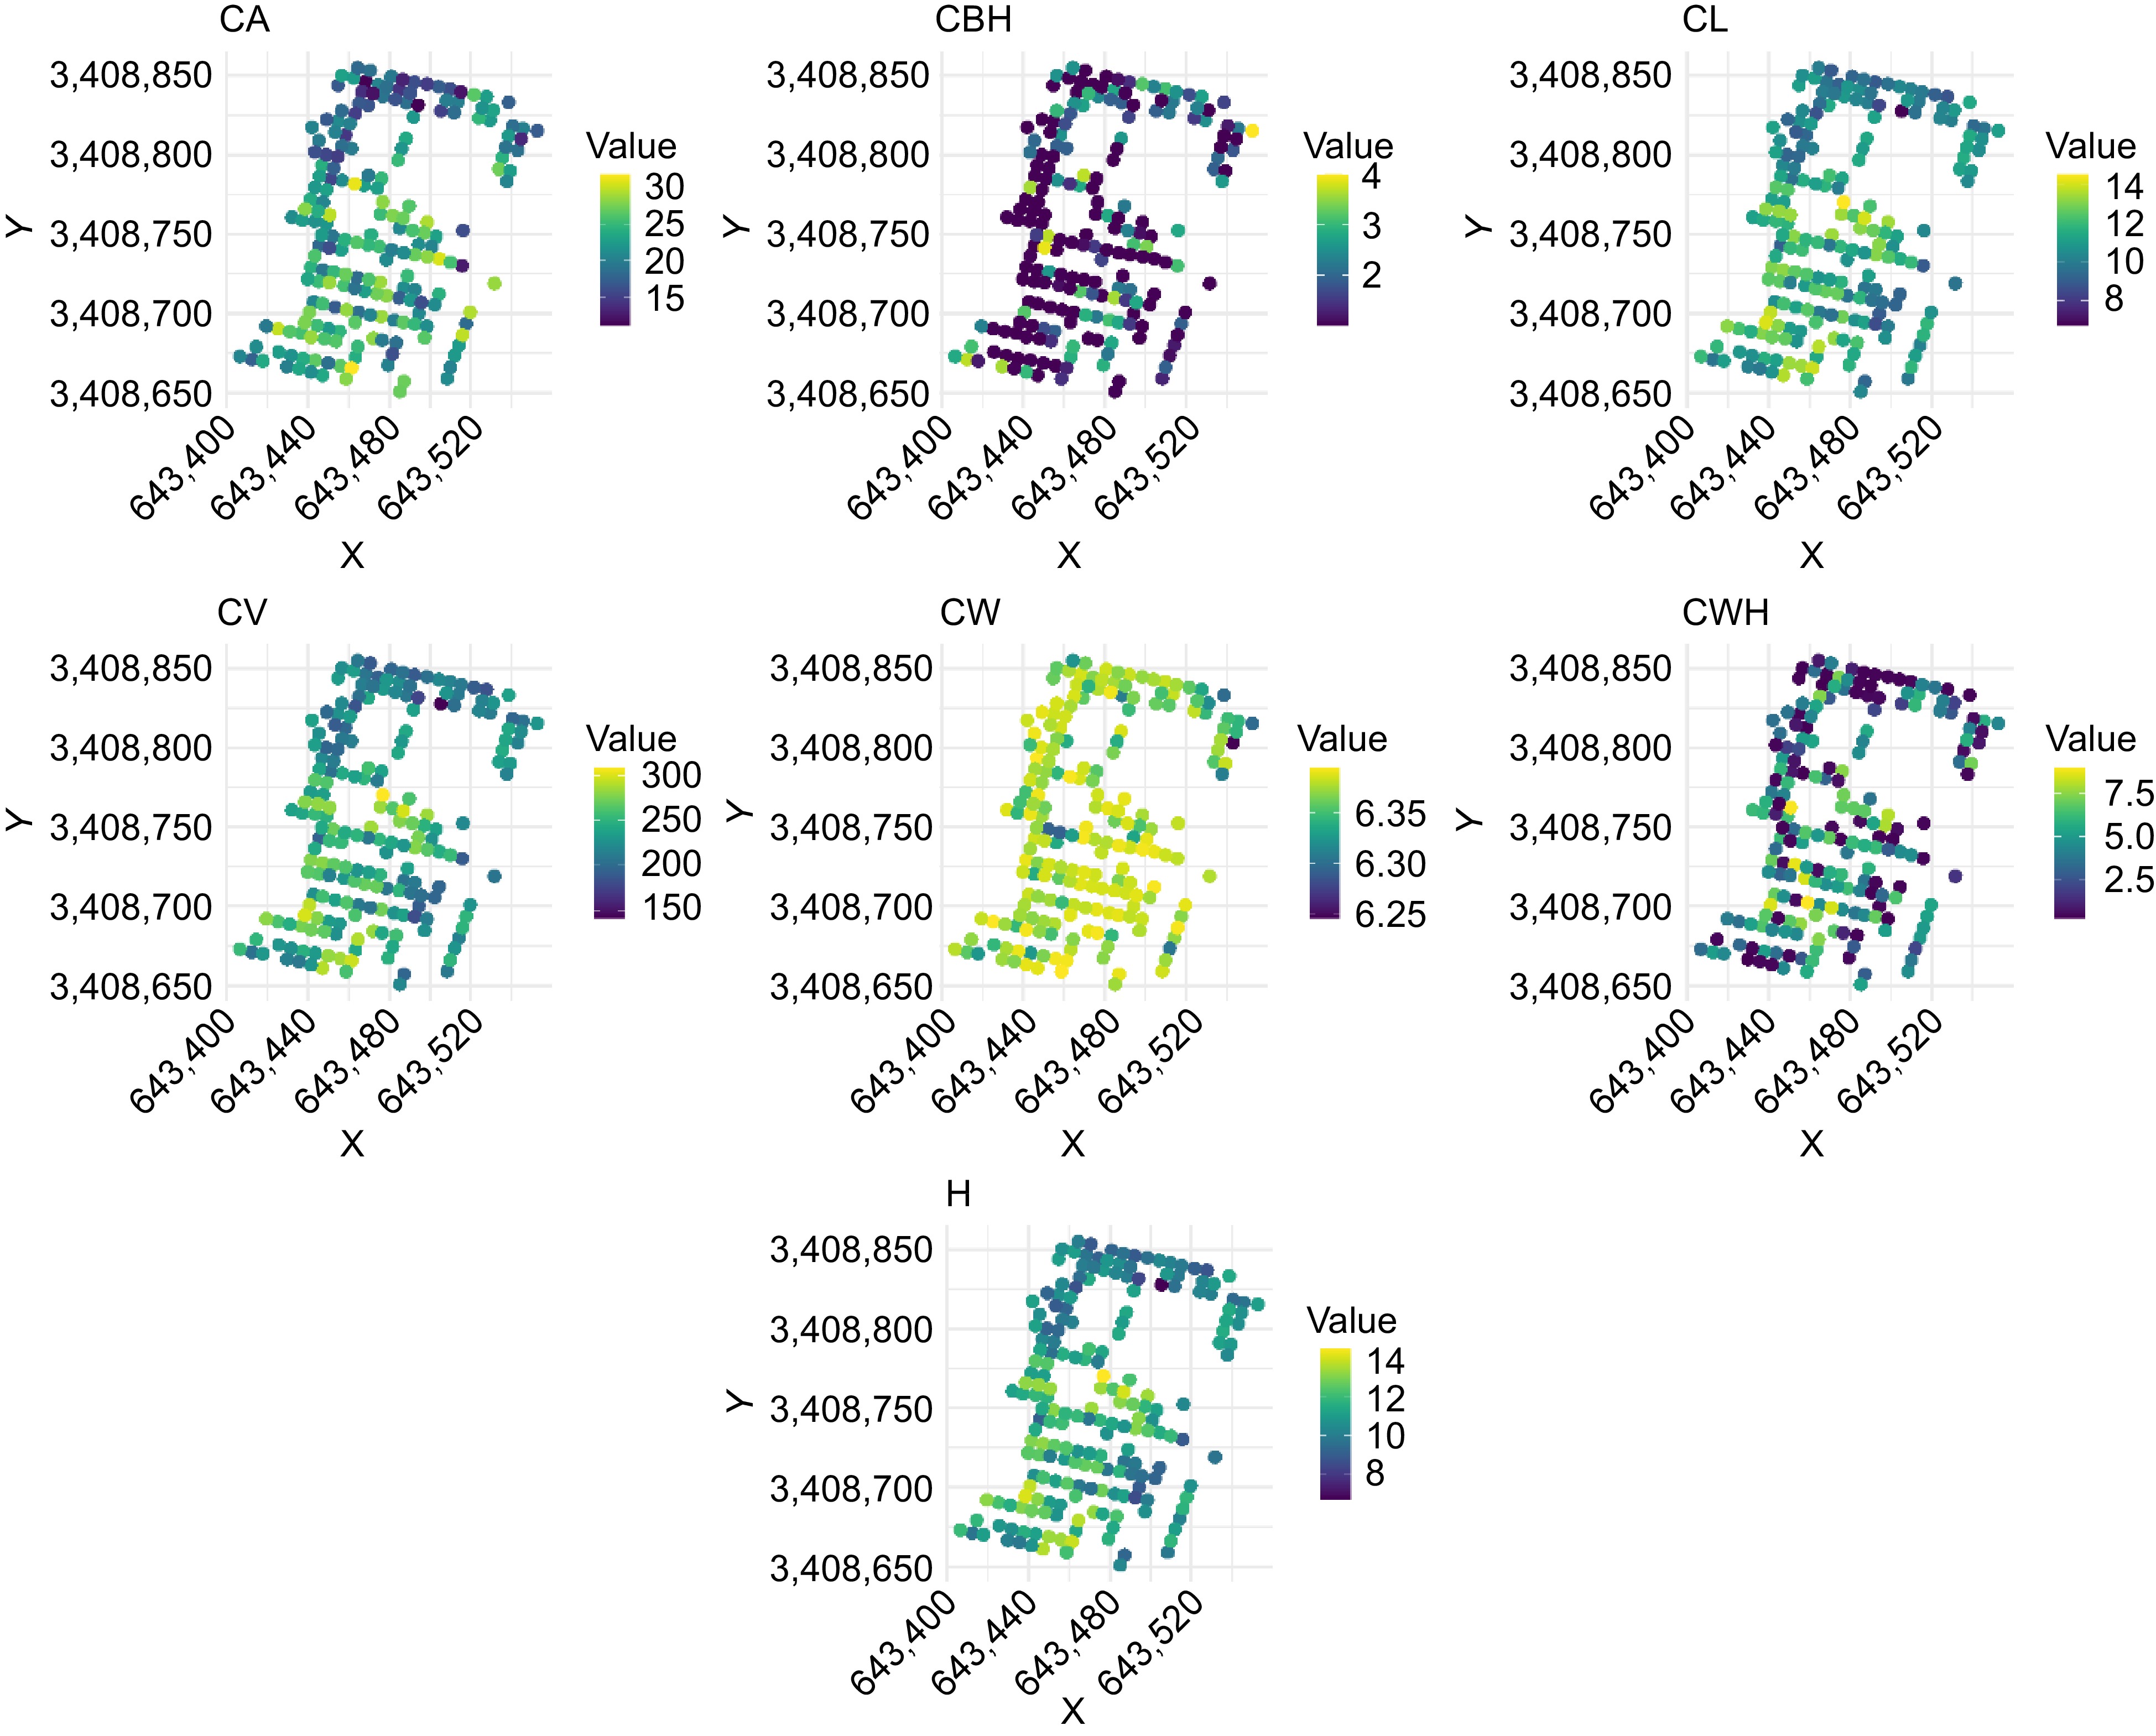
Figure 3.
Spatial distribution of morphological traits in slash pine assessed by UAV-derived phenotyping. CA: canopy area, CBH: crown base height, CL: crown length, CV: canopy volume, CW: crown width, CWH: crown width height, H: tree height.
-
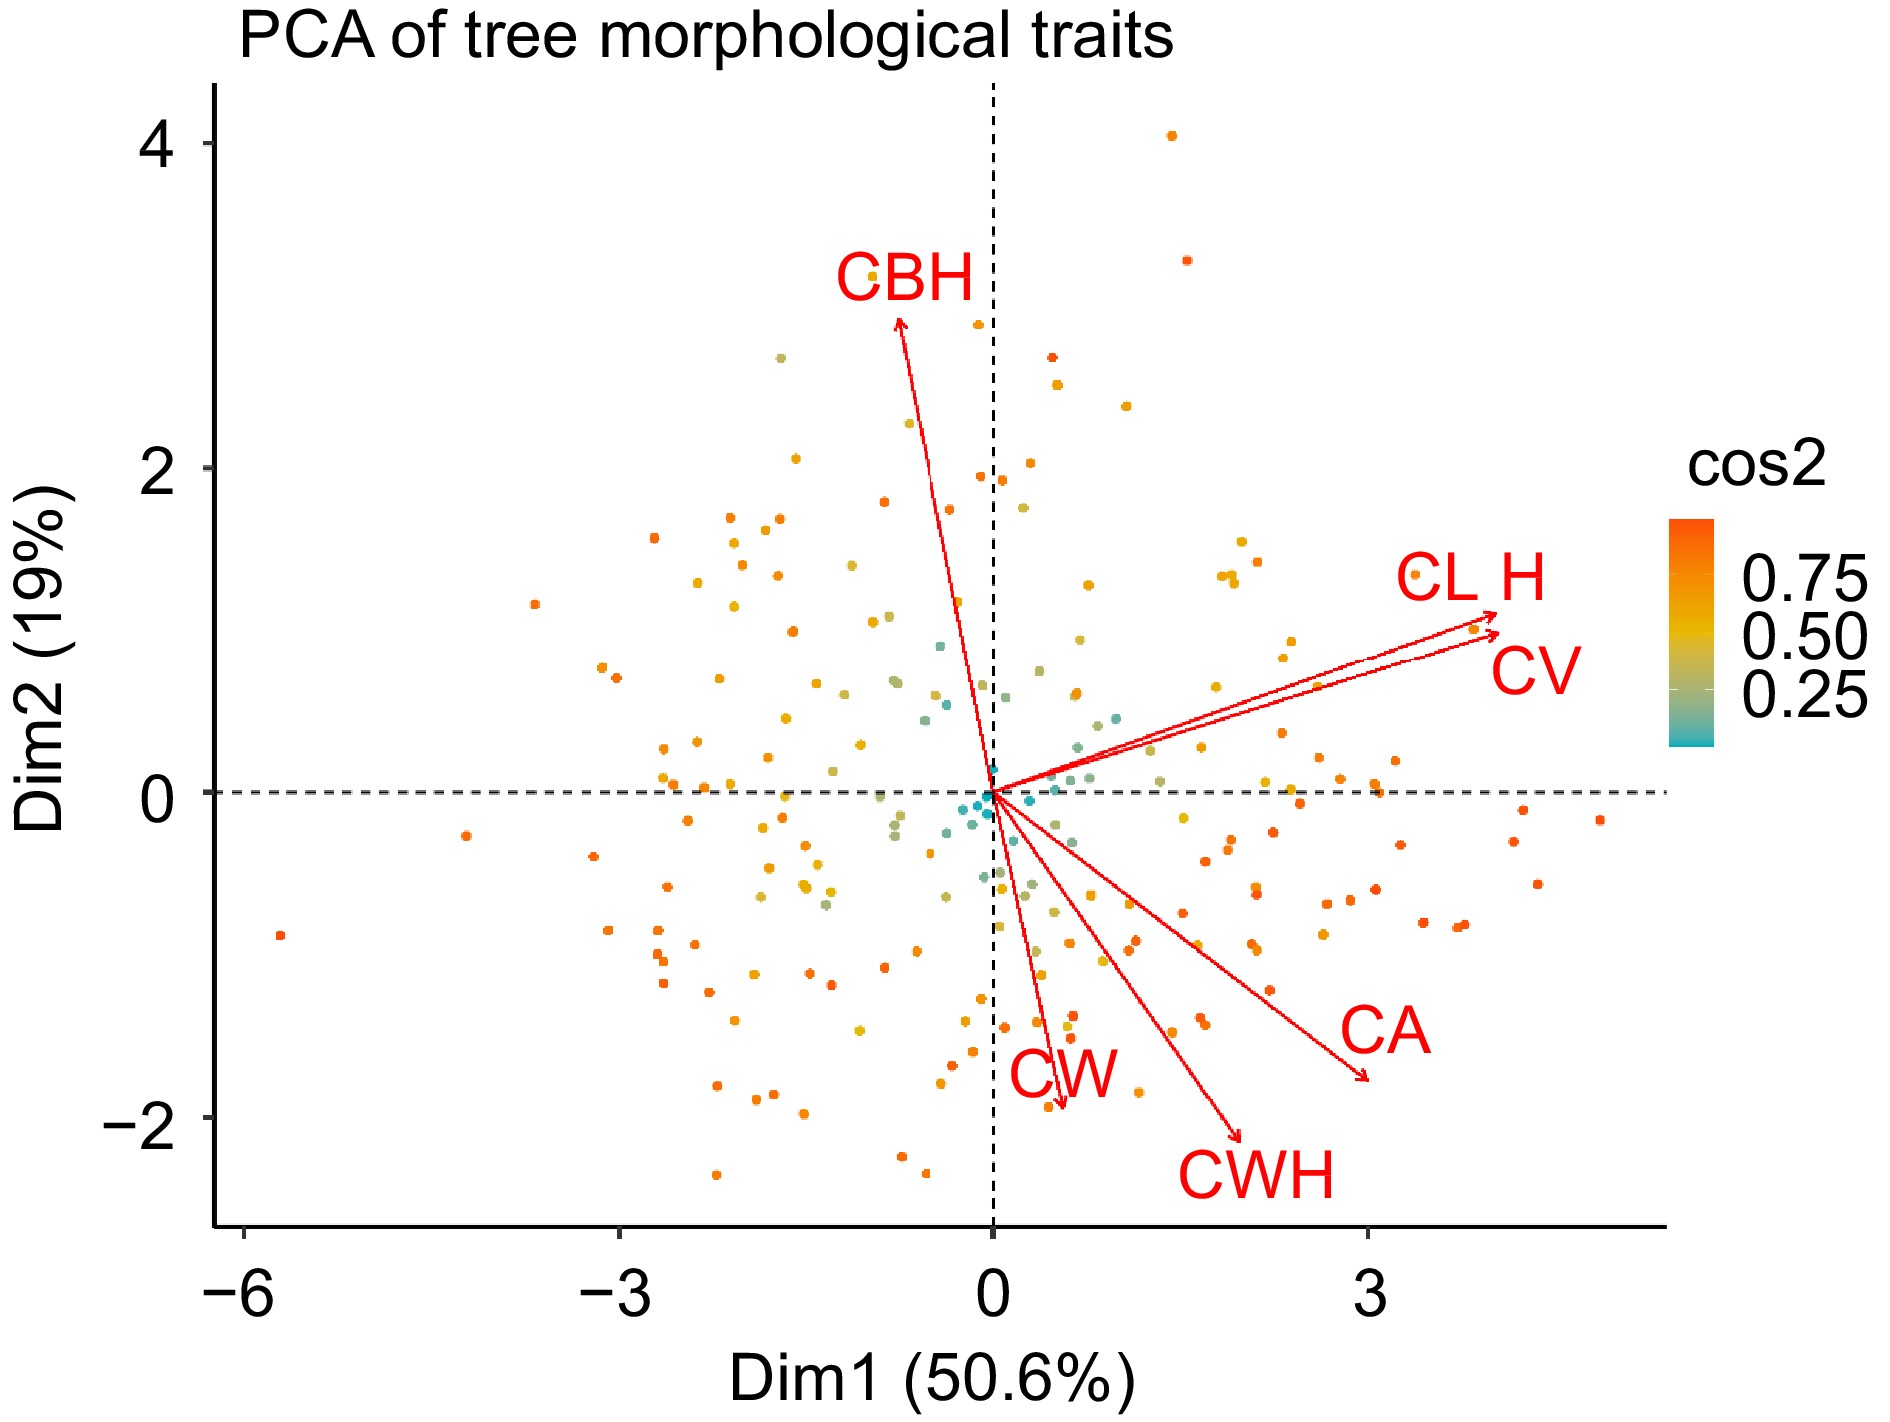
Figure 4.
Principal component analysis of morphological trait covariation in slash pine. Each point represents an individual tree, color-coded according to the cos2 value, which indicates the quality of representation of the tree in the PCA plot. Each arrow indicates the direction and strength of the correlation between the respective morphological trait and the principal components.
-
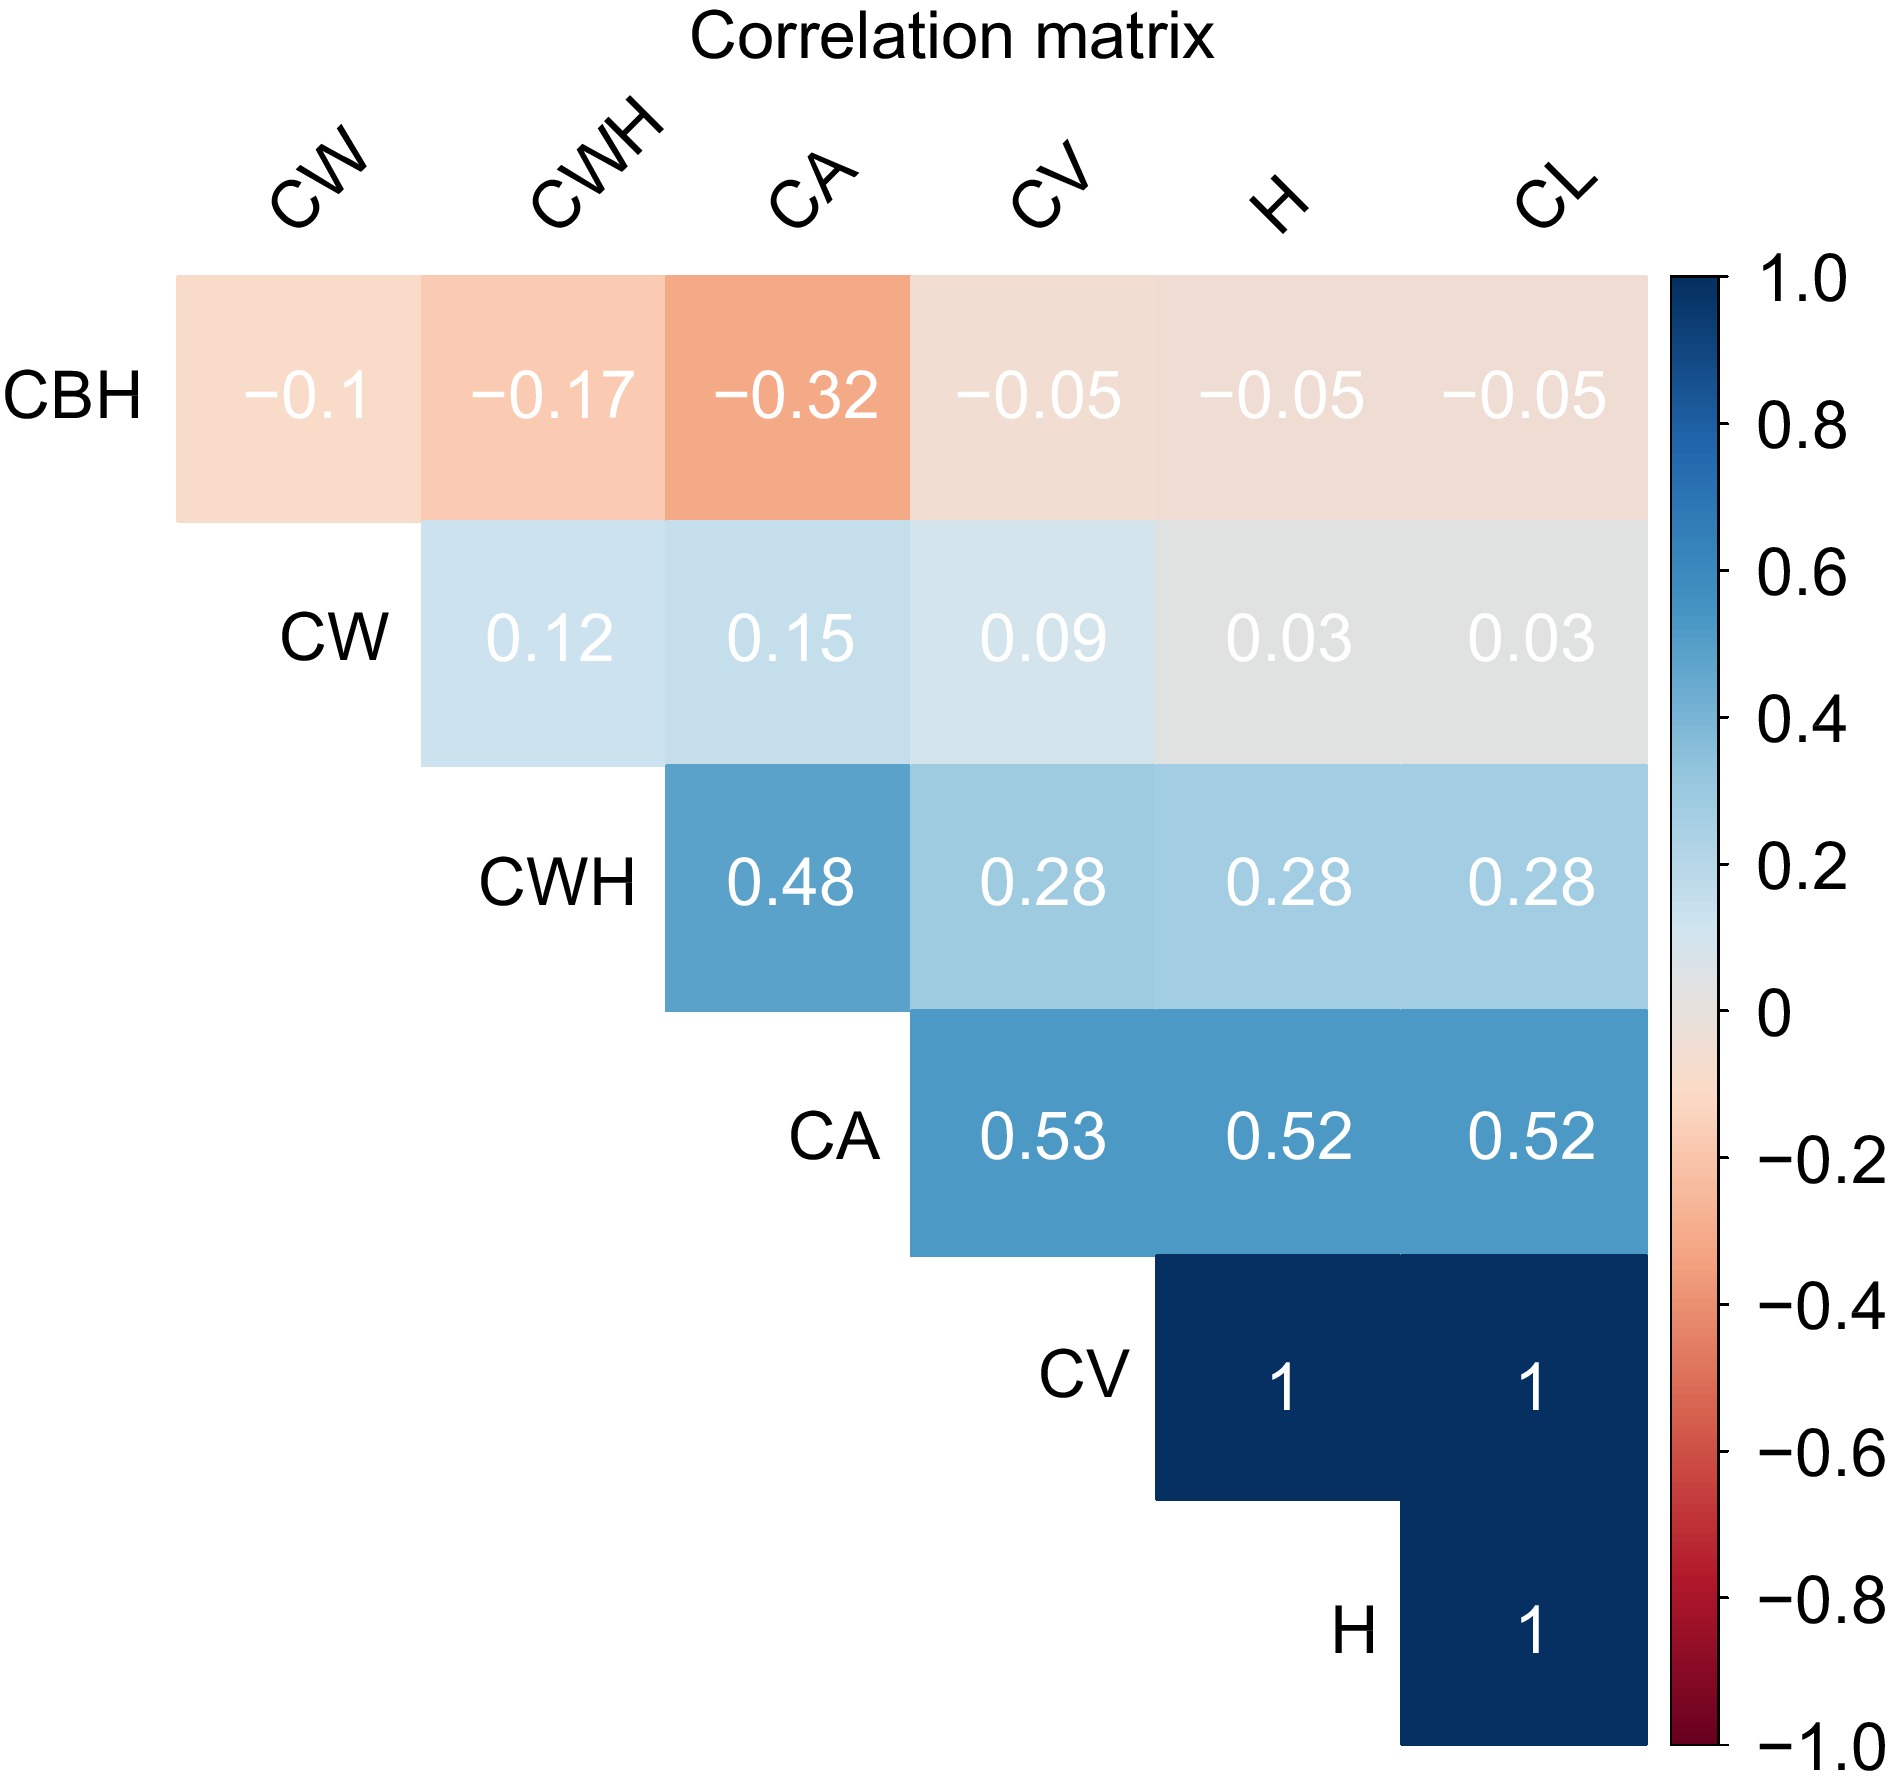
Figure 5.
Correlation heatmap of morphological traits in slash pine. The color intensity and sign of the correlation coefficient values range from −1 to +1, where shades of blue represent positive correlations and shades of red indicate negative correlations. A correlation value of 1 implies a perfect positive relationship, −1 indicates a perfect negative relationship, and 0 denotes no correlation.
-
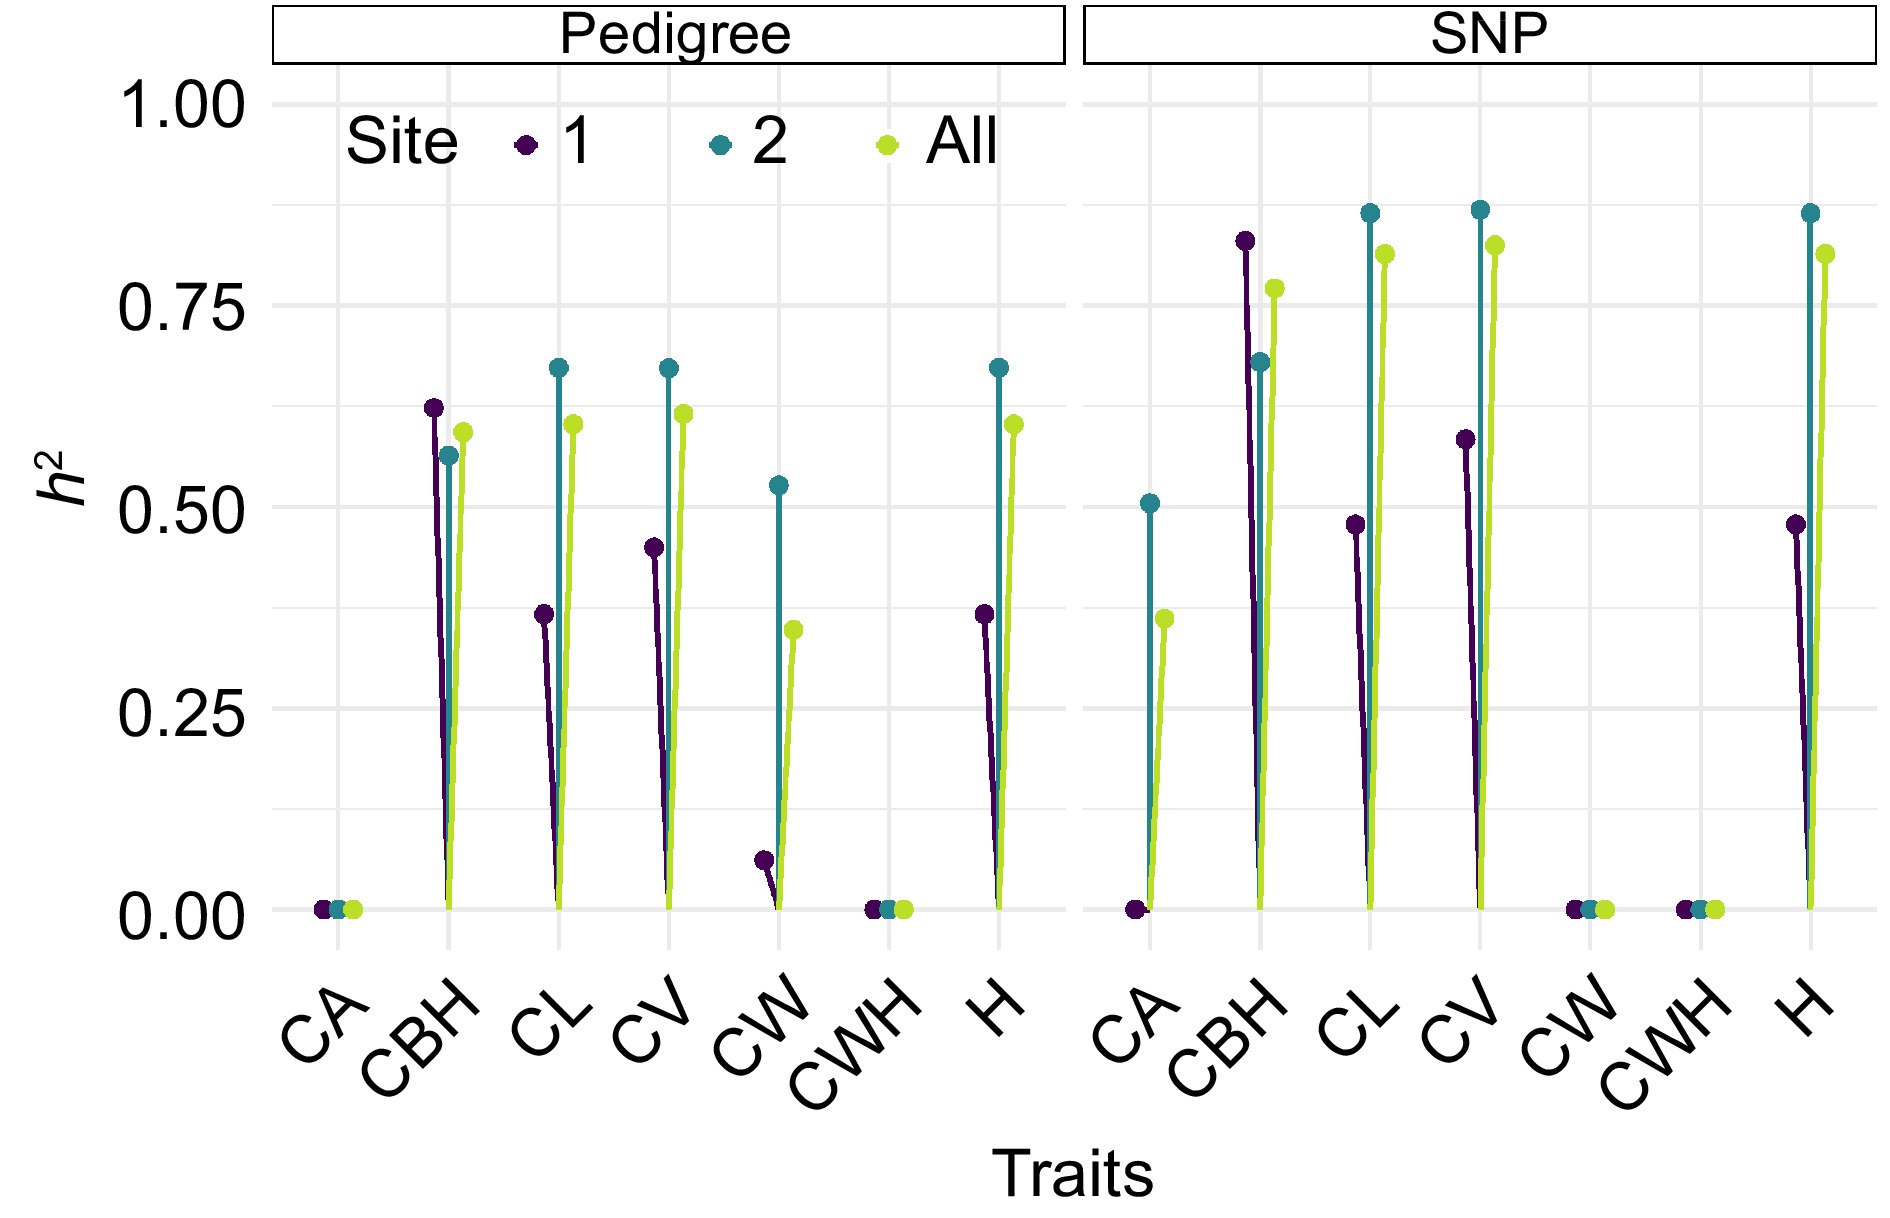
Figure 6.
Comparative heritability estimates of slash pine morphological traits using pedigree and SNP data, The vertical lines with colored dots at the end represent the heritability estimates for each trait at different sites. The color of the dots corresponds to different sites, with dark purple indicating Site 1, teal representing Site 2, and yellow green denoting the pooled data across all sites.
-
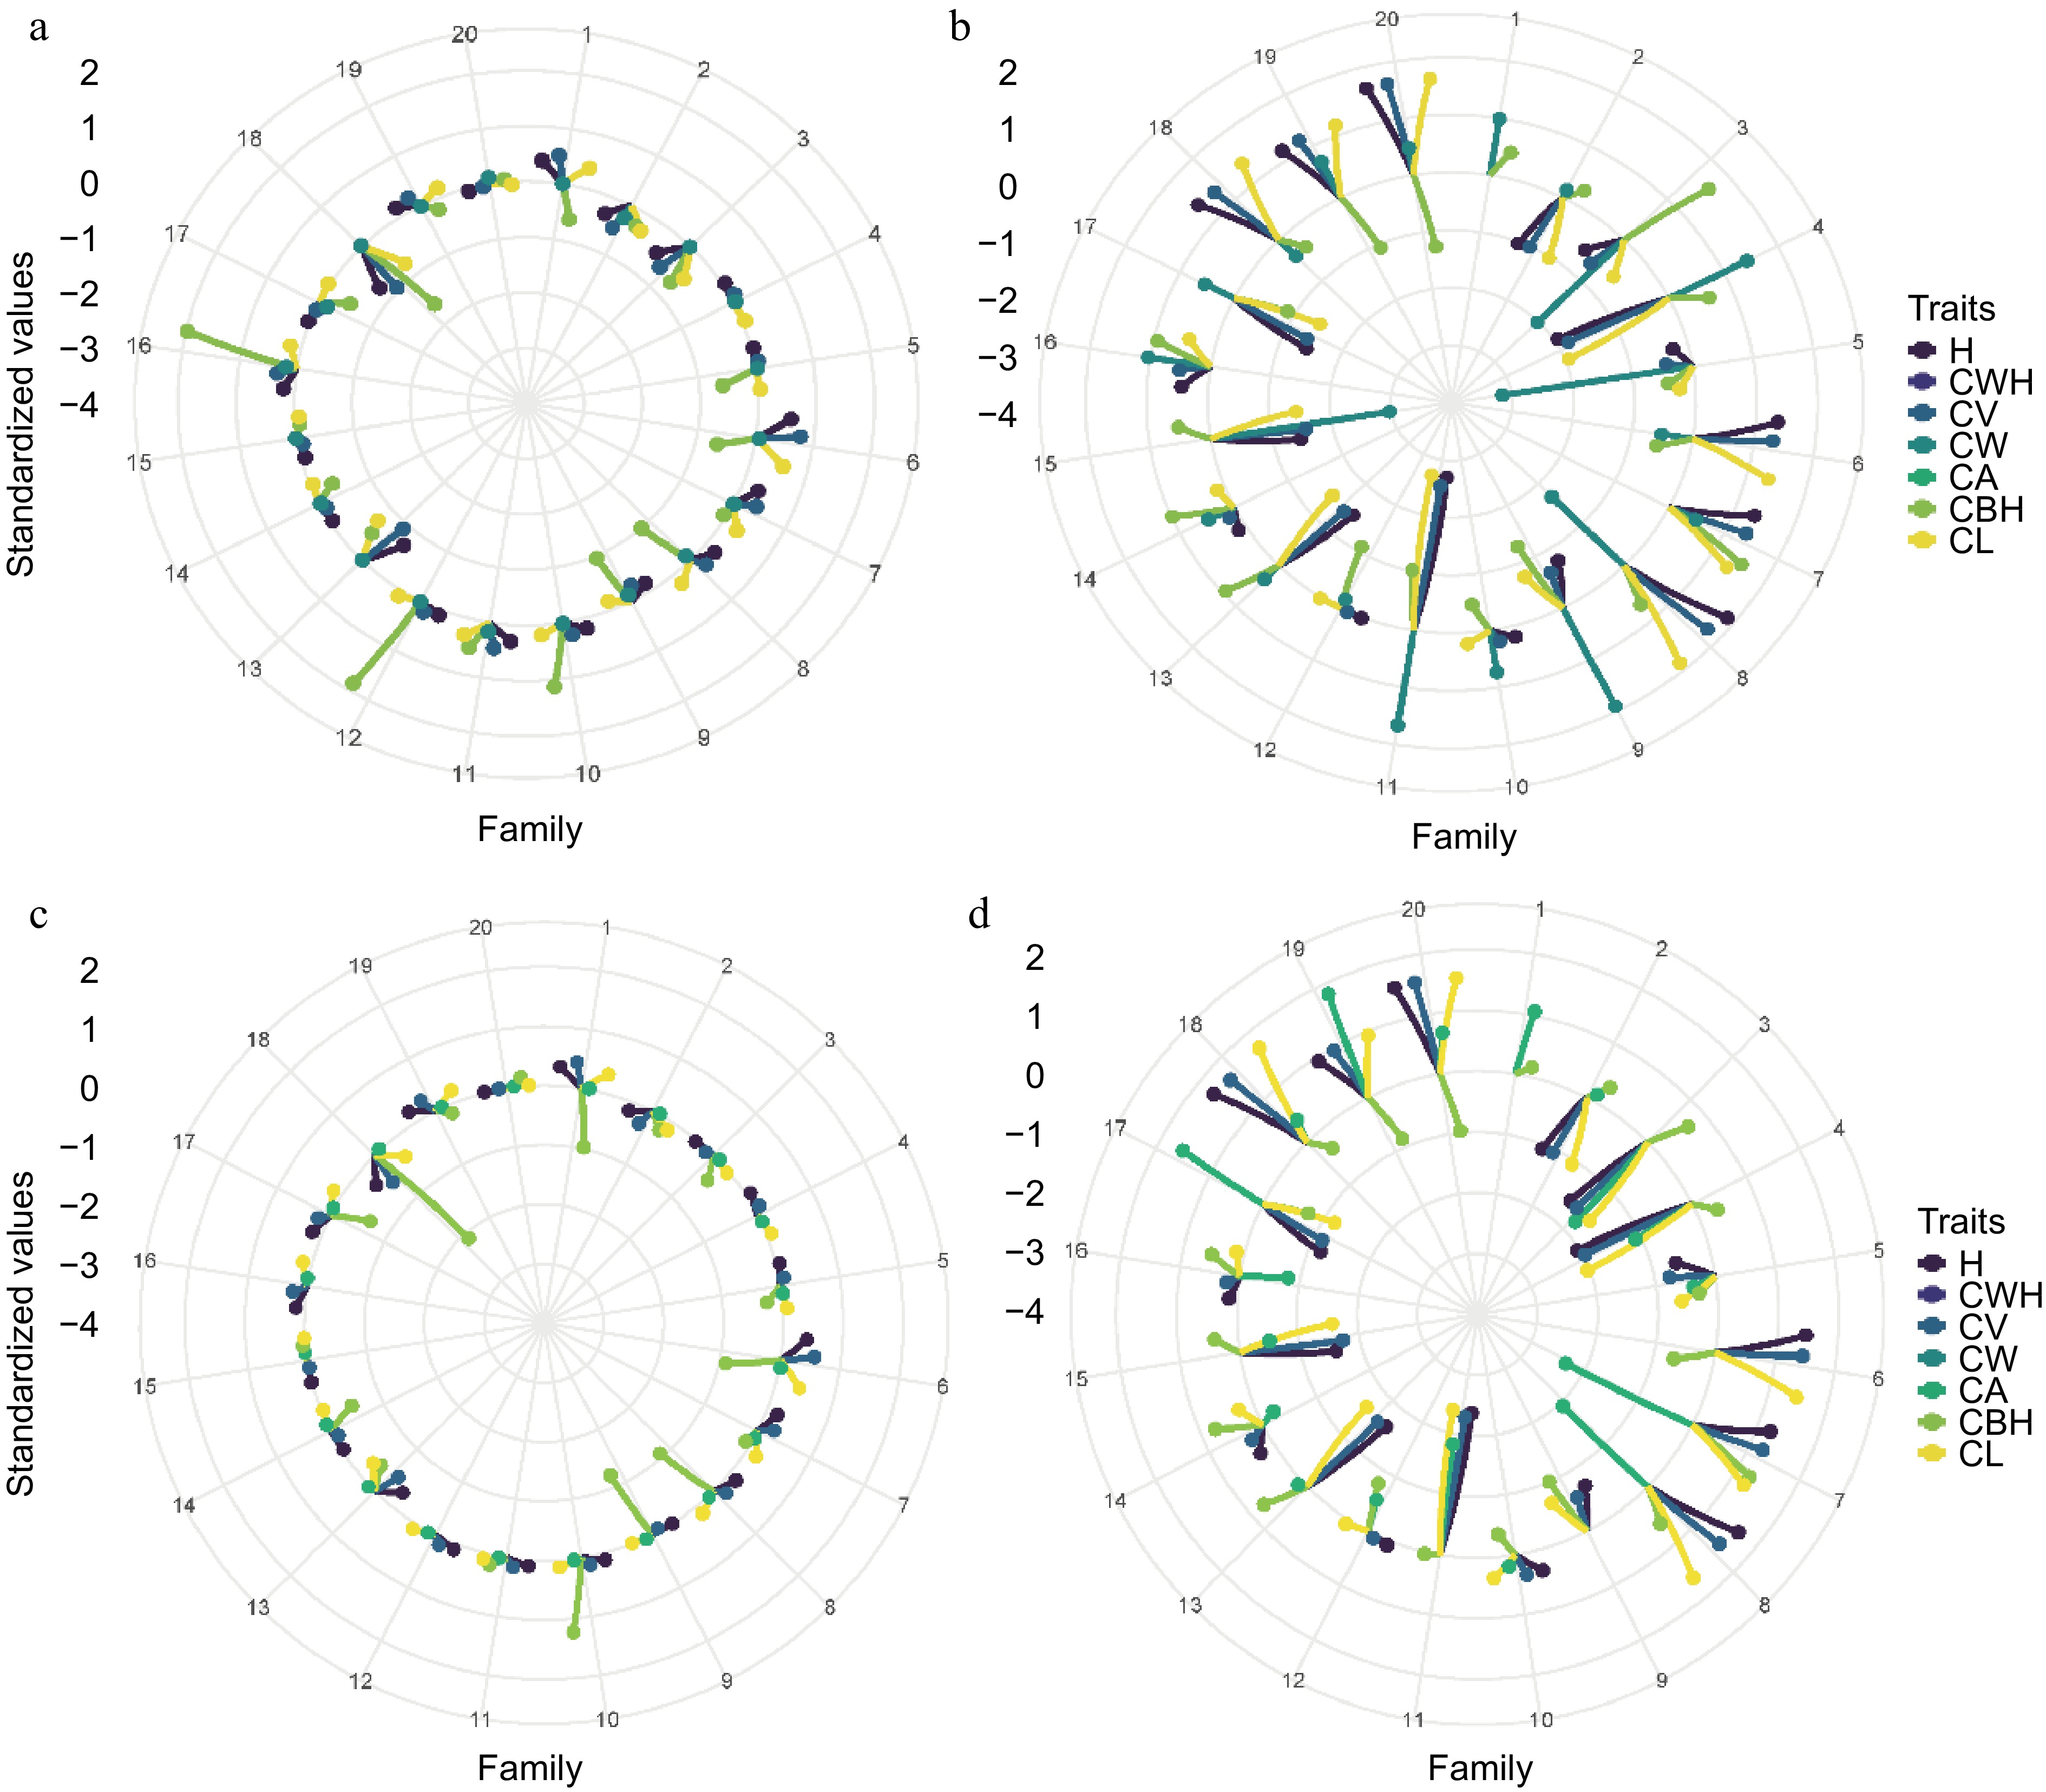
Figure 7.
Comparative analysis of pedigree and SNP-based breeding values for morphological traits in slash pine across two sites. (a) Pedigree-based in Site 1, (b) pedigree-based in Site 2, (c) SNP-based in Site 1, (d) SNP-based in Site 2.
-
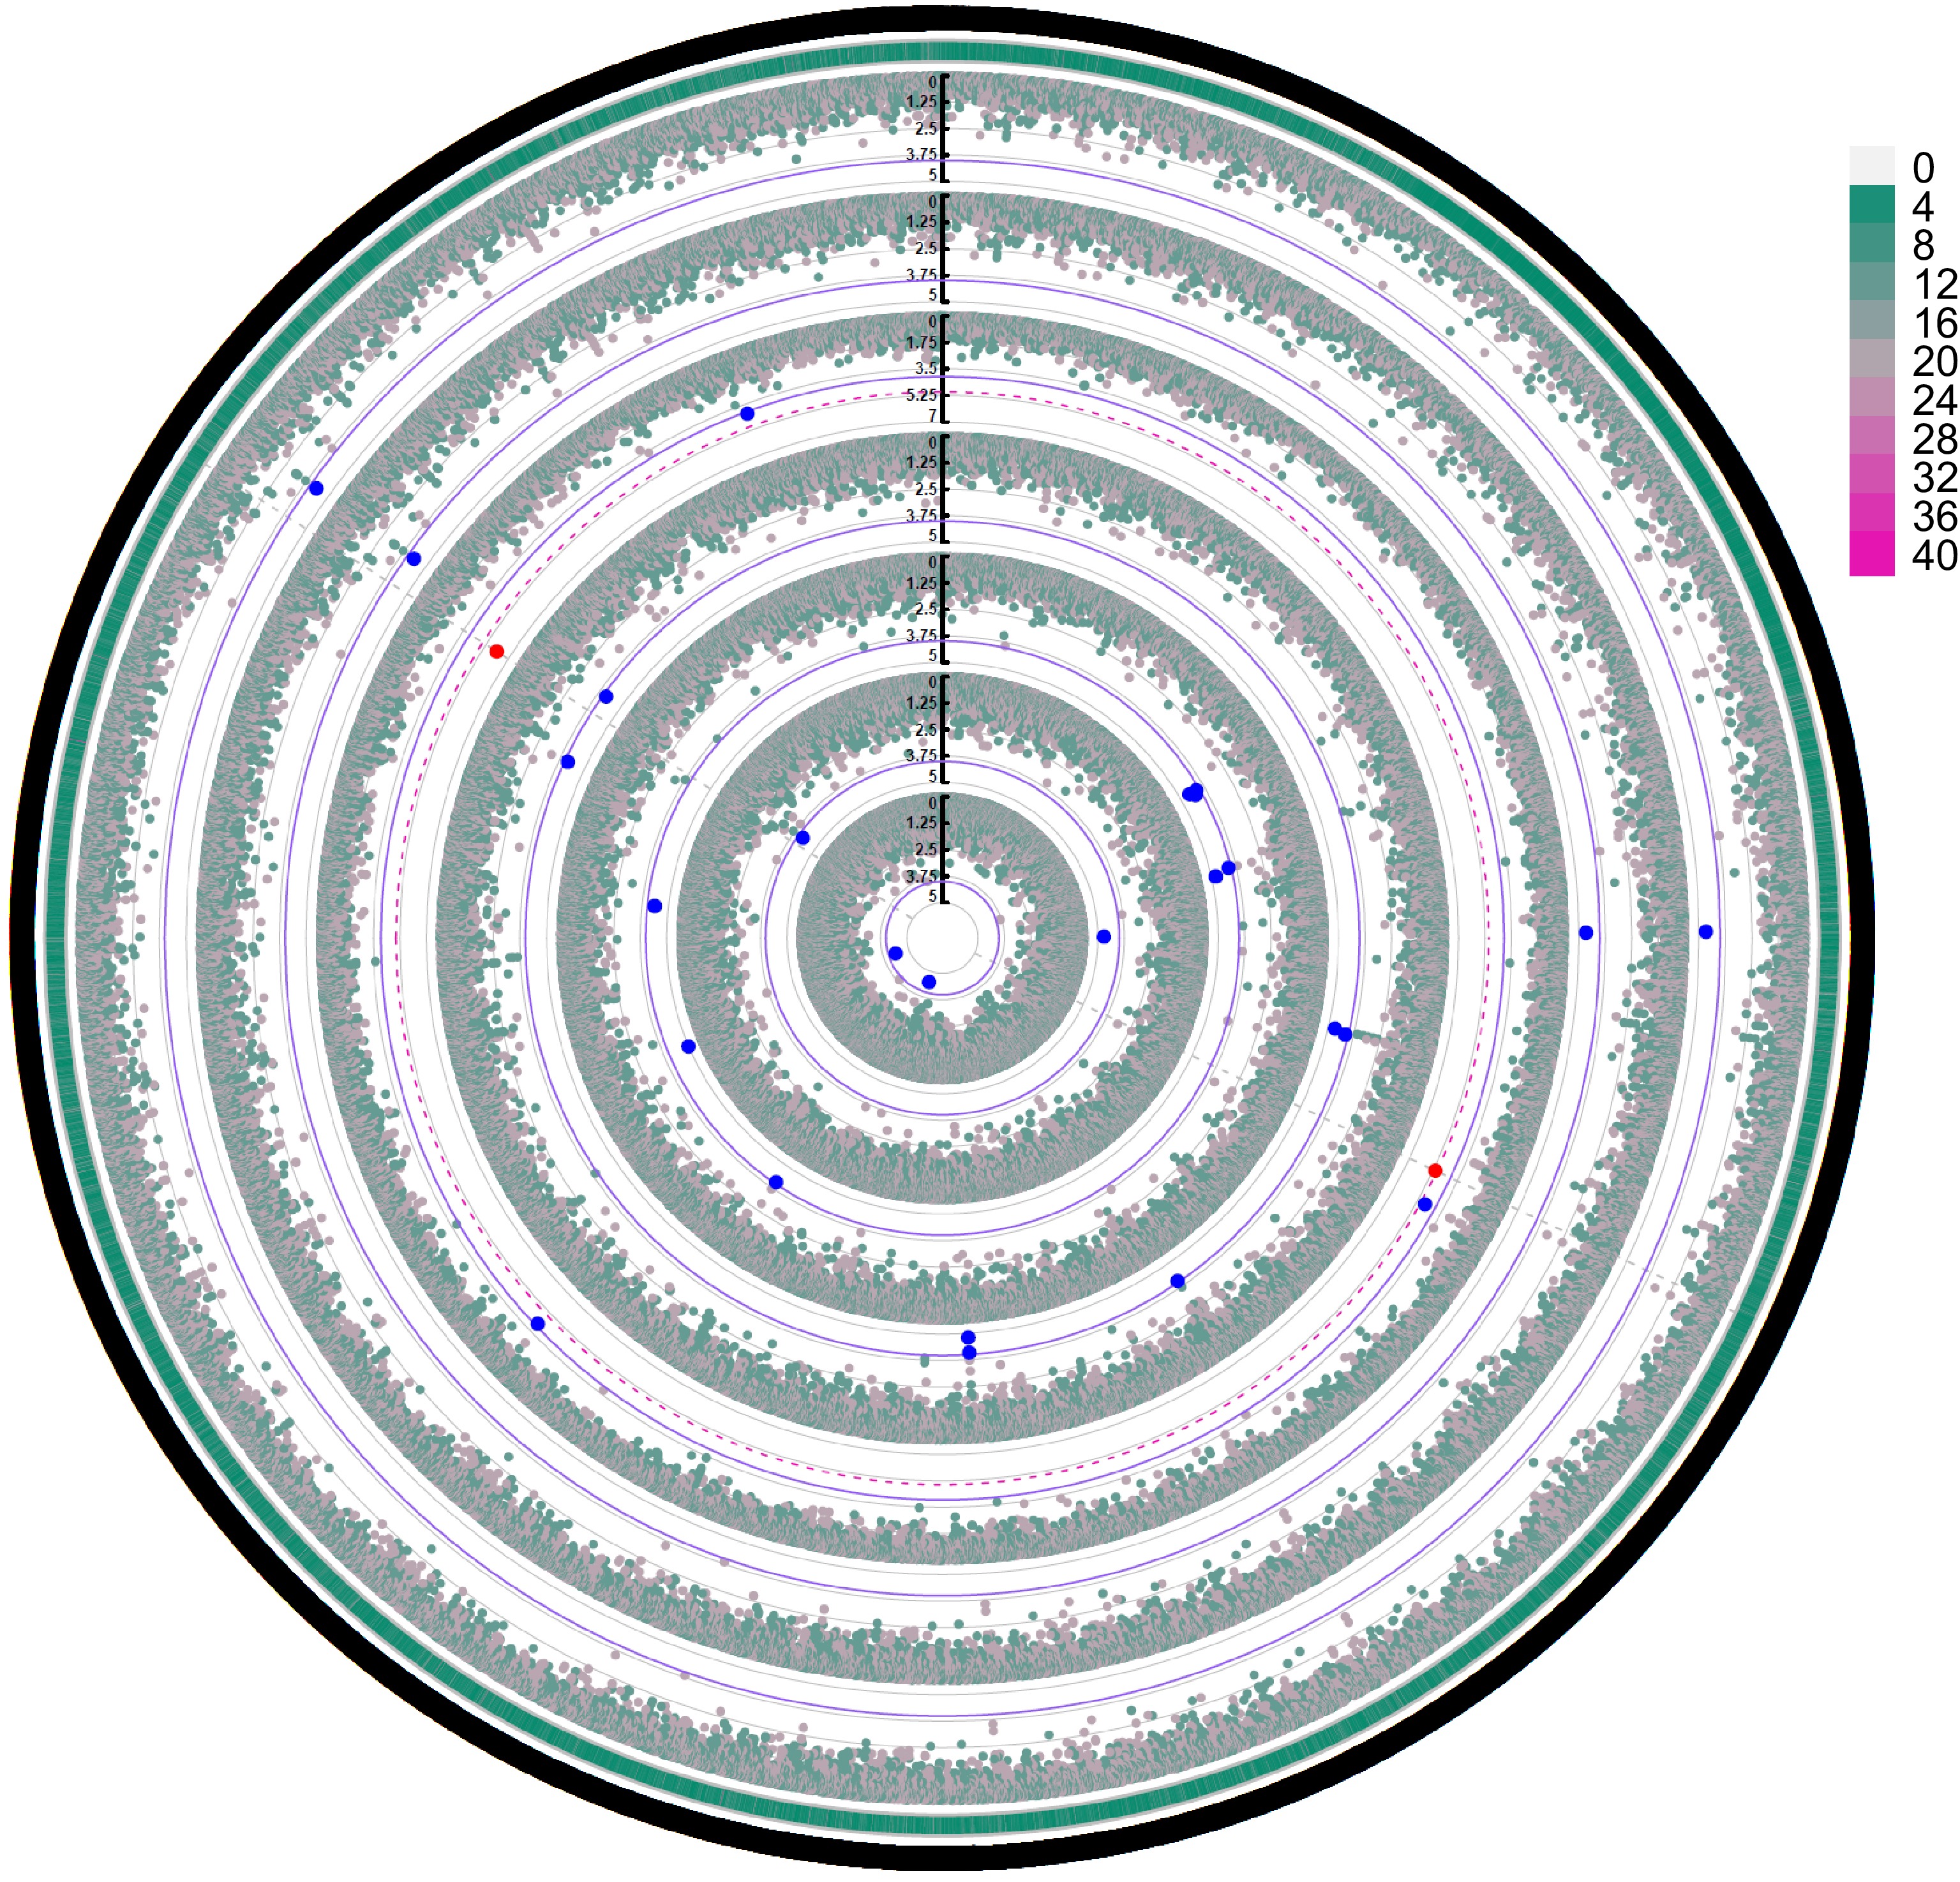
Figure 8.
GWAS of the performance of the seven growth traits (from inner to outer: CWH, CV, CW, CA, CBH, CL, H) of slash pine in 2023. The outermost circle represents SNP density, and the grade division is indicated in the legend. Blue dots represent SNP loci reaching a significant association level (α < 0.05), and red dots represent SNP loci reaching a highly significant association level (α < 0.01). The thin purple solid circle lines and red dashed circle lines indicate threshold lines for significant associations with different phenotypes at α < 0.05 and α < 0.01 levels, respectively. The gray solid circle lines correspond to the tick marks of the vertical axis. Only the red significant SNPs identified at the α < 0.01 level are marked by gray dotted lines distributed vertically.
-
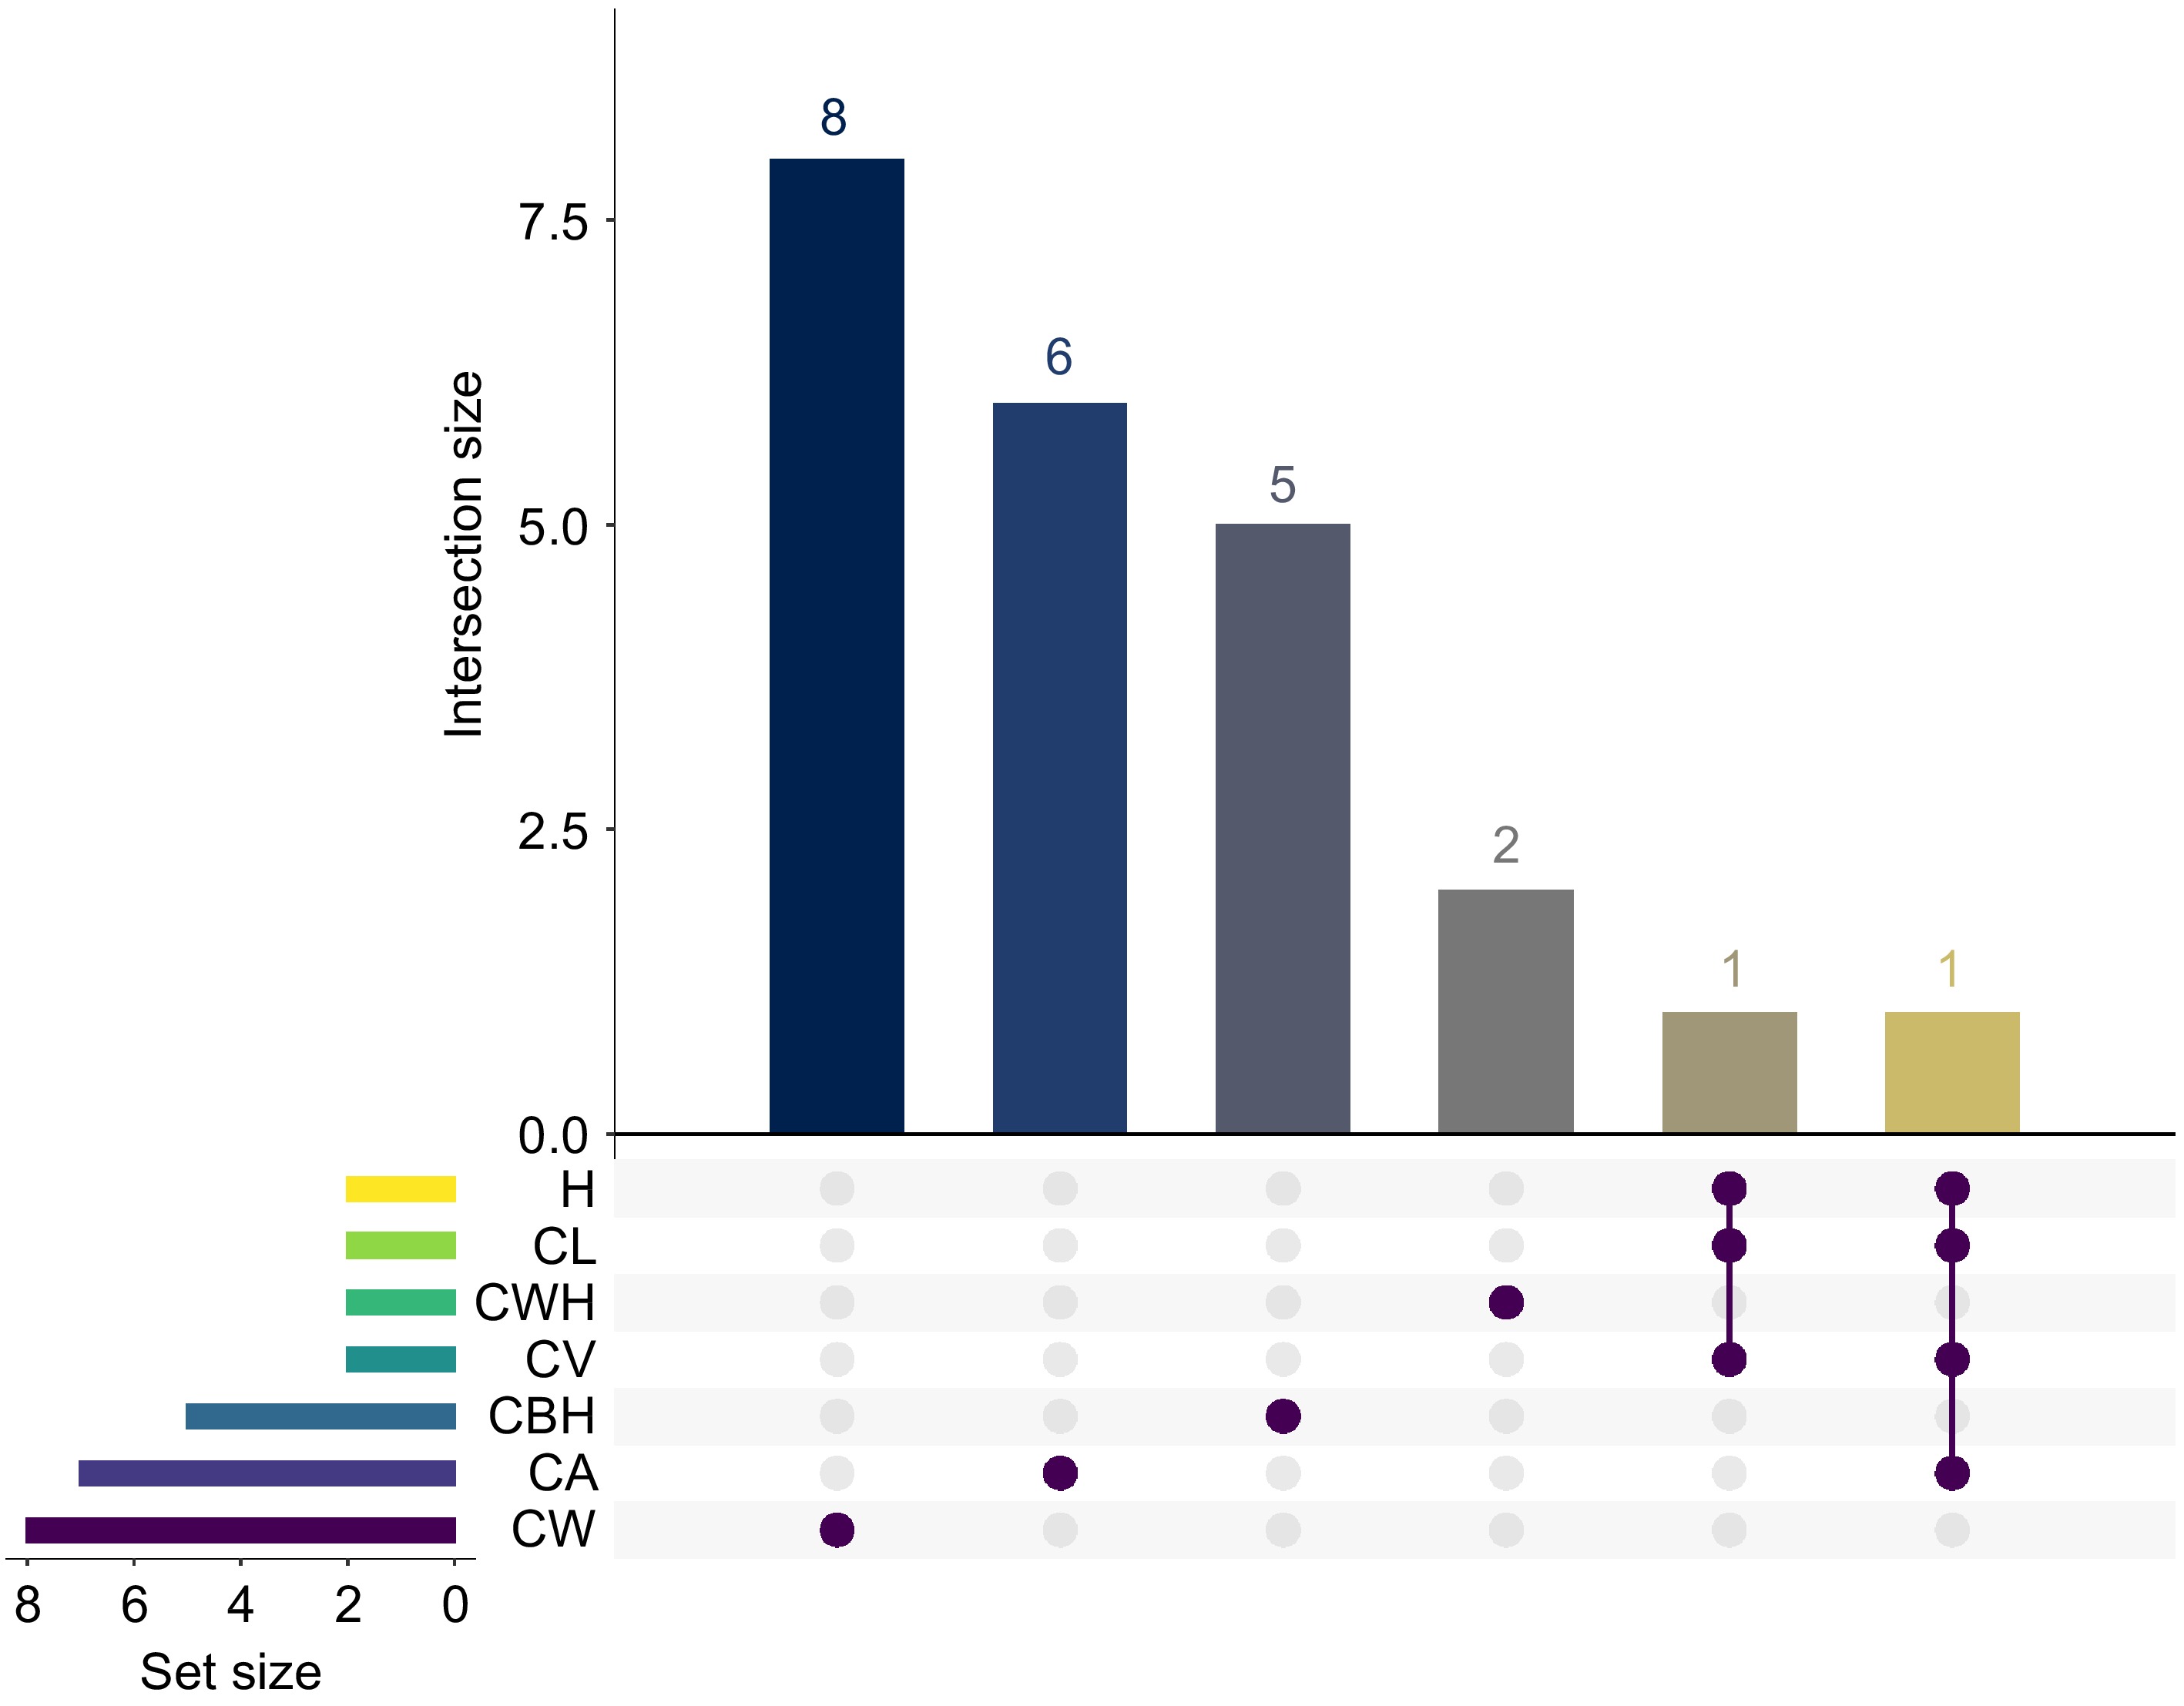
Figure 9.
The UpSet plot shows the number of significant GWAS SNP loci for seven traits (CWH, CV, CW, CA, CBH, CL, and H). The matrix plot at the bottom of the UpSet plot shows the intersection conditions between different sets, with each row representing a set and each column representing an intersection combination. The brown dots indicate that the intersection combination includes the set in the corresponding row. The bar graph above the matrix plot shows the number of SNP loci in each trait combination. Set Size refers to the number of SNP loci in each individual group being represented.
-
Trait SNPa Geneb Allelec Effectd Gene function CWH scaffold22007_82420 PITA_34108 C > T missenset Neurofilament heavy polypeptide-like scafold44702_108111 − − − − CV scaffold114212_305642 PITA_24813 A > T missense Ubiquitin family scaffold78970_13765 PITA_16597 G >A downstream_gene PAR1 protein CA scaffold124904_157642 PITA_04981 A >G synonymous Fe2OG dioxygenase domain-containing protein scaffold125333_242817 PITA_17436 A > C downstream_gene KH domain scaffold165935_108445 PITA_23370 T > C downstream_gene − scaffold200020_15423 PITA_24554 C > G missense Ethylene-responsive element binding factor scaffold200020_15465 PITA_24554 G >A missense Ethylene-responsive element binding factor scaffold71840_181523 − G > A intergenic − scaffold78970_13765 PITA_16597 G > A downstream PAR1 protein CW Gene.216560_1274 Gene.216560 G > A missense Putative DEAD-like helicase Gene.216560_1286 Gene.216560 A > G missense Putative DEAD-like helicase Gene.22986_174 Gene.22986 T > C synonymous Twinkle homolog protein, chloroplastic/mitochondrial isoform X2 scaffold10289_45294 PITA_04230 A > C synonymous Peptide N-acetyl-beta-D-glucosaminyl asparaginase amidase A scaffold103964_286446 − C > T intergenic − scaffold230610_125905 PITA_01330 G > A downstream Hsp20/alpha crystallin family scaffold41862_112441 PITA_00750 G > T intron Zinc finger protein CONSTANS-LIKE 6 scaffold59196_160287 PITA_40818 T > C intergenic Arogenate dehydrogenase 2 CBH scaffold136313_20762 PITA_21834 G > A missense Two-component response regulator ORR22 scaffold139188_163347 PITA_38848 G > C upstream Annexin scaffold29915_108204 − T > C intergenic − scaffold76835_129711 − A > G intergenic − super3003_478531 PITA_04633 G > A downstream MFS domain-containing protein H scaffold114212_305642 PITA_24813 A > C missense Ubiquitin family scaffold78970_13765 PITA_16597 G > A downstream PAR1 protein CL scaffold114212_305642 PITA_24813 A > C missense Ubiquitin family scaffold78970_13765 PITA_16597 G > A downstream PAR1 protein aThe number after '_' represents the SNP position on the corresponding unigene or scaffold; bdepending on the location of the SNP, it is annotated with the corresponding unigene or the gene corresponding to the scaffold; cthe first nucleotide is the reference nucleotide, and the second nucleotide is the nucleotide following the substitution event. dthe annotation of the SNP, i.e. where the mutation occurred. Table 1.
Information for 23 canditate genes with 28 significant SNPs that were annotated as growth-related.
Figures
(9)
Tables
(1)