-
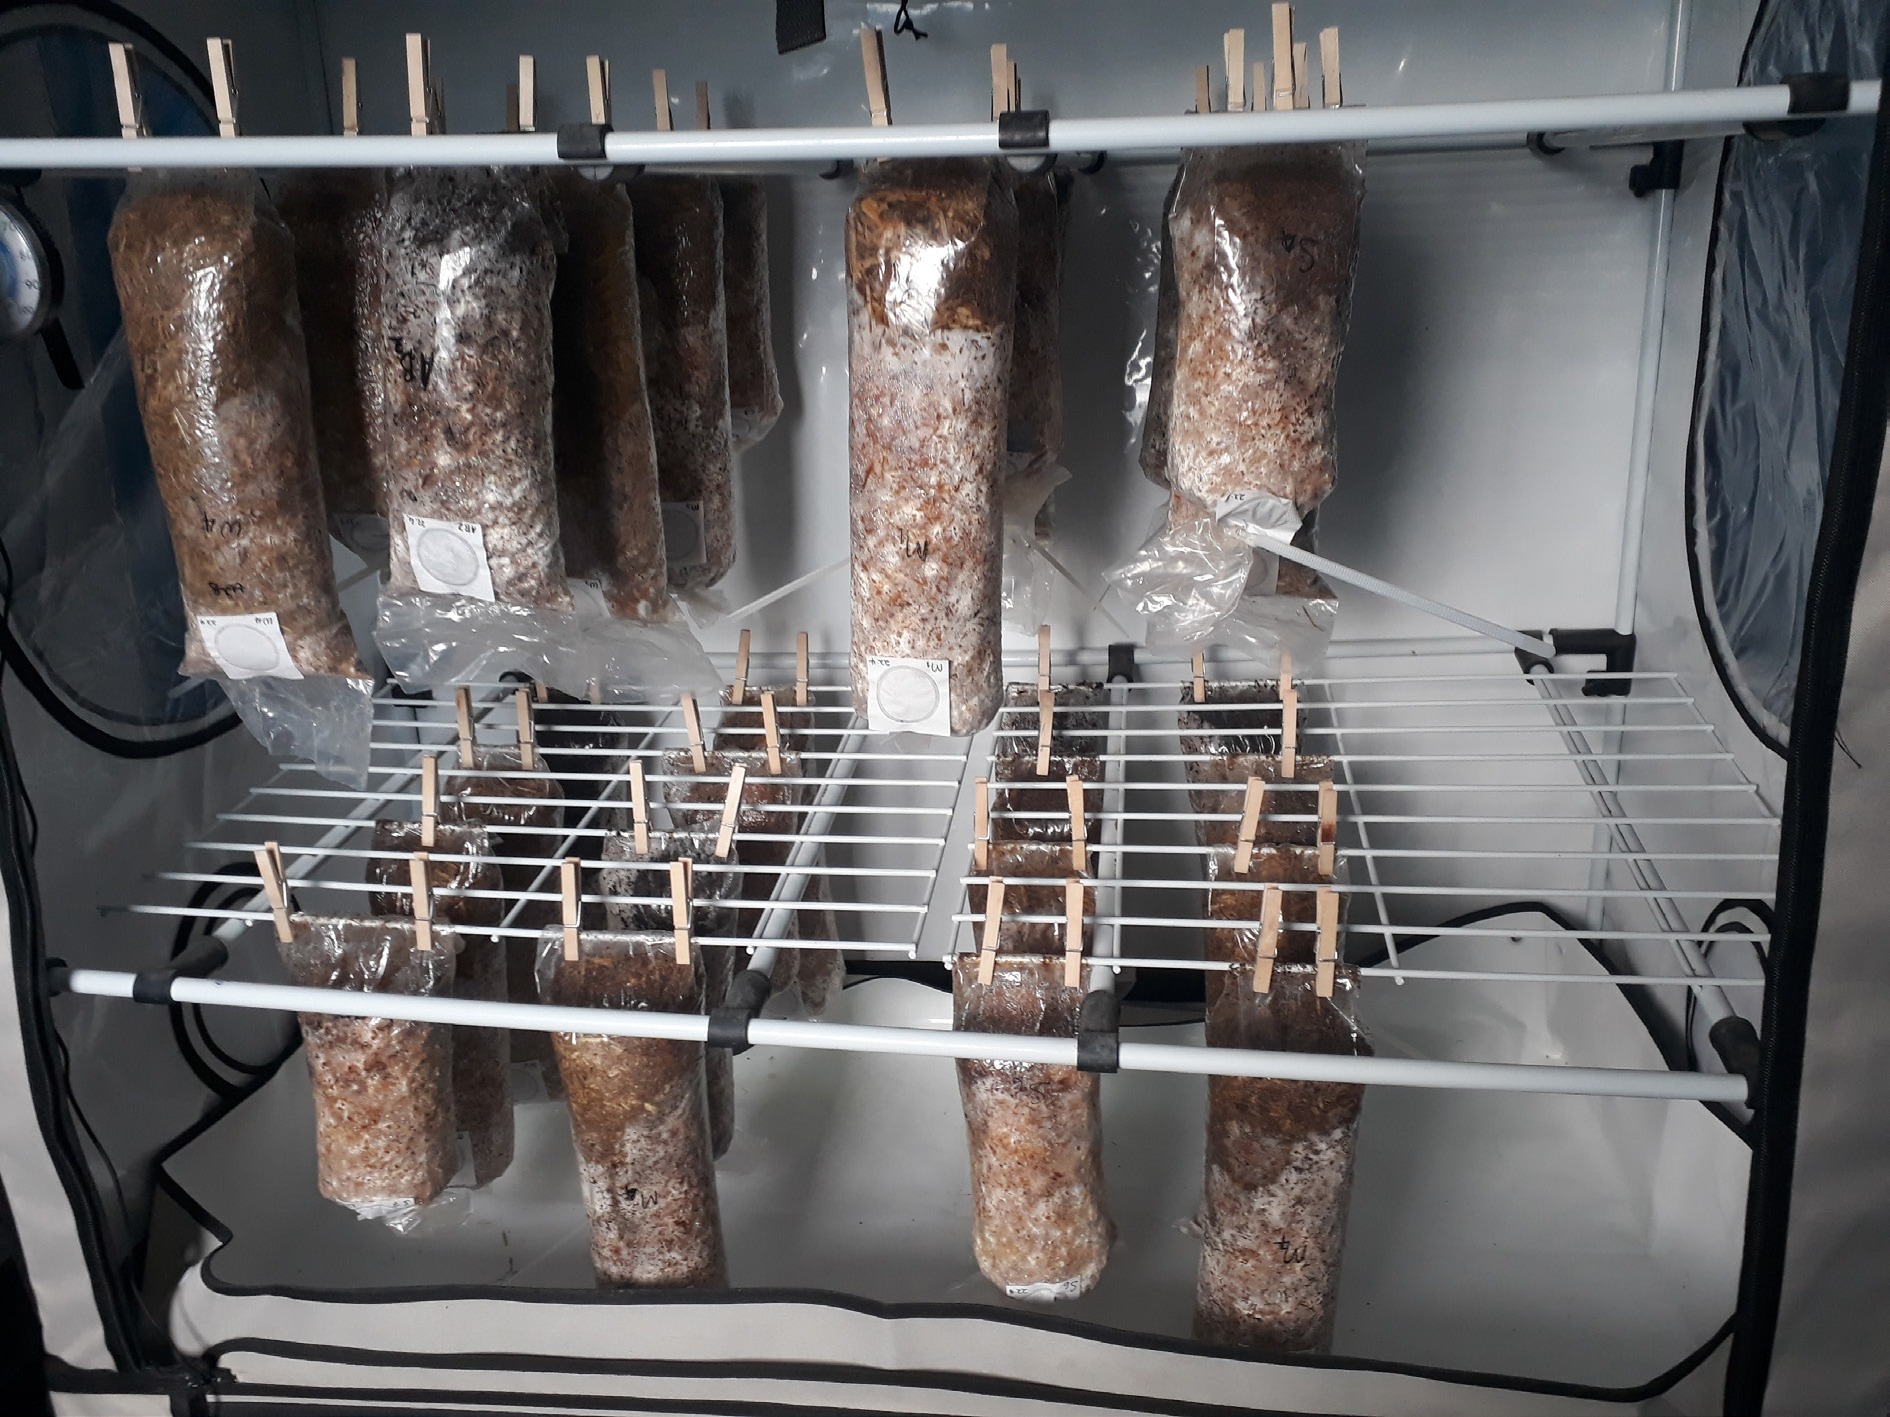
Figure 1.
Different substrates are used for mushroom cultivation in a random replication approach in a grow chamber.
-
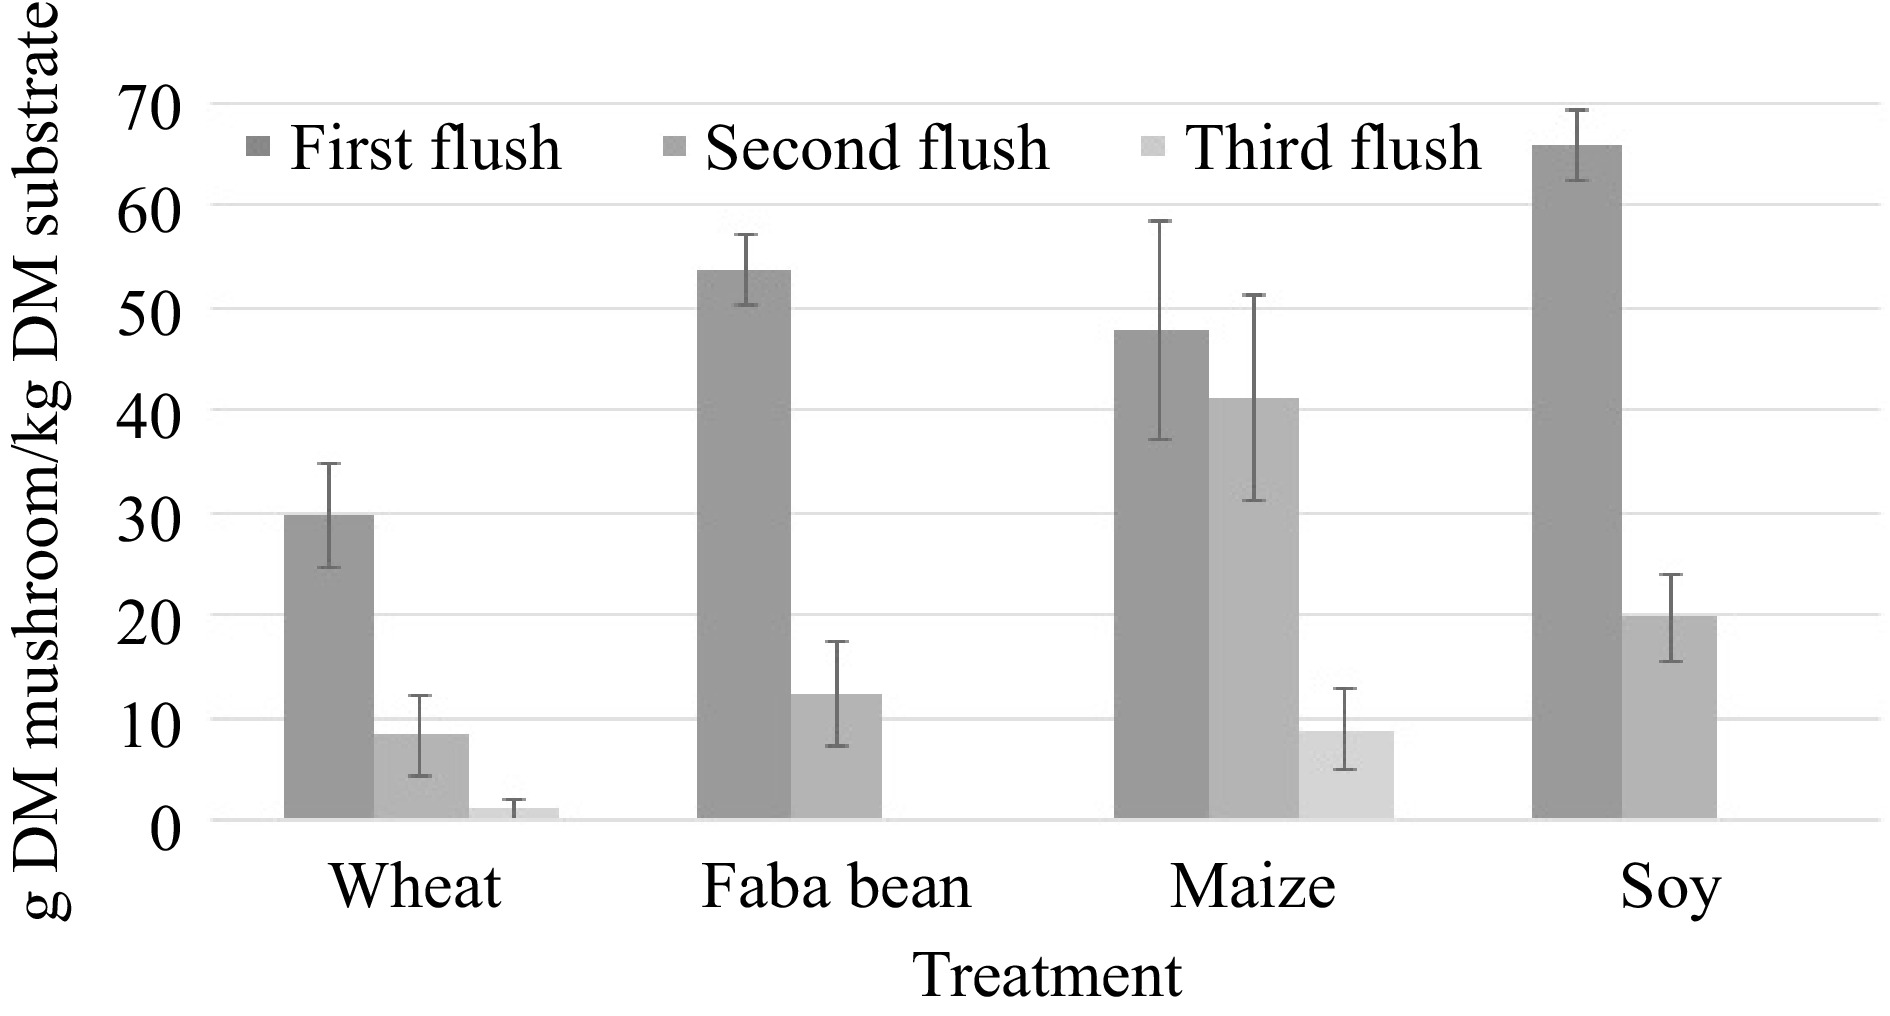
Figure 2.
Average dry yield per dry substrate distributed over different harvest flushes in the different treatments. Error bars show standard deviation.
-
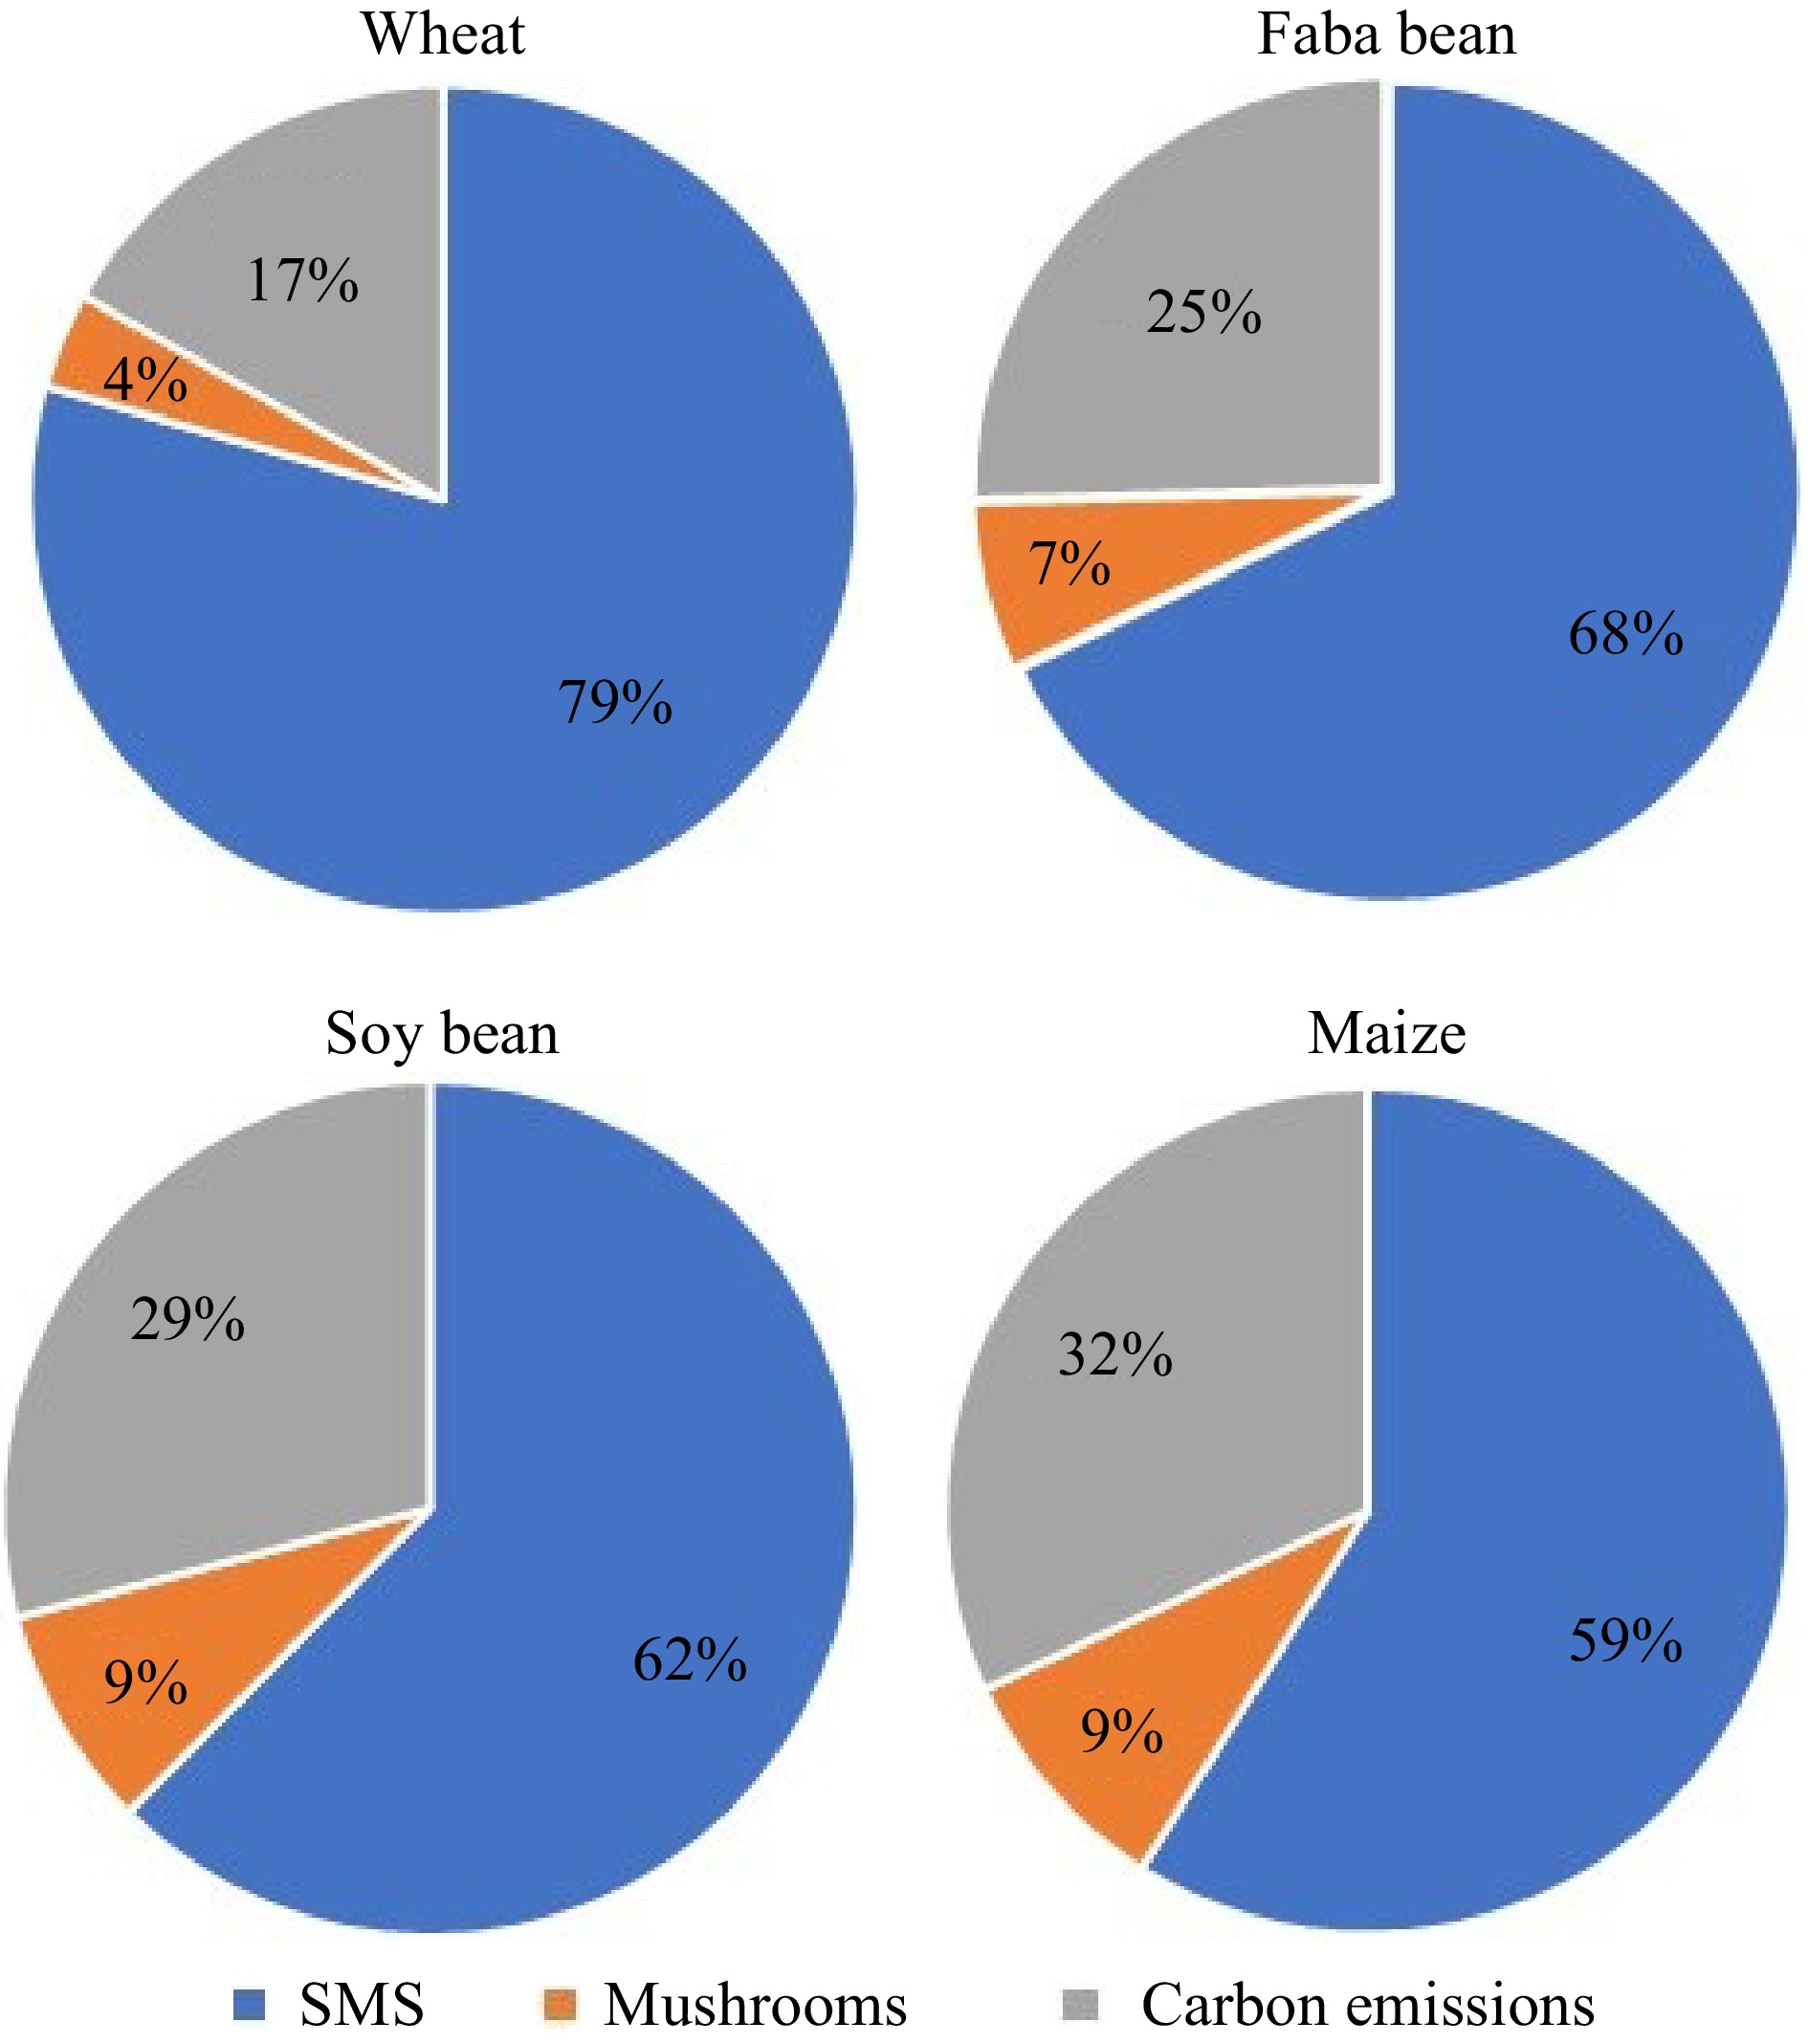
Figure 3.
Dry matter transfer from the straw to different fraction (spent mushroom substrate, mushrooms and carbon emissions) during mushroom cultivation.
-
Straw type DOM (%) DP (%) DL (%) DF (%) Wheat 47 20 49 53 Faba bean 52 46 53 42 Maize 72 50 64 68 Soy bean 52 54 55 42 Table 1.
Digestibility of the different macronutrient fraction in the different straw types: Digestible organic matter (DOM), digestible protein (DP), digestible lipids (DL) and digestible fiber (DF).
-
Sample C (% DM) N (% DM) C/N-ratio XF (% DM) Wheat straw 47.12 0.36 130.37 47.97 Faba bean straw 47.12 1.05 44.75 49.86 Maize straw 47.07 0.68 69.72 38.03 Soy bean straw 47.18 0.59 79.91 43.86 Mushroom spawn 46.33 2.96 15.63 x Table 2.
Chemical composition of the dry matter (DM) of different straws and mushroom spawn used for oyster mushroom cultivation.
-
Sample Protein DP ME g/kg
DMg/kg
DMg/1.4 kg
DMMJ/kg
DMMJ/1.4 kg
DMWheat straw 19.4 3.9 5.4 6.3 8.8 Faba bean straw 63.0 29 40.5 7 9.8 Maize straw 38.9 19.5 27.2 9.8 13.7 Soy bean straw 33.7 18.2 27.4 7.2 10.1 Table 3.
Protein, digestible protein (DP) and metabolic energy (ME) of the different straws for 1 kg dry matter and 1.4 kg dry matter (estimated daily feed intake of a goat).
-
Treatment Fresh matter BE (%) Dry matter BCR (%) Wheat straw 58b (12.5) 3.8c (0.8) Faba bean straw 76bc (17.3) 6.6b (1.4) Maize straw 114a (10.2) 9.2a (0.9) Soy bean straw 89.1b (14.7) 8.6a (1.3) Biological efficiency (BE) and biomass conversion rate (BCR) of the different treatments. Significant differences between treatments are marked by letters above the data. Standard deviation given in brackets behind the mean. Table 4.
Fresh and dry yield.
-
Treatment C (%) N (%) C/N Protein (%) Wheat straw 44.7a (1.1) 2.7b (0.3) 16.8b 16.8 (1.6) Faba bean straw 45.4a (1.2) 3.7a (0.2) 12.2a 23.2 (1.3) Maize straw 45.1a (0.8) 3b (0.2) 14.9b 19 (1.4) Soy bean straw 45.6a (0.6) 2.8b (0.2) 16.2b 17.7 (1.6) Standard deviation given in brackets behind the mean. Significant differences between treatments are marked by letters above the data. Table 5.
Chemical composition of the mushrooms from different treatments.
-
SMS type C (% DM) N (% DM) C/N C/N ratio change Wheat straw 45.5 (0.9) 0.4 (0) 106.0 −24.4 Faba bean straw 45.6 (0.4) 1 (0) 47.3 2.6 Maize straw 43.8 (0.4) 0.7 (0) 62.7 −7.0 Soy bean straw 43.9 (0.4) 0.6 (0) 71.7 −8.3 Standard deviation of carbon and nitrogen content given in brackets after the mean. C/N change is the difference in the C/N ratio in comparison to the ratio of the straw before mushroom cultivation. Table 6.
Chemical composition of the spent mushroom substrate (SMS).
-
Treatment Dry matter (%) C (%) N (%) Wheat straw 82.2 (6.4) 79.5 (5.6) 79.3 (12.3) Faba bean straw 70.1 (5) 67.9 (4.6) 60.5 (3.9) Maize straw 63.4 (1.9) 59 (1.7) 59 (3.9) Soy bean straw 67.1 (1.9) 62.4 (1.6) 61.5 (4) Standard deviation given in brackets behind the mean. Table 7.
Mass transfer from straw to spent mushroom substrate in the different treatments.
Figures
(3)
Tables
(7)