-
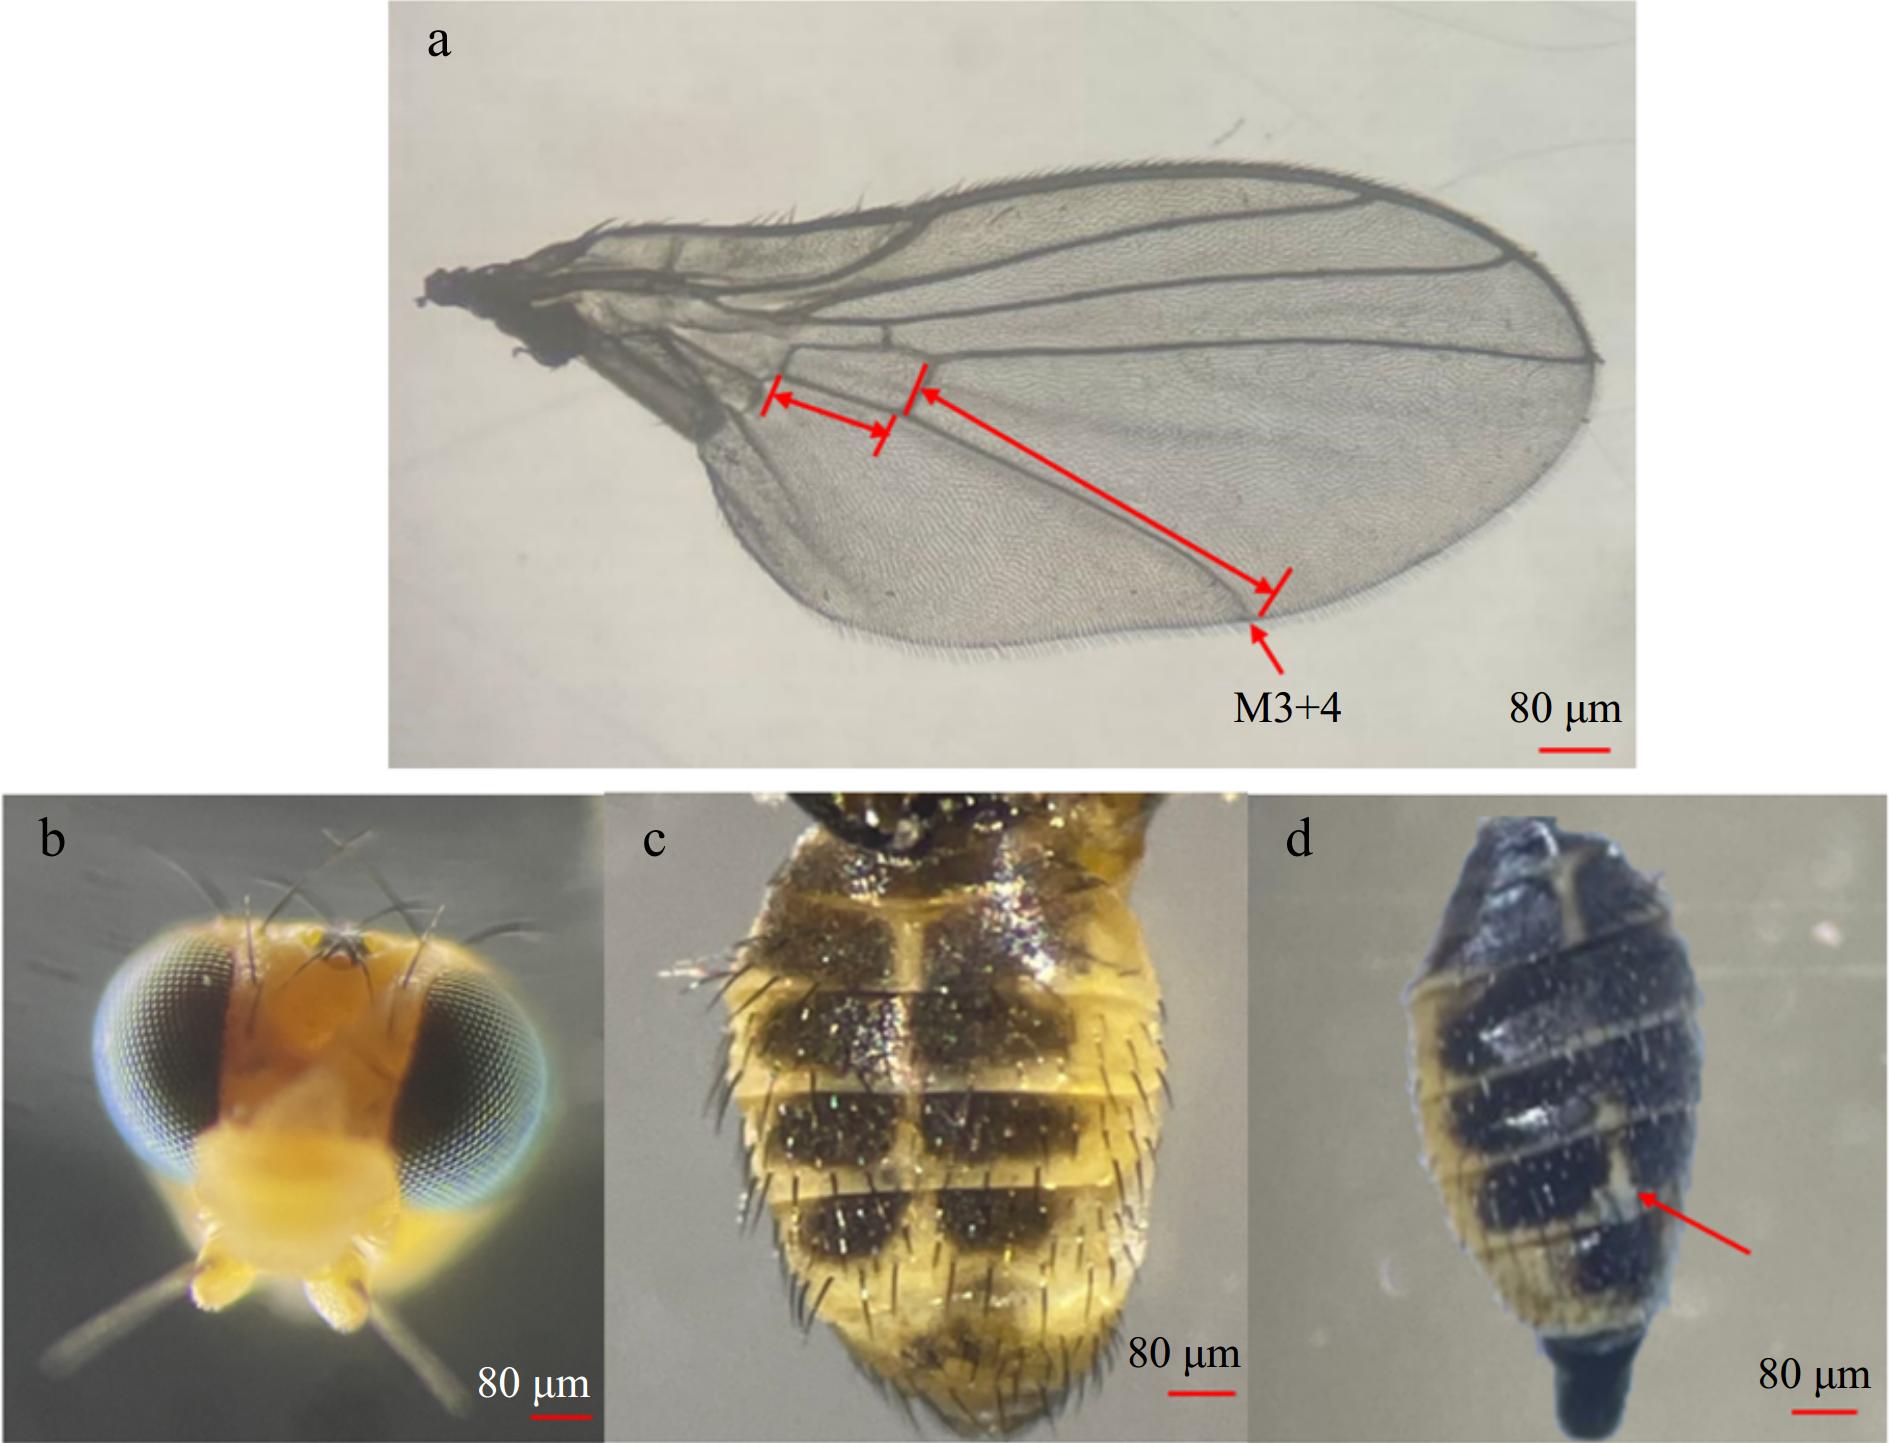
Figure 1.
Anatomical morphology male adult L. trifolii. (a) Forewing, (b) head, (c), (d) dorsal side of the abdomen.
-
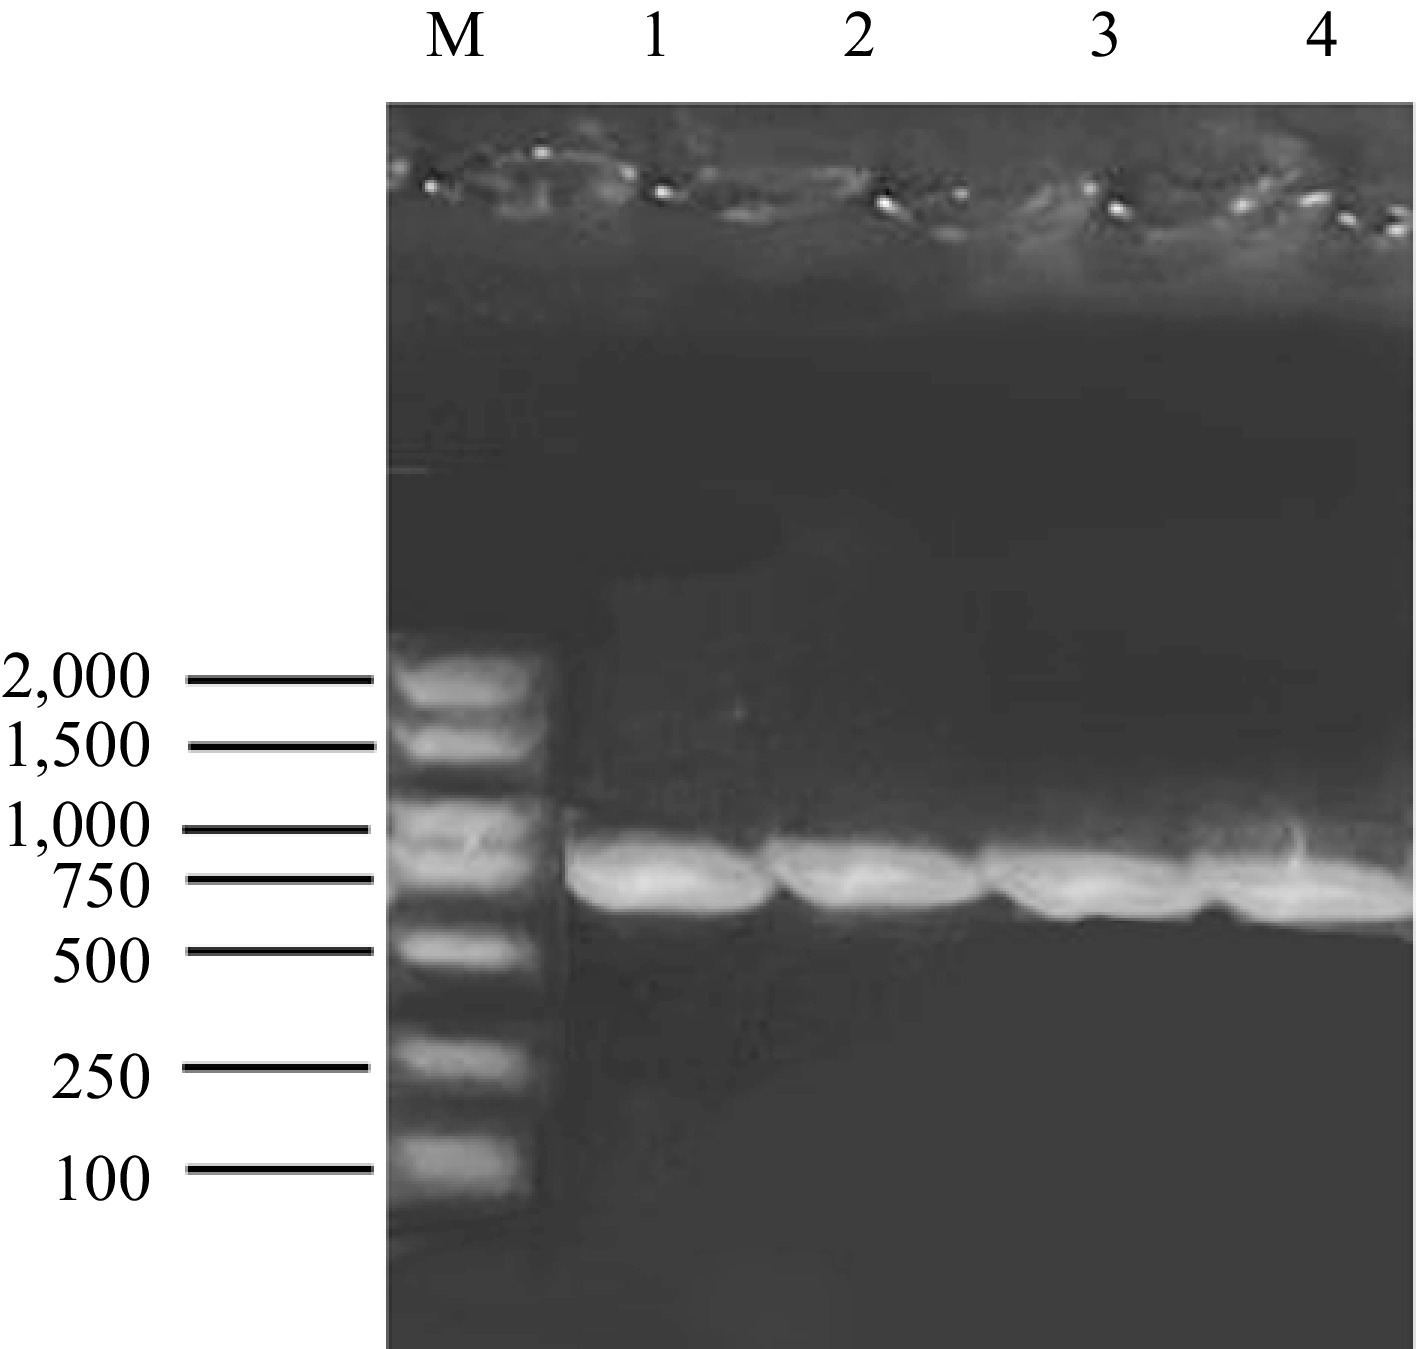
Figure 2.
PCR of the COI gene of L. trifolii. M showed DNA Marker DL2000 (Purchased from TaKaRa, Japan); Lines 1−4 represent four repetitions of PCR.
-
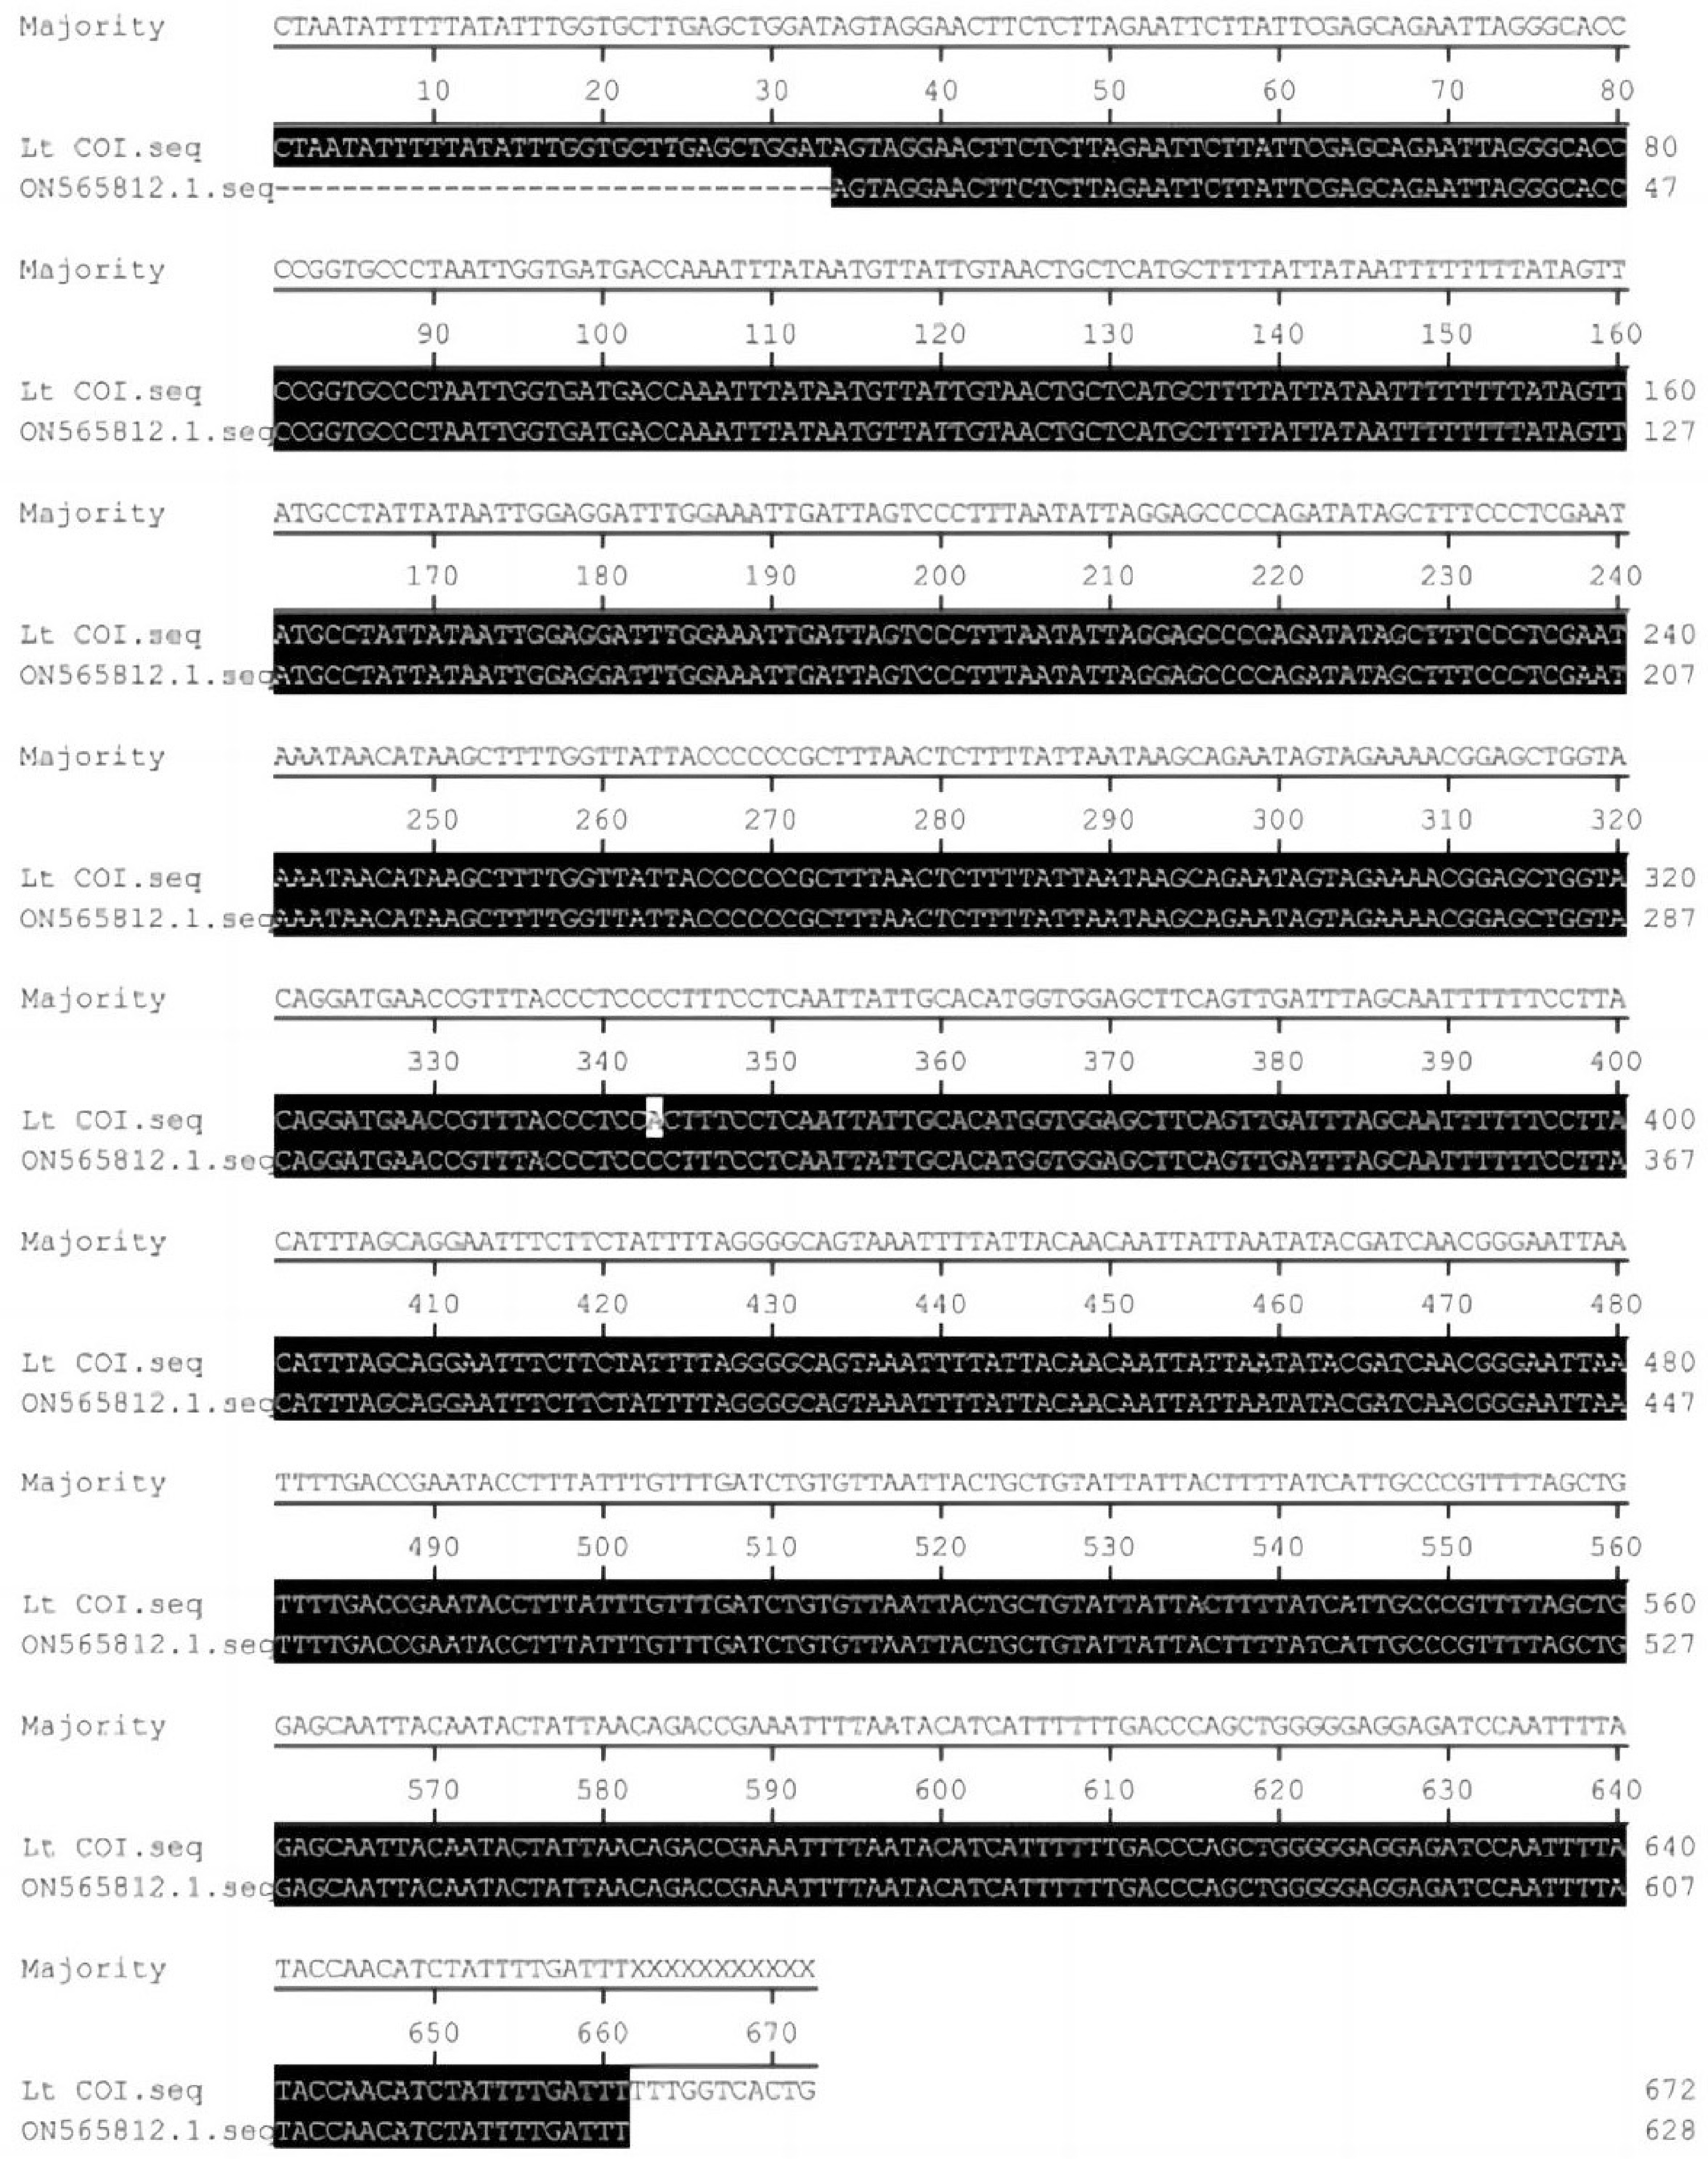
Figure 3.
Sequence comparison between amplified and the COI gene from the NCBI database.
-
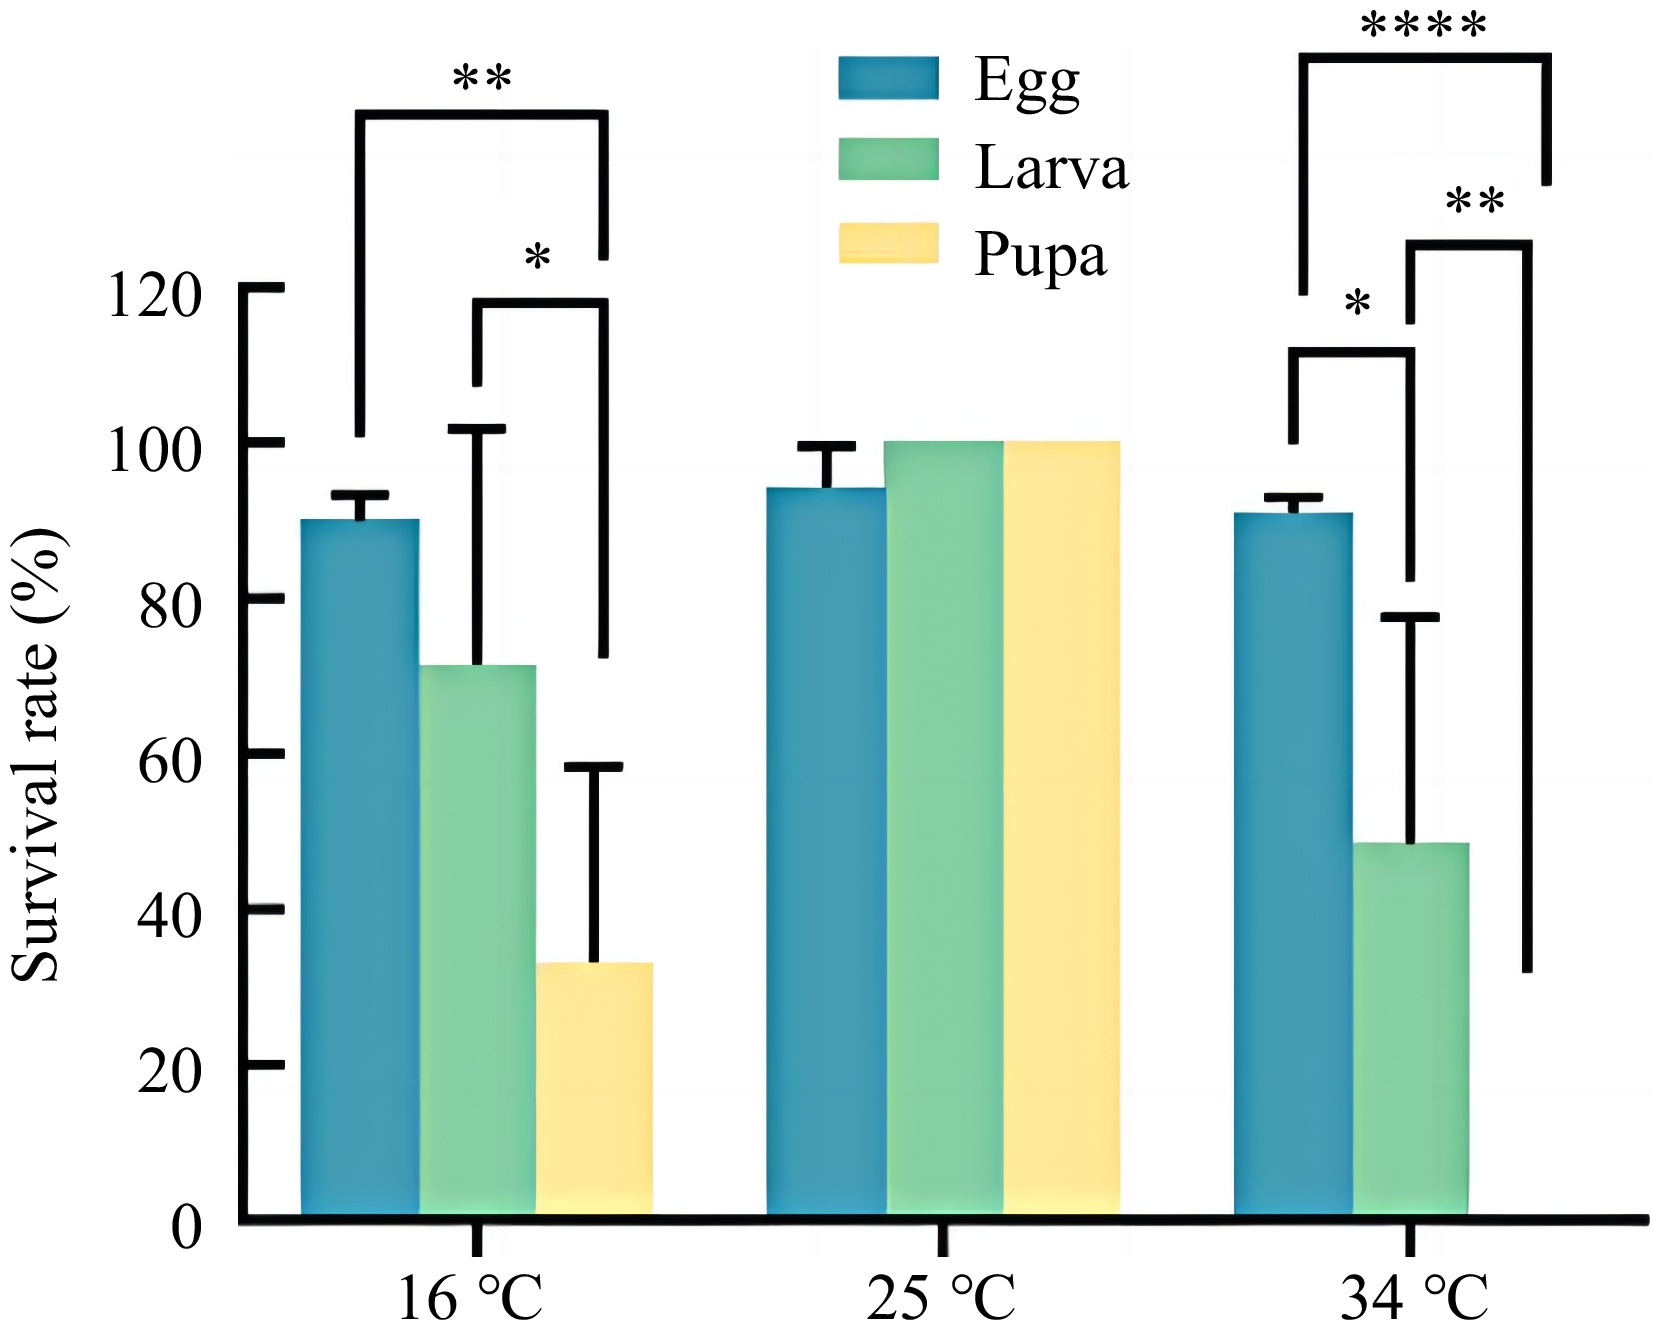
Figure 4.
Survival rate of field L. trifolii in Sanya under different temperatures. Data in the figure are mean ± SD. Asterisks above bars indicates significant difference (p < 0.05) between two groups by Tukey's multiple test.
-
Population Year LC50 (95% CL)
(mg/L)Slope ± SE χ2 (df) Resistance
ratioaSensitive strains − 0.90
(0.29−3.15)1.00 ± 0.10 46.68 (10) 1 Sanya 2022 697.00
(241.80−
13,809.27)0.68 ± 0.23 4.76 (13) 776.17 a Resistance ratio = LC50 of field strain / LC50 of sensitive strain. Table 1.
Resistance level of indoxacarb resistance of Sanya population of L. trifolii in Hainan province.
-
Detoxification
enzymeBefore indoxacarb treatment Increased multiplier After indoxacarb treatment Increased multiplier Sensitive strain Field strain in Sanya Sensitive strain Field strain in Sanya GST 0.23 ± 0.27 c 3.53 ± 0.29 a 15.35 0.99 ± 0.47 b 9.99 ± 9.45 a 10.09 AChE 50.74 ± 29.29 c 229.02 ± 50.56 b 4.51 65.77 ± 11.74 c 609.16 ± 22.19 a 9.26 CarE 2.70 ± 0.07 b 4.01 ± 0.90 ab 1.49 3.14 ± 0.33 b 6.46 ± 1.66 a 2.06 GST: Glutathione S-transferase; CarE: Carboxylesterase enzymes; AChE: Acetylcholinesterase enzyme. Data in the table are mean ± SD, and different small letters in the same line mean significant difference (p < 0.05) in the enzymatic activity of sensitive strain and field strain in Sanya between before indoxacarb treatment and after indoxacarb treatment by Tukey's multiple test. Table 2.
Activities of two detoxification enzymes and acetylcholinesterase enzyme (U/mg pro) in the second-instar larva of L. trifolii after treatment with LC50 (697.00 mg/L) indoxacarb.
-
Enzyme Regression equation r Before indoxacarb treatment GST y = 0.2337 + 0.0034x 0.82 AChE y = 46.259 + 0.1895x 0.79 CarE y = 2.1688 + 0.0016x 0.45 After indoxacarb treatment GST y = 0.879 + 0.0116x 0.73 AChE y = 54.349 + 0.615x 0.85 CarE y = 2.5721 + 0.0038x 0.64 GST: Glutathione S-transferase; CarE: Carboxylesterase enzymes; AChE: Acetylcholinesterase enzyme. Table 3.
Correlation between enzyme activity and the resistance of the second-instar larva of field L. trifolii in Sanya to LC50 (697.00 mg/L) indoxacarb.
-
Developmental stage Food Temperature (°C) 16 25 34 Egg − 6.67±0.58 a 2.67±0.58 b 2.33±0.58 c Larva − 13.67±0.58 a 7.33±0.58 b 4.67±0.58 b Pupa − 17.11±1.84 a 7.00±0.00 b 0.00±0.00 c Adult 10% Honey water ♀ 22.00±6.93 aB 6.33±7.51 bB 3.33±0.58 cB ♂ 27.25±7.63 aA 5.67±2.31 bB 2.67±0.58 cB Sterile water ♀ 4.33±0.58 aC 1.67±0.58 bB 1.33±0.58 cB ♂ 4.67±1.15 aC 1.67±0.58 bB 1.33±0.58 cB Data in the table are mean ± SD, and different small letters in the same row and different capital letters in the same column mean significant difference (p < 0.05) in the developmental duration between different temperatures and food treatments by Tukey's multiple test. Table 4.
Developmental duration of field Liriomyza trifolii in Sanya under treatments with different temperatures and foods.
-
Number of
tested insectsTemperature Body length Body weight 30 16 0.2 ± 0.01 a 0.01 ± 0.004 a 0.2 ± 0.01 a 0.03 ± 0.02 a 0.2 ± 0.01 a 0.02 ± 0.02 a 30 25 0.1 ± 0.02 a 0.02 ± 0.02 a 0.1 ± 0.02 a 0.05 ± 0.04 a 0.1 ± 0.02 a 0.03 ± 0.007 a 30 34 0.1 ± 0.006 a 0.09 ± 0.002 a 0.1 ± 0.004 a 0.02 ± 0.009 a 0.1 ± 0.004 a 0.06 ± 0.0006 a Data in the table are mean ± SD. Different small letters in the same column mean significant difference (p < 0.05) in the body length and body weight between different temperatures by Tukey's multiple test. Table 5.
Body length and body weight of pupae of field L. trifolii in Sanya under different temperatures.
-
Development stage T0 K Egg 10.82 ± 1.70 43.23 ± 4.77 Larva 2.75 ± 8.72 17.53 ± 6.20 Pupa 12.30 ± 1.70 110.23 ± 12.49 Adult 7.11 ± 6.57 8.37 ± 2.98 Table 6.
Developmental threshold temperature (T0) and effective accumulated temperature (K) of field L. trifolii in Sanya at different stages.
Figures
(4)
Tables
(6)