-
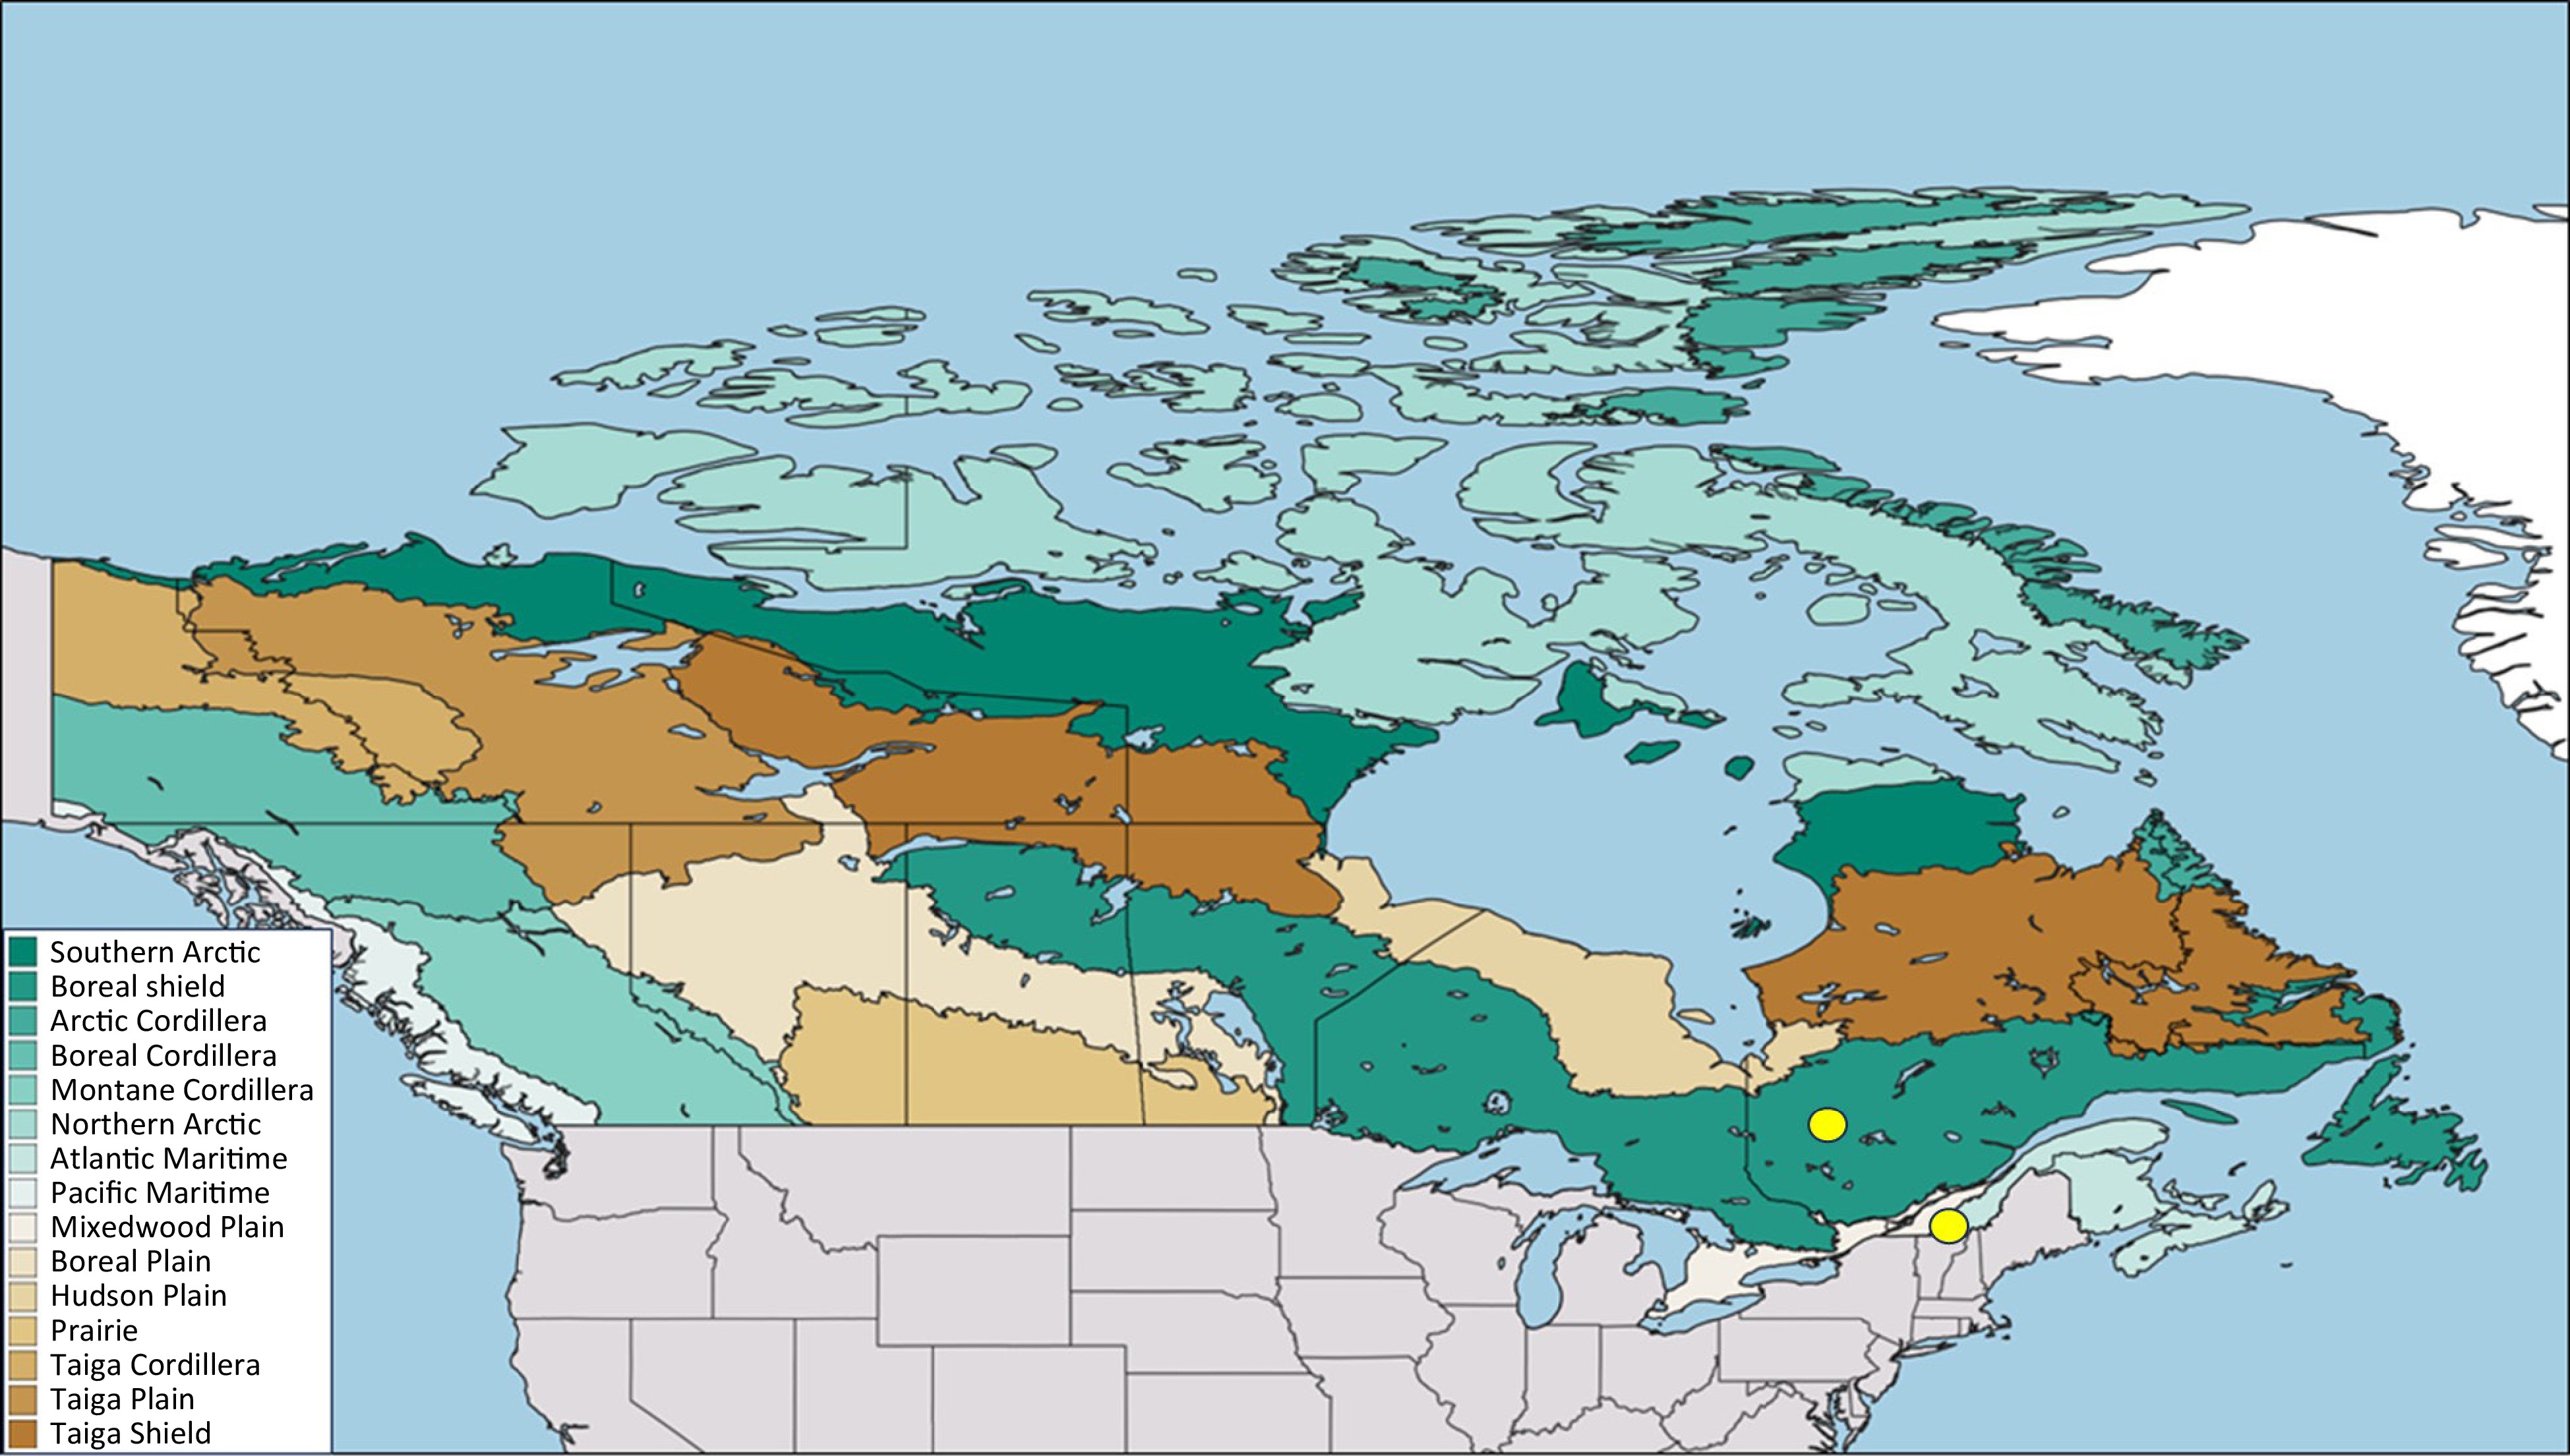
Figure 1.
Map showing the locations (yellow dots) of the two study sites in Québec, Canada. The colored area represents the vegetation zones of Canada according to the Canadian National Vegetation Classification.
-
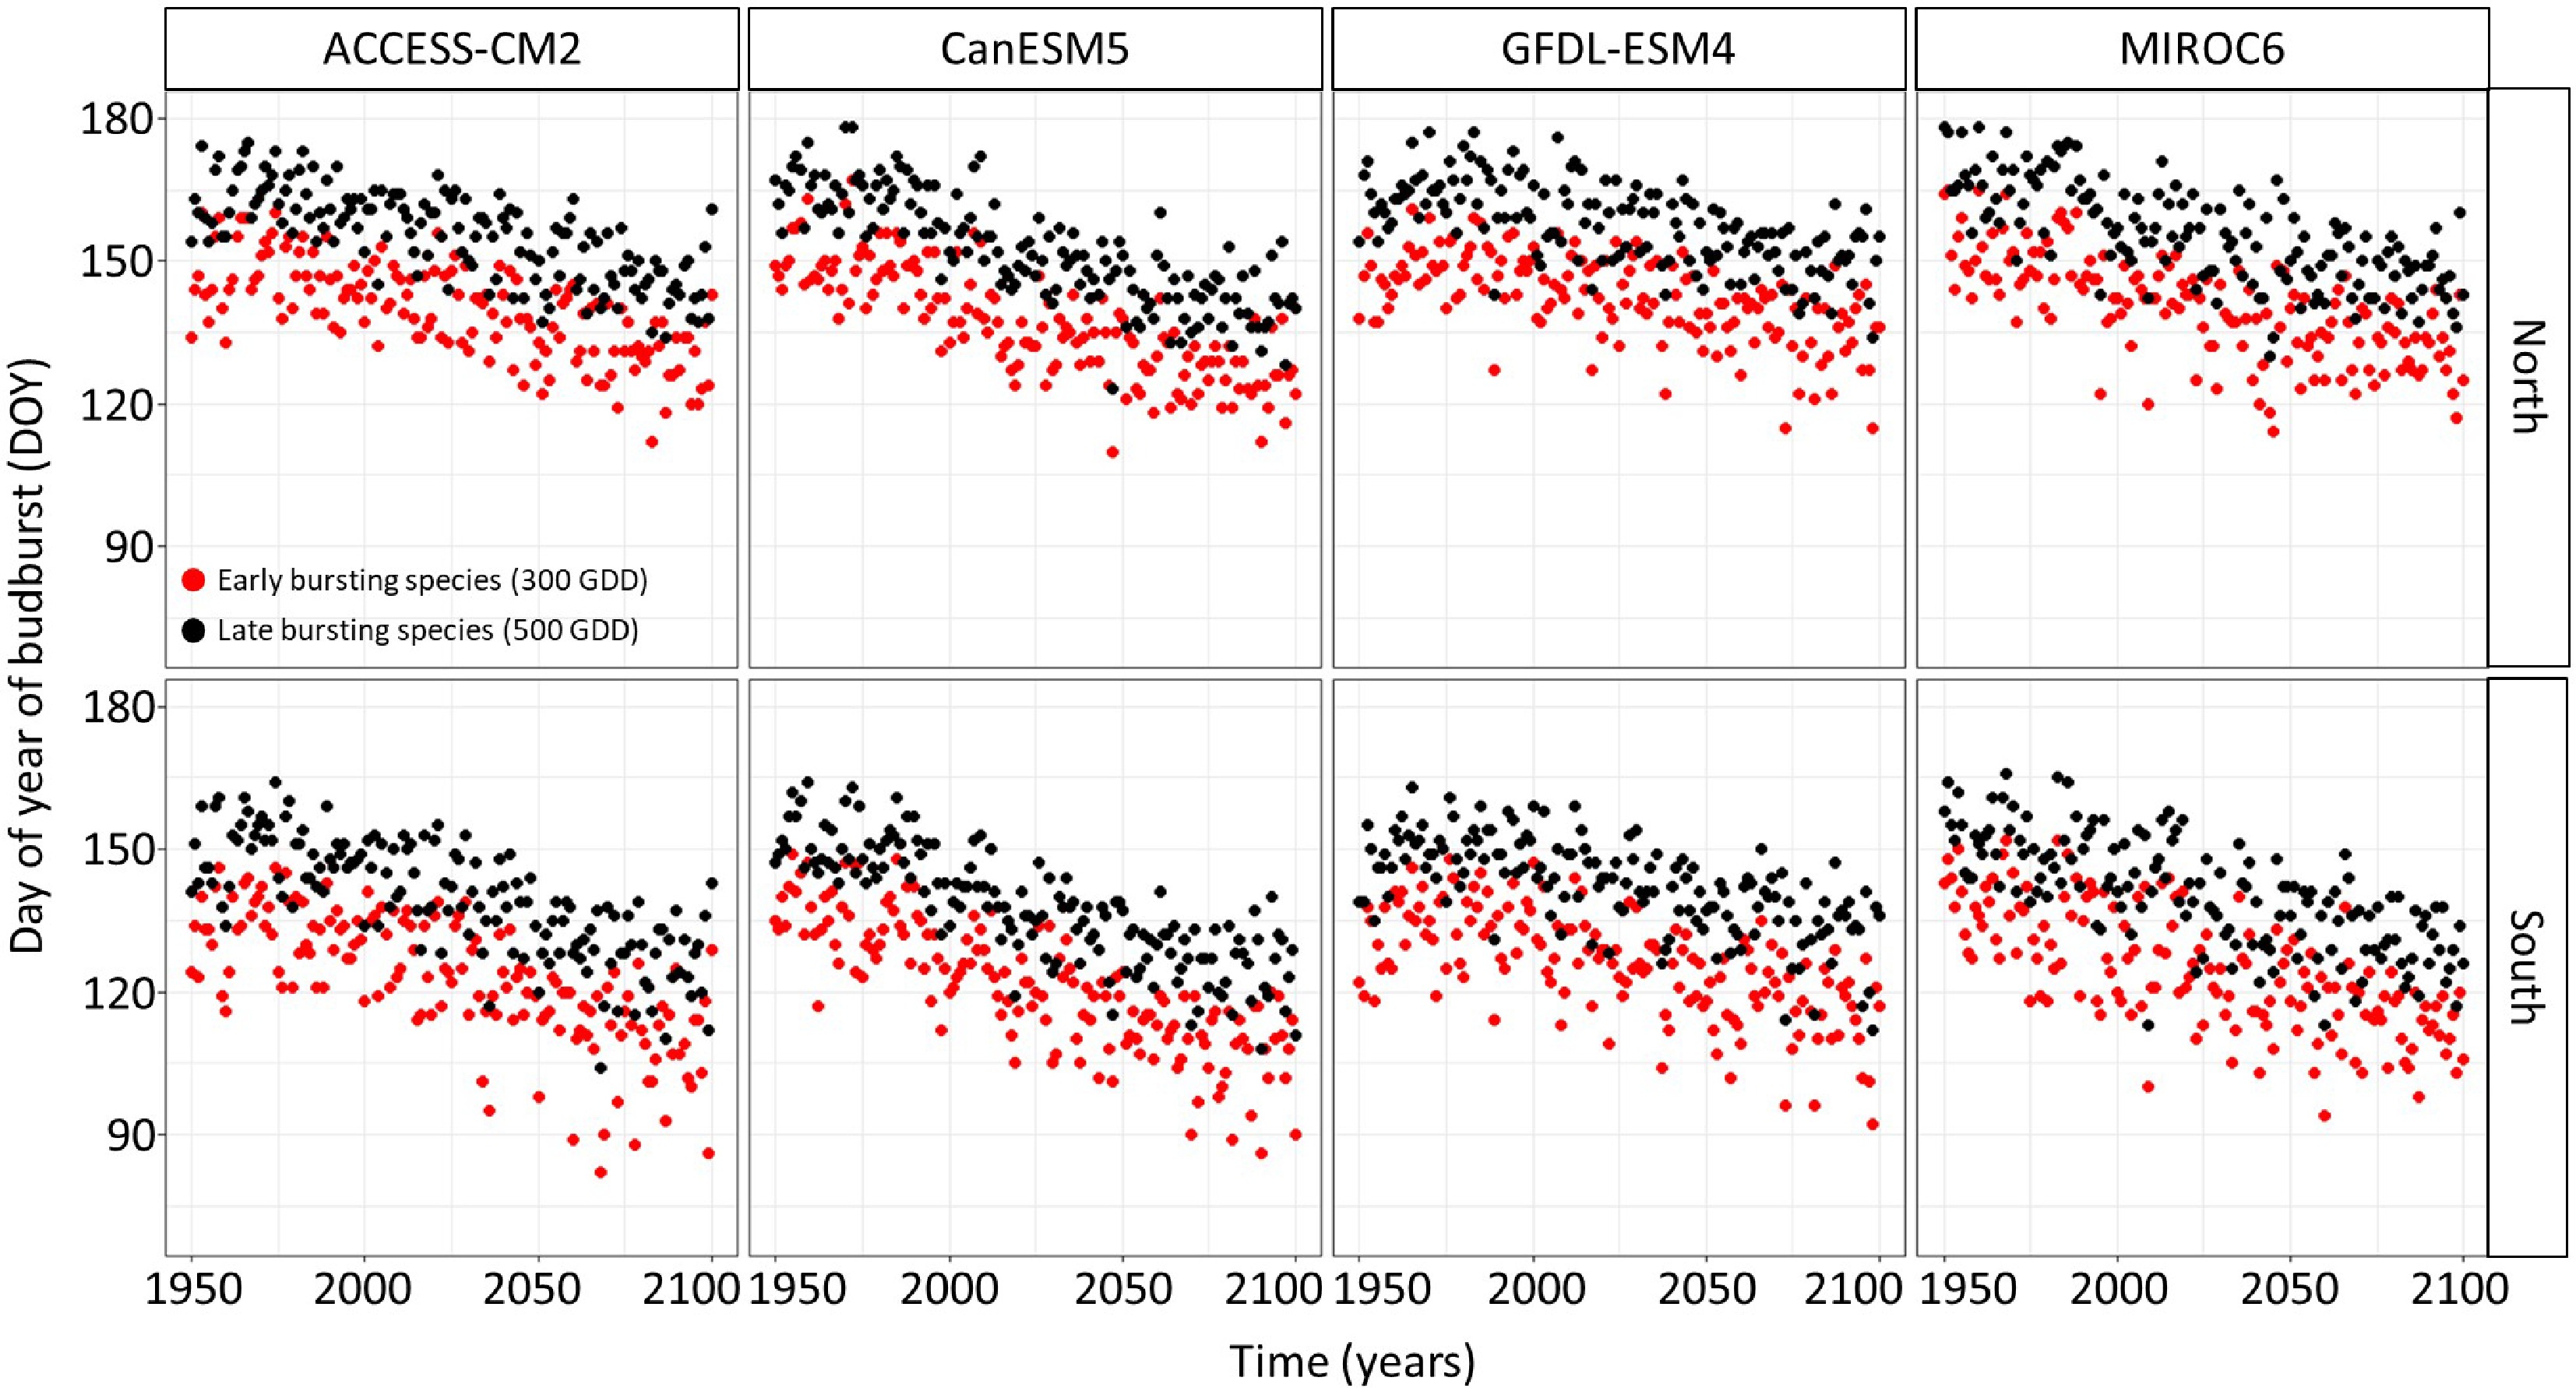
Figure 2.
Timing of budbreak predicted by the thermal time bud phenology model, which considers budbreak to occur once 300 and 500 growing degree-days have accumulated under the SSP-2.45 for species showing early and late budbreak respectively, per site and chains of global and regional climate models. Red dots represent species with an early timing of budbreak whereas black dots represent species with a late timing of budbreak.
-
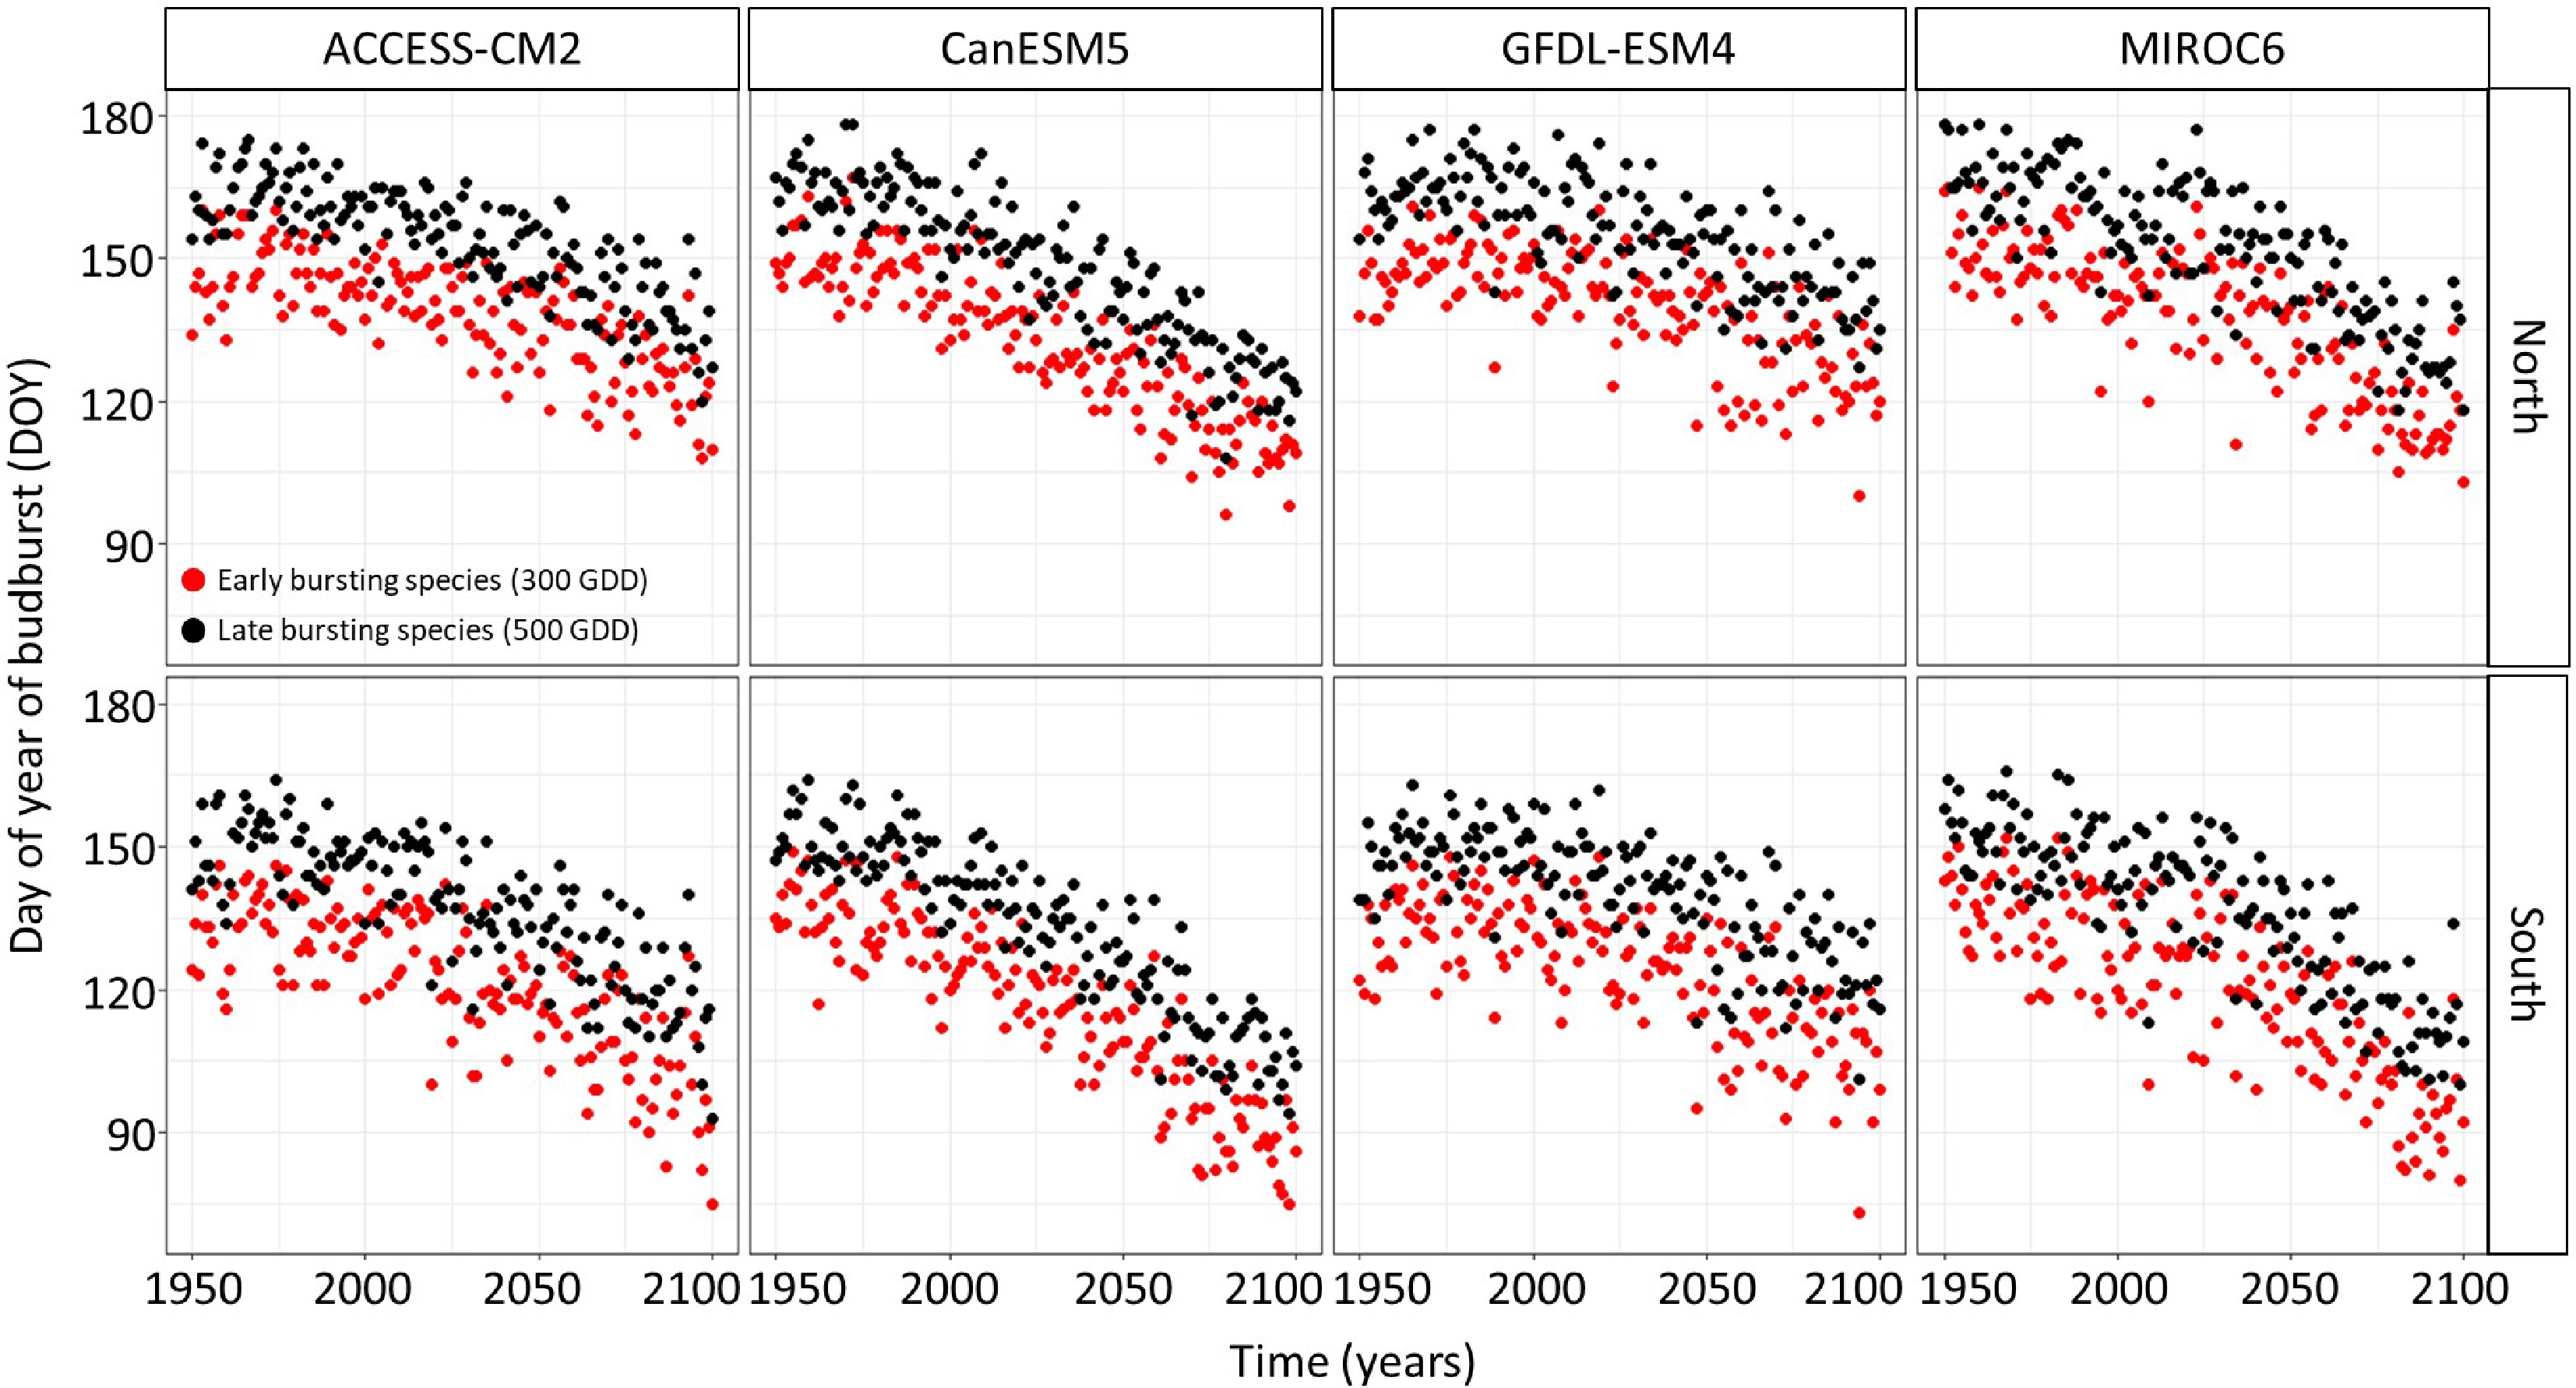
Figure 3.
Timing of budbreak predicted by the thermal time bud phenology model, which considers budbreak to occur once 300 and 500 growing degree-days have accumulated under the SSP-5.85 for species showing early and late budbreak respectively, per site and chains of global and regional climate models. Red dots represent species with an early timing of budbreak whereas black dots represent species with a late timing of budbreak.
-
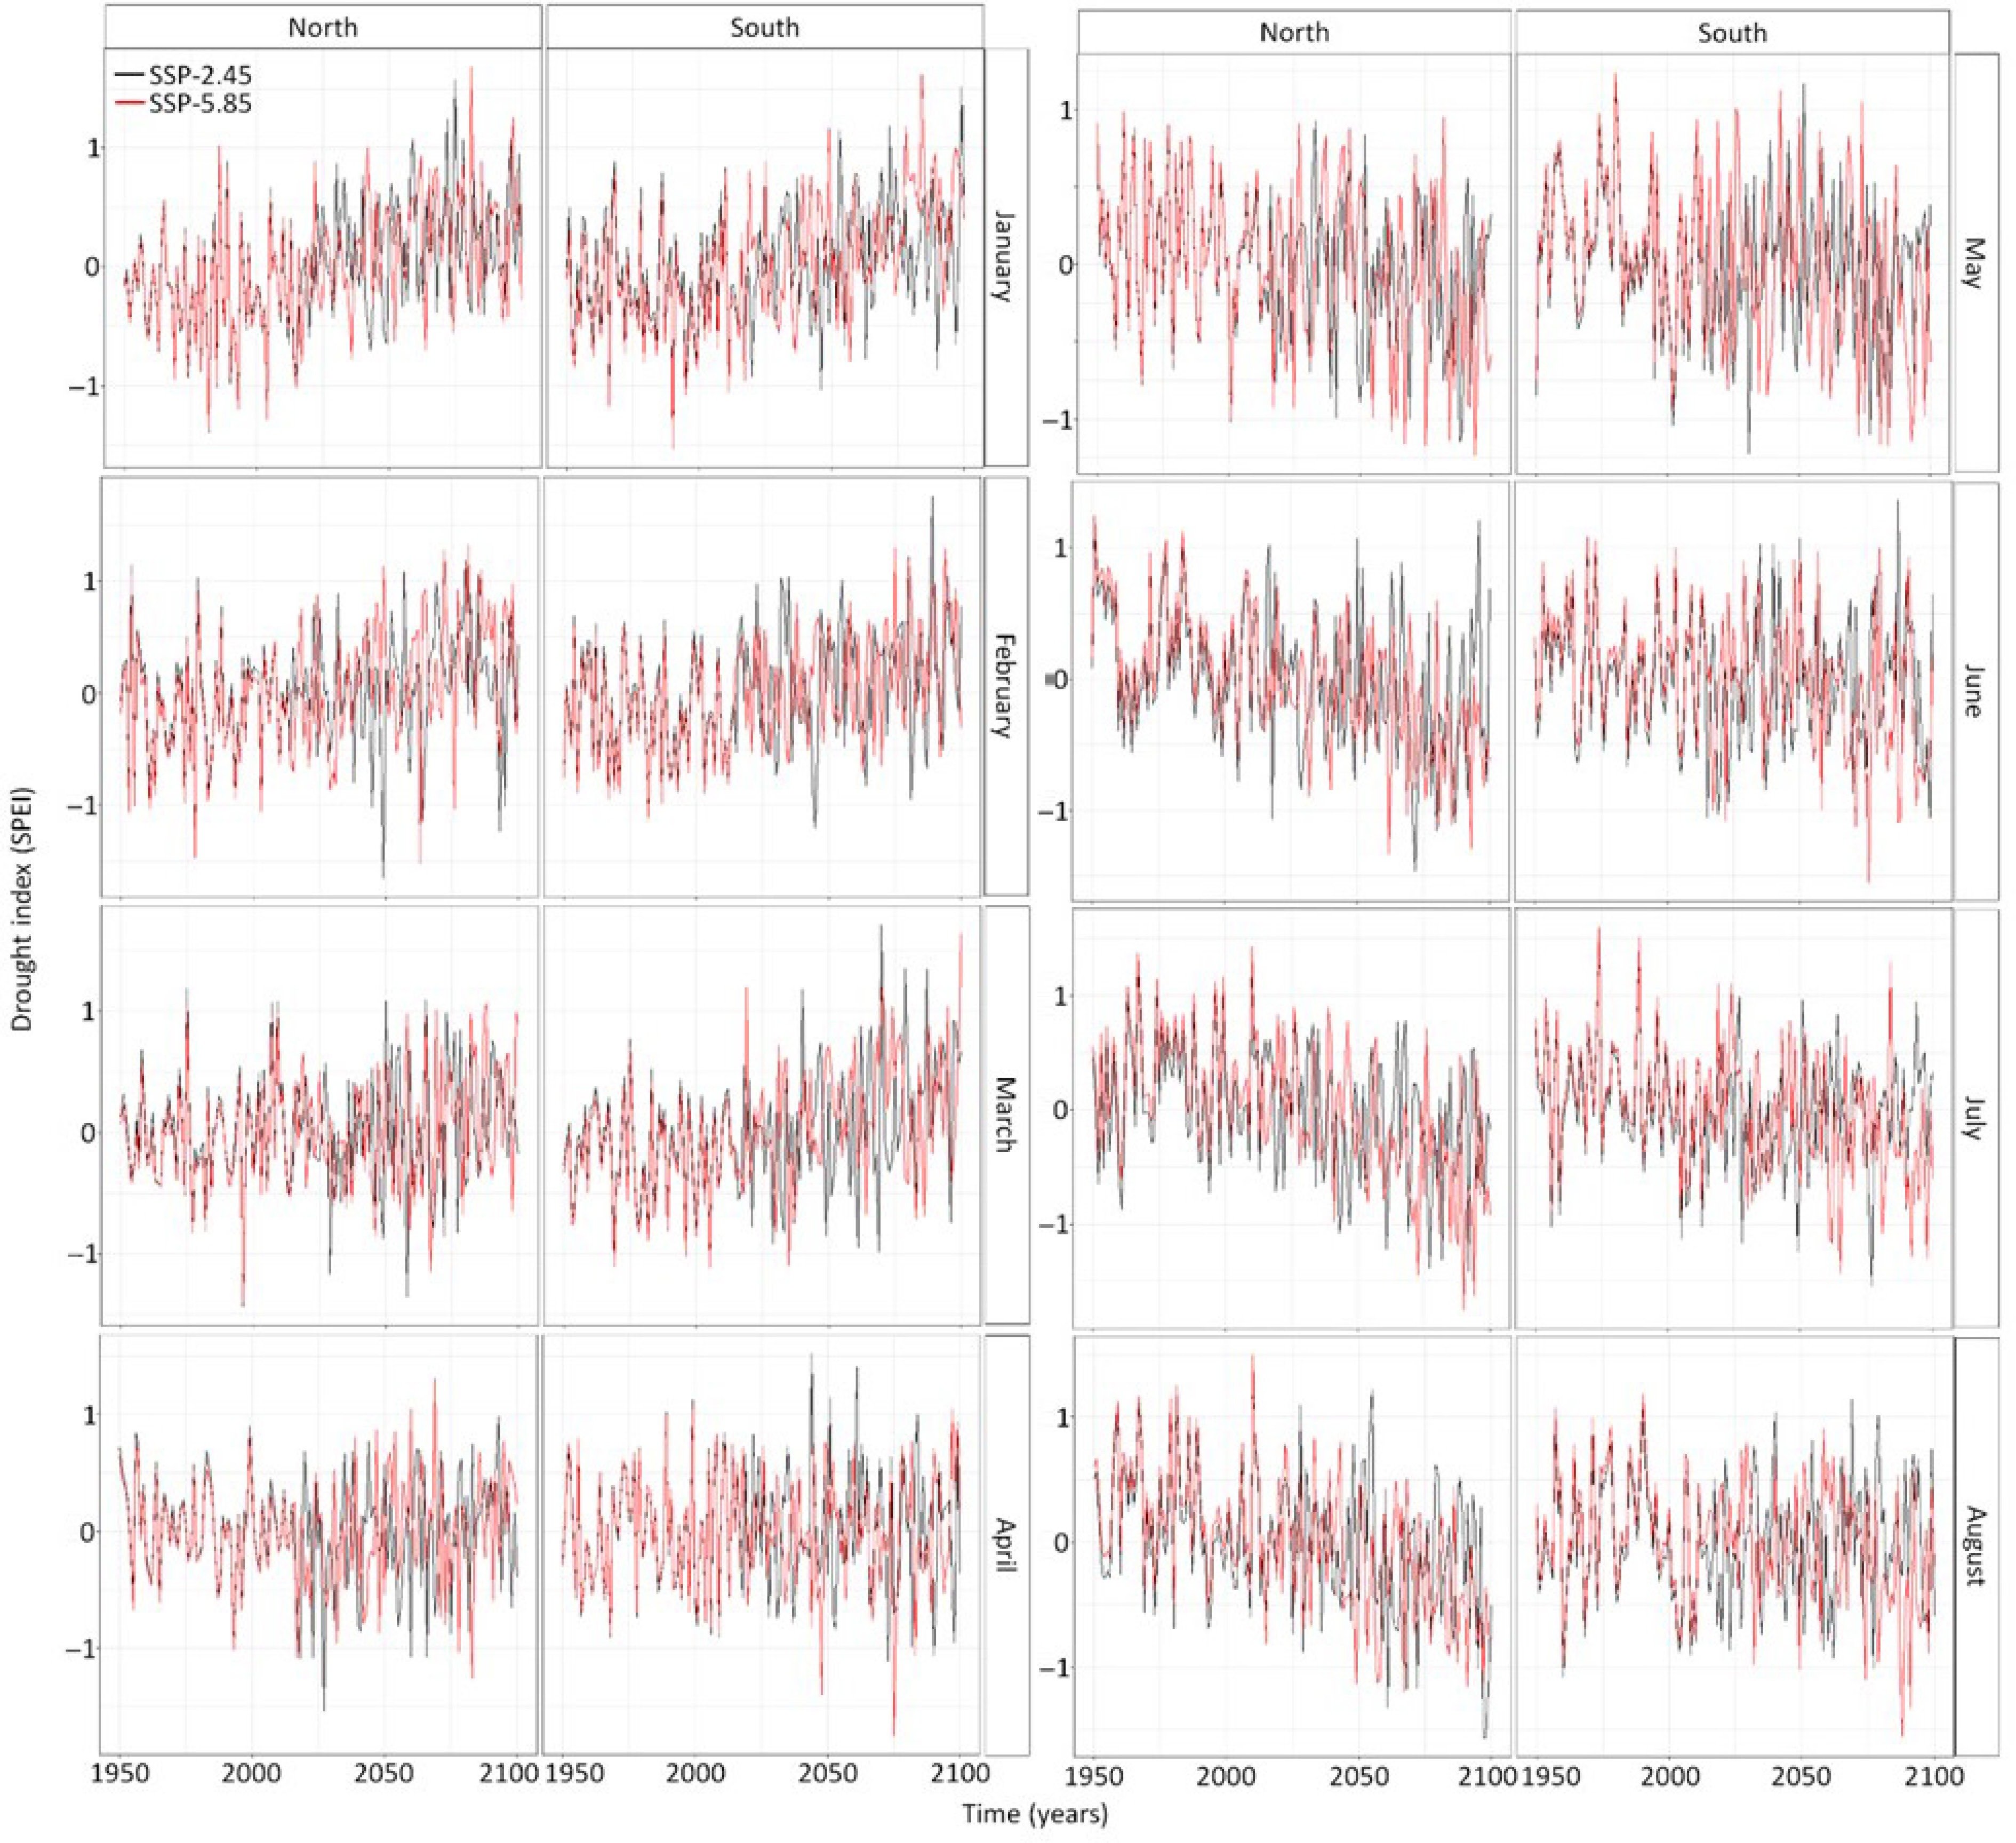
Figure 4.
Temporal trends in the monthly drought index (SPEI) from January to August at both sites calculated from the four climate models. The black line shows the predictions of the drought index under the socioeconomic pathway 2.45 whereas the red line shows the predictions of drought index under the socioeconomic pathway 5.85.
-
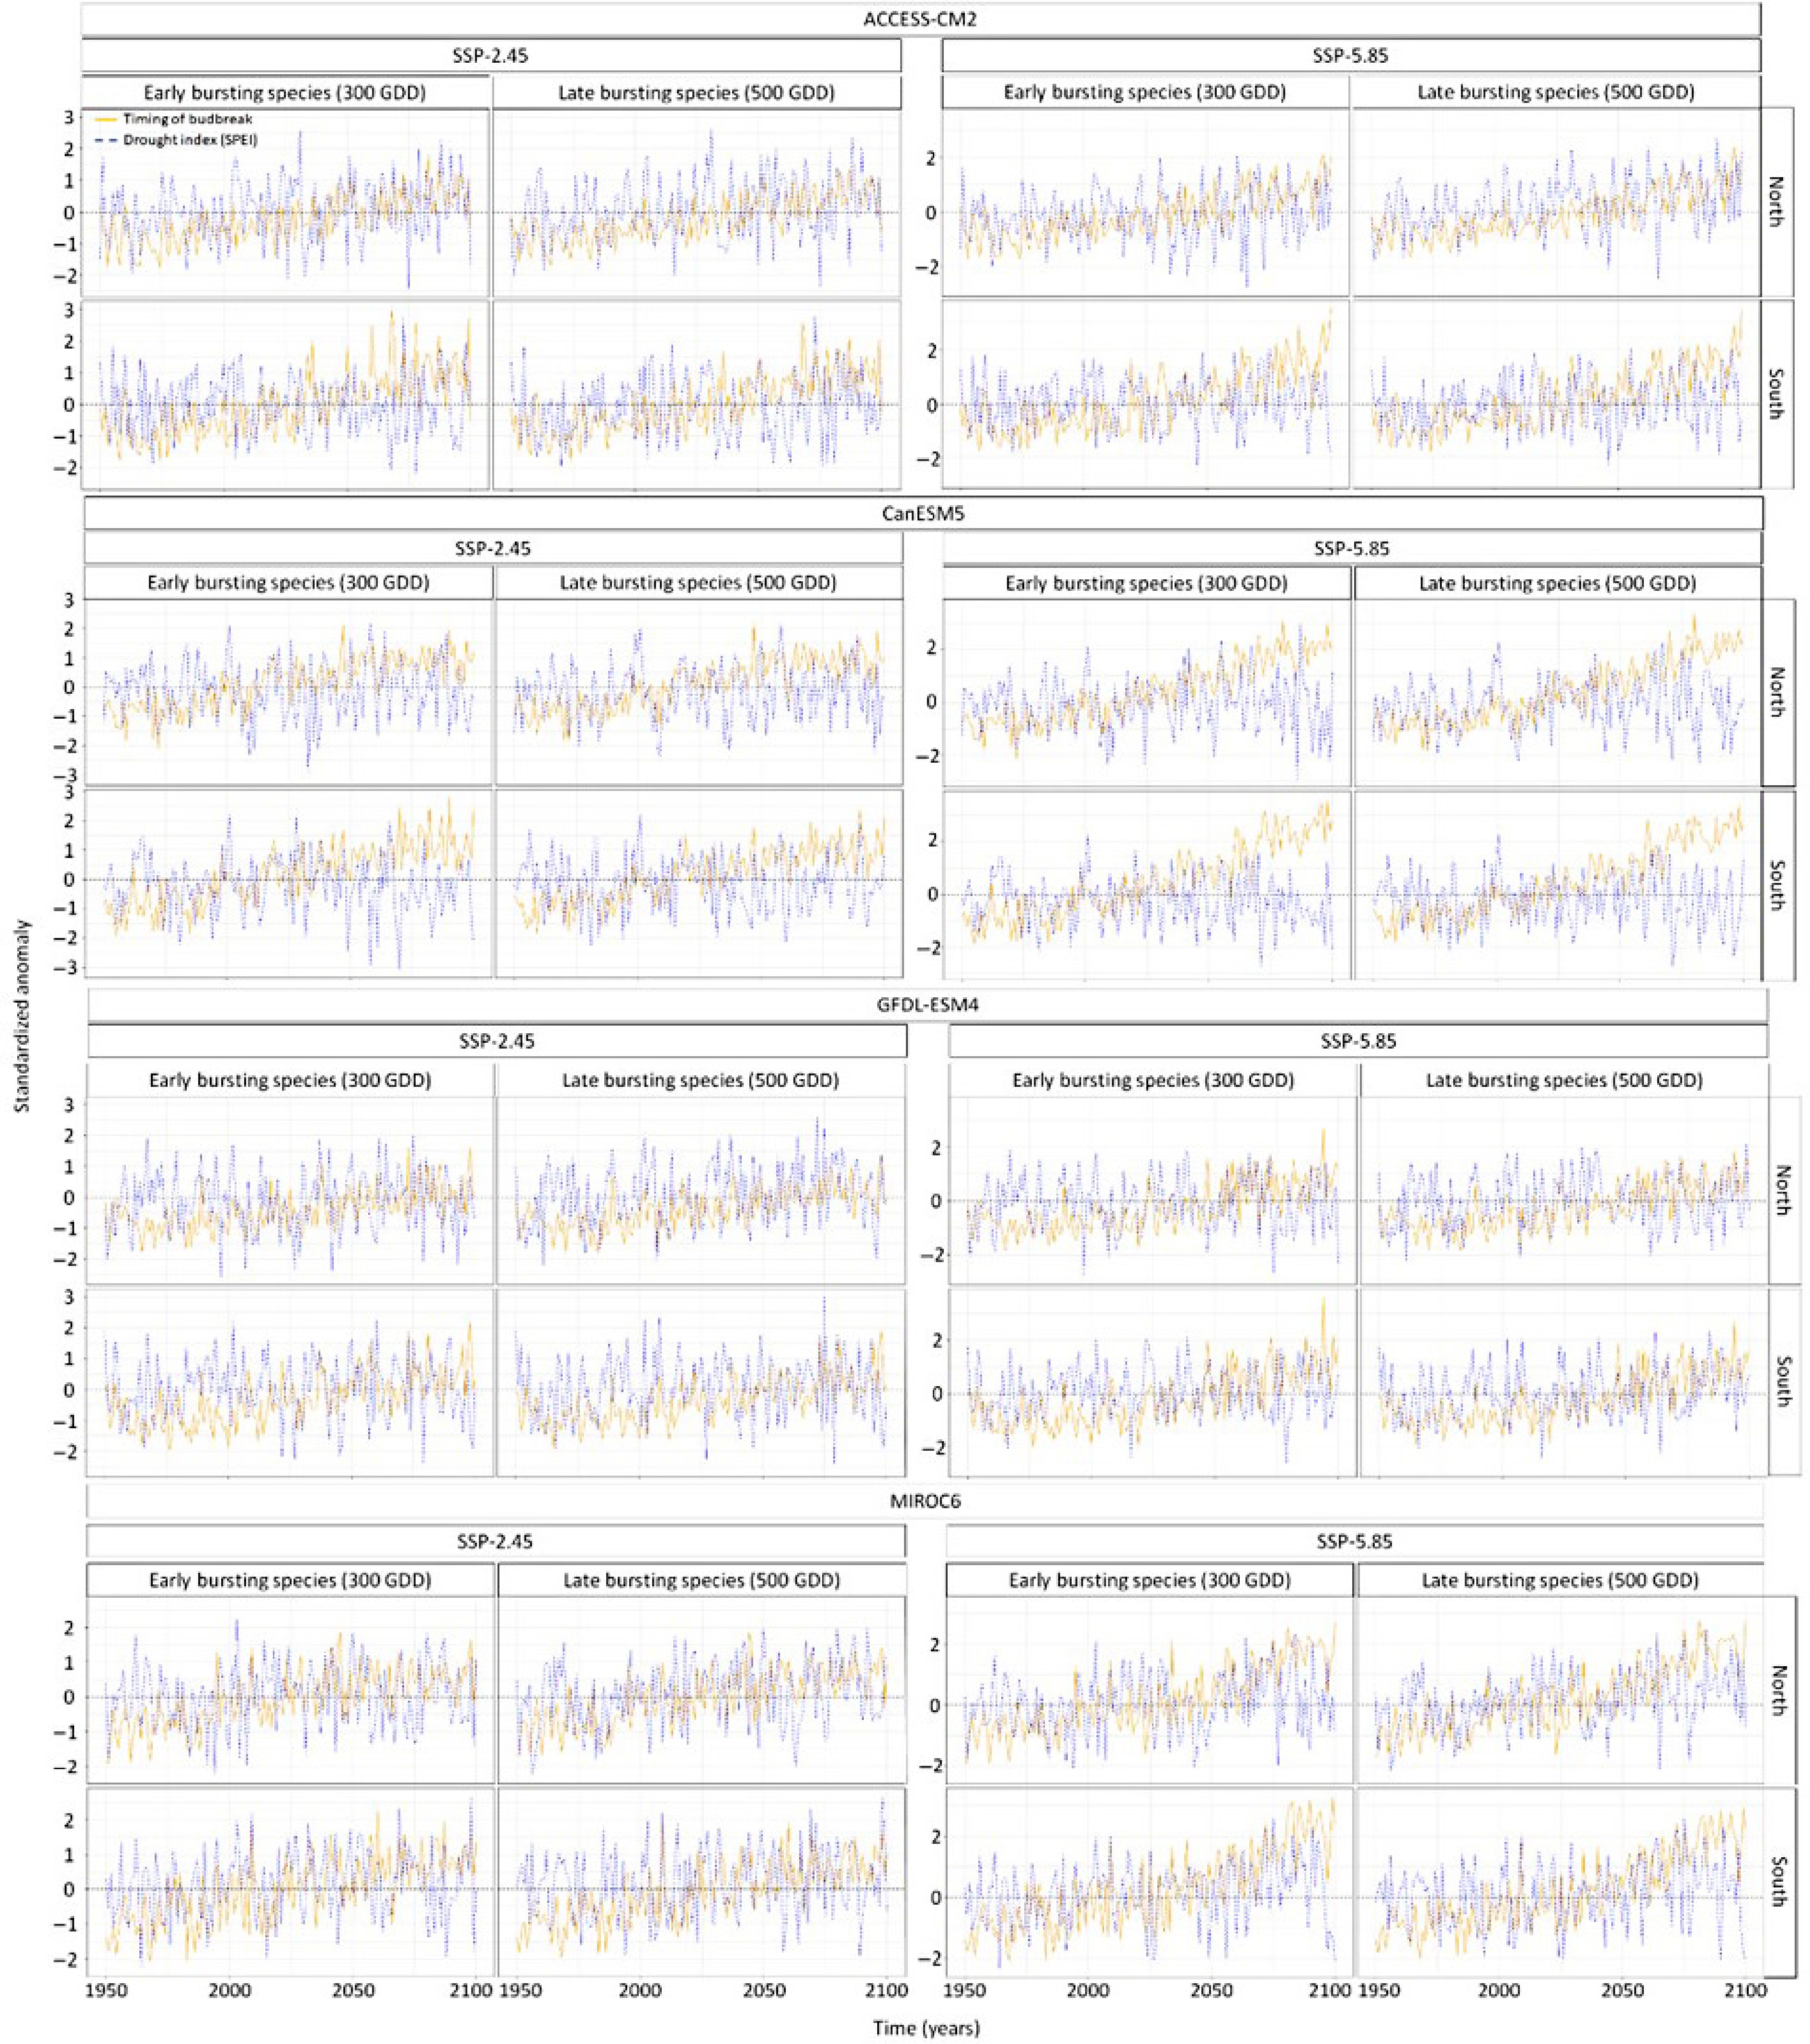
Figure 5.
Standardized temporal trends in the anomaly of species exhibiting early and late timing of budbreak and in anomaly in drought index per climate model, socioeconomic pathways, sites. Standardization was conducted by subtracting each value by the mean and then divide it by the standard deviation. This statistical process was done using the scale function in the R software for statistical computing. The blue line shows the scaled anomalies in the drought index whereas the orange line shows the scaled timing of budbreak.
-
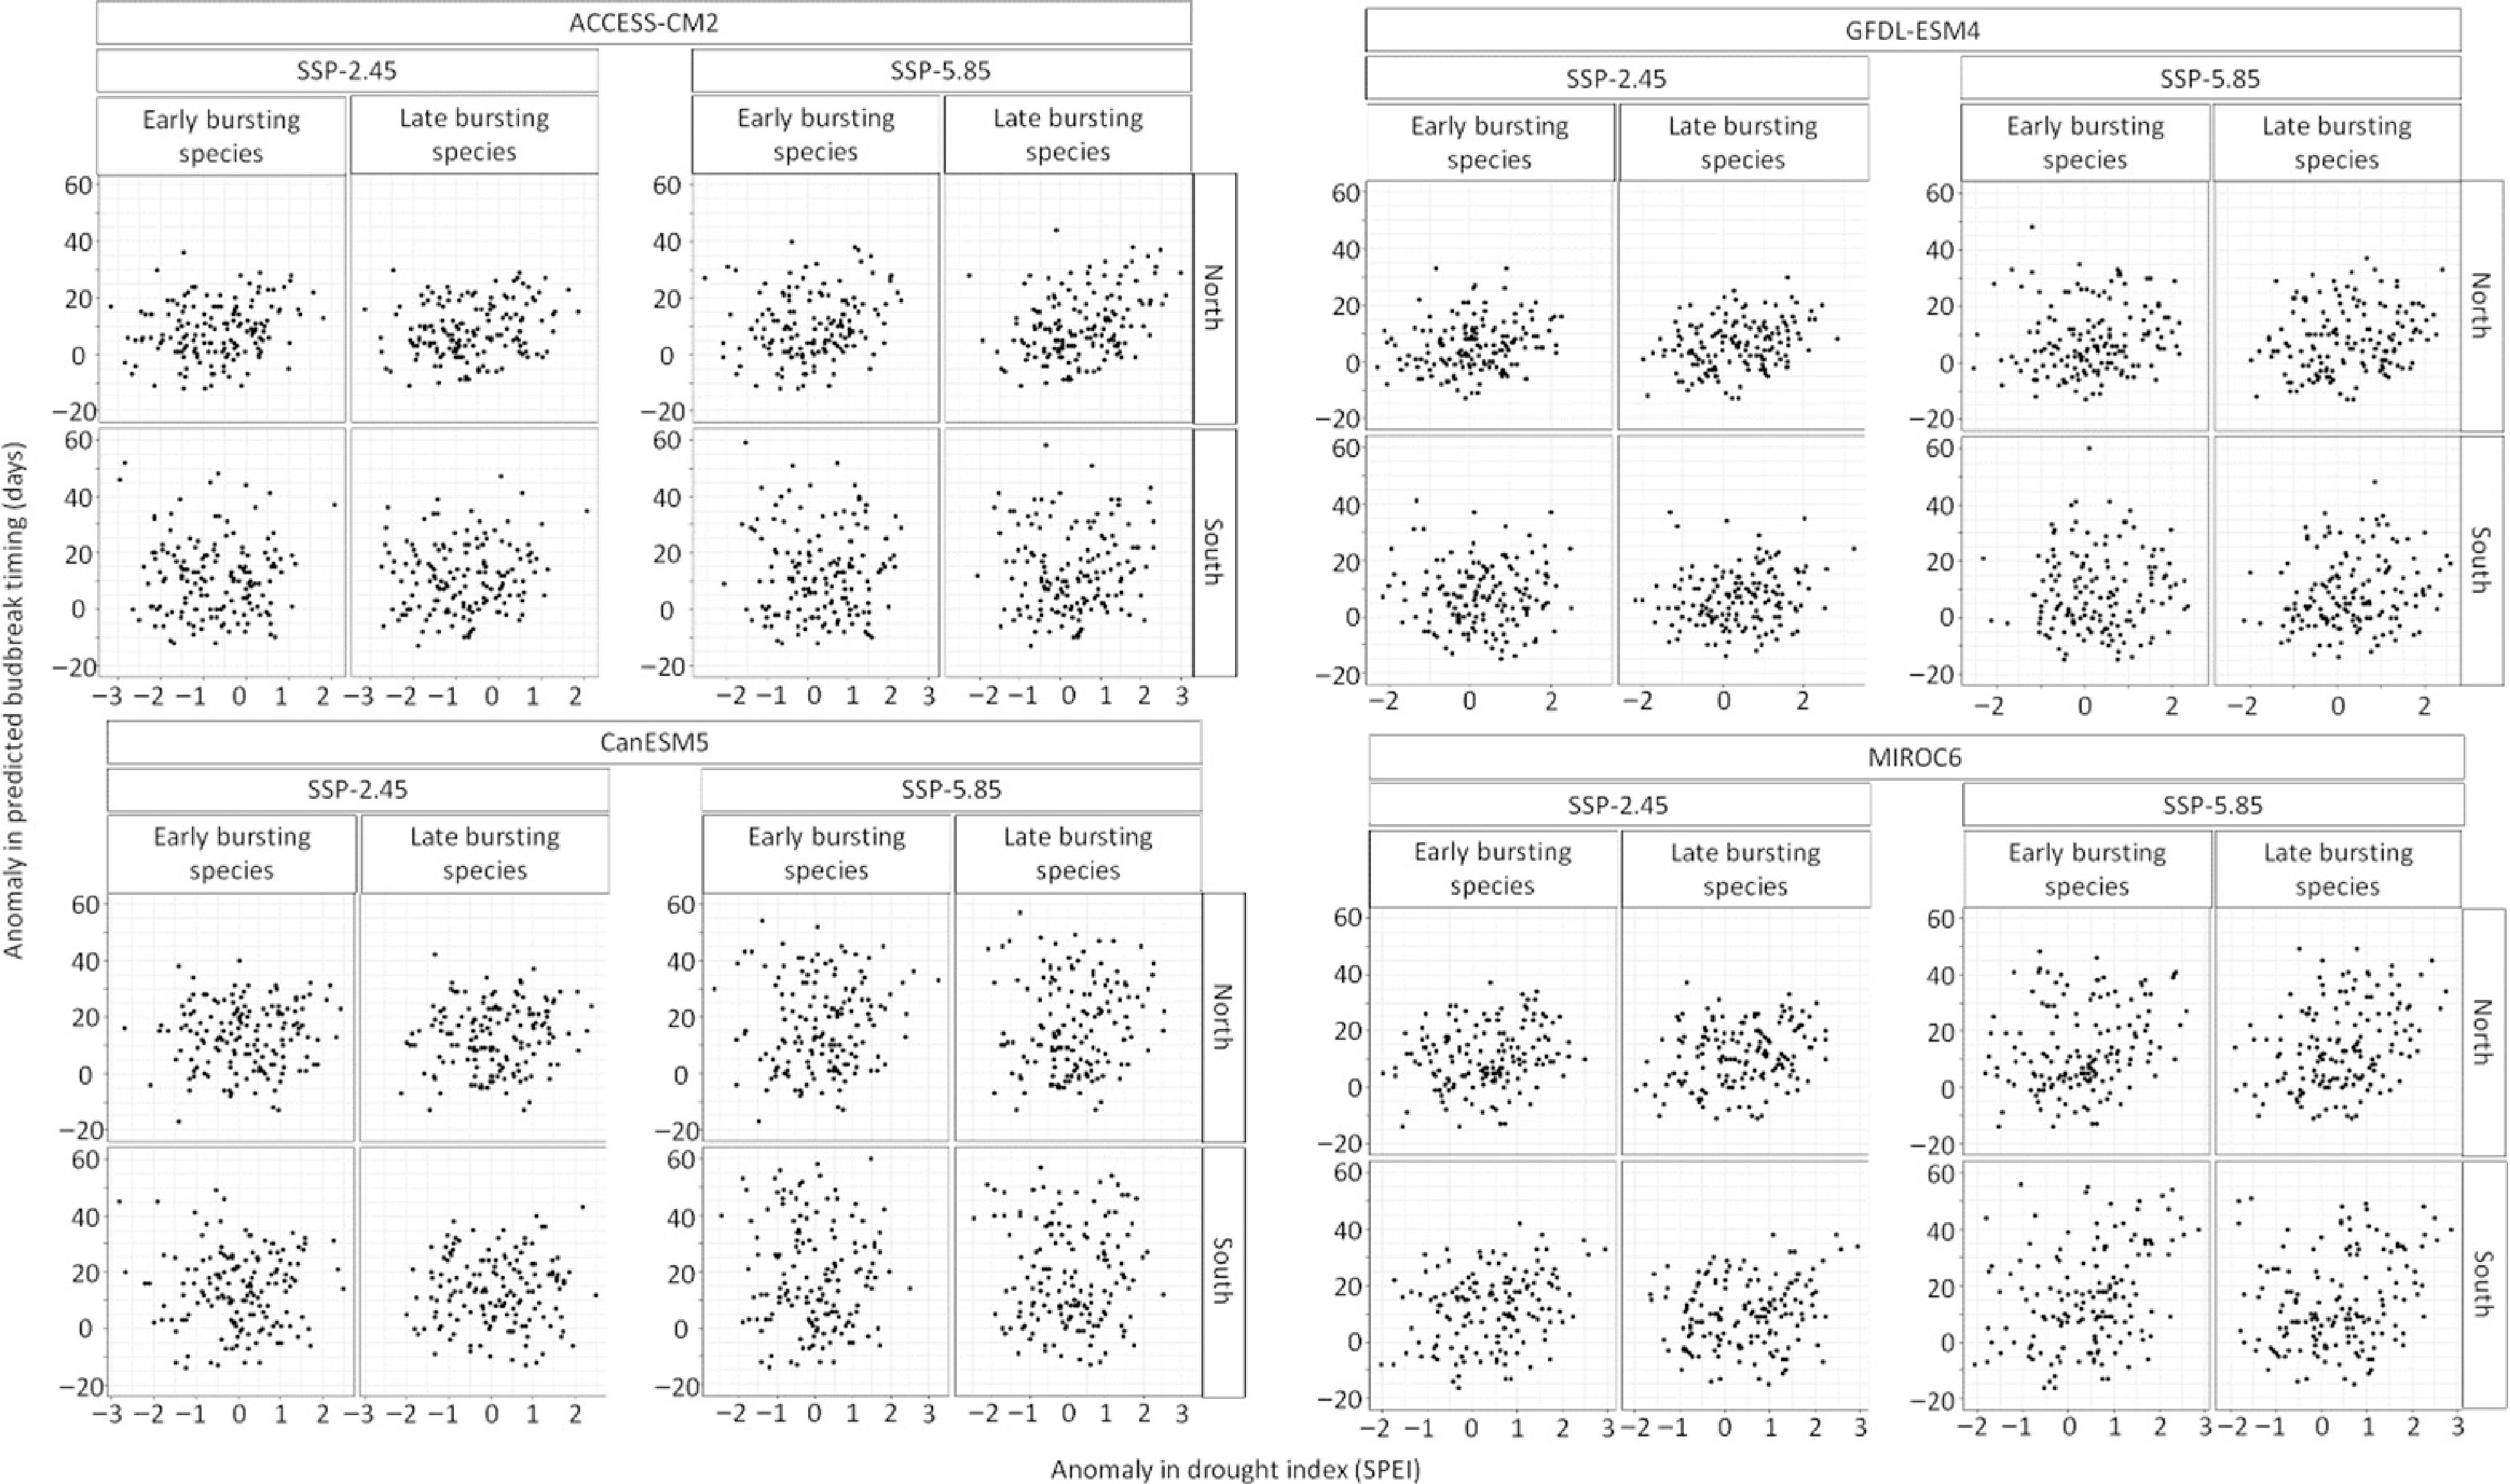
Figure 6.
Relation between the anomaly in species exhibiting early (once 300 growing degree-days have accumulated) and late (once 500 growing degree days have accumulated) timing of budbreak and the anomaly in drought index during timing of budbreak per site, climate model, and socioeconomic pathways.
Figures
(6)
Tables
(0)