-
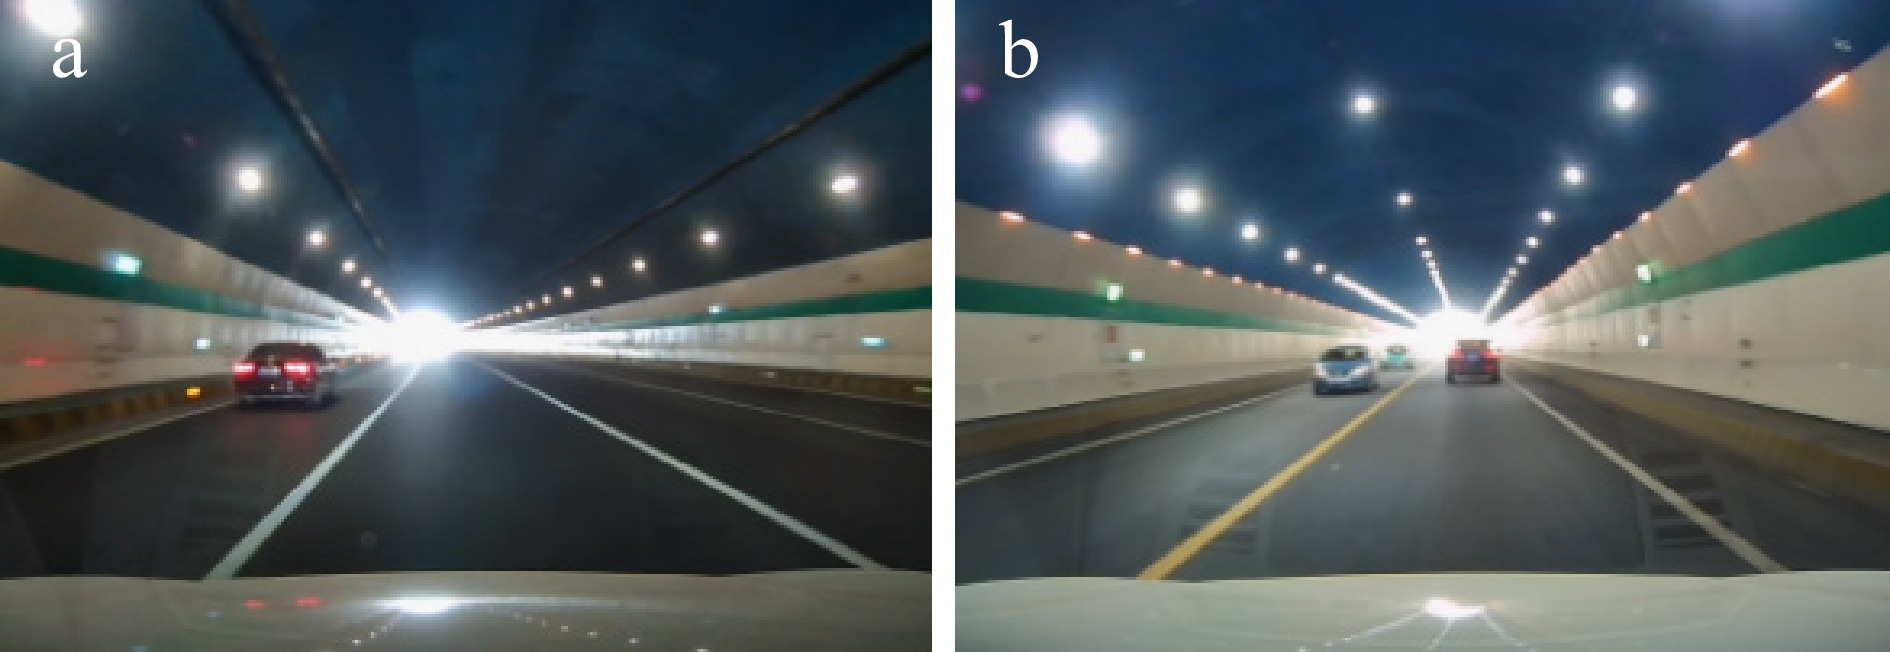
Figure 1.
Vehicle experiment scene. (a) Exit area of freeway tunnel; (b) exit area of highway tunnel.
-
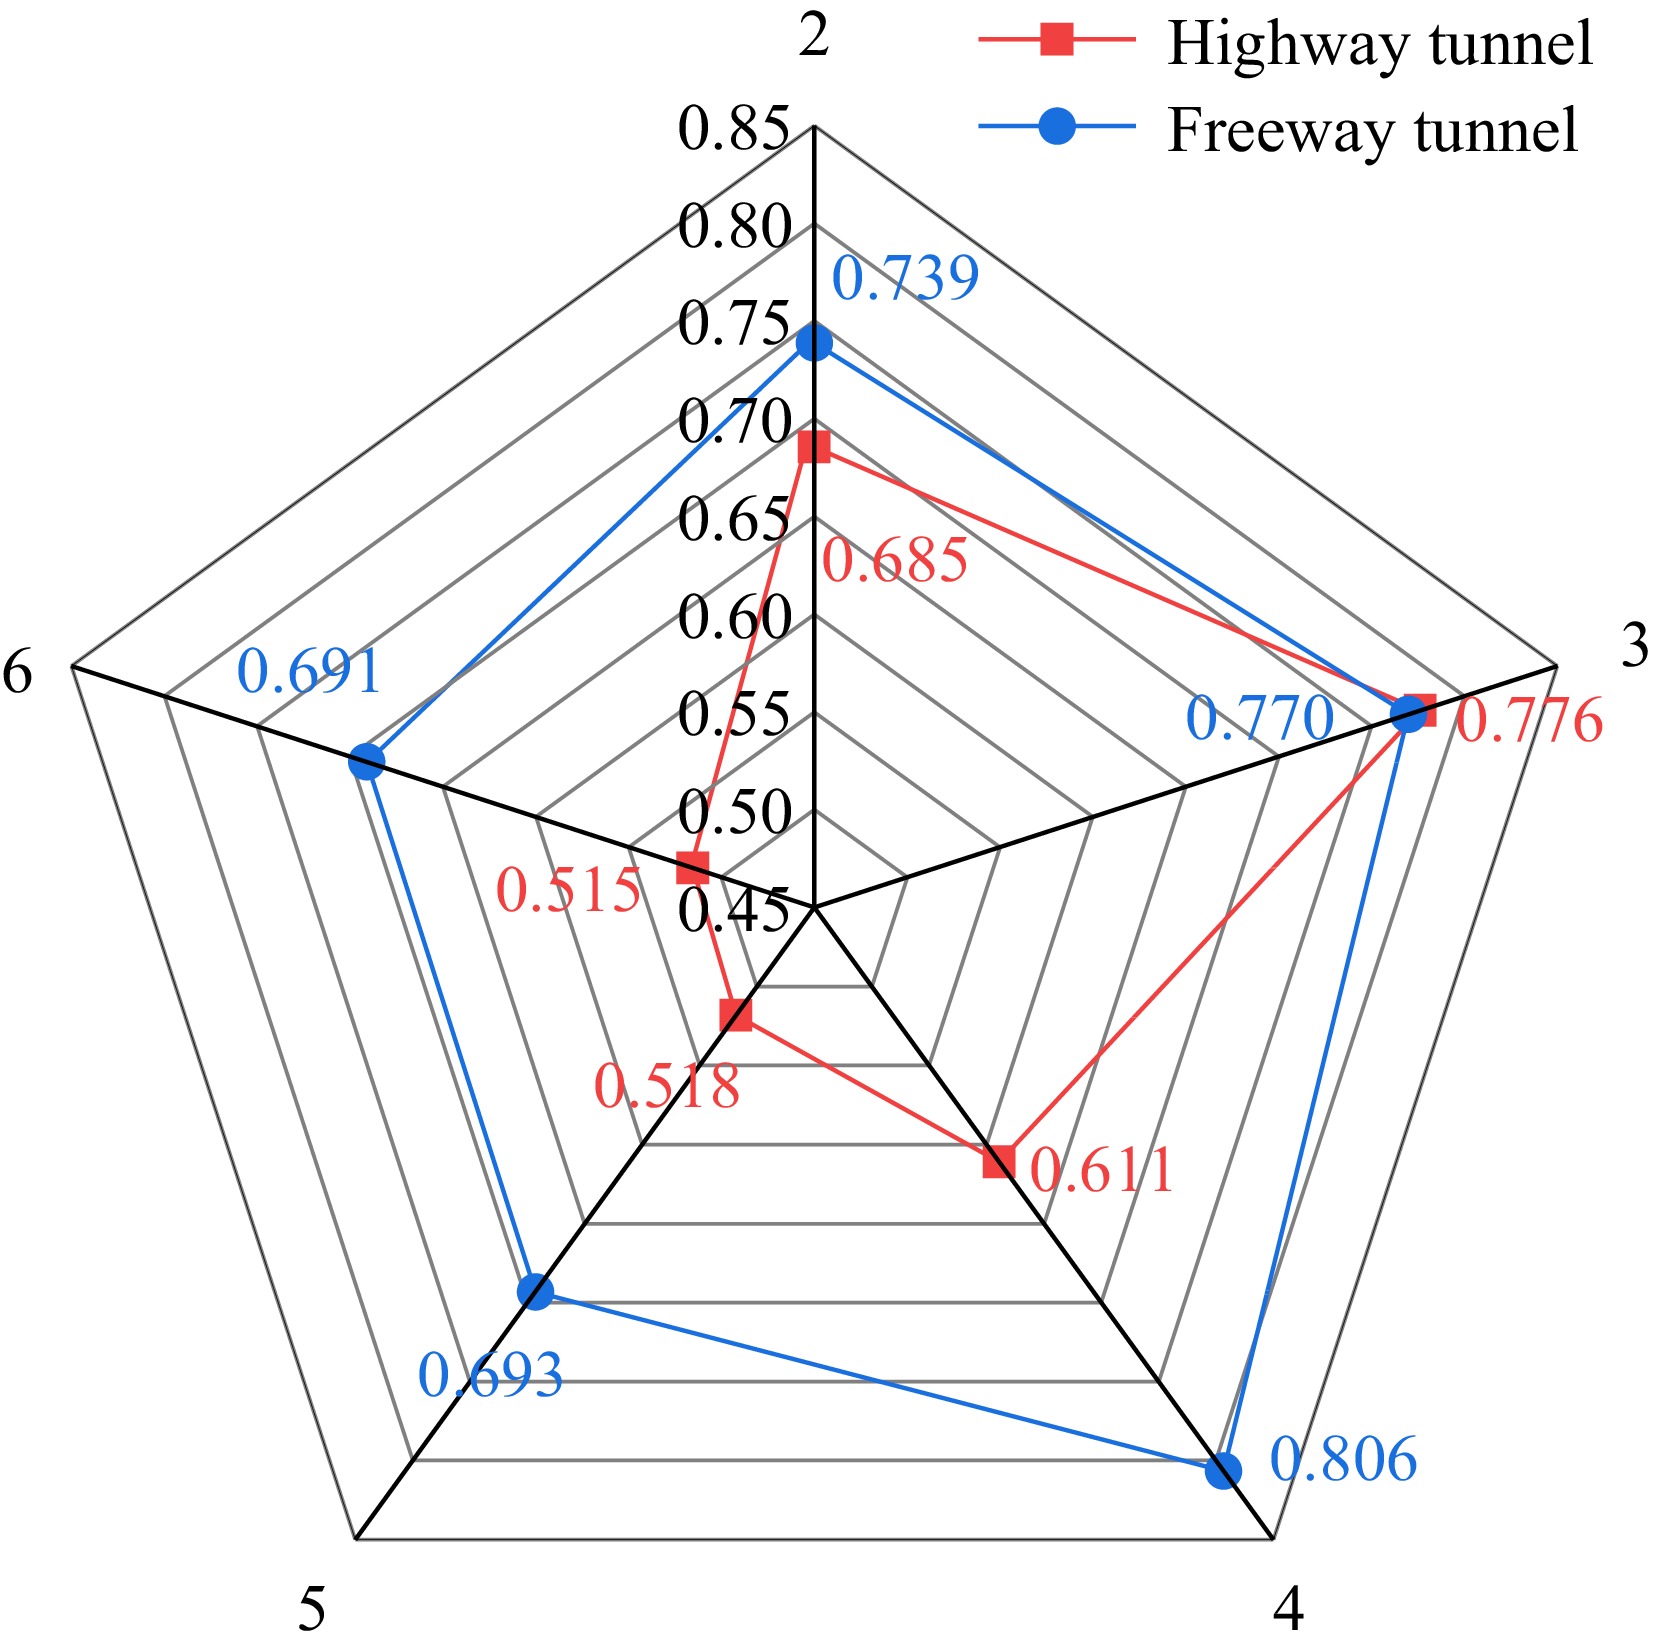
Figure 2.
Contour coefficient for different numbers of clusters at the fixation points.
-
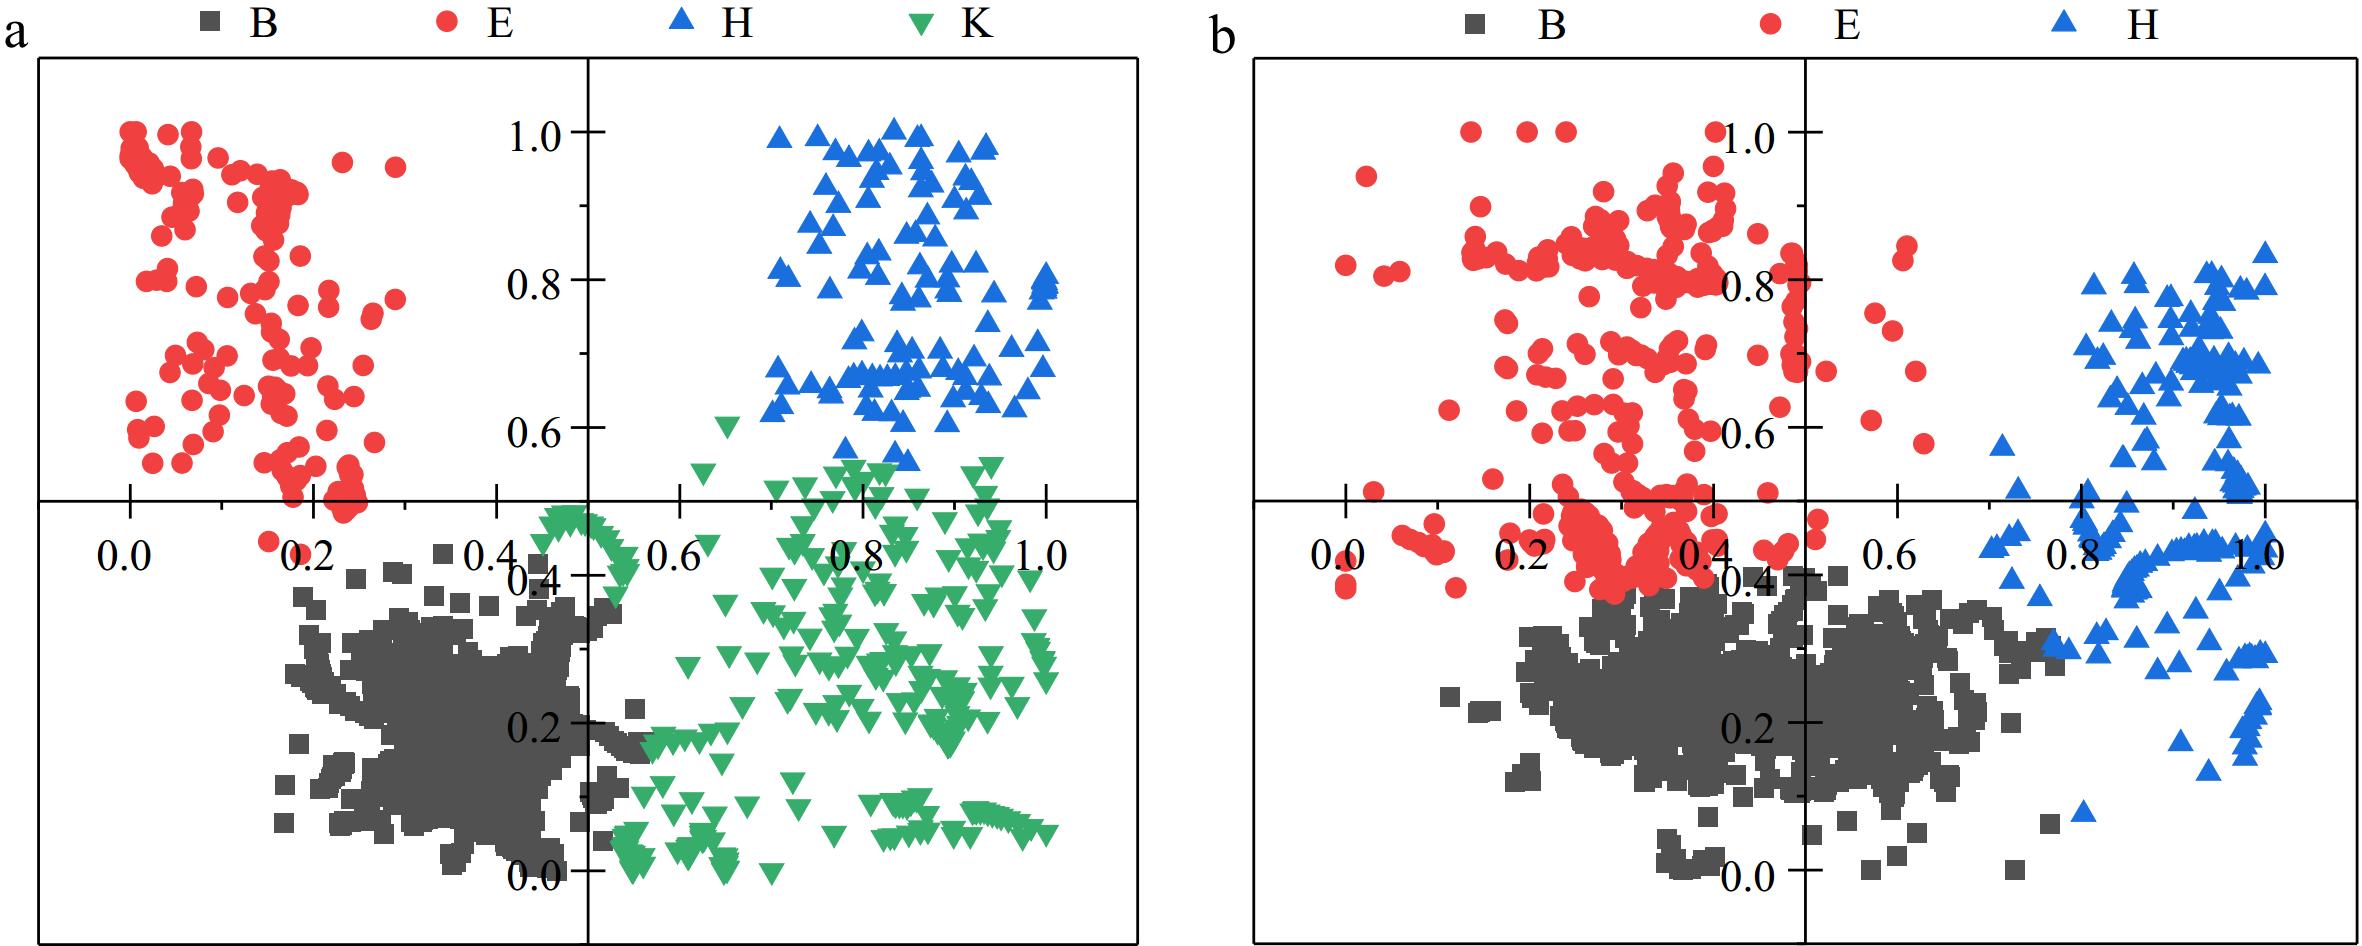
Figure 3.
Clustering of fixation points for exits of different grades of tunnels. (a) Exit area of freeway tunnel; (b) exit area of highway tunnel.
-
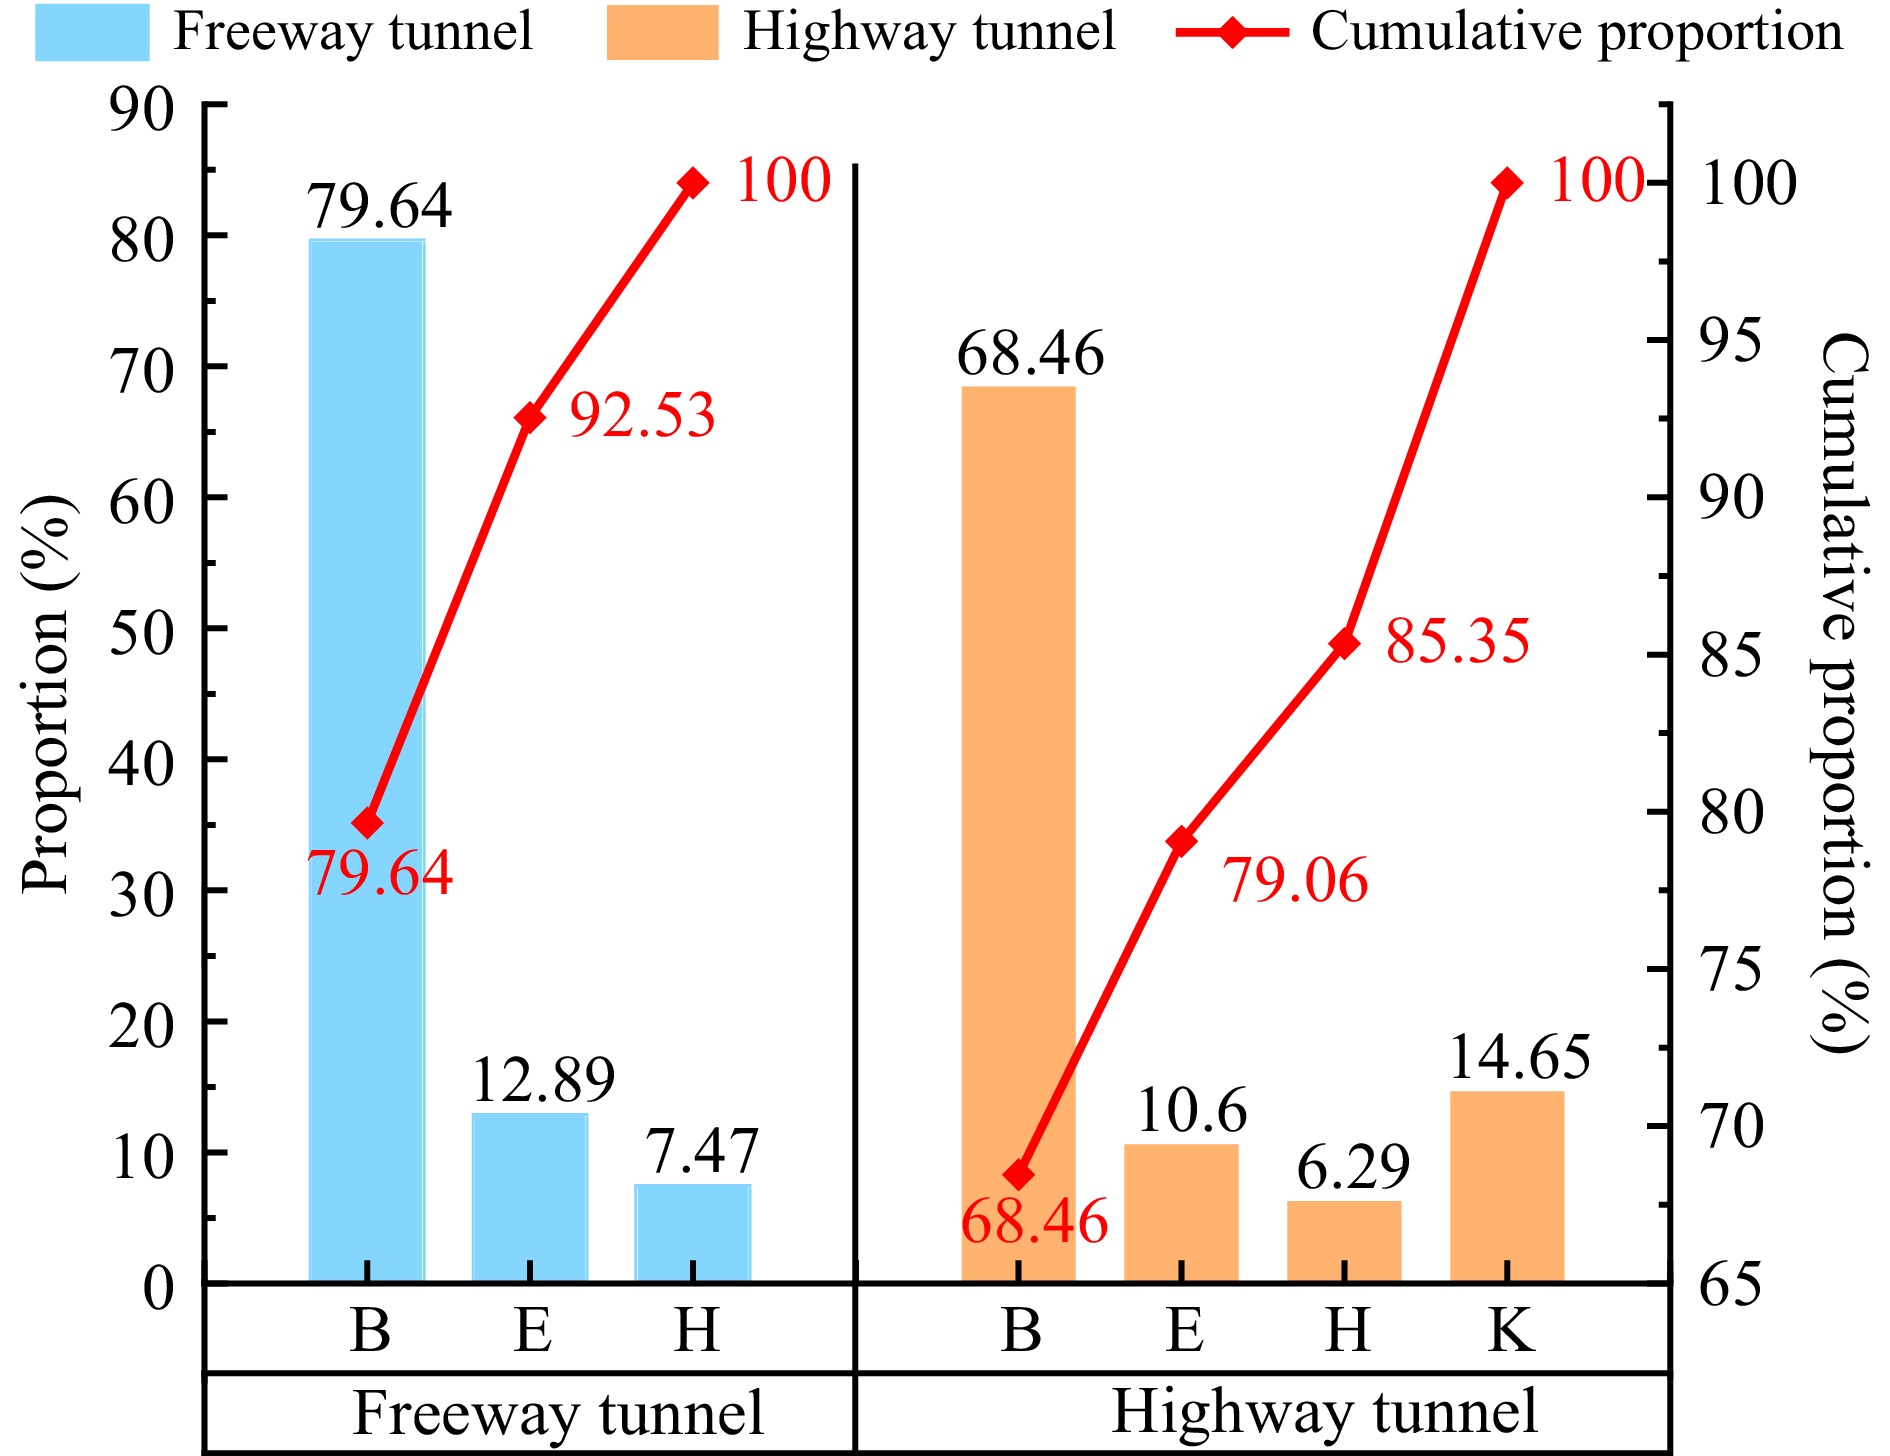
Figure 4.
Percentage of fixation points and cumulative percentage.
-
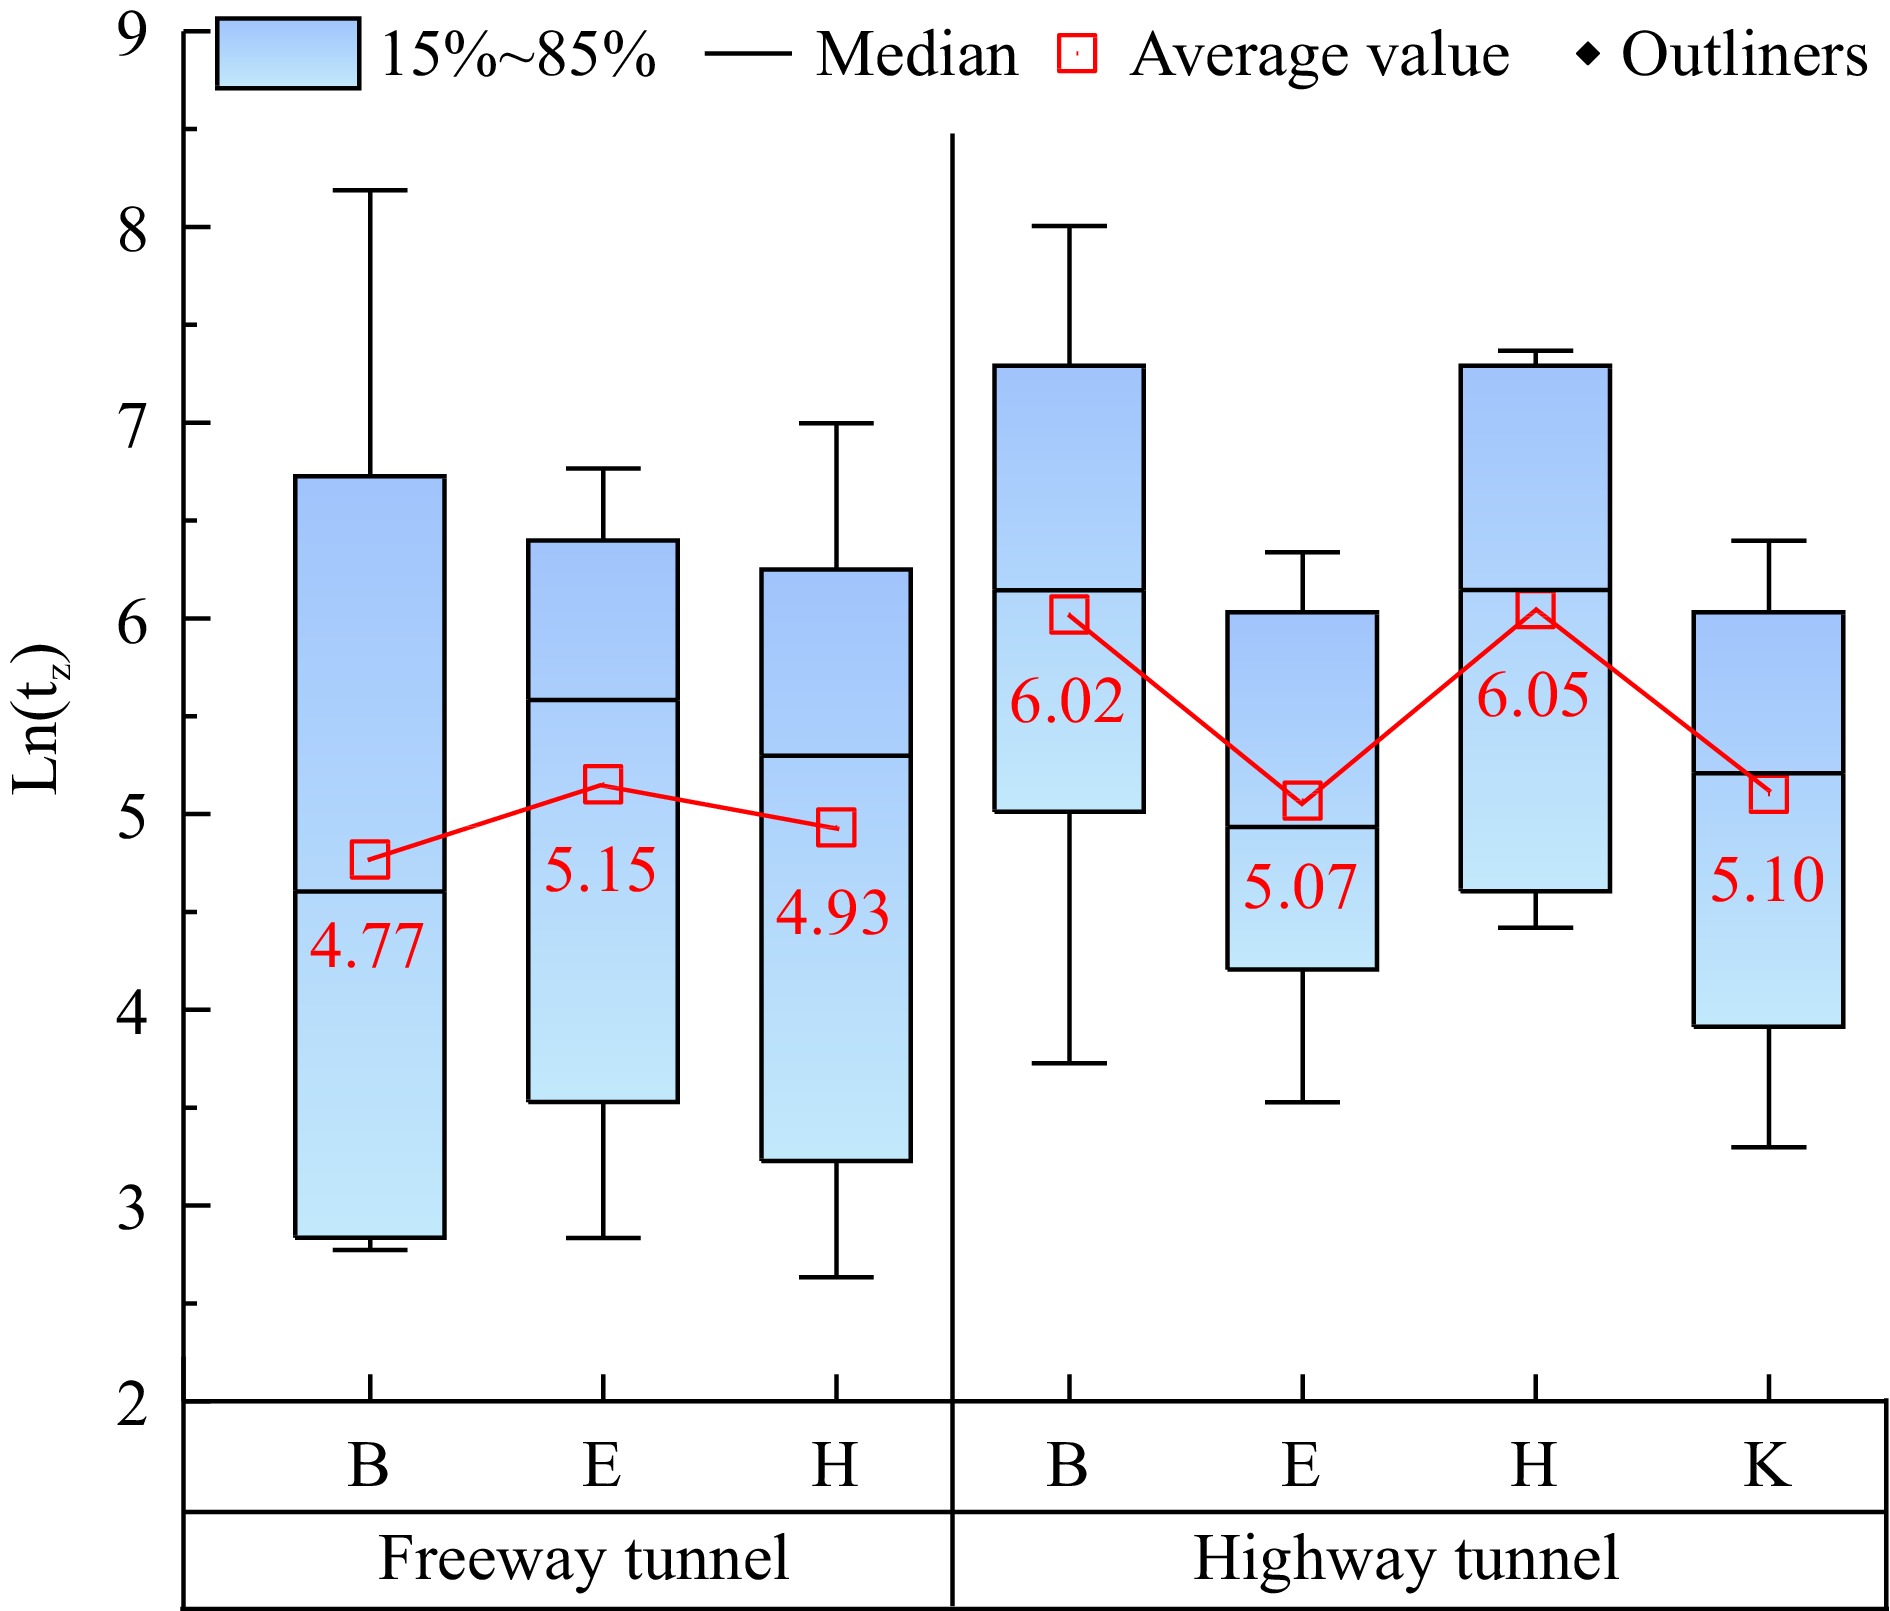
Figure 5.
Boxplot of fixation time.
-
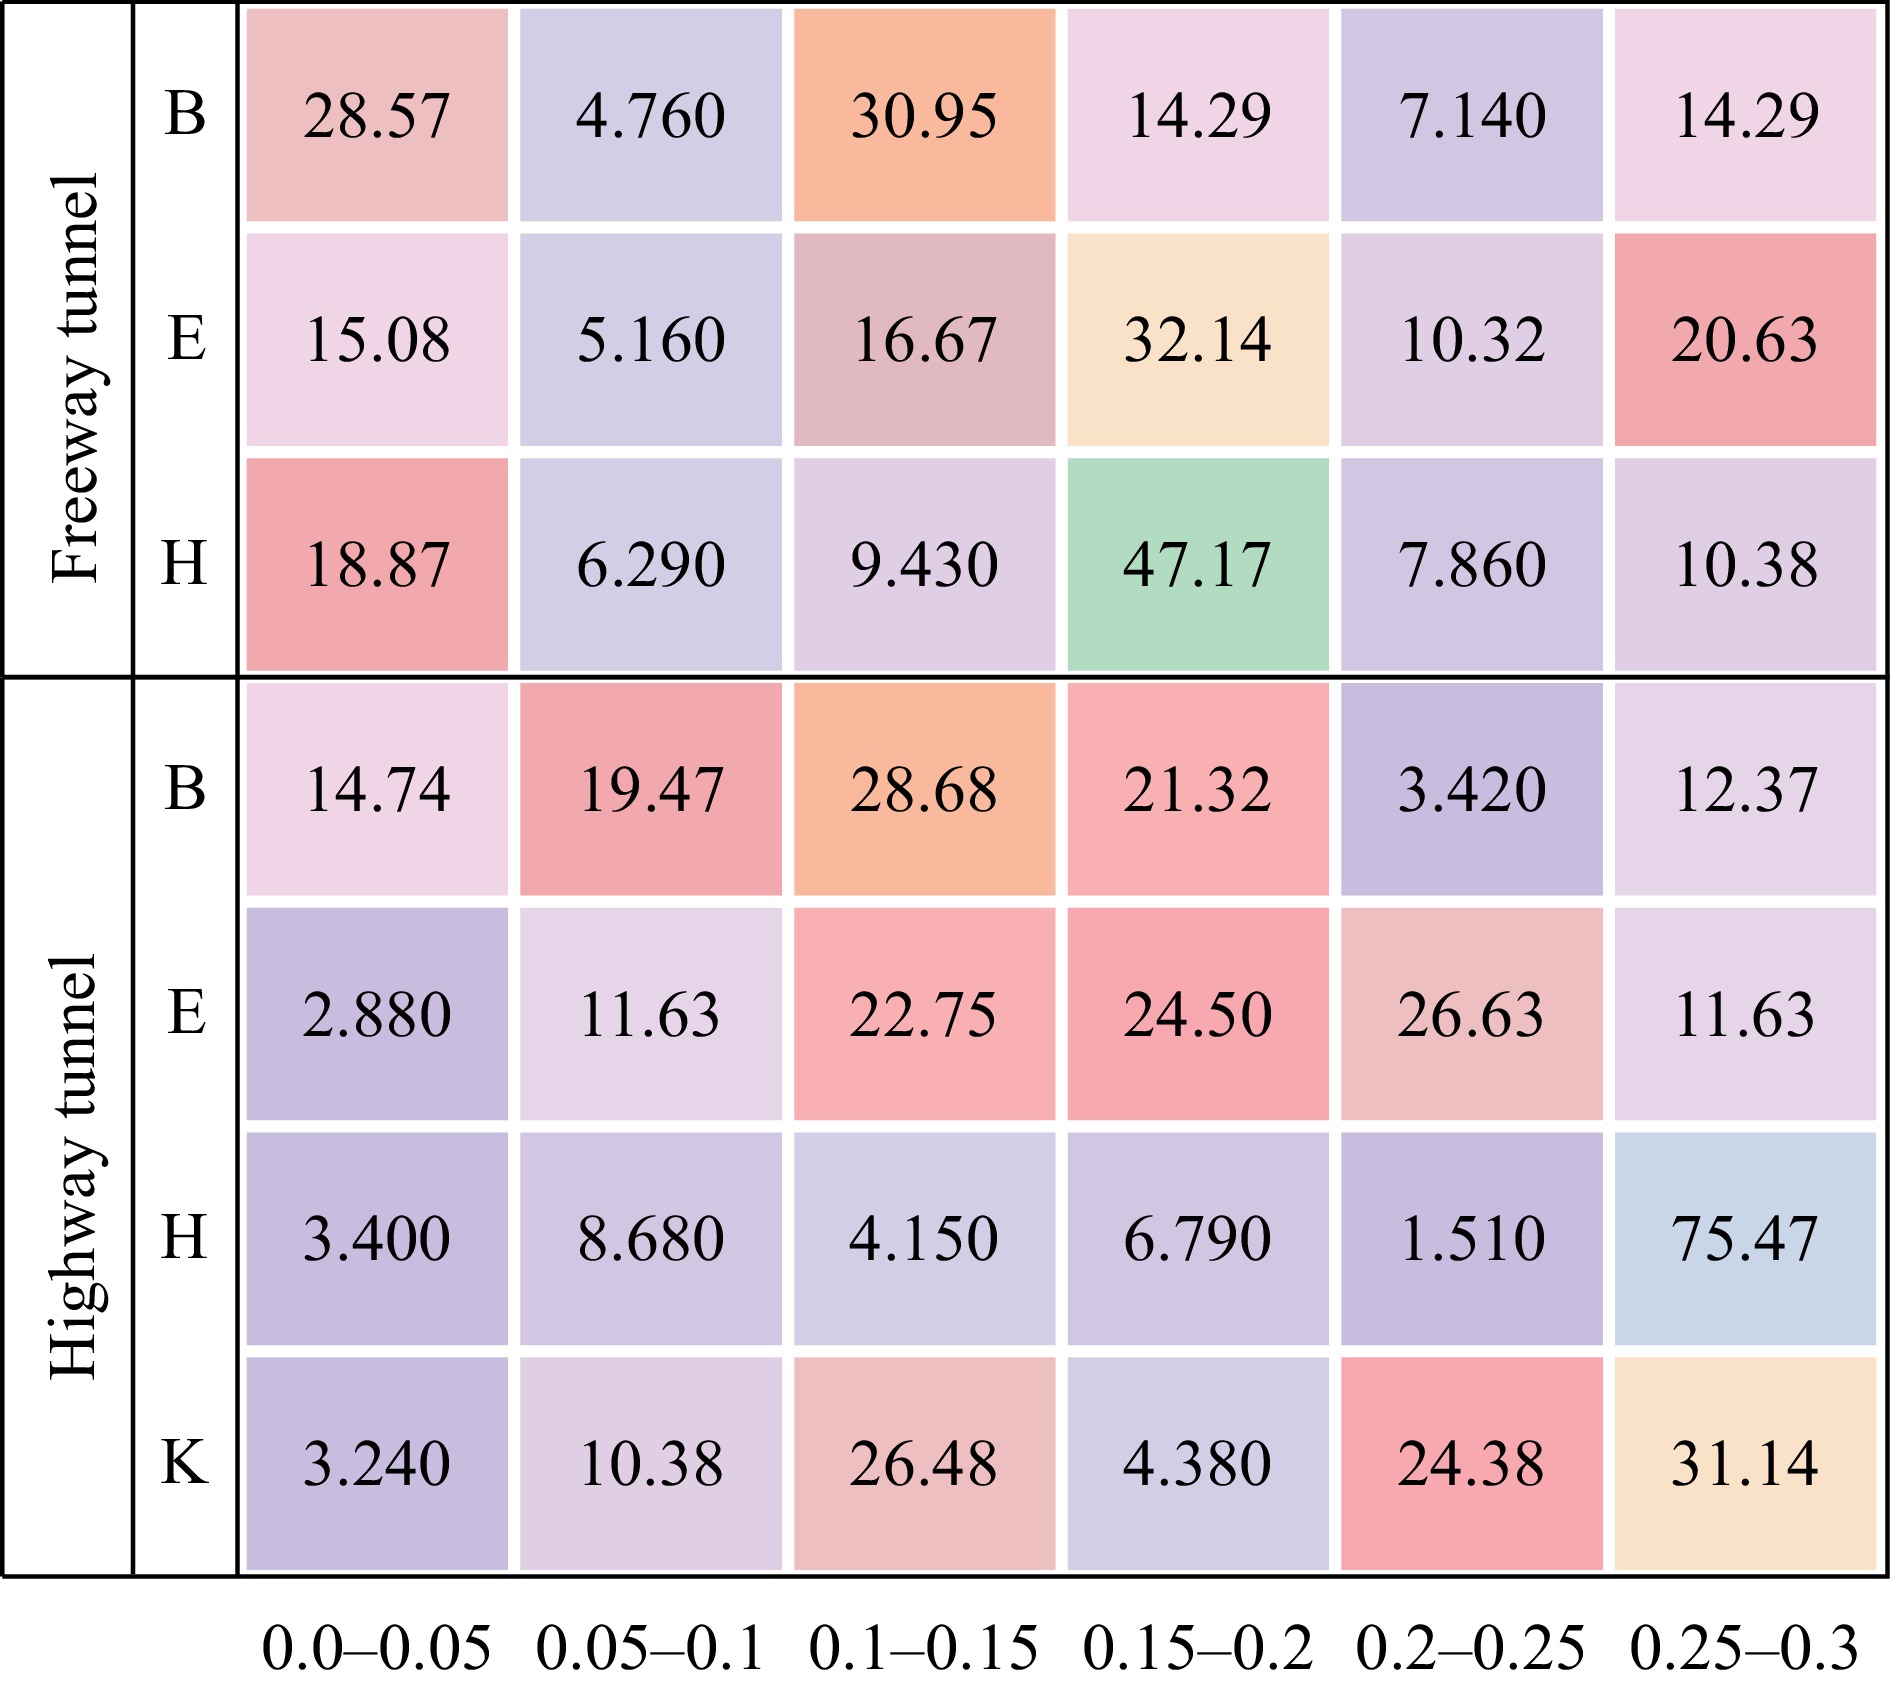
Figure 6.
Percentage of scanning speed by interval within each category.
-
Characteristic Freeway tunnel Highway tunnel Exit linear Straightness Tunnel portal direction Northbound exit Tunnel grade Primary Secondary Speed limit 100 km/h 40 km/h Tunnel structure Dual access 8 lanes
in both directionsSingle access 4 lanes in both directions Traffic composition Motor vehicles Pedestrian, motor vehicles, non-motorized vehicles Table 1.
Information on the basic parameters of the tunnels.
-
Section Freeway tunnel Highway tunnel 0.0−0.05 22.62% 4.58% 0.05−0.1 5.36% 10.37% 0.1−0.15 19.64% 17.13% 0.15−0.2 27.98% 12.47% 0.2−0.25 8.33% 16.89% 0.25−0.3 13.69% 38.20% Table 2.
Exit area of tunnel exit scanning behavior percentage by interval.
Figures
(6)
Tables
(2)