-
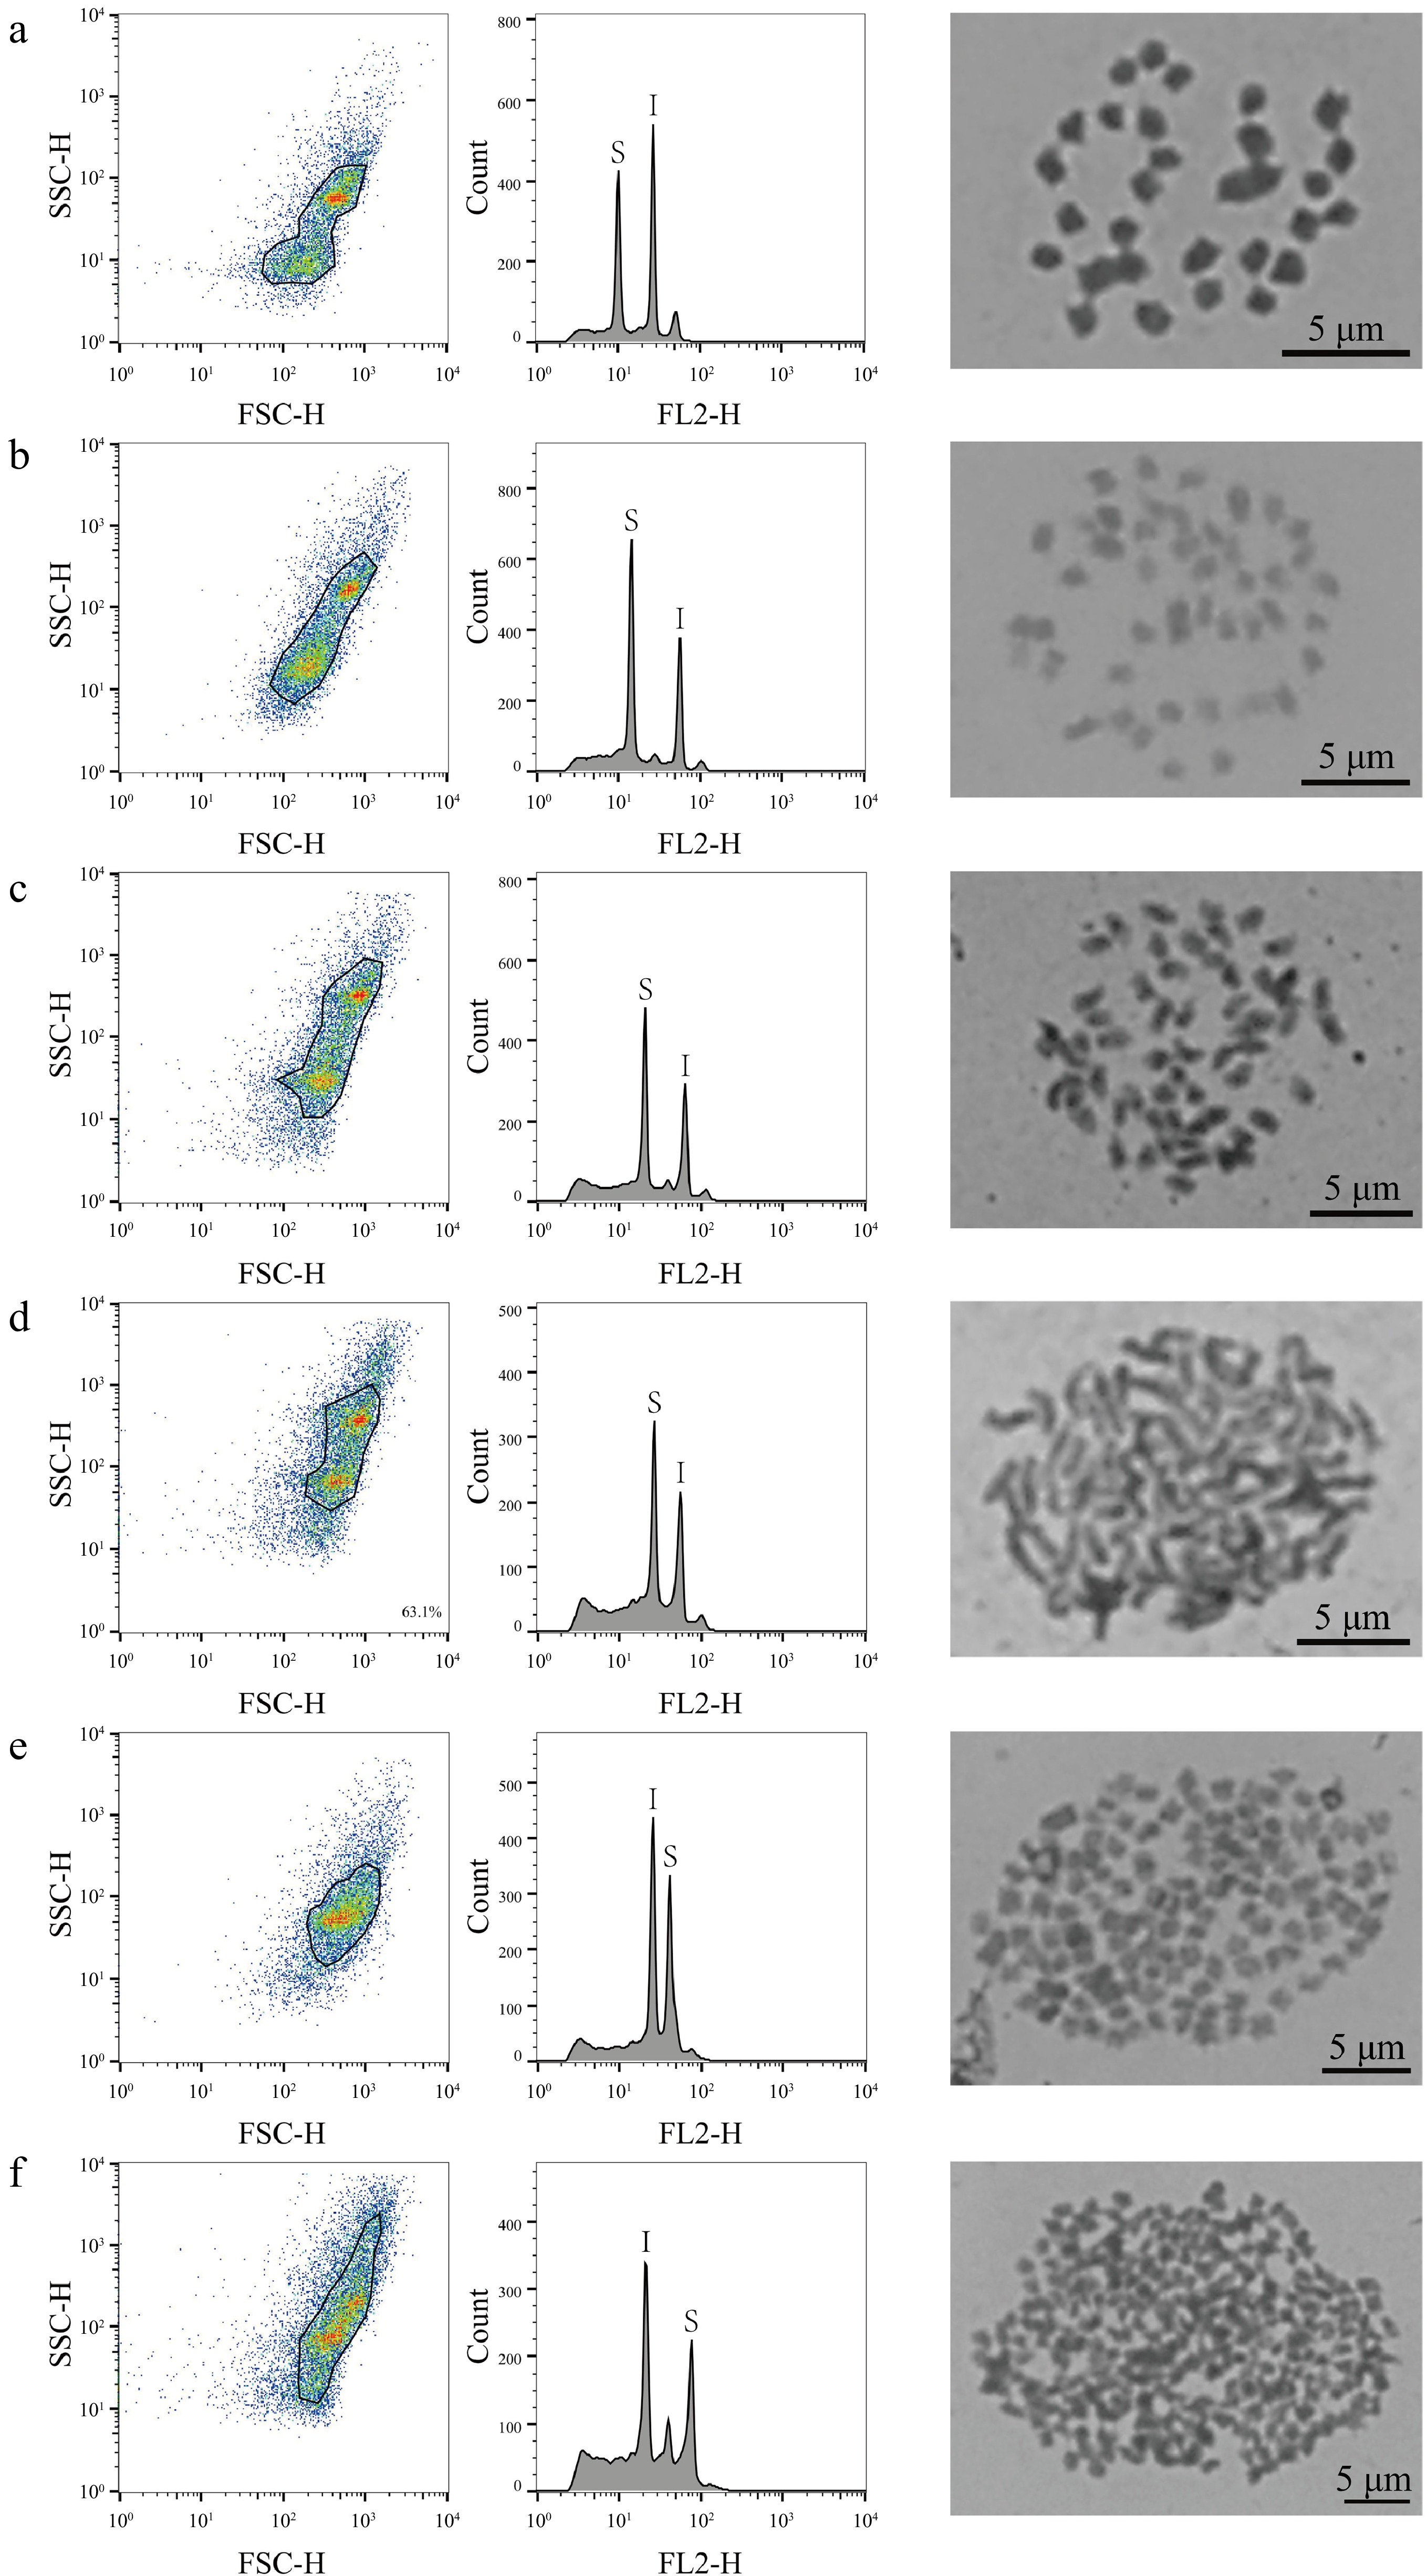
Figure 1.
FCM analysis and chromosome count of mulberry germplasm resources. This figure illustrates the results of FCM analysis and chromosome count of representative material of six different mulberry ploidies. The first column shows the FSC-SSC scatter plot of the sample cells, the horizontal axis is the FSC value, which represents the size of the cells, and the vertical axis is the SSC value, which represents the granularity of the cells. The second column of the graph shows the histograms of fluorescence signals FL2-H and cell counts; the horizontal axis represents the DNA fluorescence intensity, the vertical axis represents the number of cells, S denotes the sample material, and I denotes the internal standard reference material. The graphs in the third column are the chromosome count graphs of the corresponding materials, bar = 5 μm; (a) Shanyu1hao, diploid; (b) K34-1, triploid; (c) Ailaoshan5hao, tetraploid; (d) Huai30-2, hexaploid; (e) Pisang2hao, nine-ploidy; and (f) Yaosang, 22-ploidy.
-
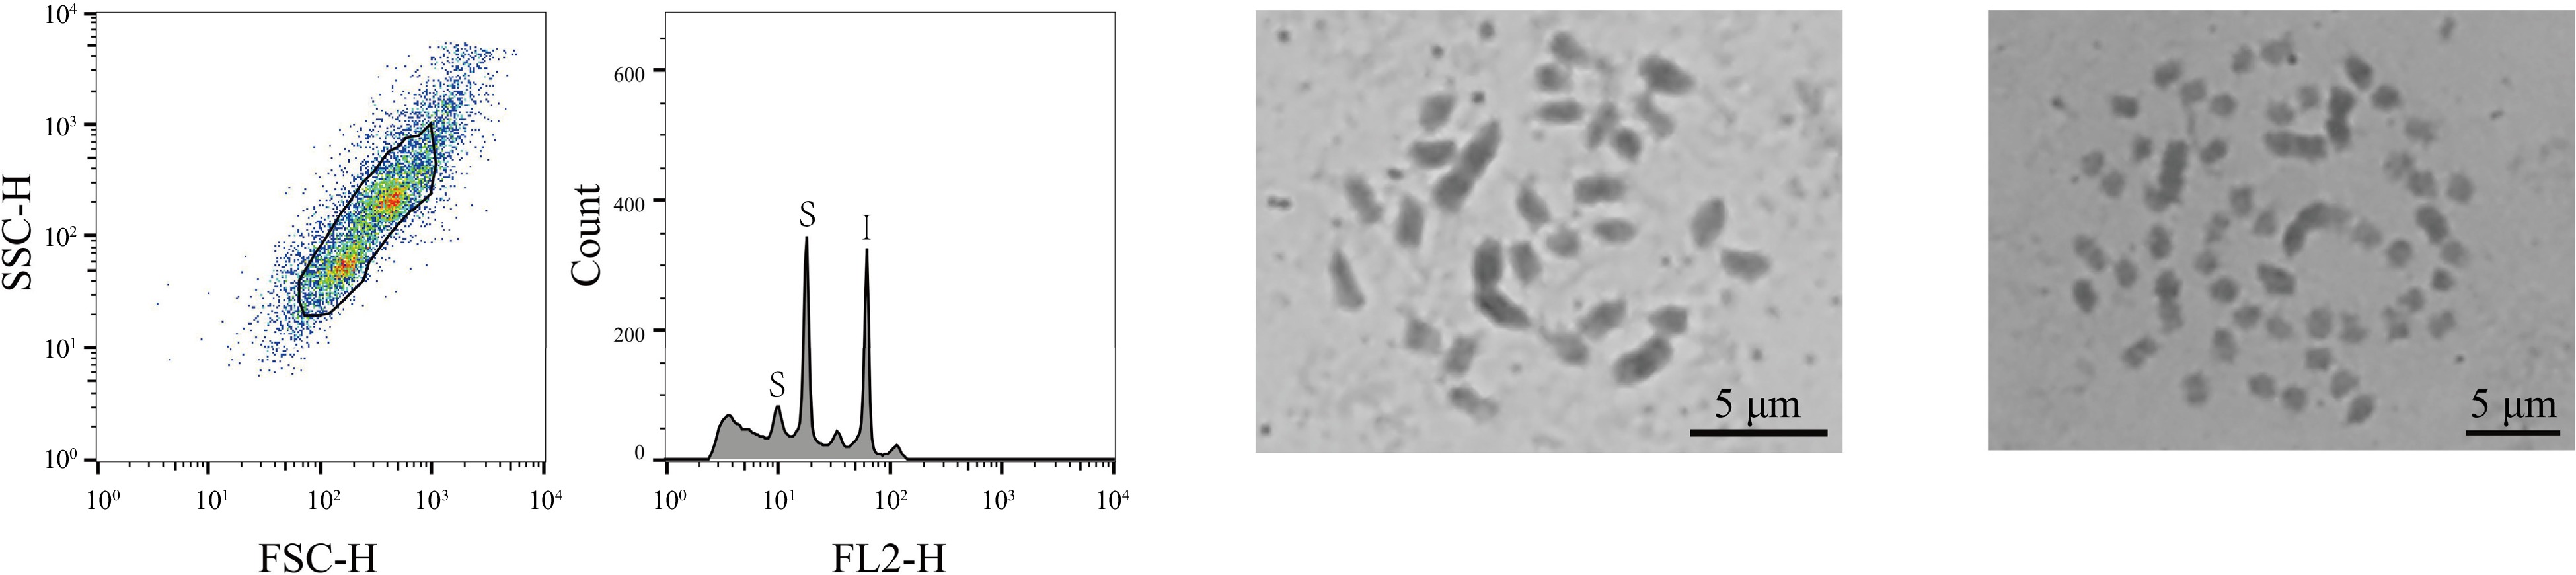
Figure 2.
FCM analysis and chromosome count of the haploid mulberry germplasm resource Jialing30hao. The first graph, from left to right, showed the FSC-SSC scatter plot of the sample cells. The horizontal axis is the FSC value, which represents the size of the cells, and the vertical axis is the SSC value, which means the granularity of the cells. The second graph is the histogram of fluorescence signal FL2-H and cell counts. The horizontal axis represents the DNA fluorescence intensity, the vertical axis represents the number of cells, the S of the first peak indicates the sample diploid of Jialing30hao, the second peak of S indicates the tetraploid of sample Jialing30hao, and I indicates the internal standard references Z. mays. The third graph shows the results of the chromosome count of the diploid of Jialing30hao; and the fourth graph shows the chromosome count results of the tetraploid Jialing30hao, bar = 5 μm.
-
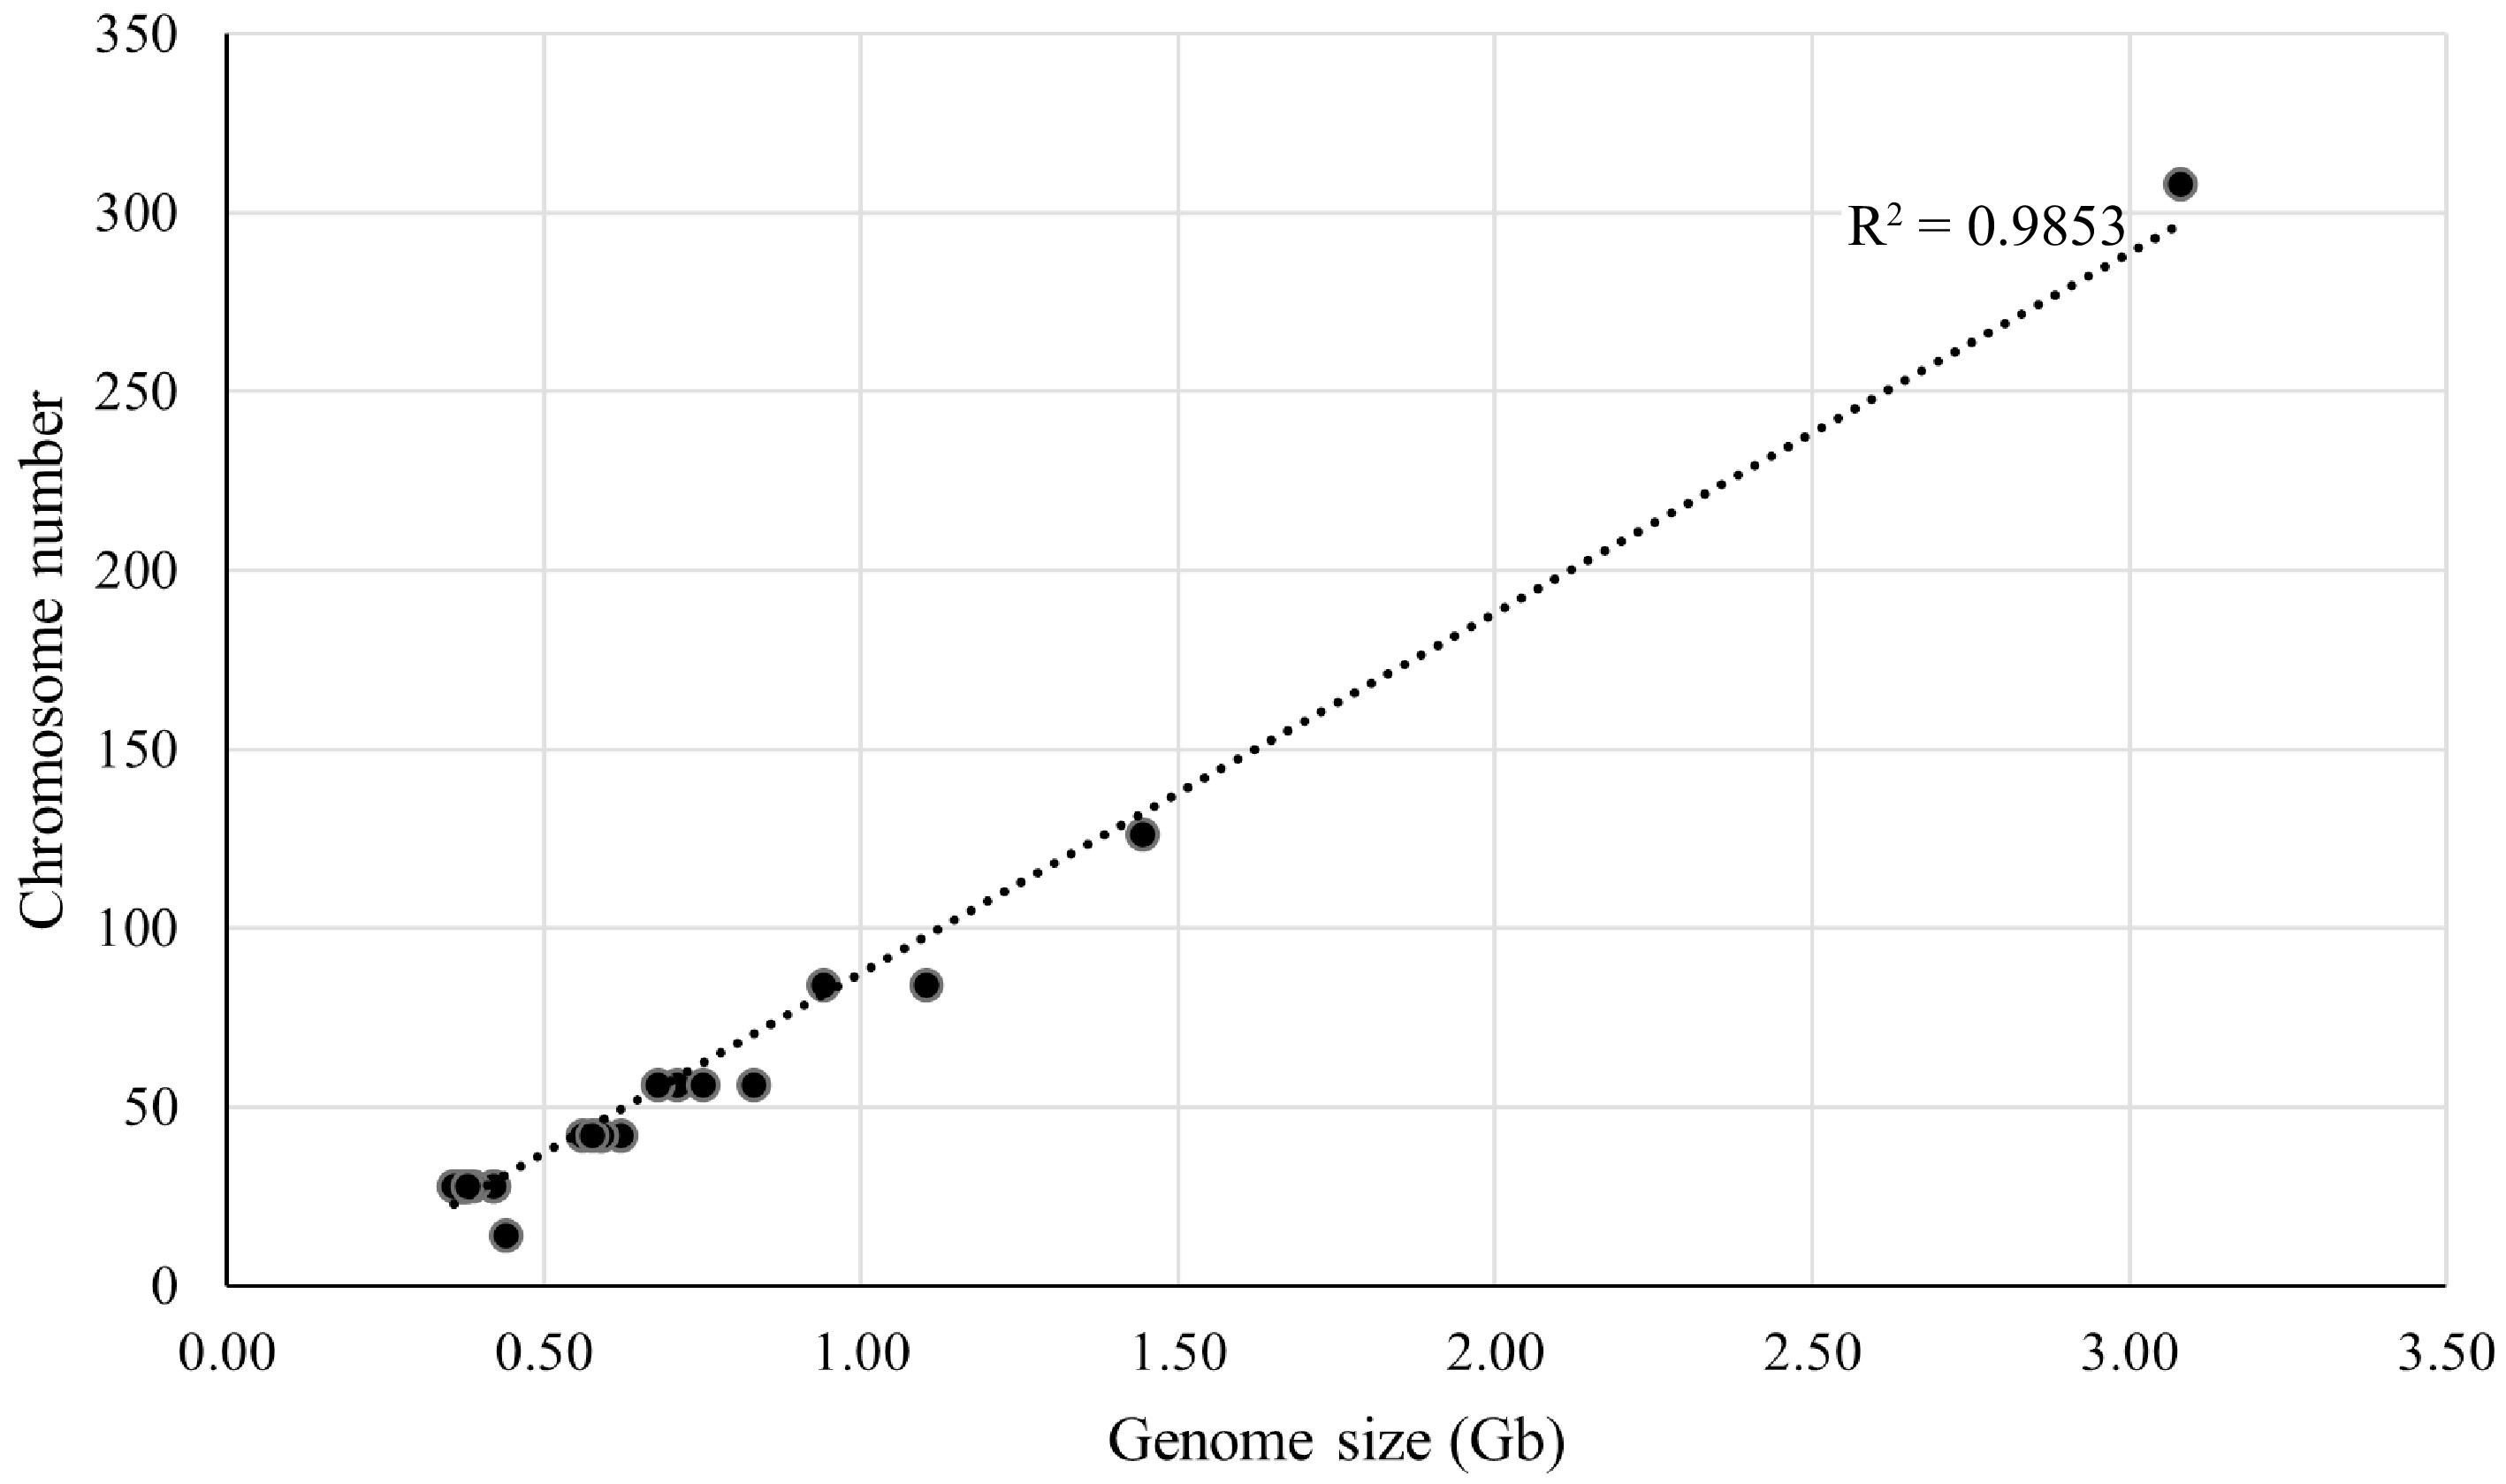
Figure 3.
Linear regression analysis between genome size and chromosome number for 33 representative mulberry samples. The horizontal axis is the genome size, and the vertical axis is the chromosome number.
-
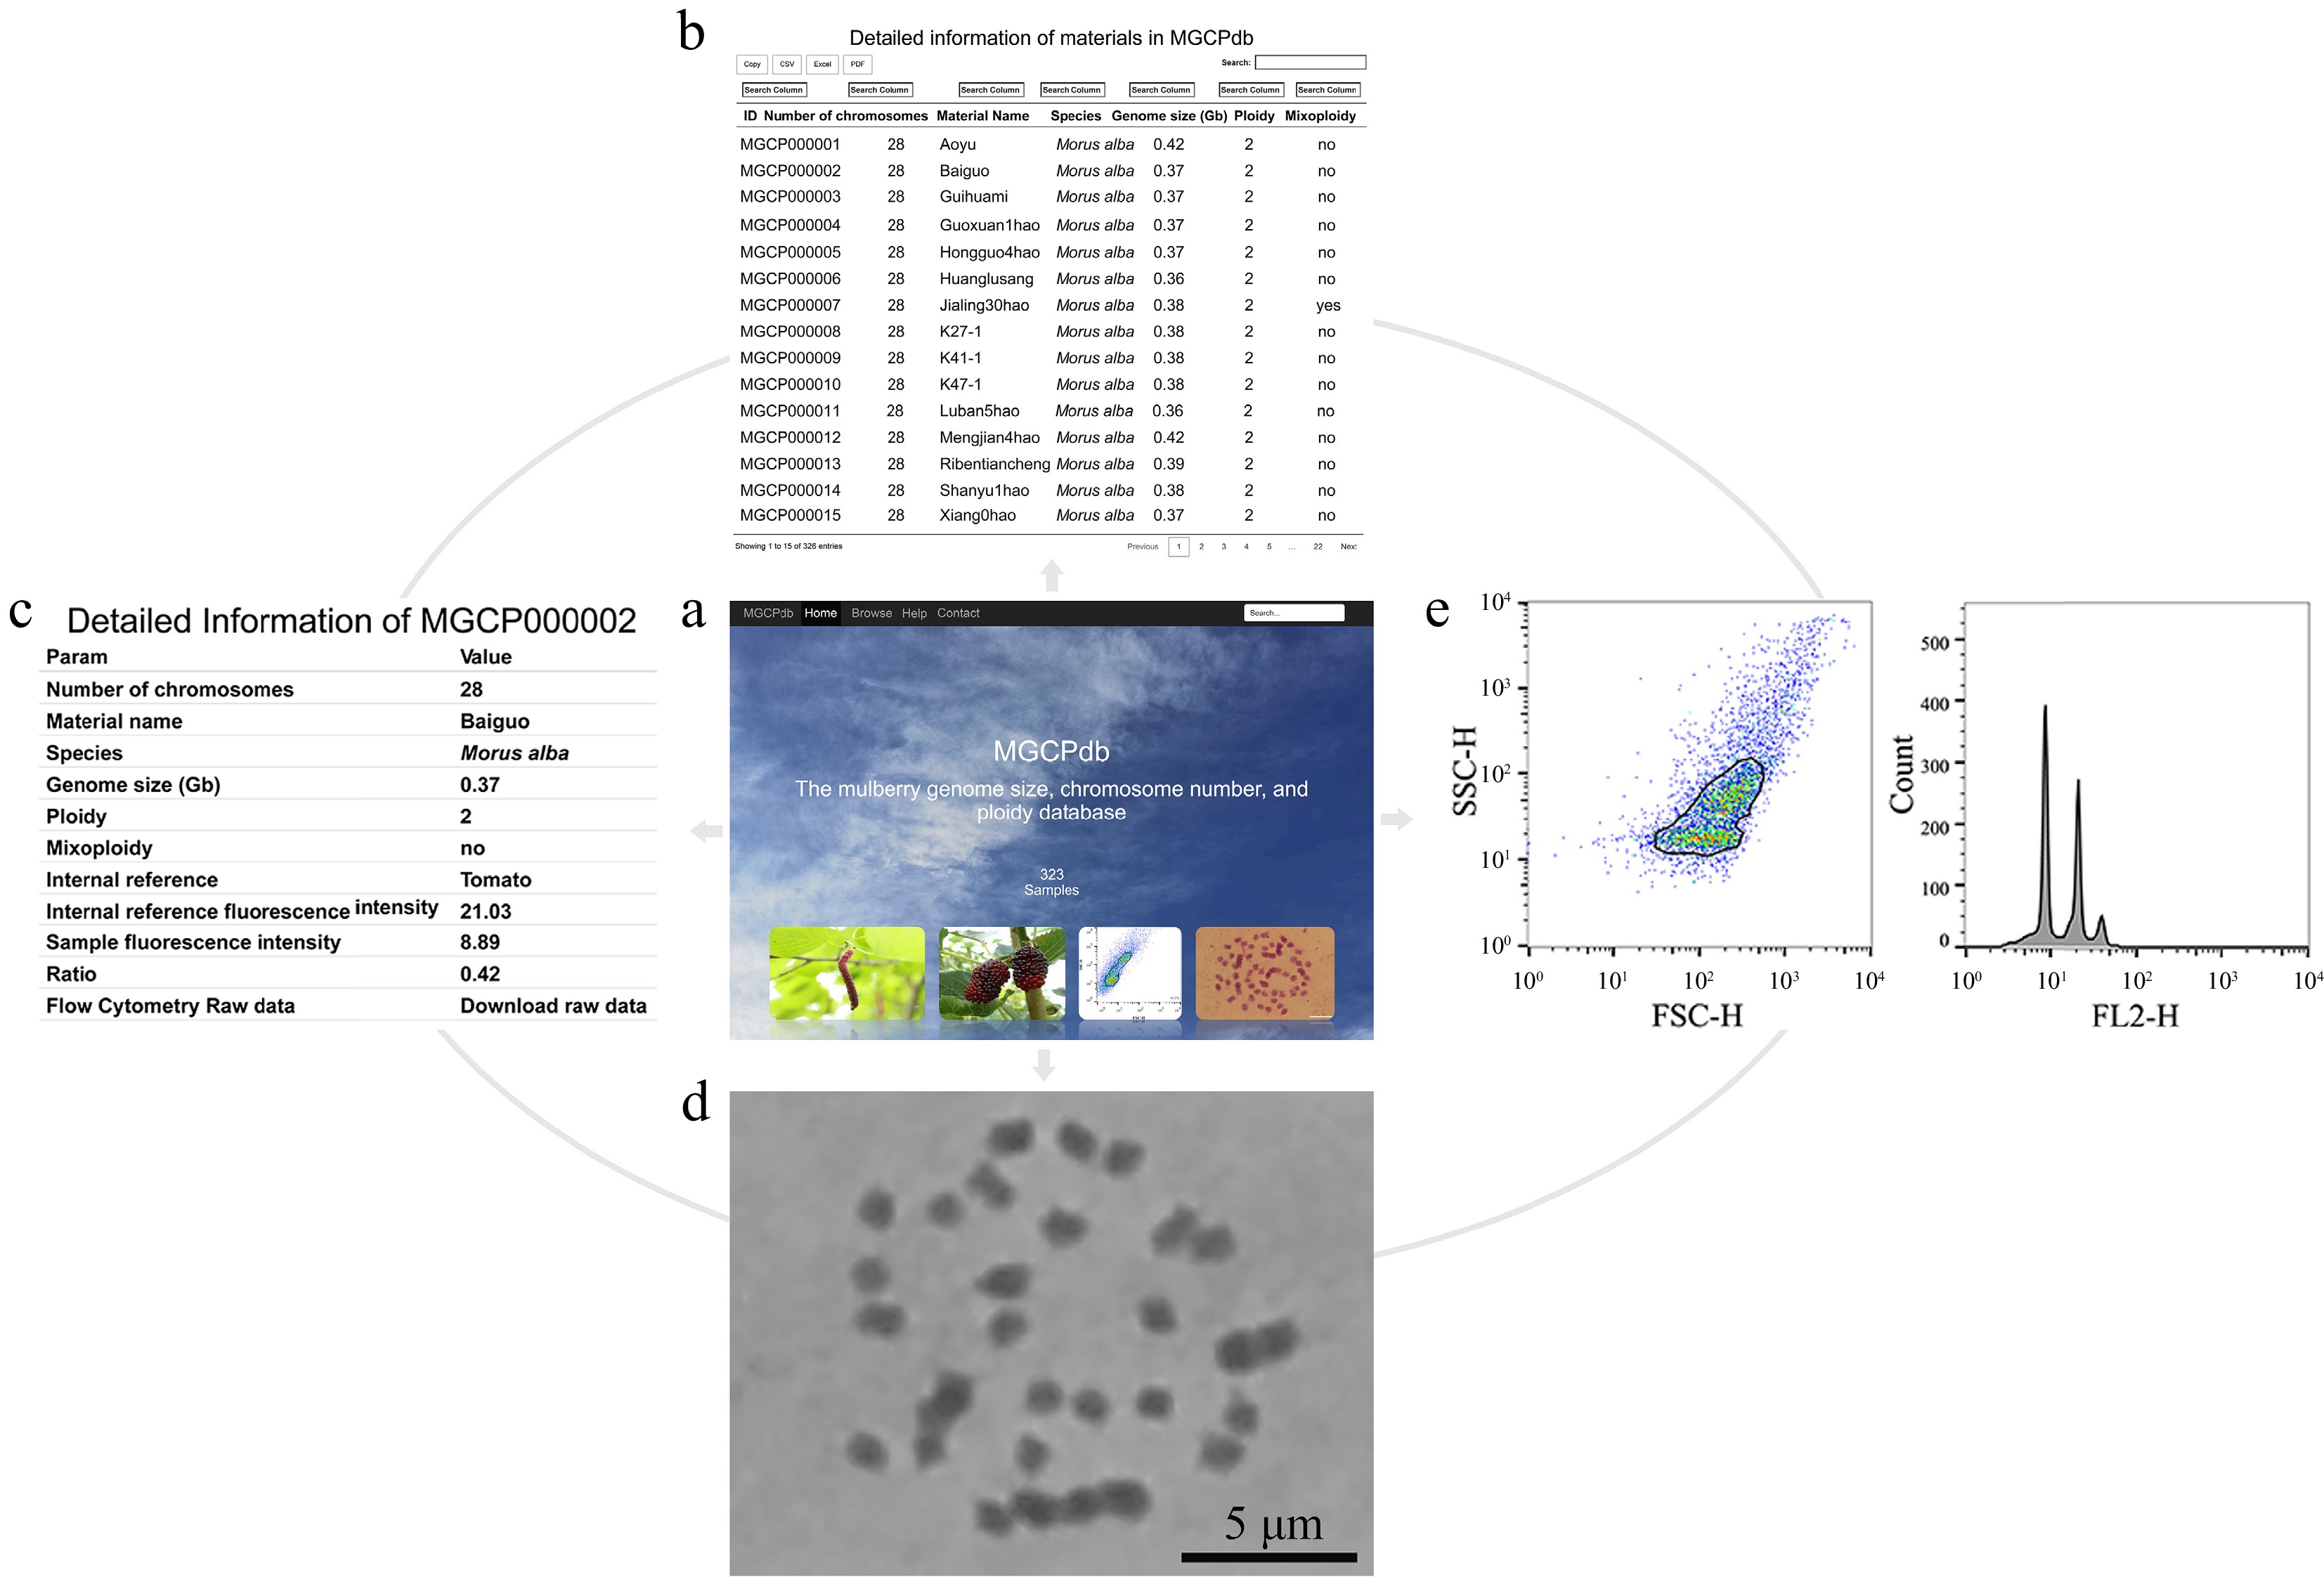
Figure 4.
The process of retrieving relevant information in MGCPdb. (a) The menu navigates the MGCPdb database at the top of the page, which contains four main sections: Home, Browse, Help, Contact, and a global search tool in the upper right. (b) The browsing interface for the MGCPdb database, clicking on the four functional areas in the upper left, allows you to directly copy or download the data in CSV, XLSX, and PDF formats, with a personalized search function on top of each column of data. (c) The MGCPdb database provides detailed data tables on genome size, chromosome number, ploidy, and other related information of every sample. (d) and (e) correspond to the sample analysis graph's chromosome count and FCM results.
-
Material name Genome size (1C, Gb) Chromosome number Ploidy level Mixed ploids K27-1 0.38 28 2n = 2x no K41-1 0.38 28 2n = 2x no K47-1 0.38 28 2n = 2x no Aoyu 0.42 28 2n = 2x no Baiguo 0.37 28 2n = 2x no Chuansang 0.44 14 2n = 2x no Guihuami 0.37 28 2n = 2x no Huanglusang 0.36 28 2n = 2x no Xiang0hao 0.37 28 2n = 2x no Yichuanhong 0.37 28 2n = 2x no Guoxuan1hao 0.37 28 2n = 2x no Hongguo4hao 0.37 28 2n = 2x no Luban5hao 0.36 28 2n = 2x no Mengjian4hao 0.42 28 2n = 2x no Ribentiancheng 0.39 28 2n = 2x no Shanyu1hao 0.38 28 2n = 2x no Yanjian4hao 0.37 28 2n = 2x no Yuansang1hao 0.38 28 2n = 2x no Yuansang2hao 0.37 28 2n = 2x no Yunsang1hao 0.36 28 2n = 2x no K34-1 0.59 42 2n = 3x no K36-5 0.62 42 2n = 3x no Shidian6hao 0.59 42 2n = 3x no Yueshendashi 0.56 42 2n = 3x no Taiwanchangguosang 0.58 42 2n = 3x no Huasang 0.71 56 2n = 4x no Ailaoshan5hao 0.75 56 2n = 4x no Ailaoshan9hao 0.83 56 2n = 4x no Huai30_2 1.10 84 2n = 6x no Baojing7hao 0.94 84 2n = 6x no Pisang2hao 1.44 126 2n = 9x no Yaosang 3.08 308 2n = 22x no Jialing30hao 0.38 28 2n = 2x yes Jialing30hao 0.68 56 2n = 4x yes Table 1.
FCM analysis and chromosome count of 33 representative mulberry materials.
Figures
(4)
Tables
(1)