-
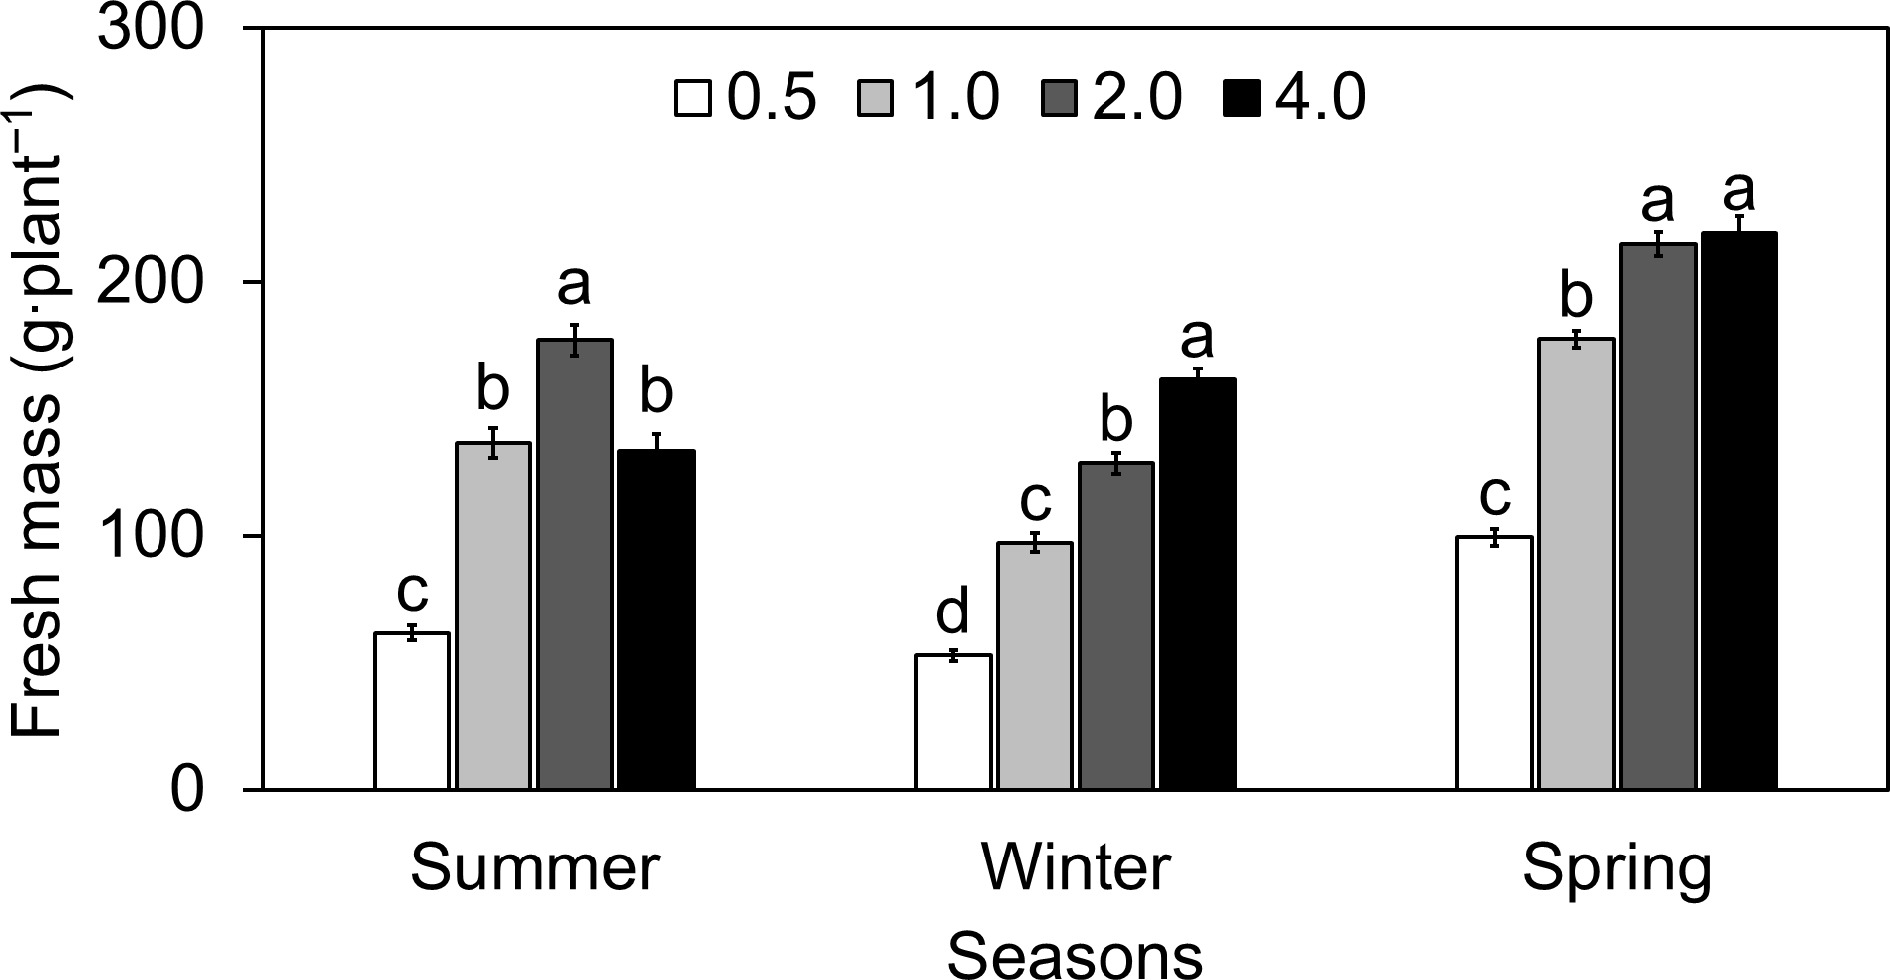
Figure 1.
Effect of different electrical conductivity (EC) treatments (0.5 mS·cm−1, 1.0 mS mS·cm−1, 2.0 mS·cm−1, and 4.0 mS·cm−1) on lettuce fresh mass (FM) at different growth seasons of 2022−2023 (Summer 2022, Winter 2022, and Spring 2023). Data represents ± SE (n = 12). Different letters indicate significant differences at p < 0.05.
-
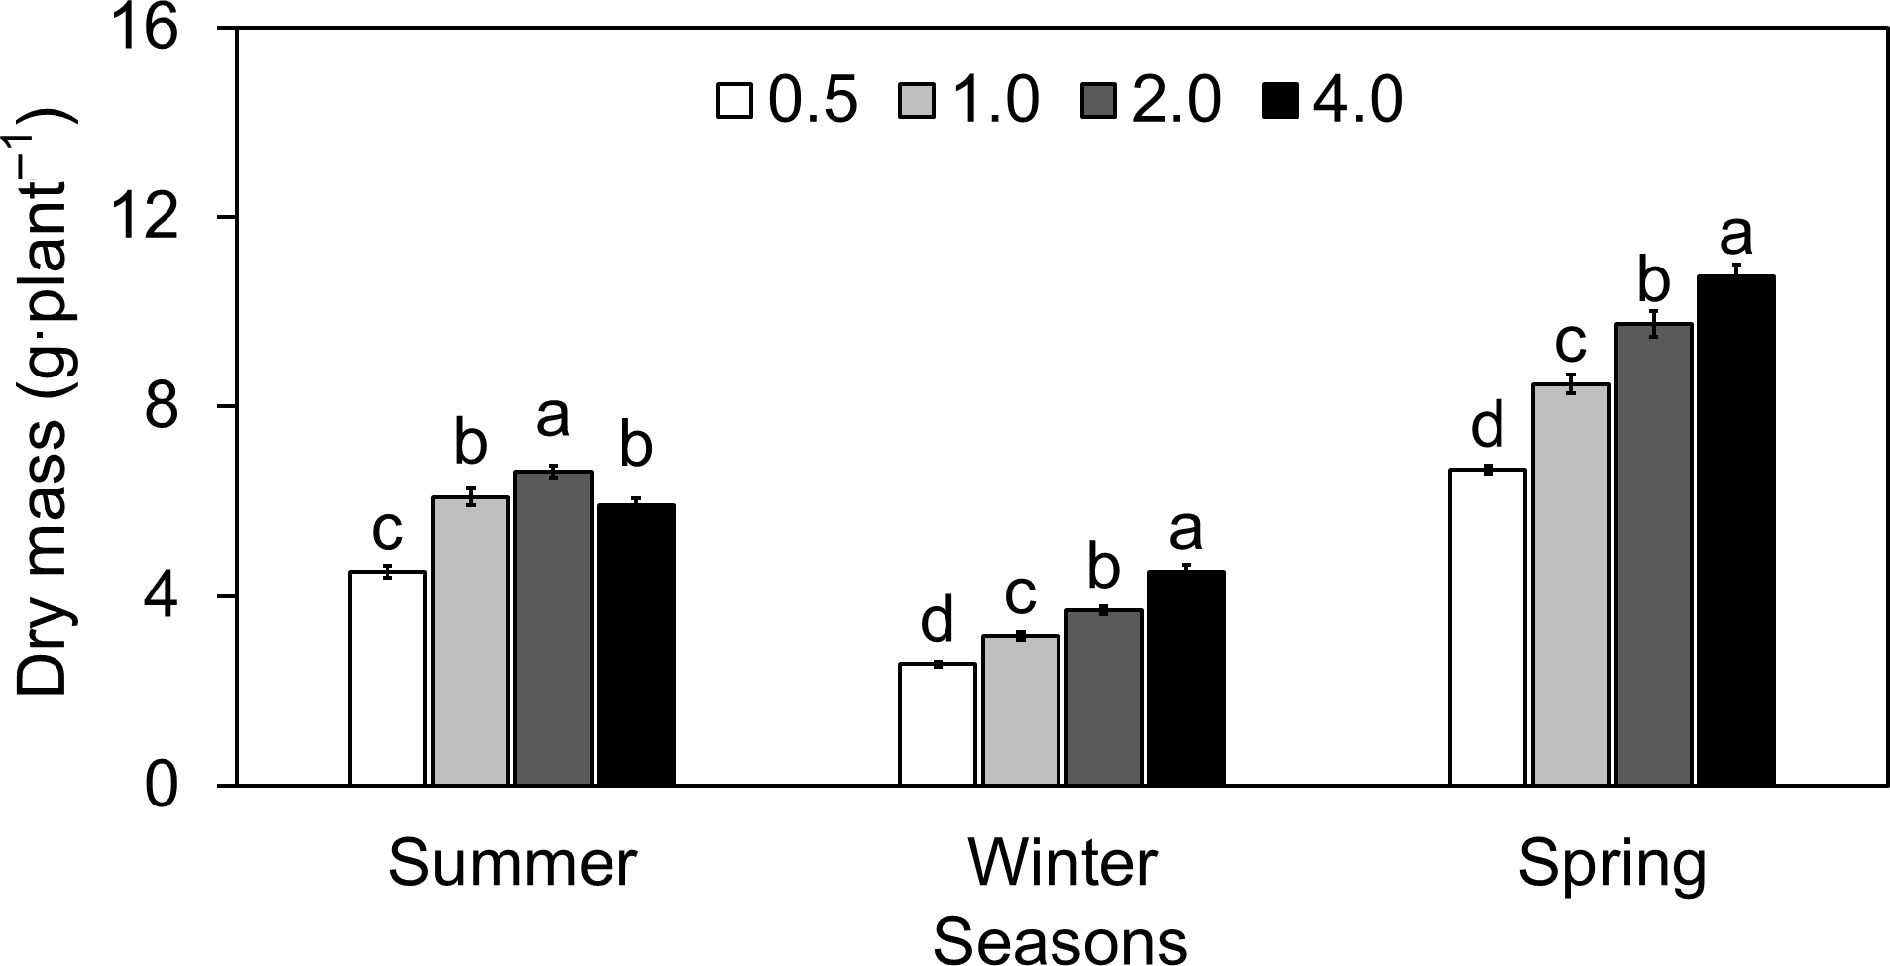
Figure 2.
Effect of different electrical conductivity (EC) treatments (0.5 mS·cm−1, 1.0 mS·cm−1, 2.0 mS·cm−1, and 4.0 mS·cm−1) on lettuce dry mass (DM) at different growth seasons of 2022−2023 (Summer 2022, Winter 2022, and Spring 2023). Data represents ± SE (n = 12). Different letters indicate significant differences at p < 0.05.
-
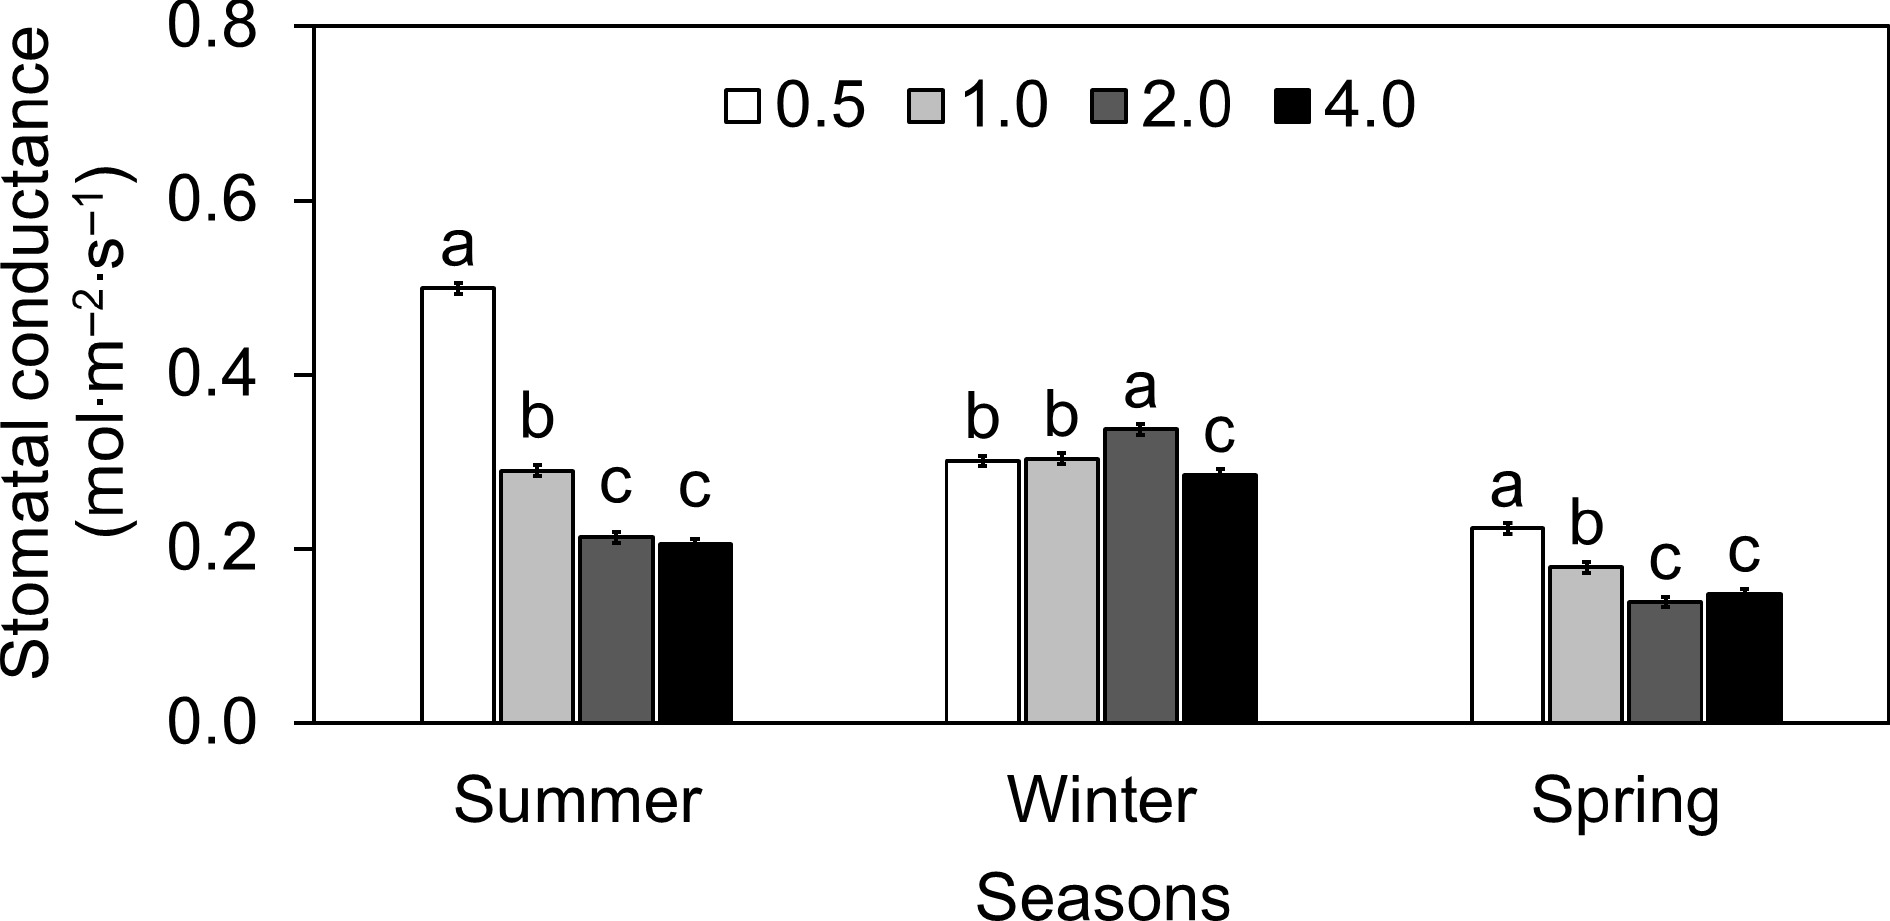
Figure 3.
Effect of different electrical conductivity (EC) treatments (0.5 mS·cm−1, 1.0 mS·cm−1, 2.0 mS·cm−1, and 4.0 mS·cm−1) on lettuce stomatal conductance (gs) at different growth seasons of 2022−2023 (Summer 2022, Winter 2022, and Spring 2023). Data represents ± SE (n = 12). Different letters indicate significant differences at p < 0.05.
-
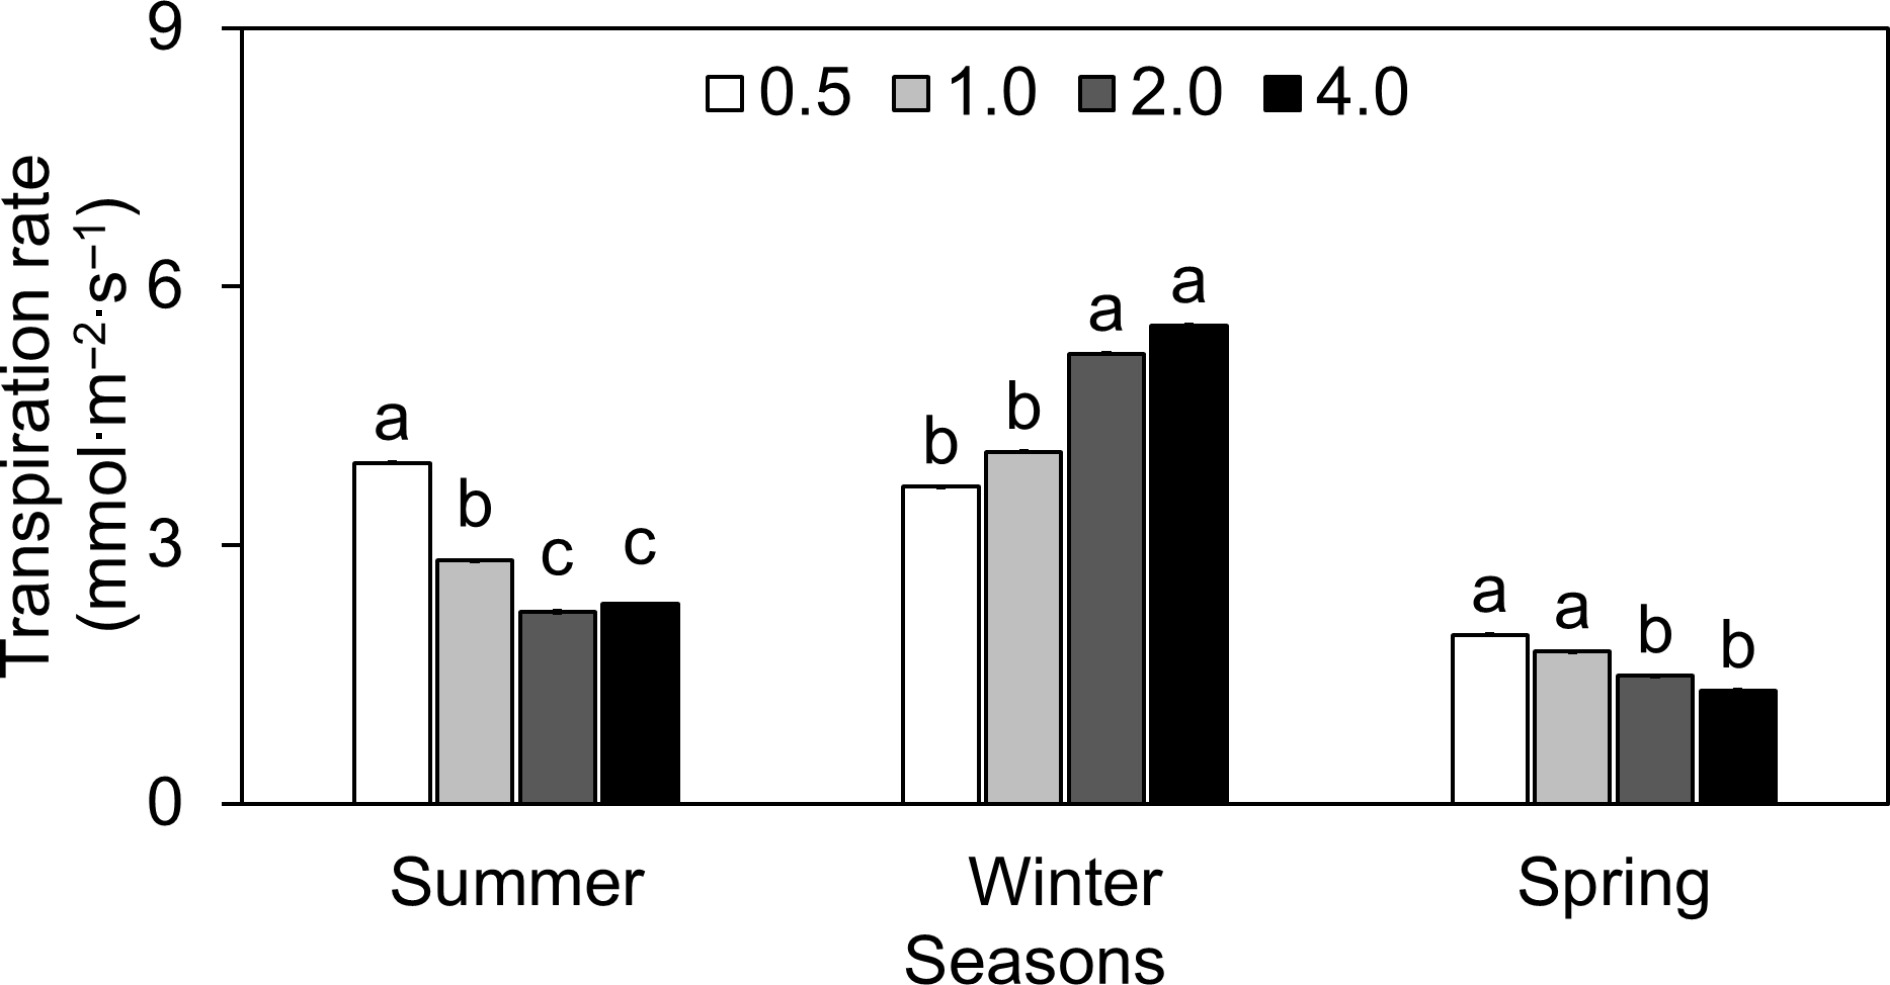
Figure 4.
Effect of different electrical conductivity (EC) treatments (0.5 mS·cm−1, 1.0 mS·cm−1, 2.0 mS·cm−1, and 4.0 mS·cm−1) on lettuce transpiration rate (E) at different growth seasons of 2022−2023 (Summer 2022, Winter 2022, and Spring 2023). Data represents ± SE (n = 12). Different letters indicate significant differences at p < 0.05.
-
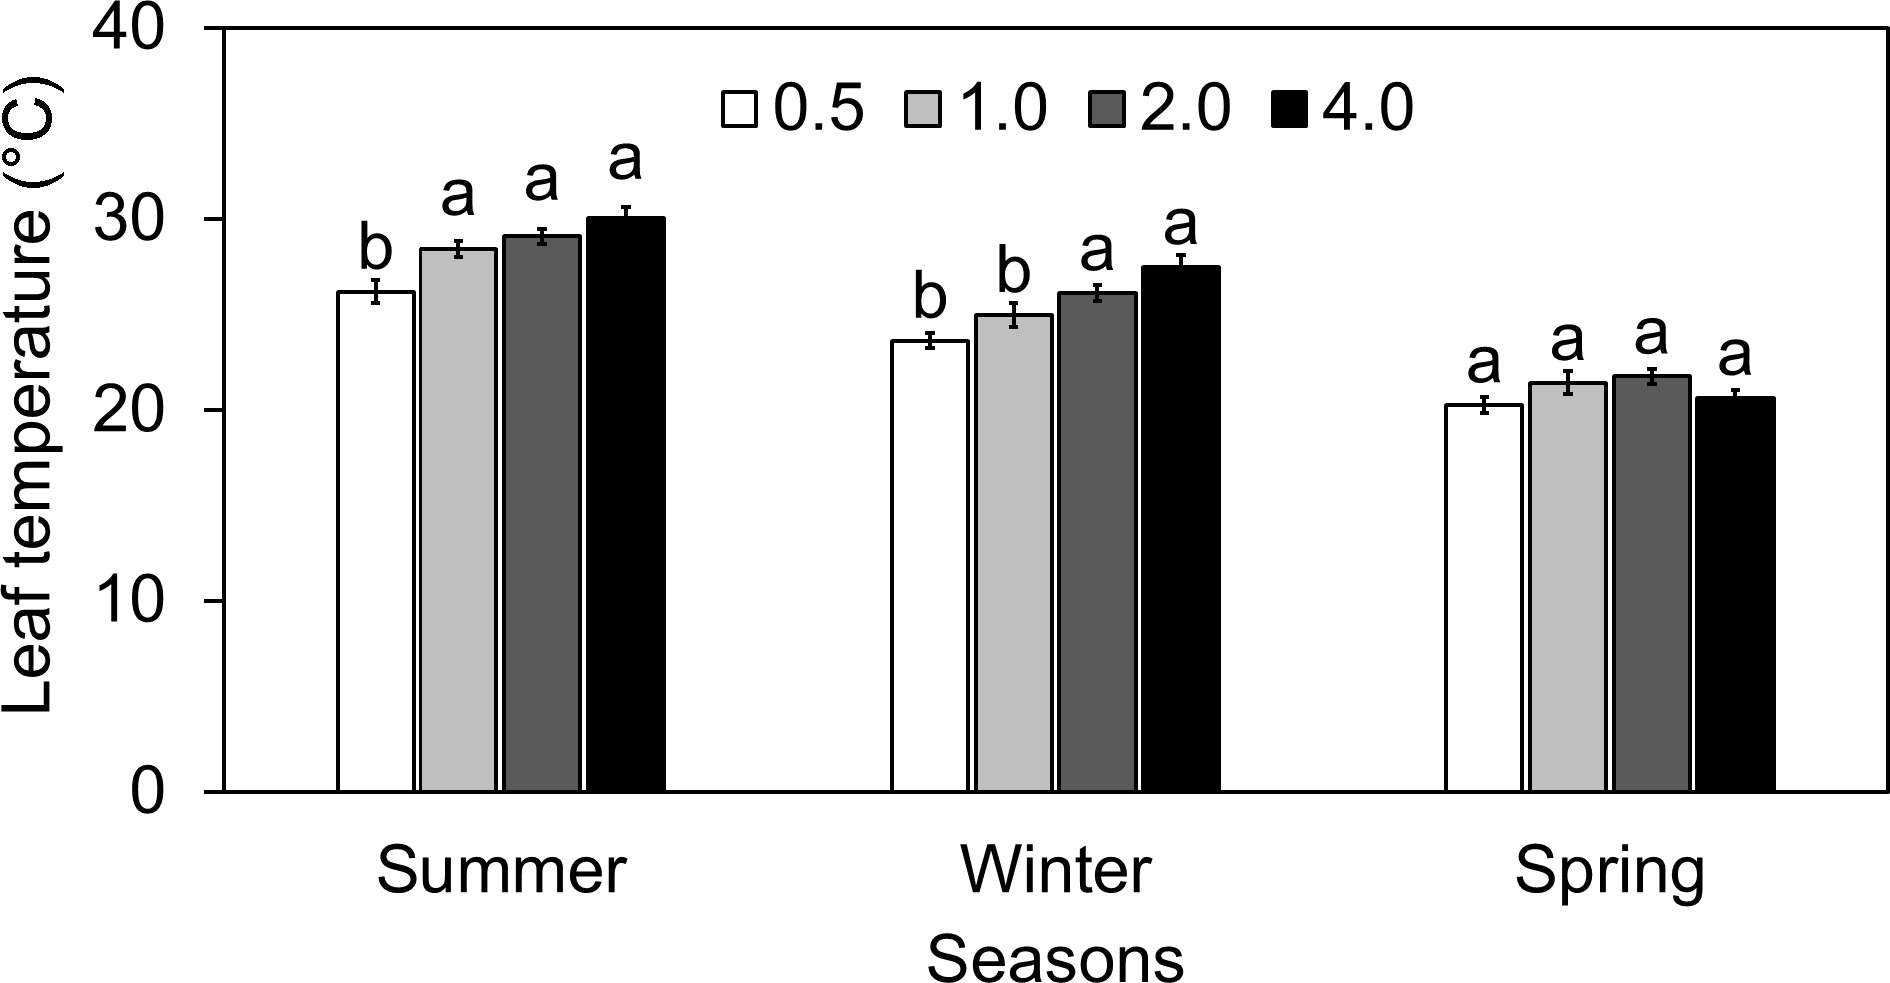
Figure 5.
Effect of different electrical conductivity (EC) treatments (0.5 mS·cm−1, 1.0 mS·cm−1, 2.0 mS·cm−1, and 4.0 mS·cm−1) on lettuce leaf temperature (Tleaf) at different growth seasons of 2022−2023 (Summer 2022, Winter 2022, and Spring 2023). Data represents ± SE (n = 12). Different letters indicate significant differences at p < 0.05.
-
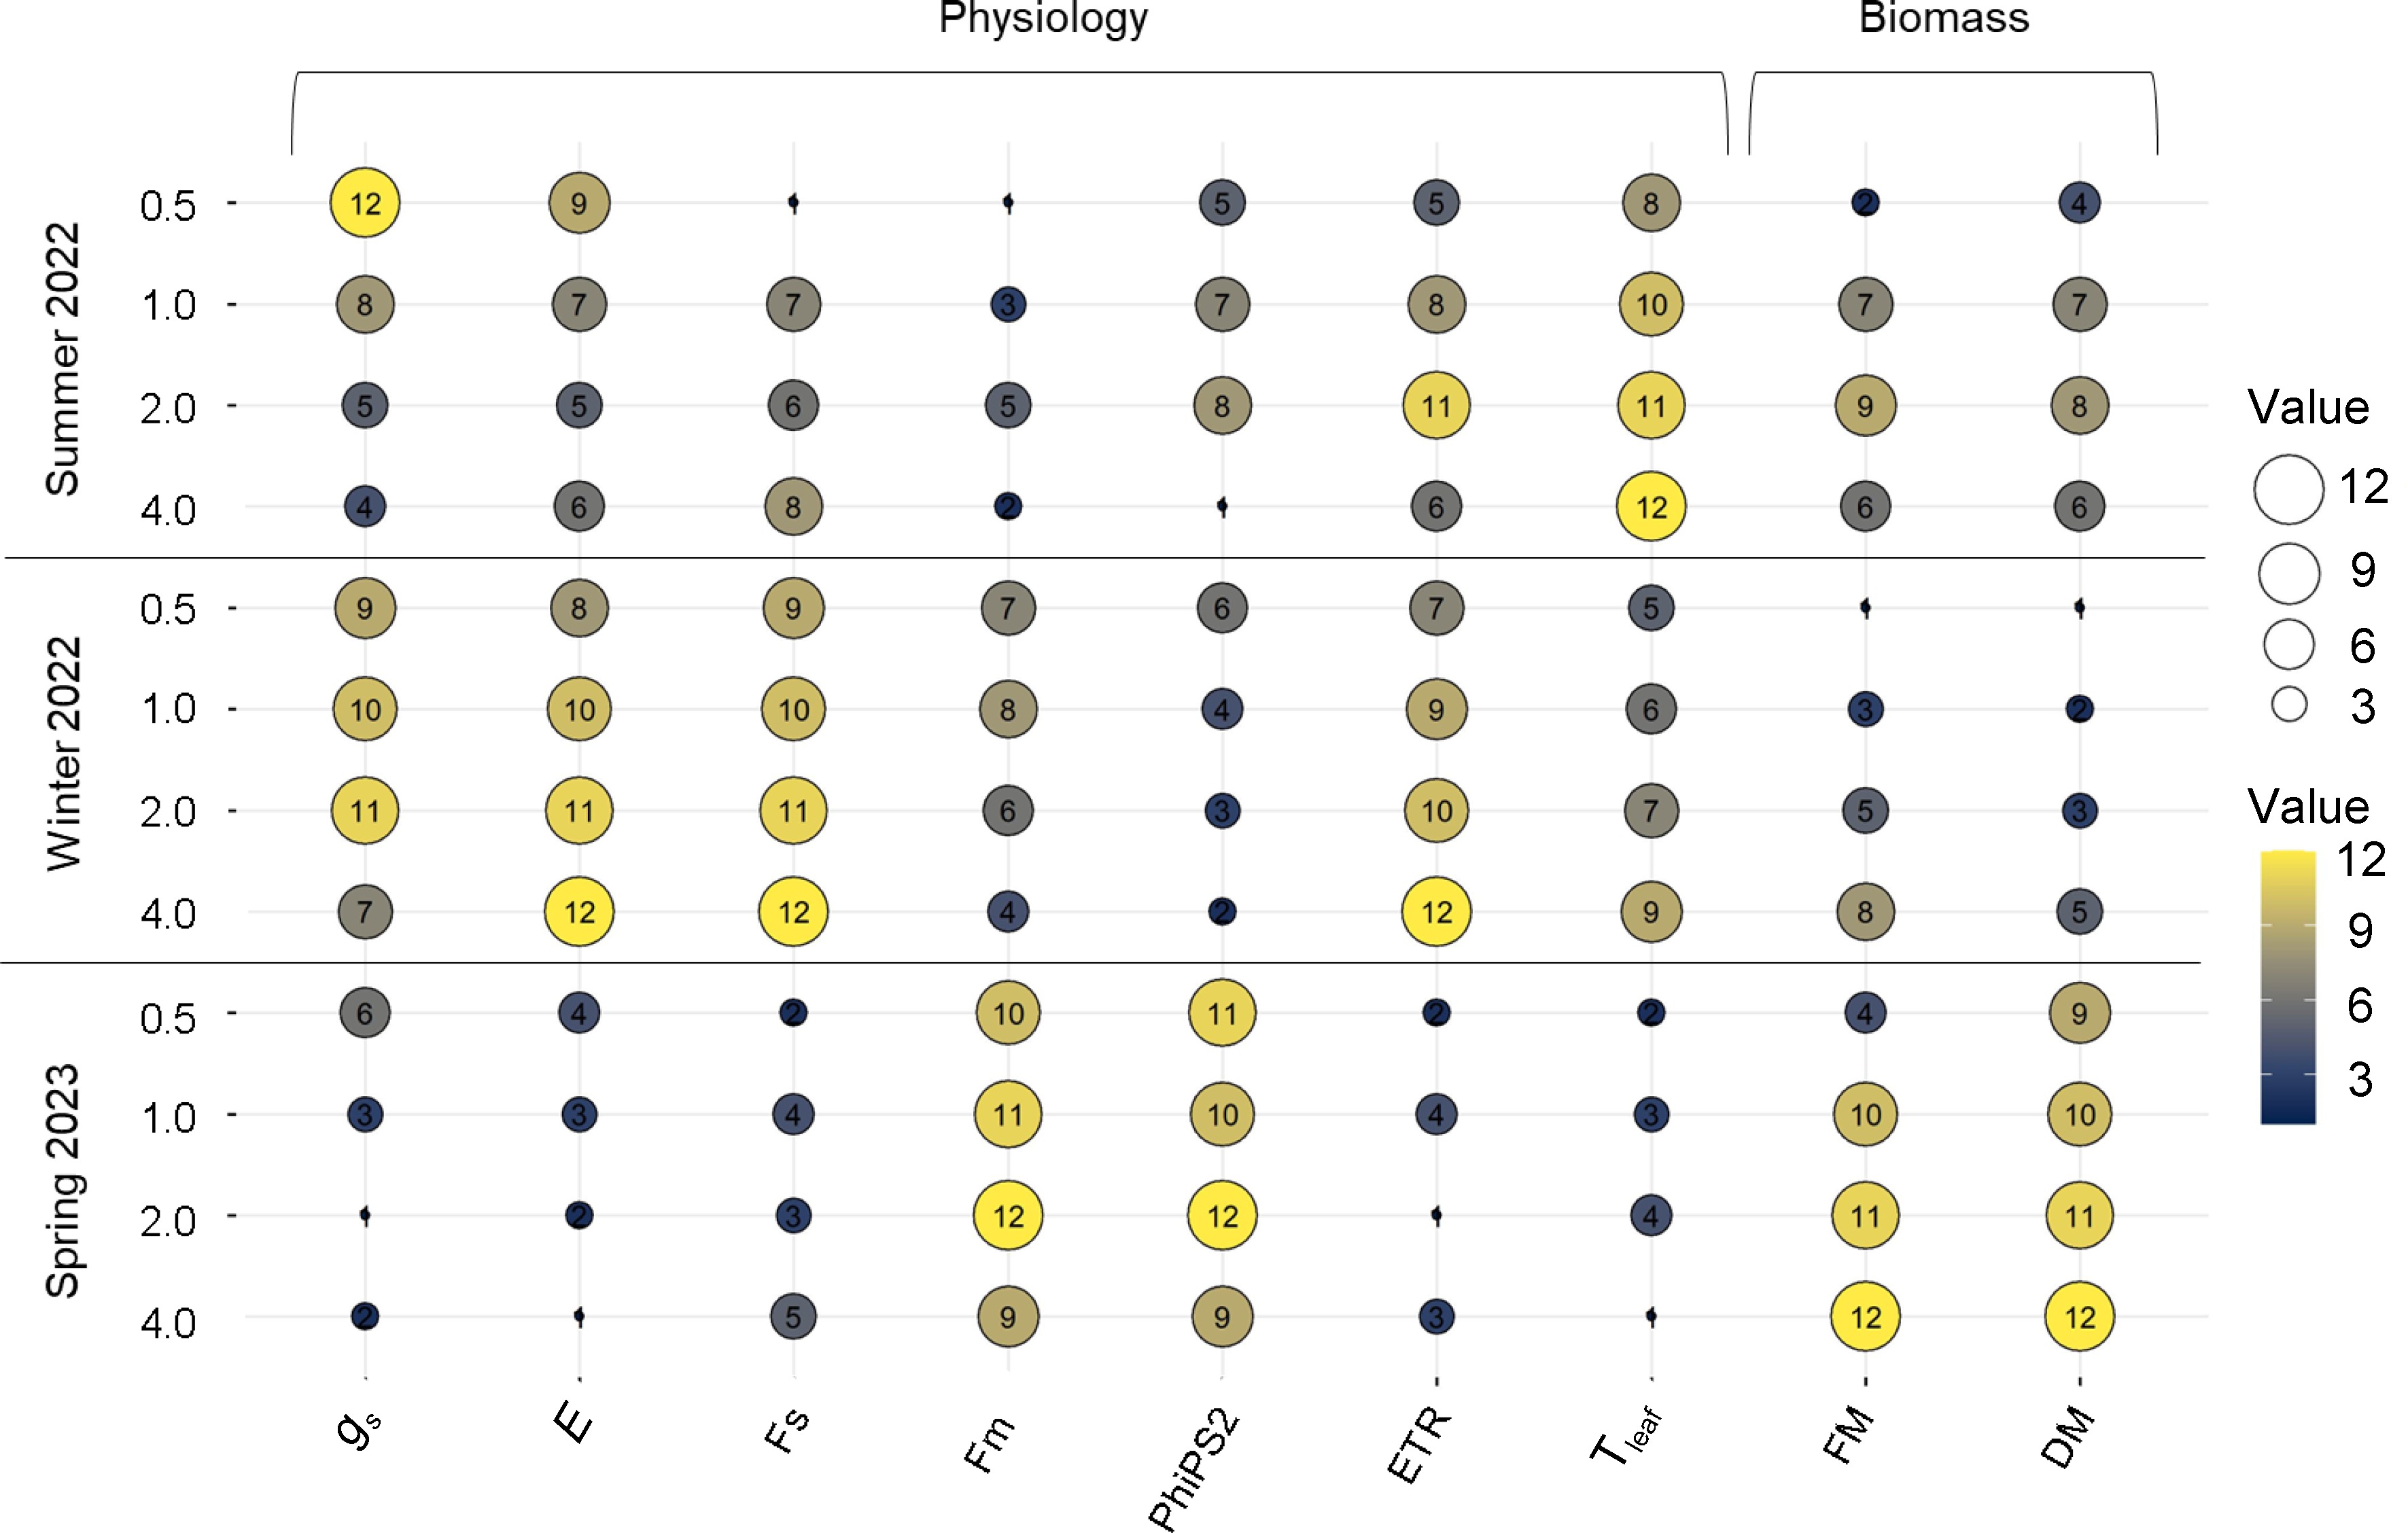
Figure 6.
Bubble plot showing the ranking based on the average values for physiology (gs, E, Fs. Fm', PhiPS2, ETR, and Tleaf) and biomass (fresh and dry mass) of lettuce subjected to different electrical conductivity (EC) treatments (0.5 mS·cm−1, 1.0 mS·cm−1, 2.0 mS·cm−1, and 4.0 mS·cm−1) at different growth seasons of 2022−2023 (Summer 2022, Winter 2022, and Spring 2023). The traits with a largest bubble size (yellow color) indicates the higher values of that traits and smallest bubble size 1 (dark blue color) indicates the lowest values of that traits for a particular EC at a specific growing season.
-
Concentration 5-11-26 (g) 15.5-0-0 (g) EC (dS·m−1 or mS·cm−1) Nitrogen (ppm) Calcium (ppm) 200% 184.27 121.9 3.8−4.4 300 232 100% 92.13 60.95 1.9−2.2 150 116 50% 46.06 30.47 0.9−1.1 75 58 25% 23.03 15.23 0.45−0.6 37.5 29 Table 1.
Electrical conductivity of different nutrient treatment concentrations and their nitrogen and calcium content.
-
Season (S) Treatment (T) T*S 0.5 1.0 2.0 4.0 Fs Summer ** *** 82.27 ± 6.43e 132.48 ± 13.18b 130.6 ± 11.65b 133.35 ± 13.88b Winter * 148.6 ± 7.01b 160.85 ± 8.6a 161.43 ± 9.12a 174.39 ± 17.43a Spring ** 101.55 ± 3.14d 112.17 ± 1.48c 102.96 ± 4.36d 114.37 ± 2.18c Fm' Summer * ** 249.13 ± 35.03d 353.17 ± 19.64c 367.57 ± 11.27c 295.42 ± 27.26d Winter * 375.98 ± 13.59bc 403.11 ± 39.16a 370.49 ± 17.93c 362.78 ± 23.01bc Spring ** 405.95 ± 8.56ab 426.41 ± 8.54a 431.55 ± 7.55a 405.23 ± 8.01ab PhiPS2 Summer * * 0.58 ± 0.05b 0.6 ± 0.04b 0.63 ± 0.03b 0.51 ± 0.04d Winter * 0.6 ± 0.01b 0.57 ± 0.03bc 0.55 ± 0.02c 0.52 ± 0.02d Spring NS 0.74 ± 0.01a 0.73 ± 0.01a 0.76 ± 0.01a 0.71 ± 0.01a ETR Summer * ** 89.92 ± 15.53a 130.49 ± 19.13b 143.75 ± 24.21b 125.33 ± 24.51bc Winter ** 126.81 ± 6.14c 139.02 ± 8.99b 140.45 ± 6.71b 169.95 ± 10.22a Spring ** 48.14 ± 1.66e 59.03 ± 2.32d 22.55 ± 2.41f 53.72 ± 5.86d The values represent Mean ± SE (n = 12). NS, *, **, *** indicate non-significant or significant at p < 0.05, 0.01, 0.001, respectively. Different superscript letters indicate significant treatment effects of different EC treatments throughout the different seasons using Tukey HSD at p < 0.05. Fs = Steady state fluorescence; Fm'= light-adapted maximal fluorescence; PhiPS2 = quantum yield of photosystem II calculated using fluorescence; and ETR (μmol·s−1) = electron transport rate. Table 2.
The chlorophyll fluorescence response of lettuce under different electrical conductivity (EC) treatments (0.5 mS·cm−1, 1.0 mS·cm−1, 2.0 mS·cm−1, and 4.0 mS·cm−1) at different growth seasons of 2022−2023 (Summer 2022, Winter 2022, and Spring 2023).
Figures
(6)
Tables
(2)