-
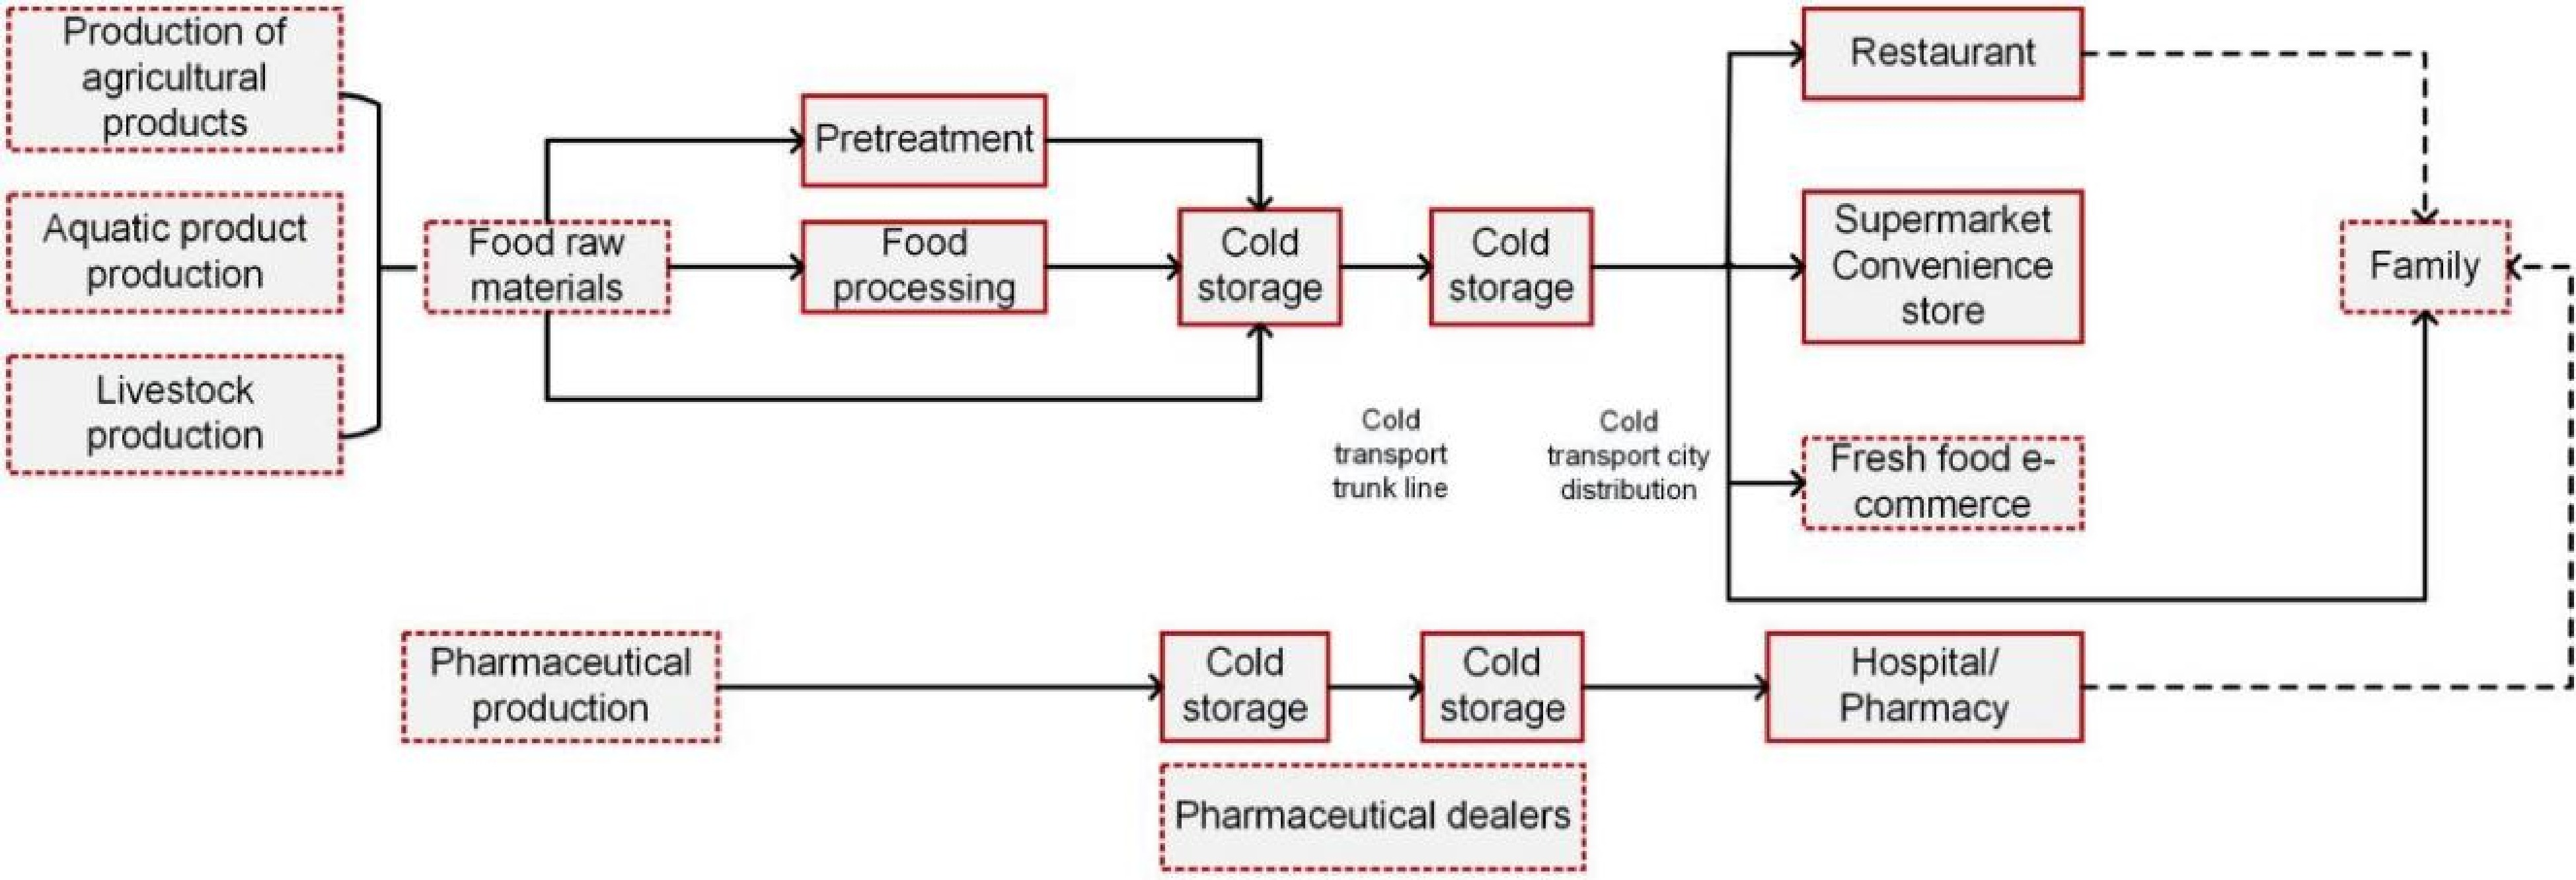
Figure 1.
Cold chain logistics production and transportation route map.
-
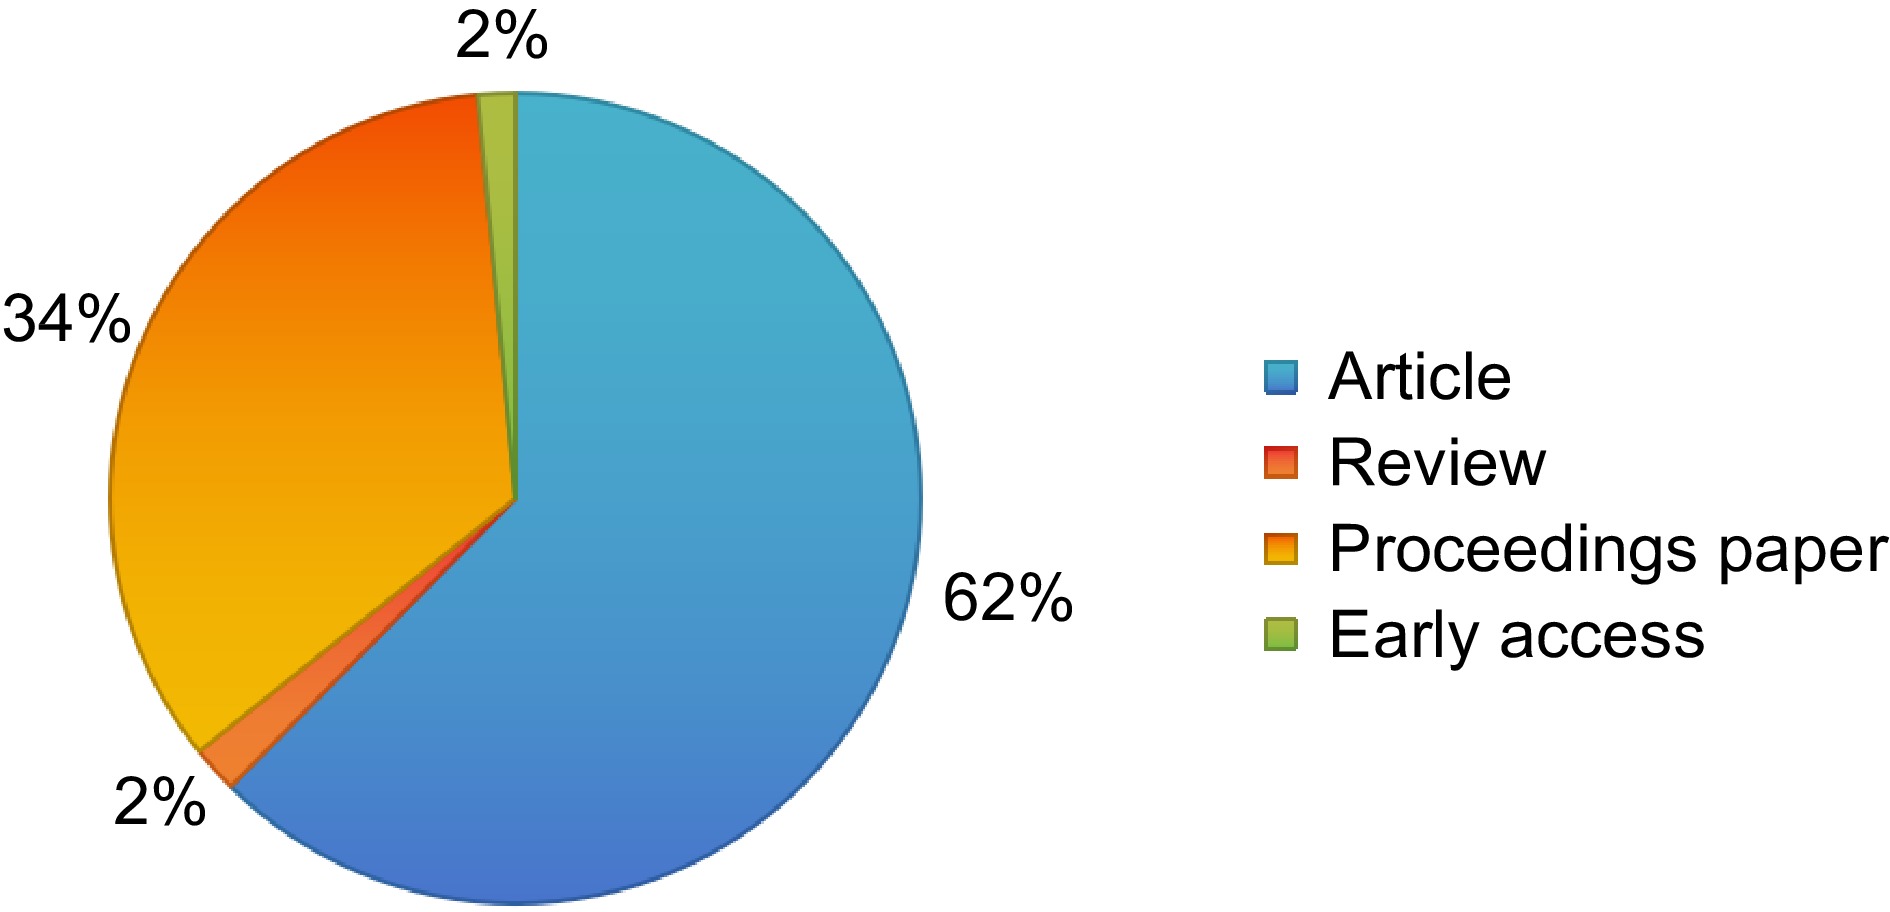
Figure 2.
Literature types in CCVRP research.
-
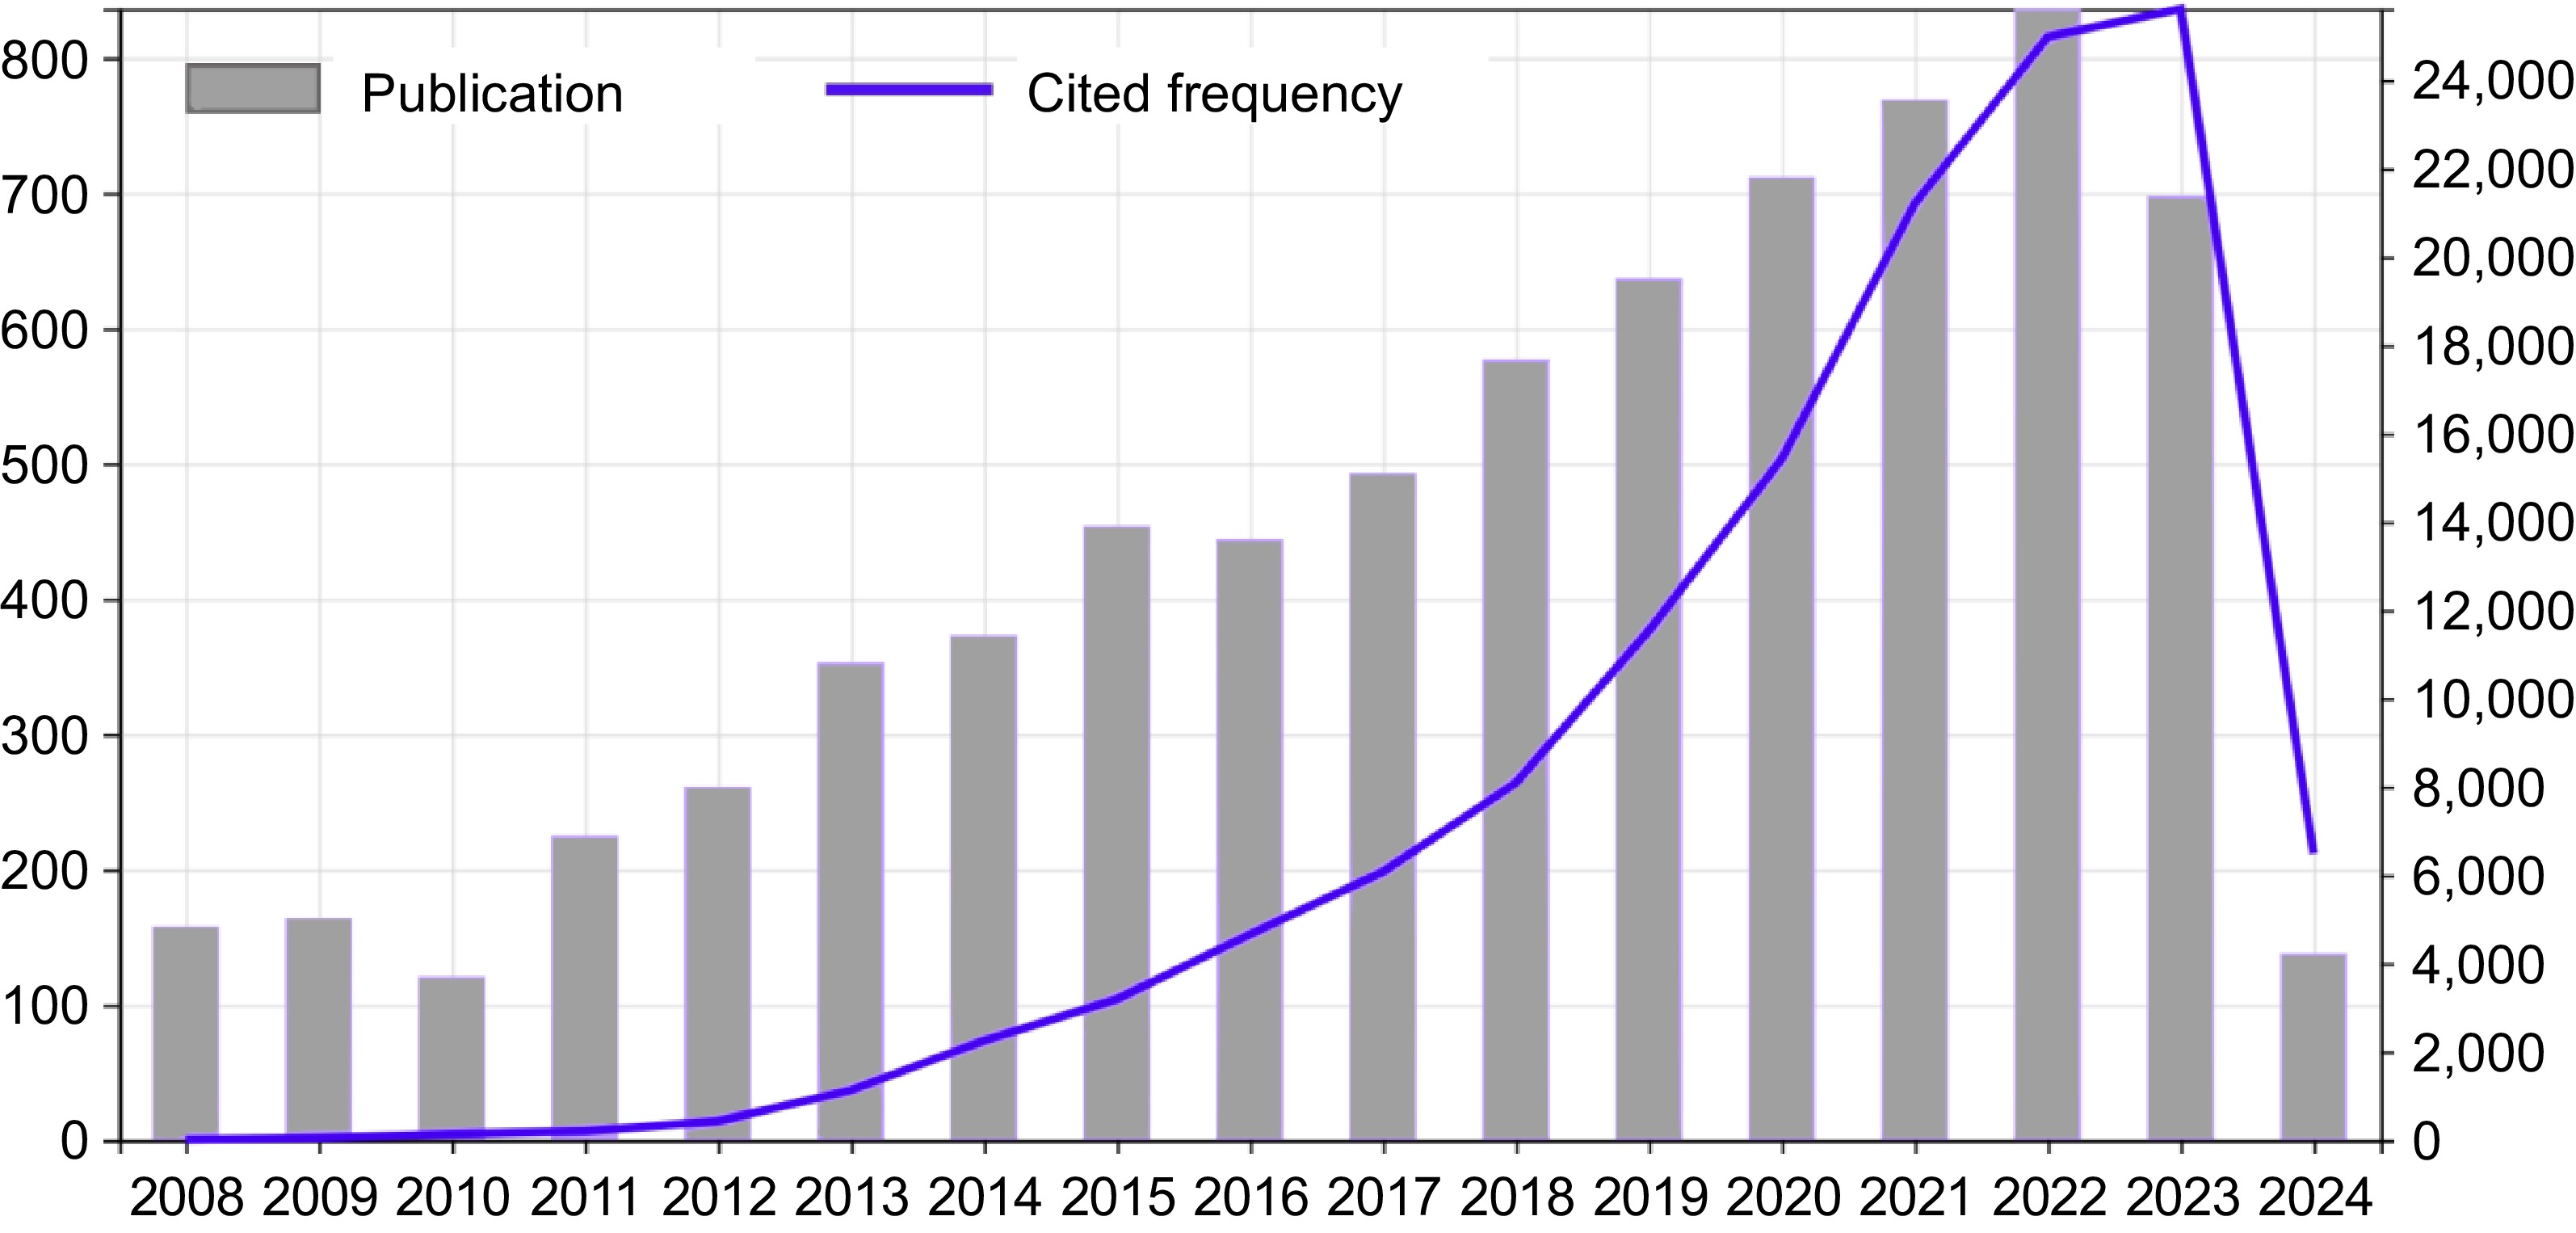
Figure 3.
Distribution of publications and citation records from 2008 to 2024.
-
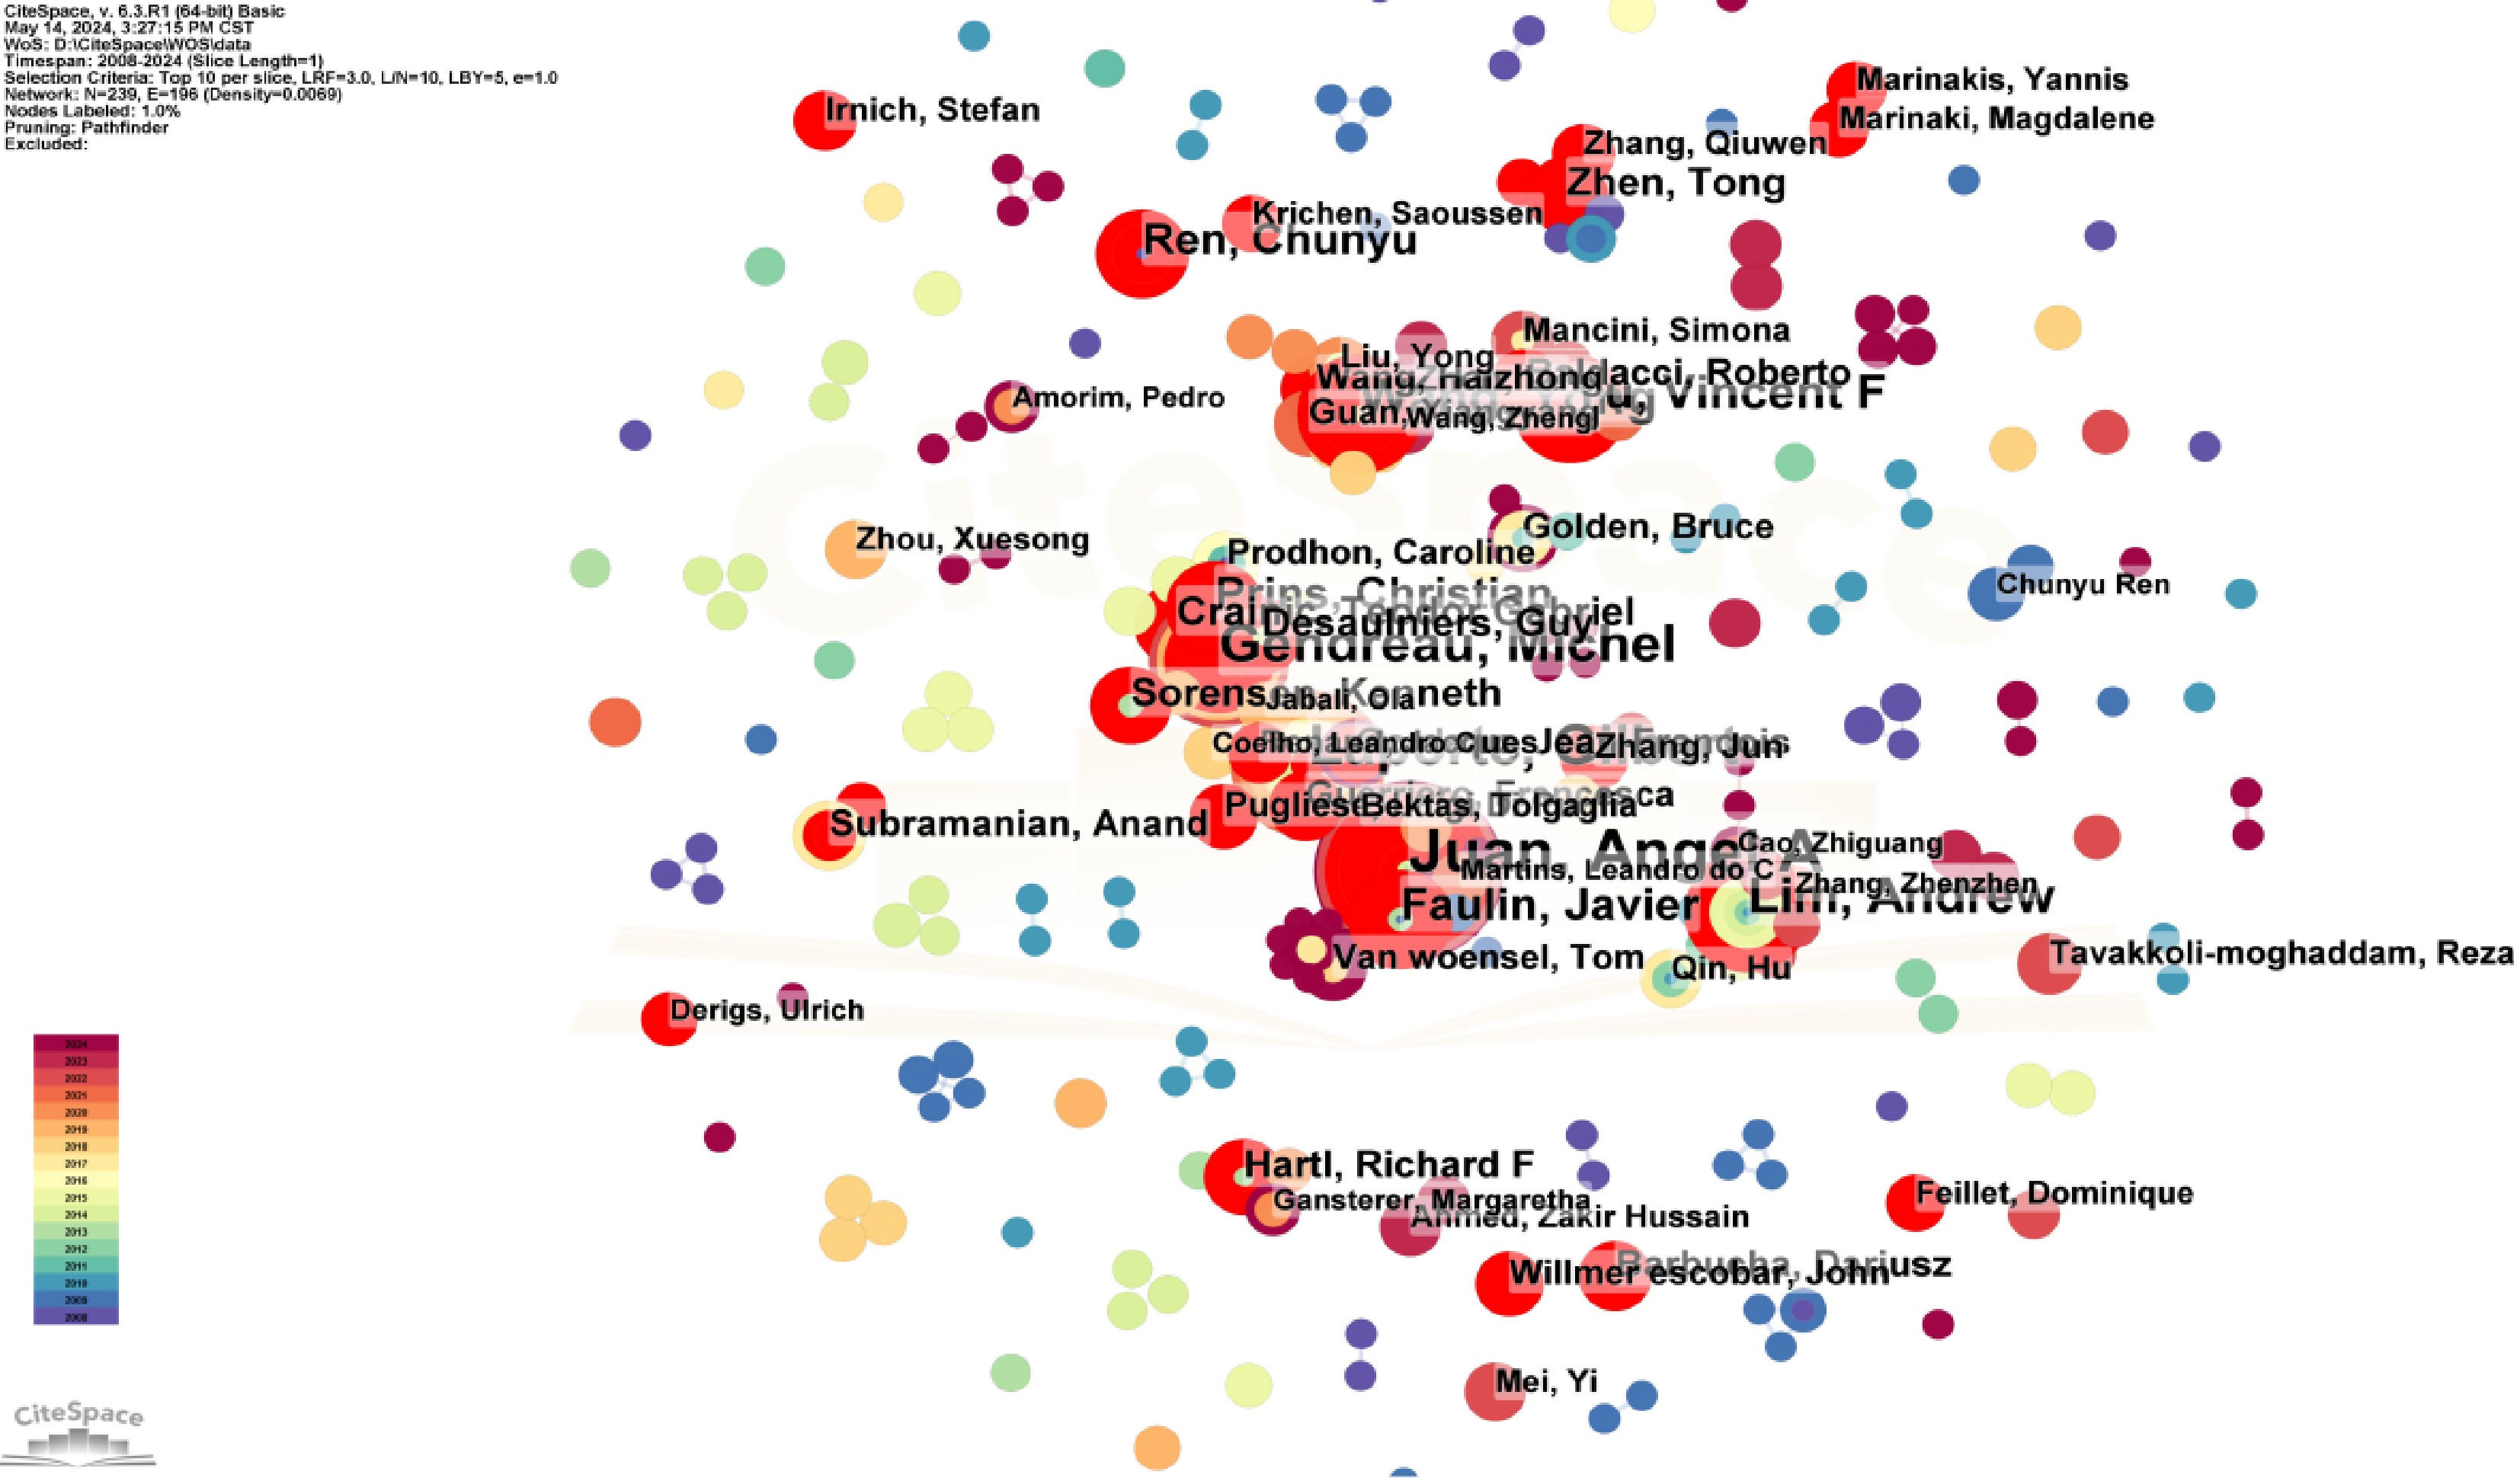
Figure 4.
Collaboration network diagram of CCVRP research authors.
-
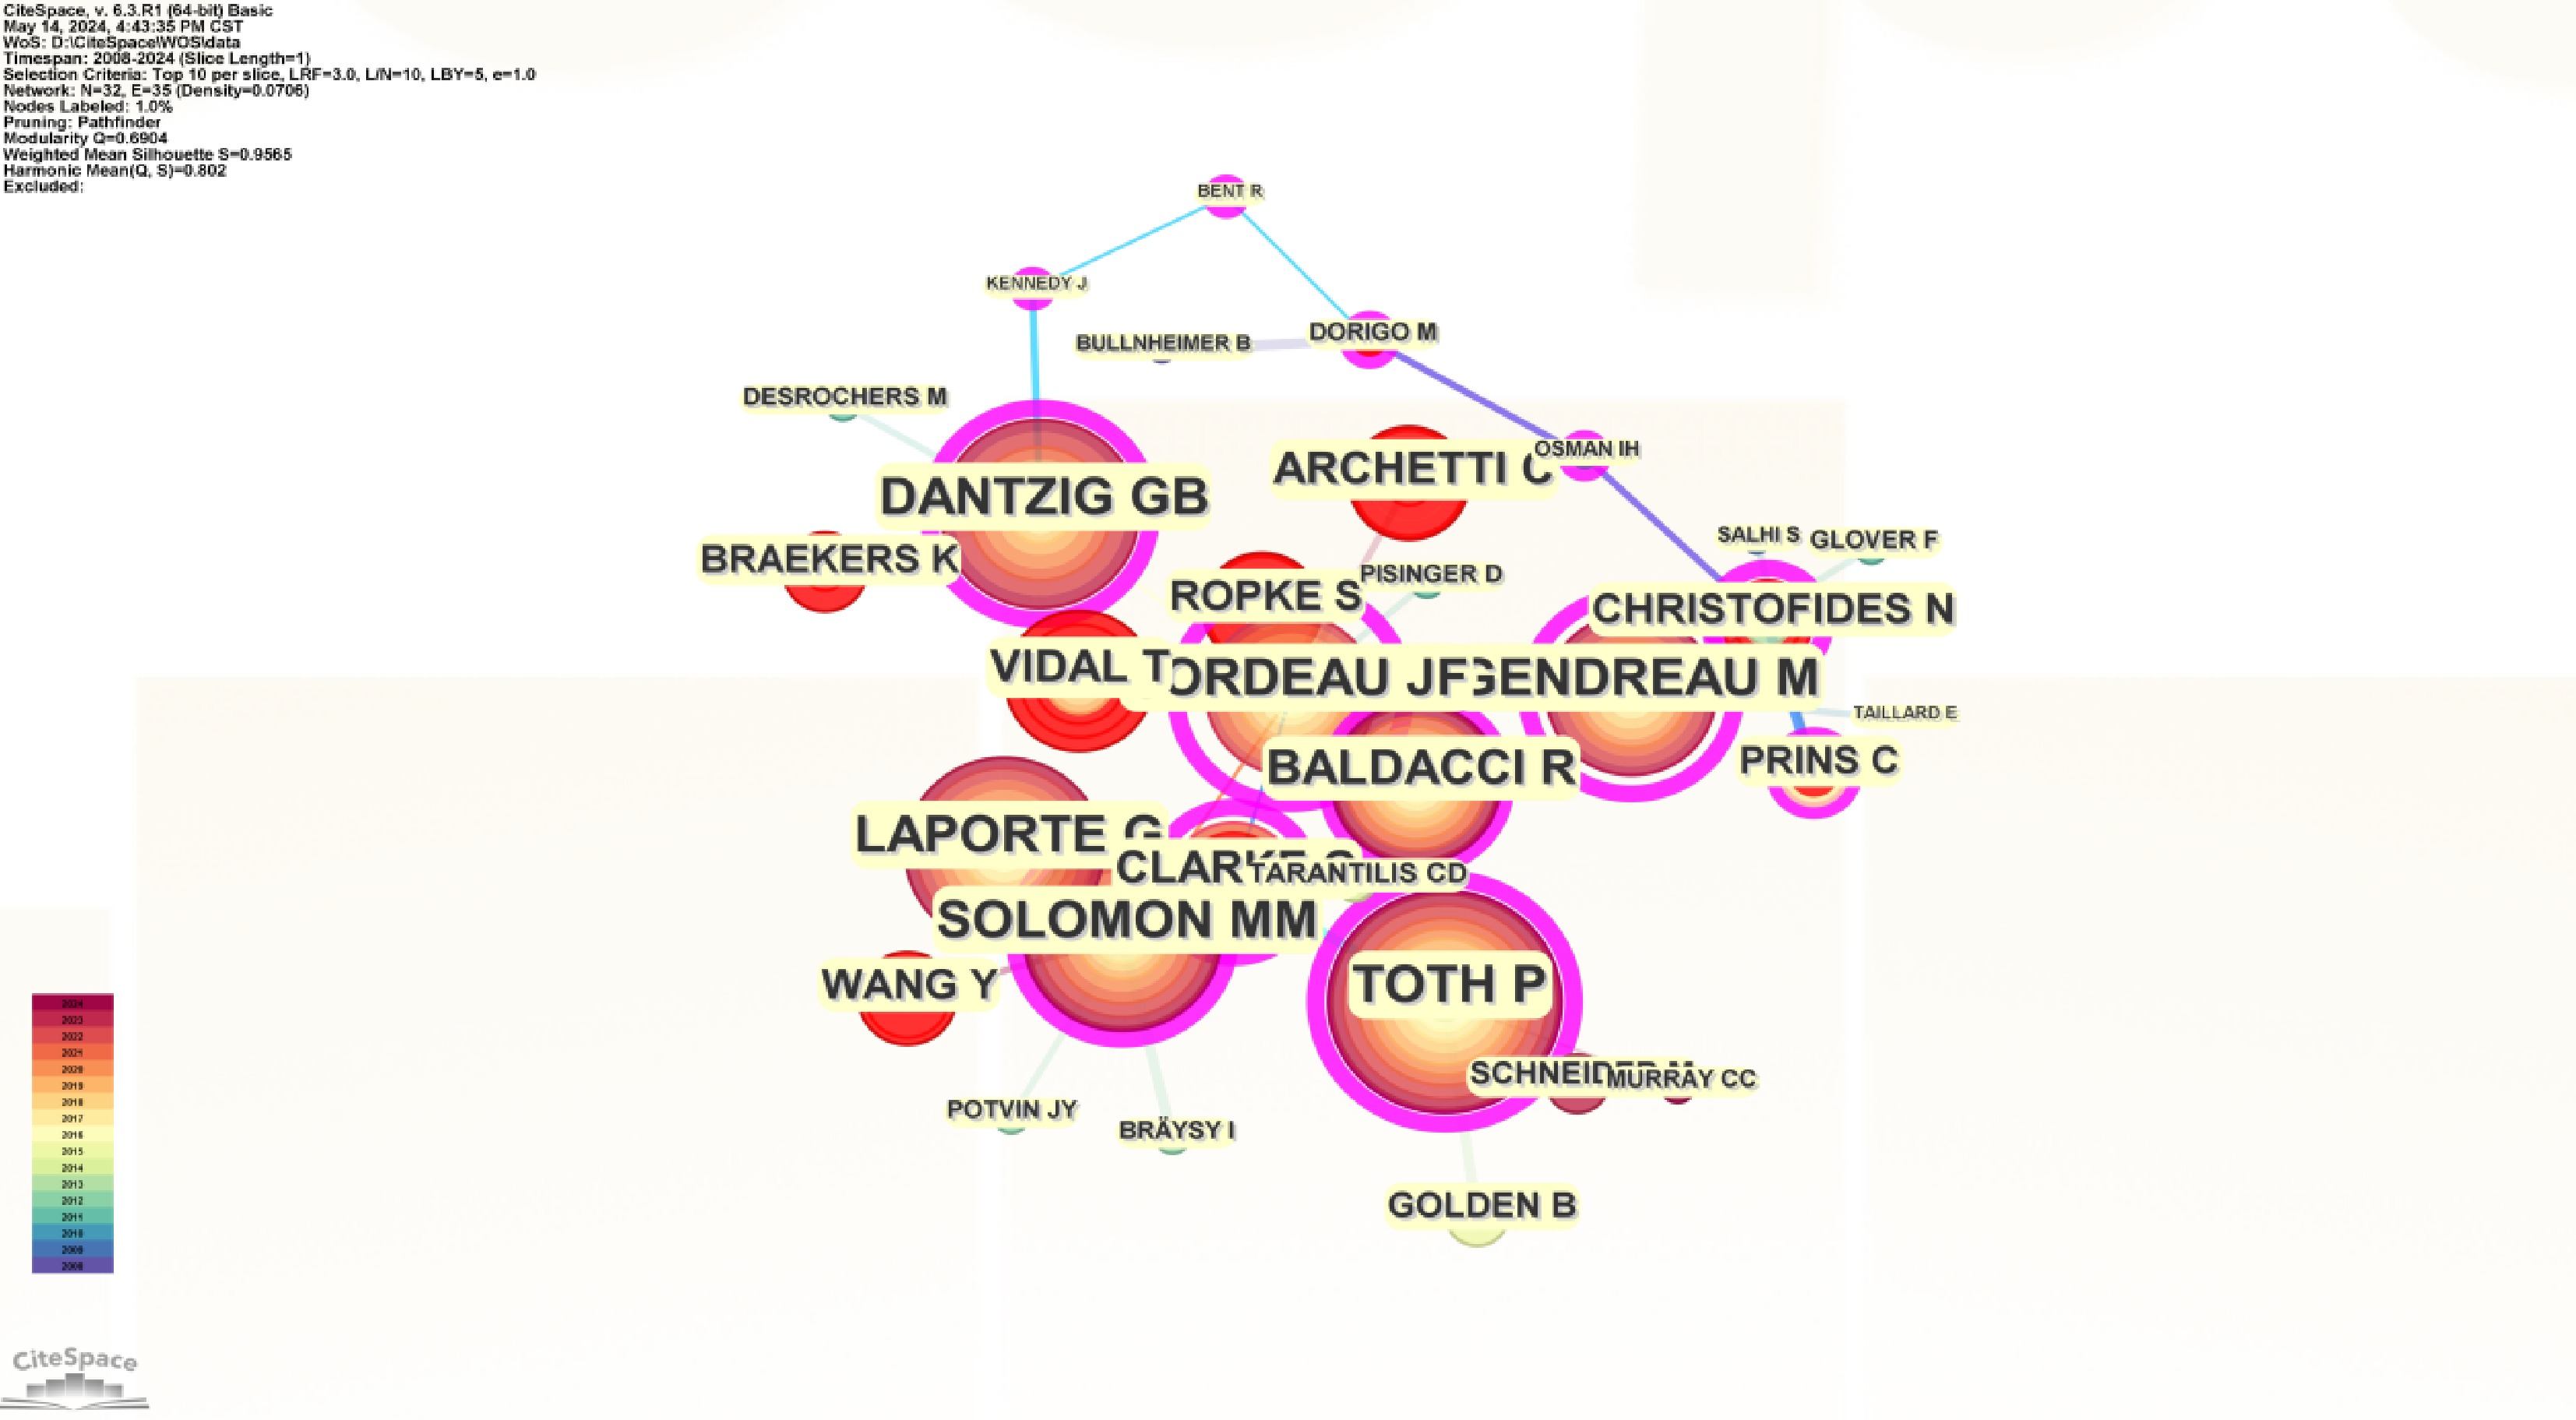
Figure 5.
Co-citation network of CCVRP research authors.
-
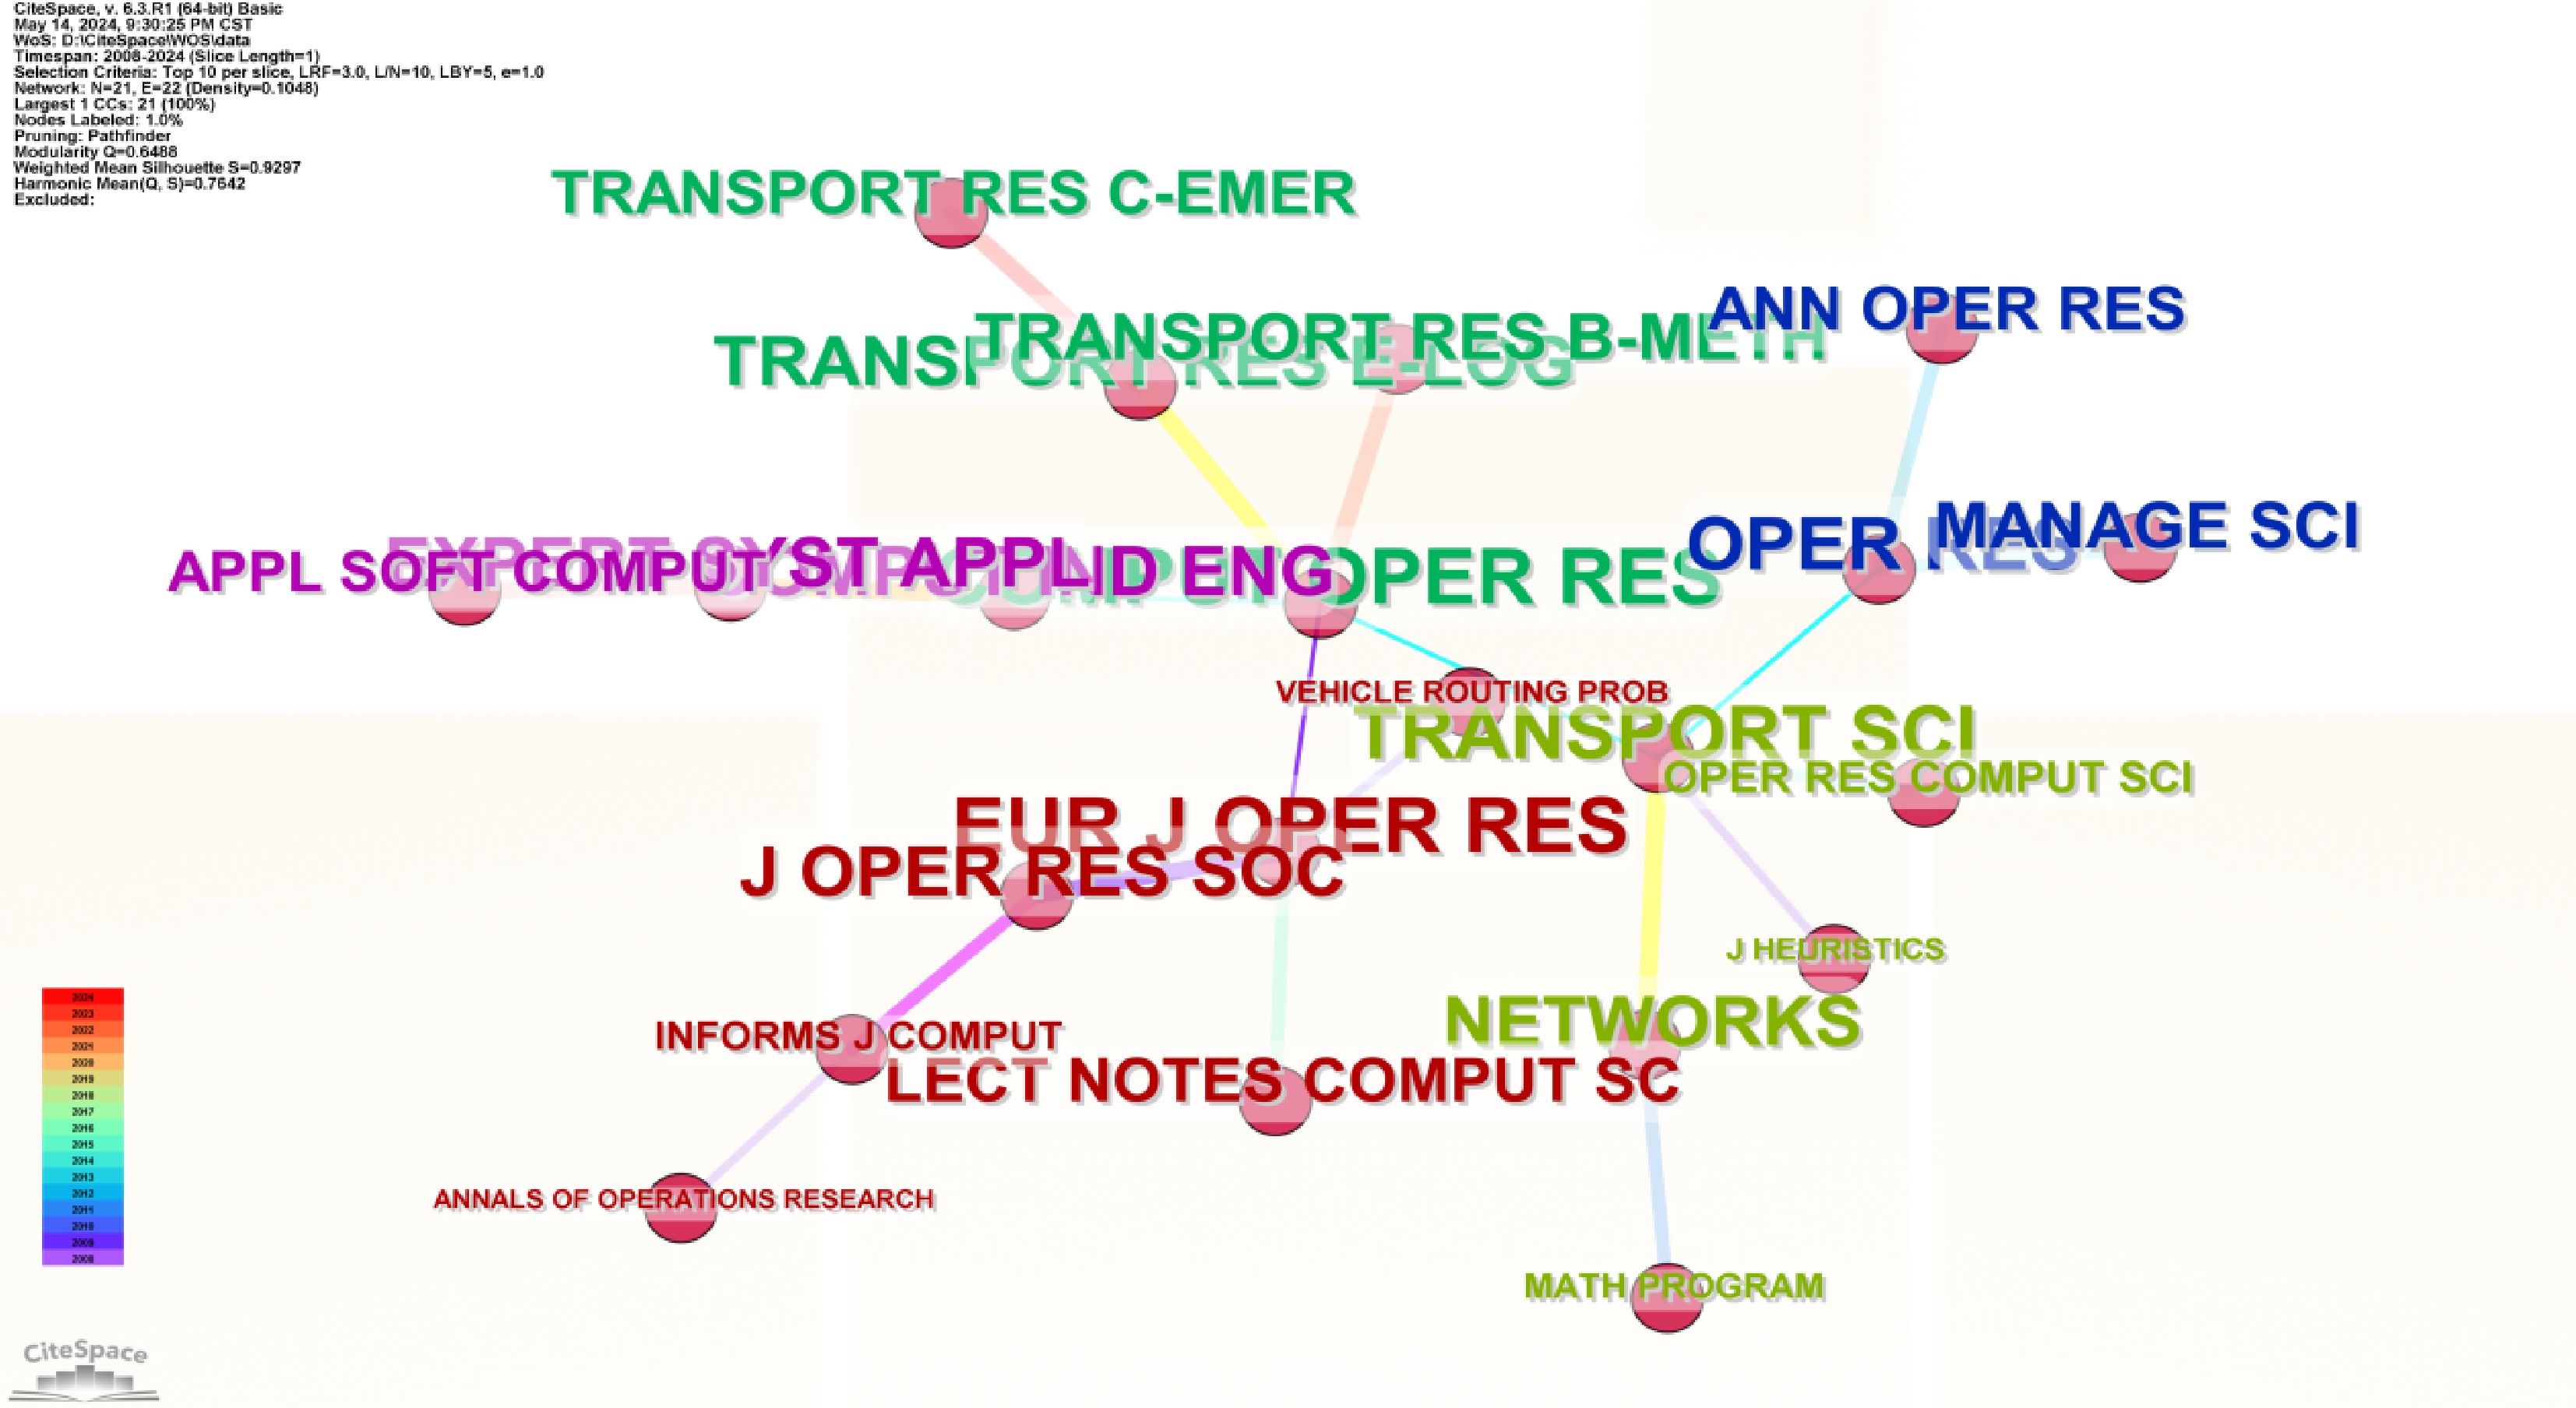
Figure 6.
Network diagram of co-citations of CCVRP research journals.
-
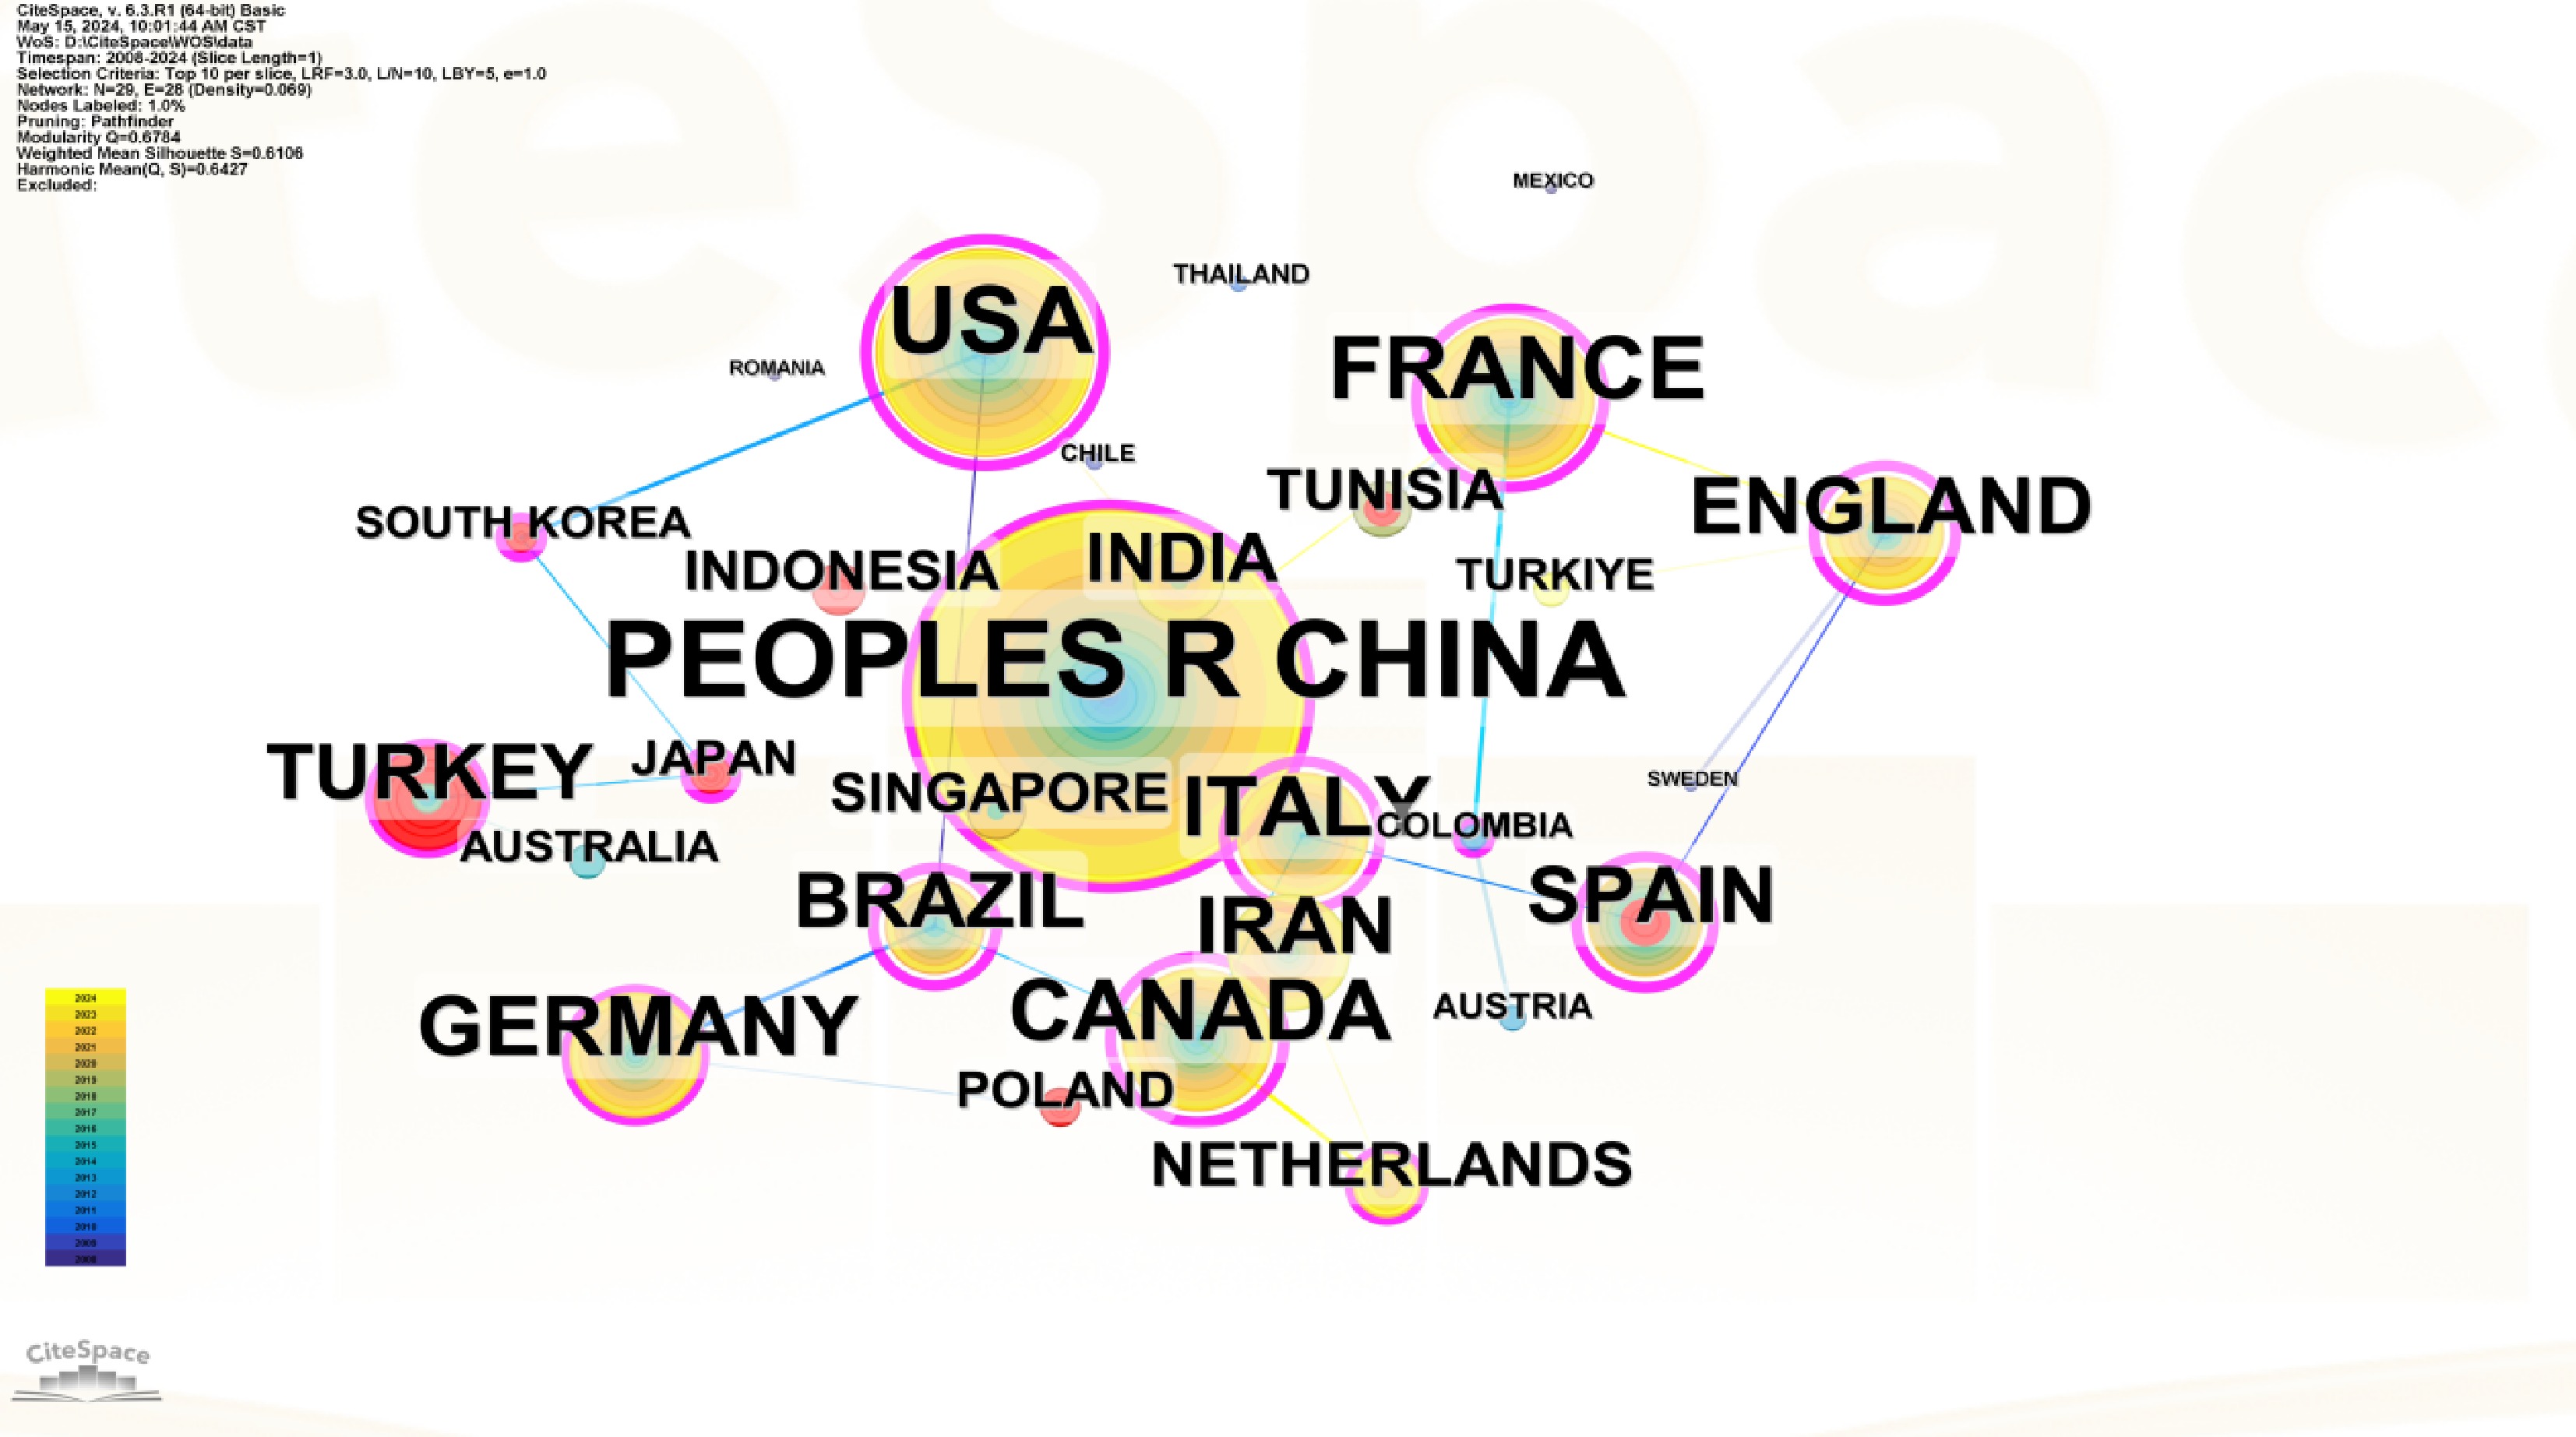
Figure 7.
CCVRP research cooperation network of various countries.
-
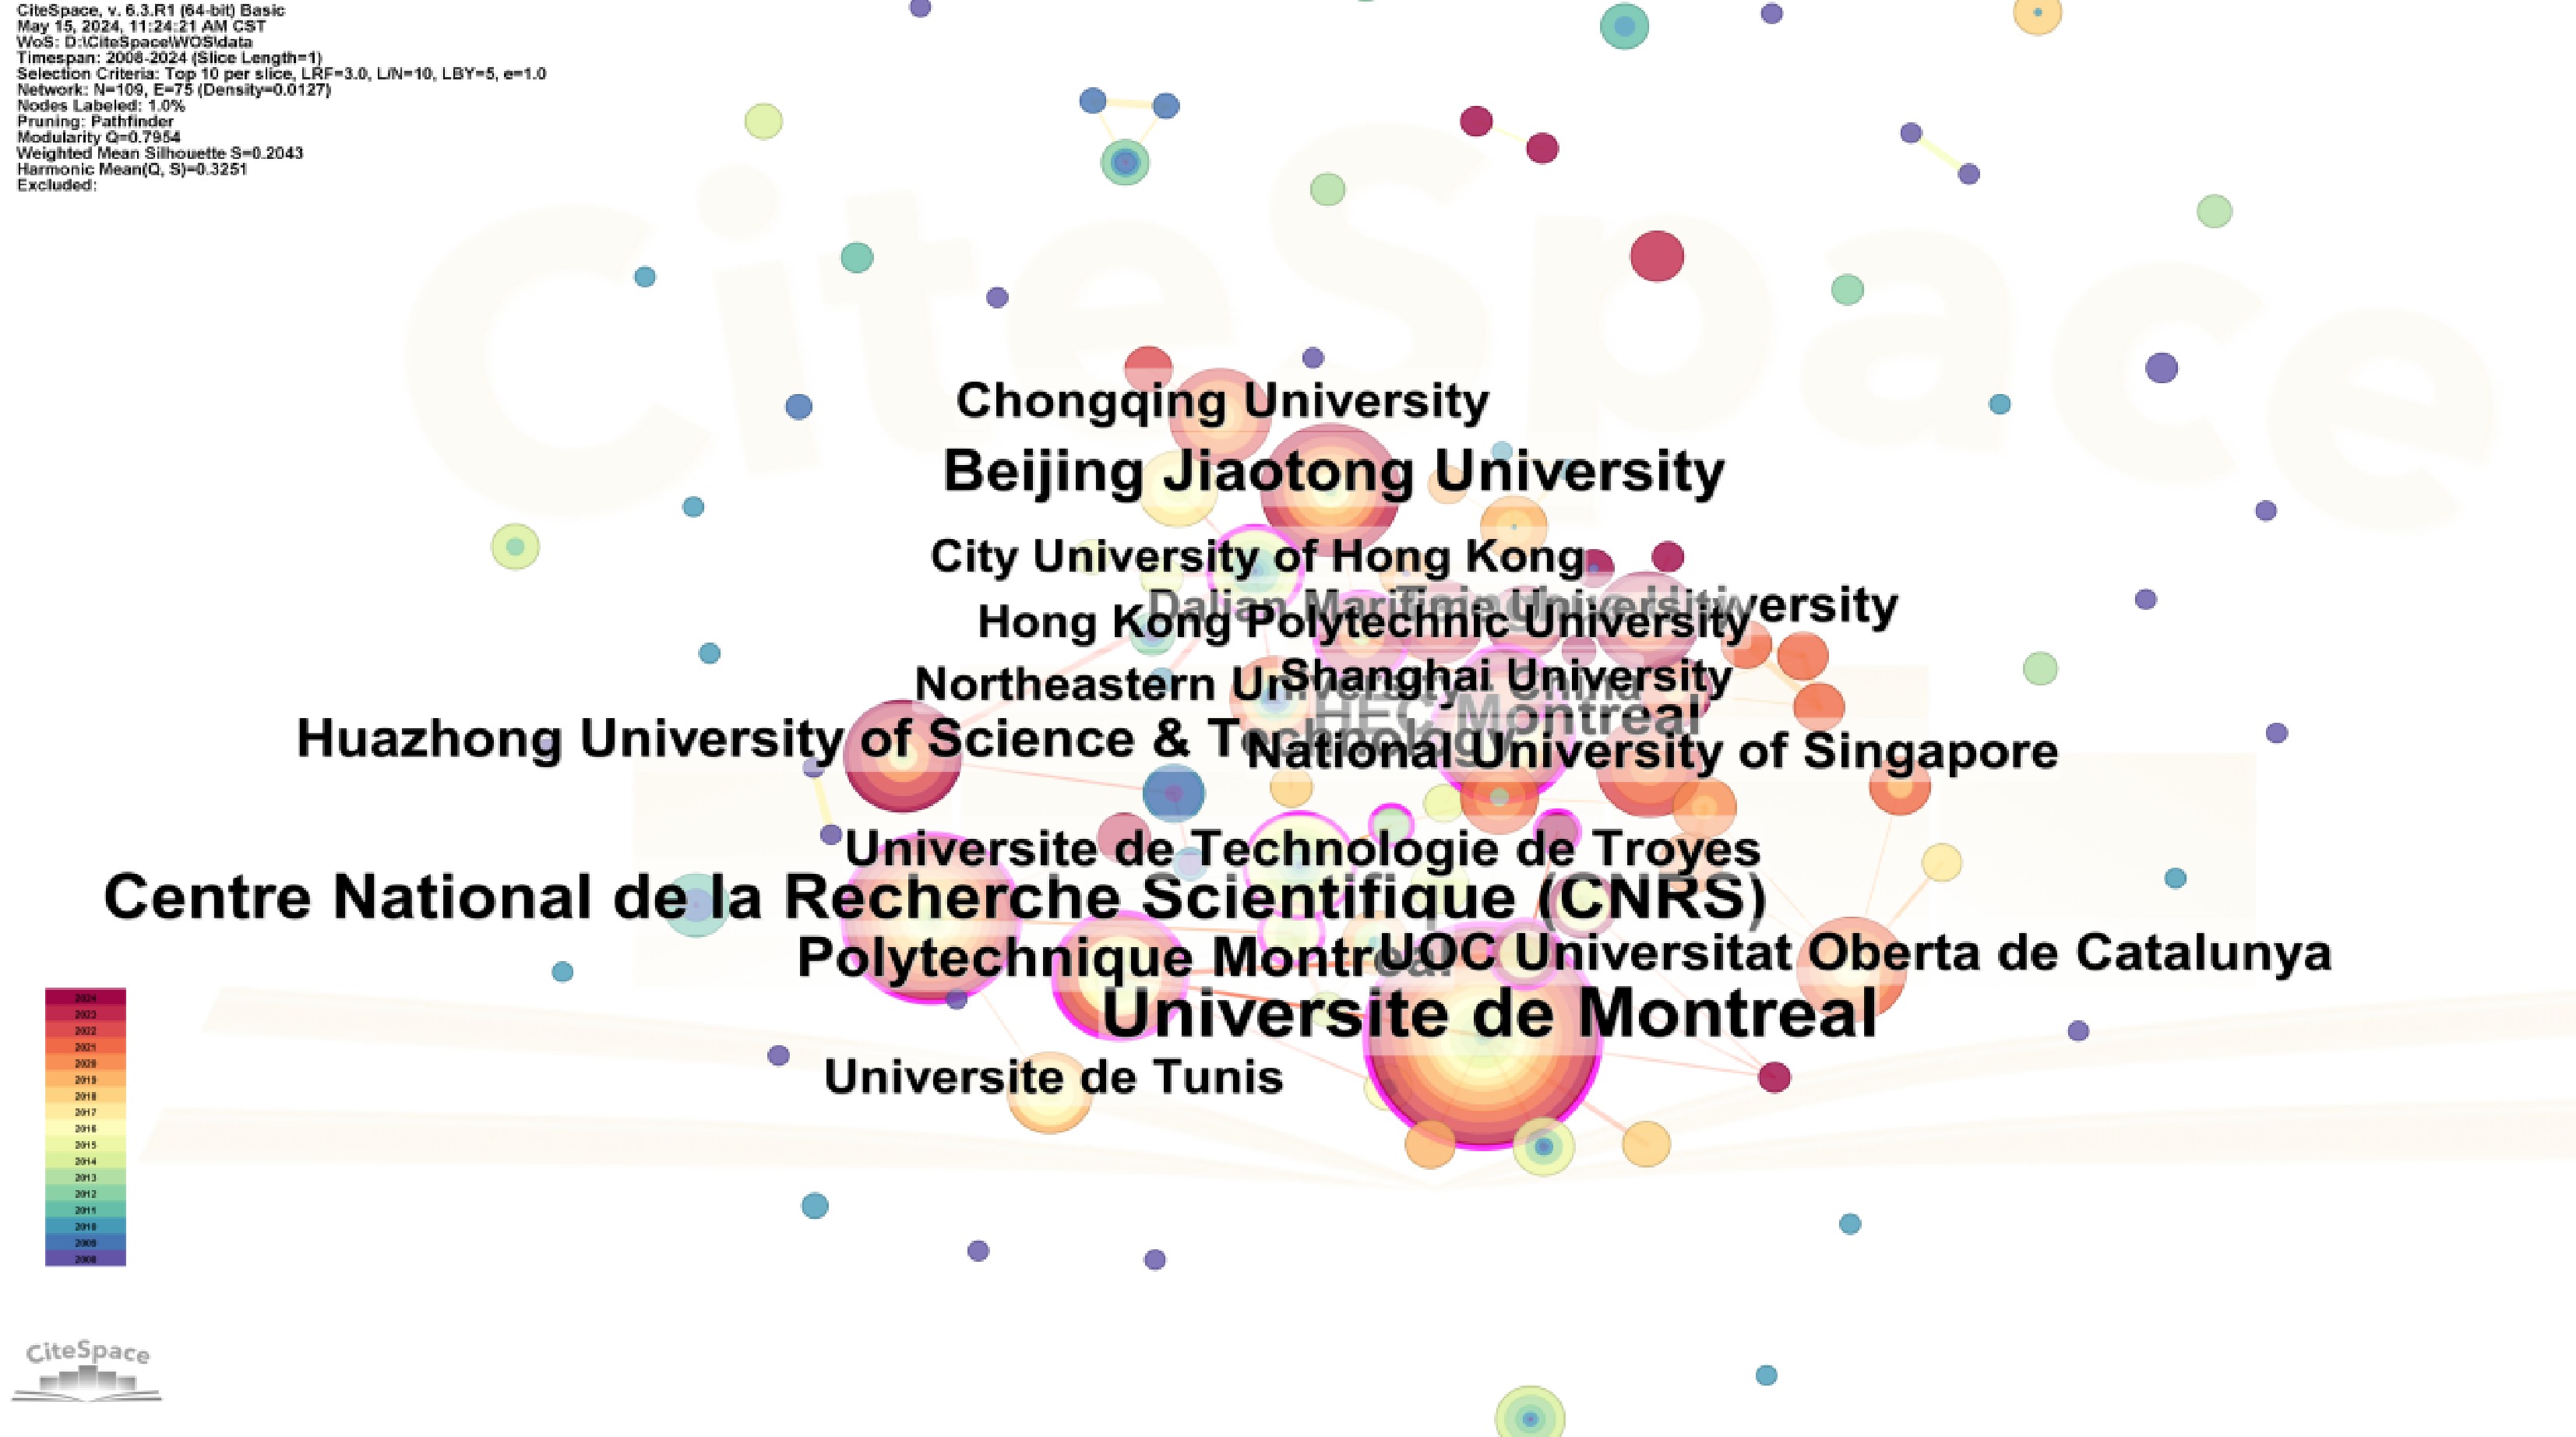
Figure 8.
CCVRP research institution cooperation network.
-
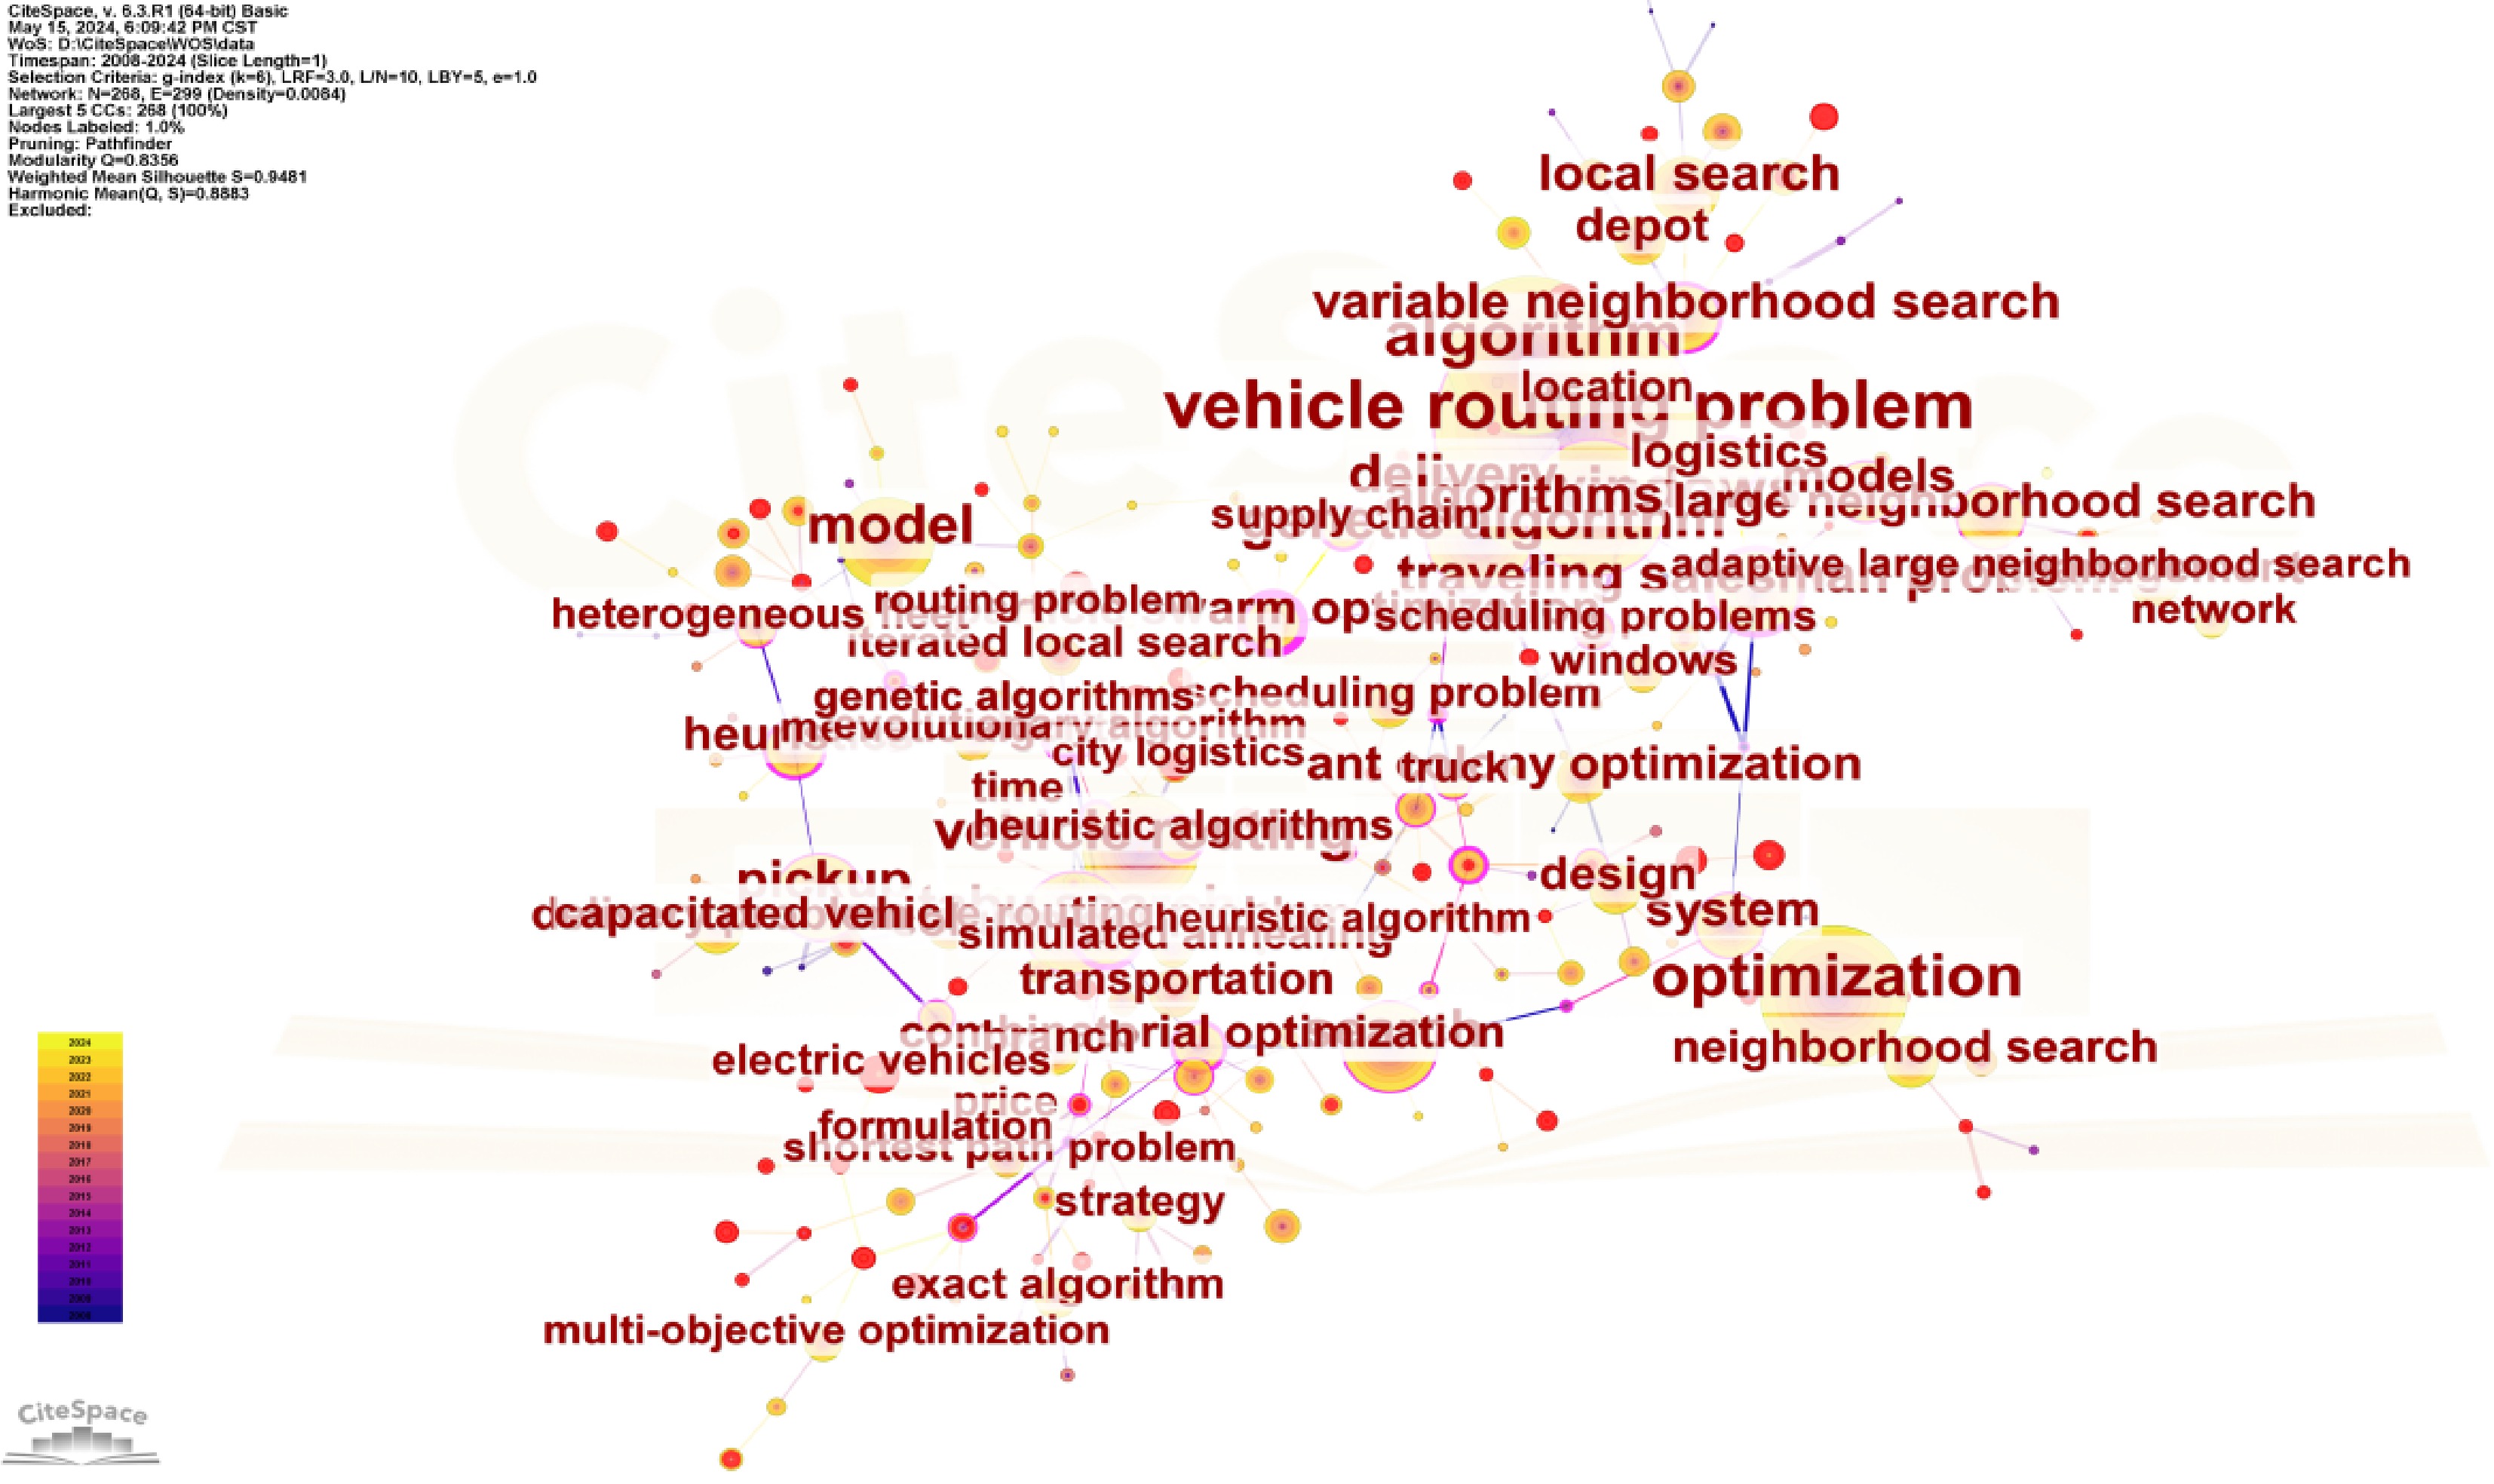
Figure 9.
Keyword co-occurrence network diagram in CCVRP research.
-
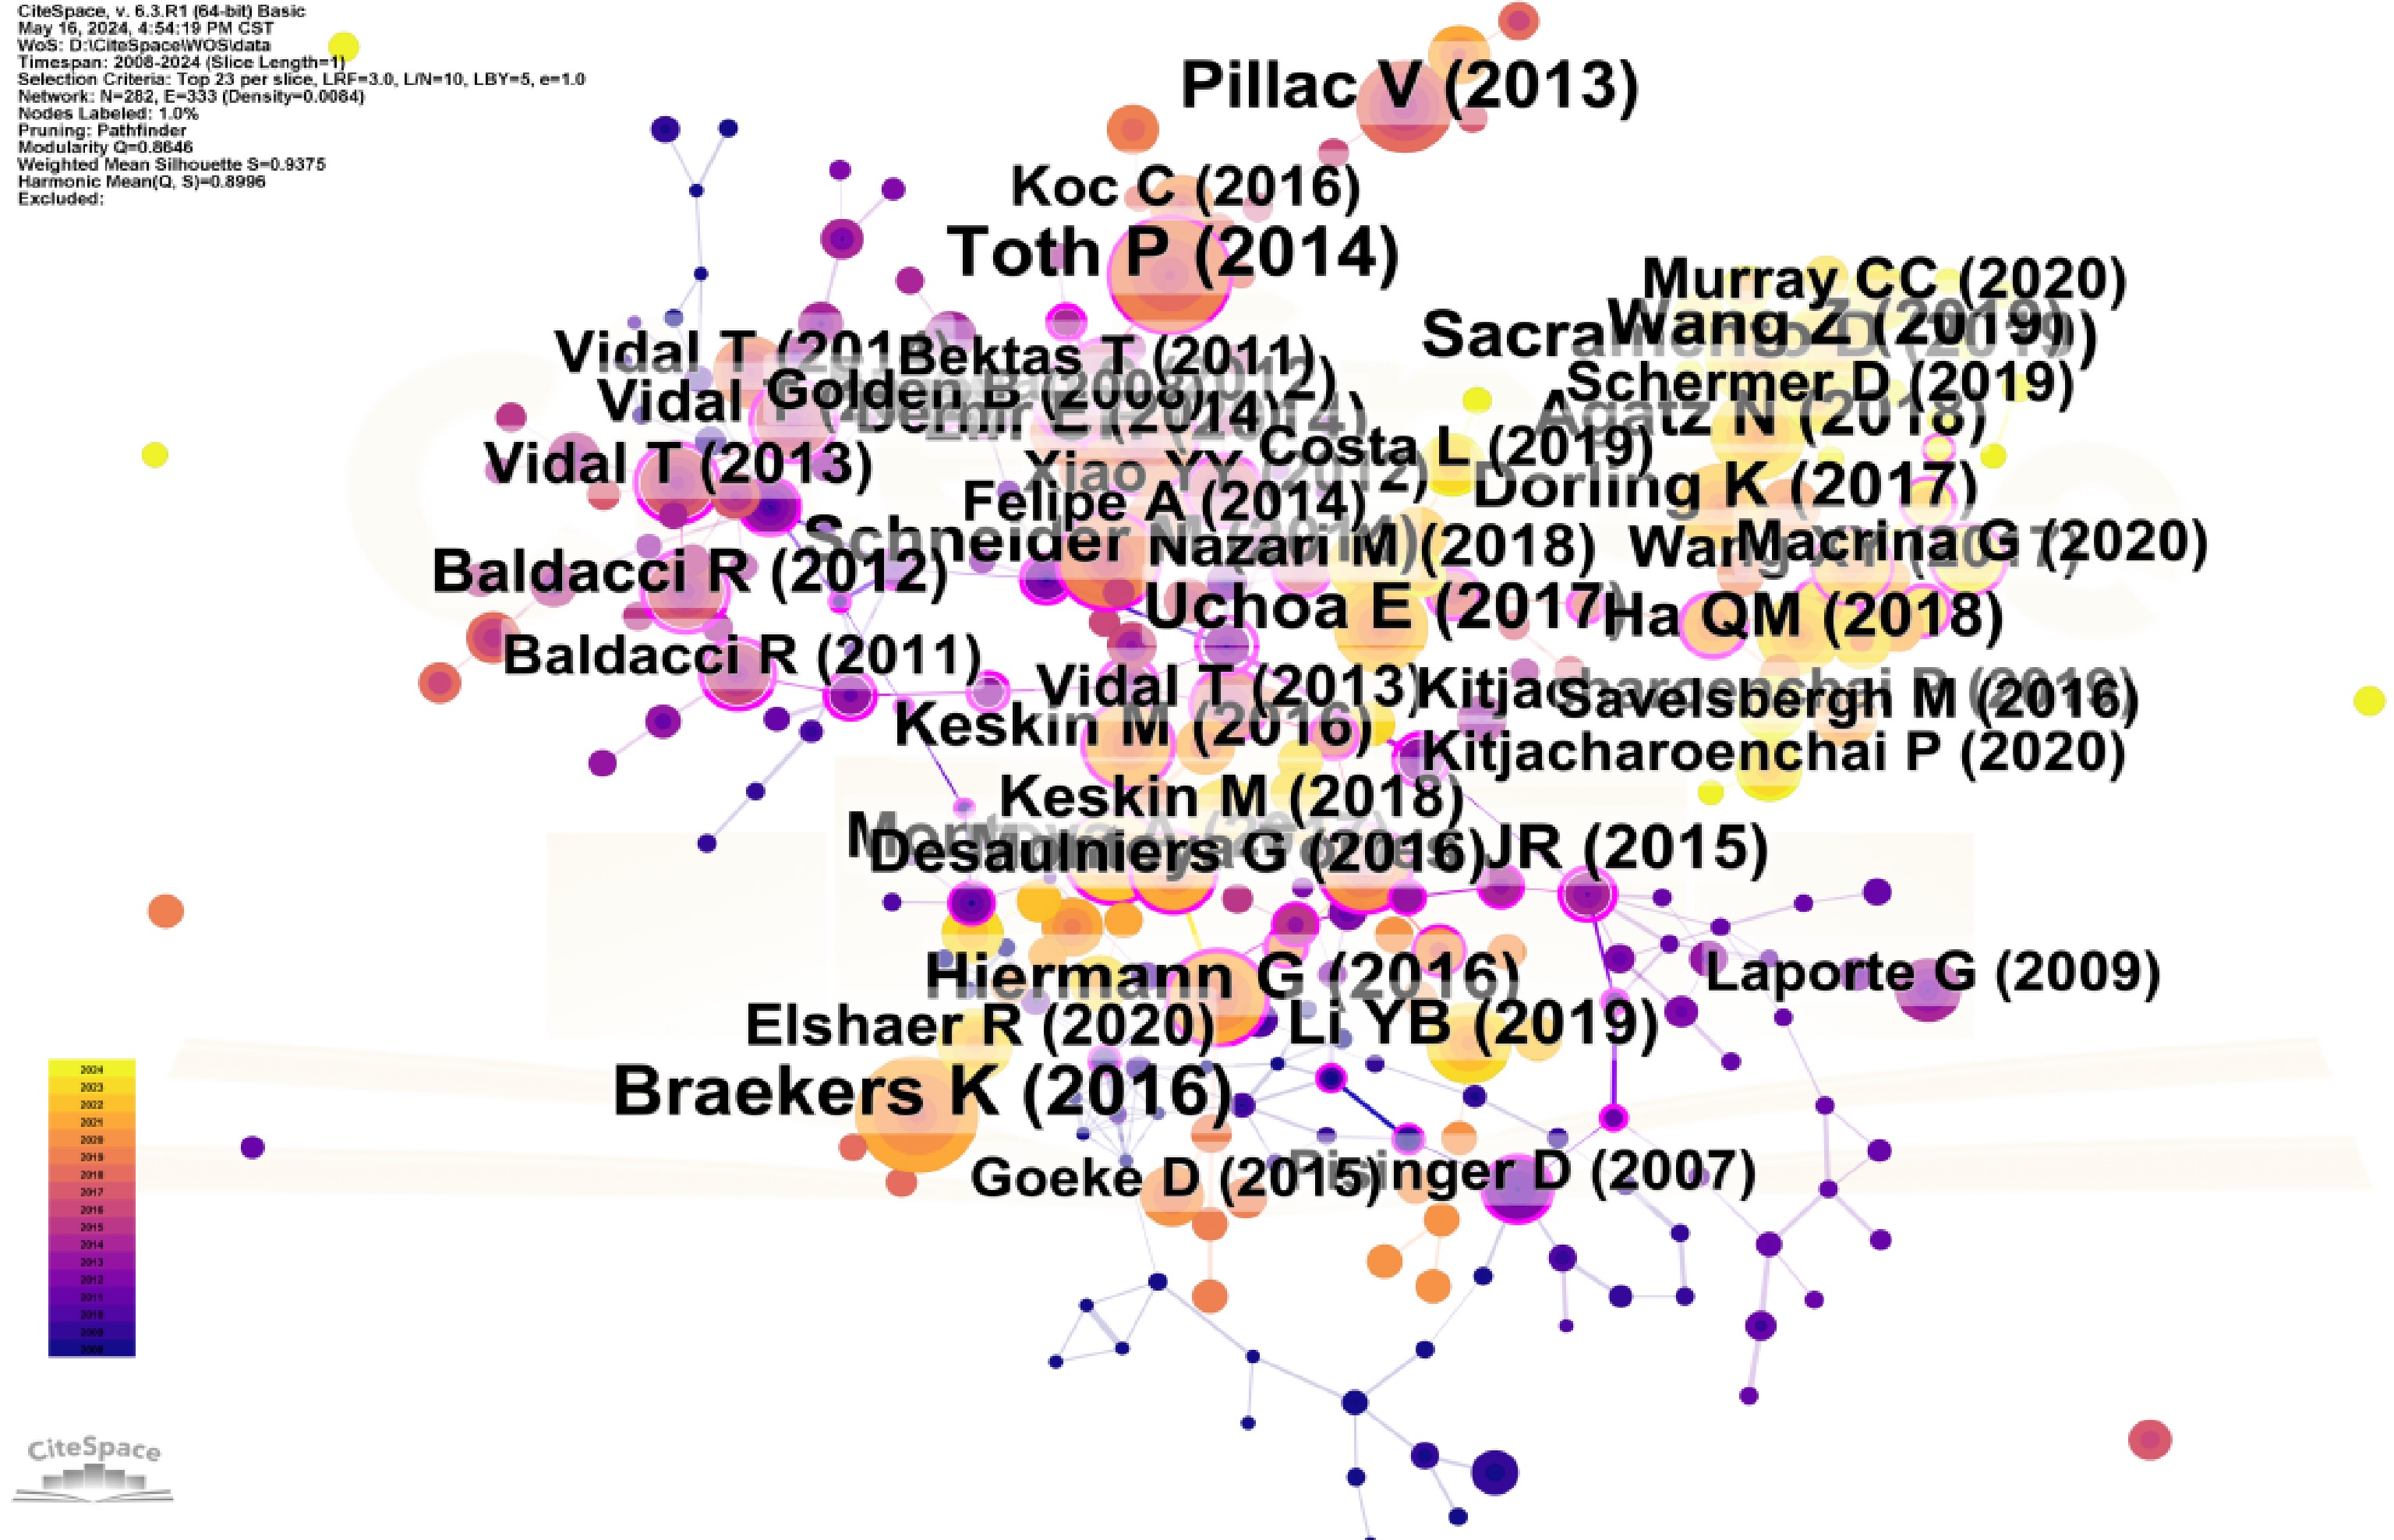
Figure 10.
Co-citation network of references in CCVRP research.
-
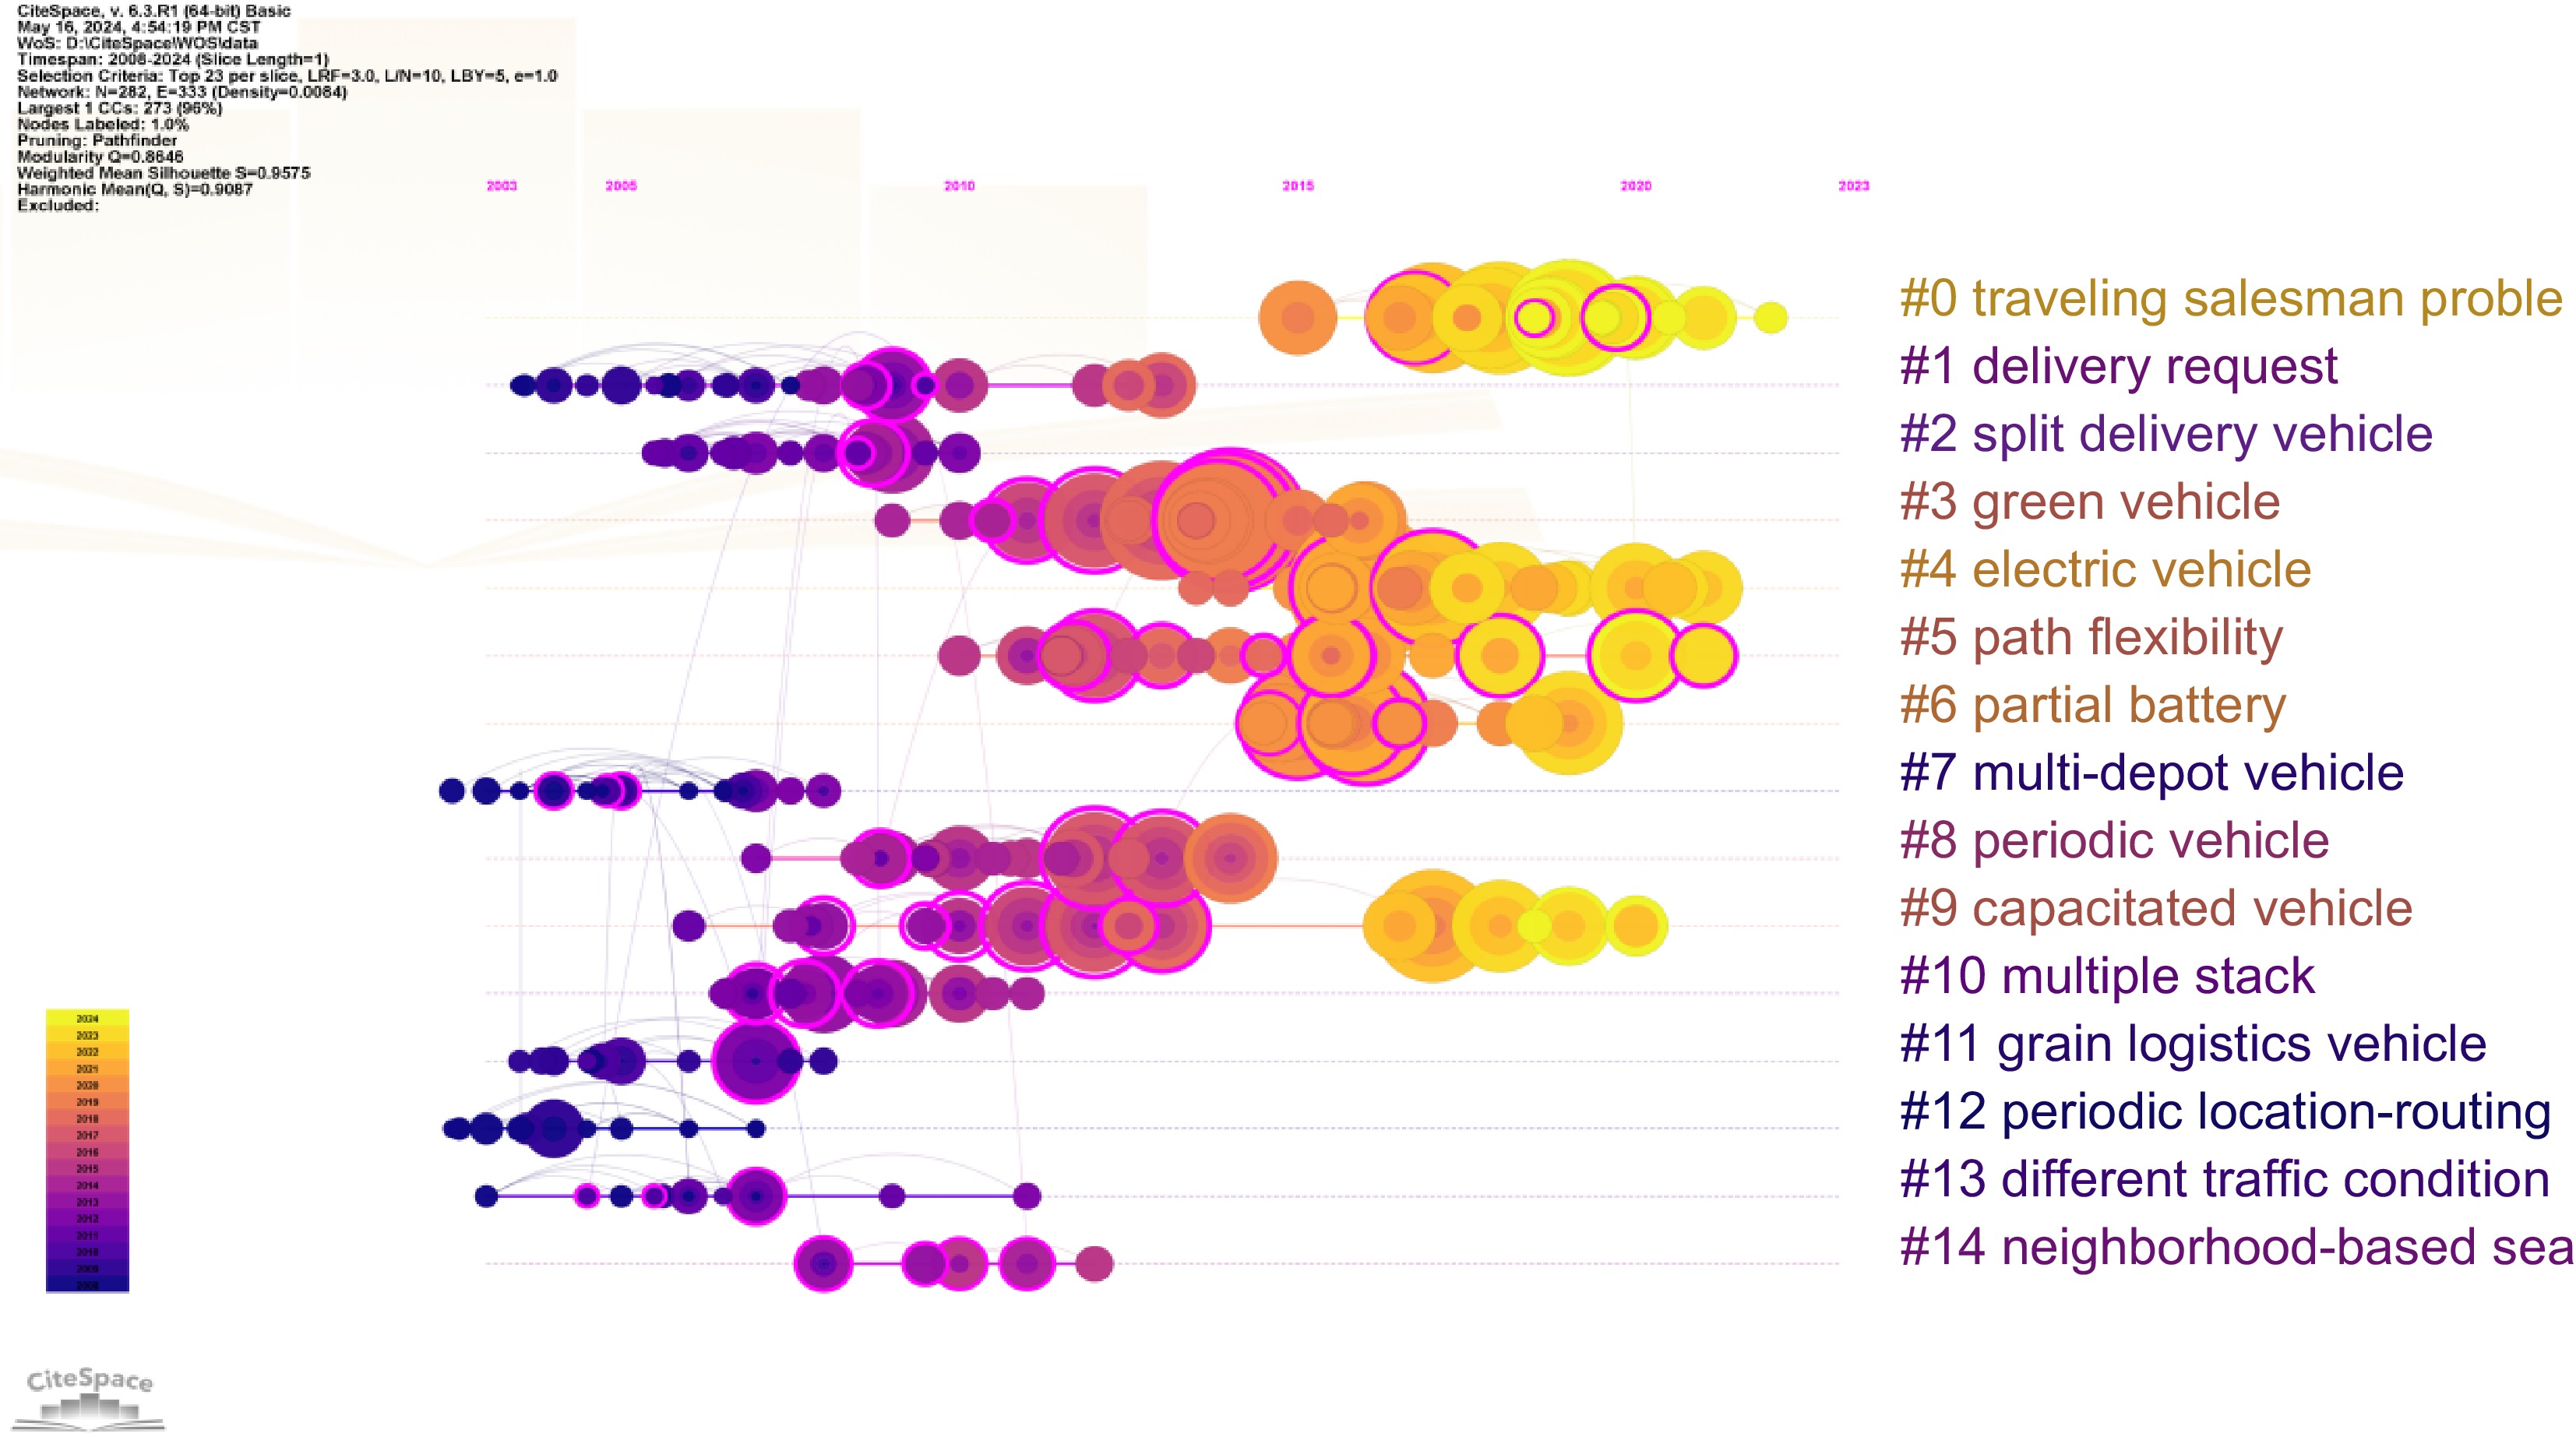
Figure 11.
Timeline view of the top 15 largest reference co-citation clusters.
-
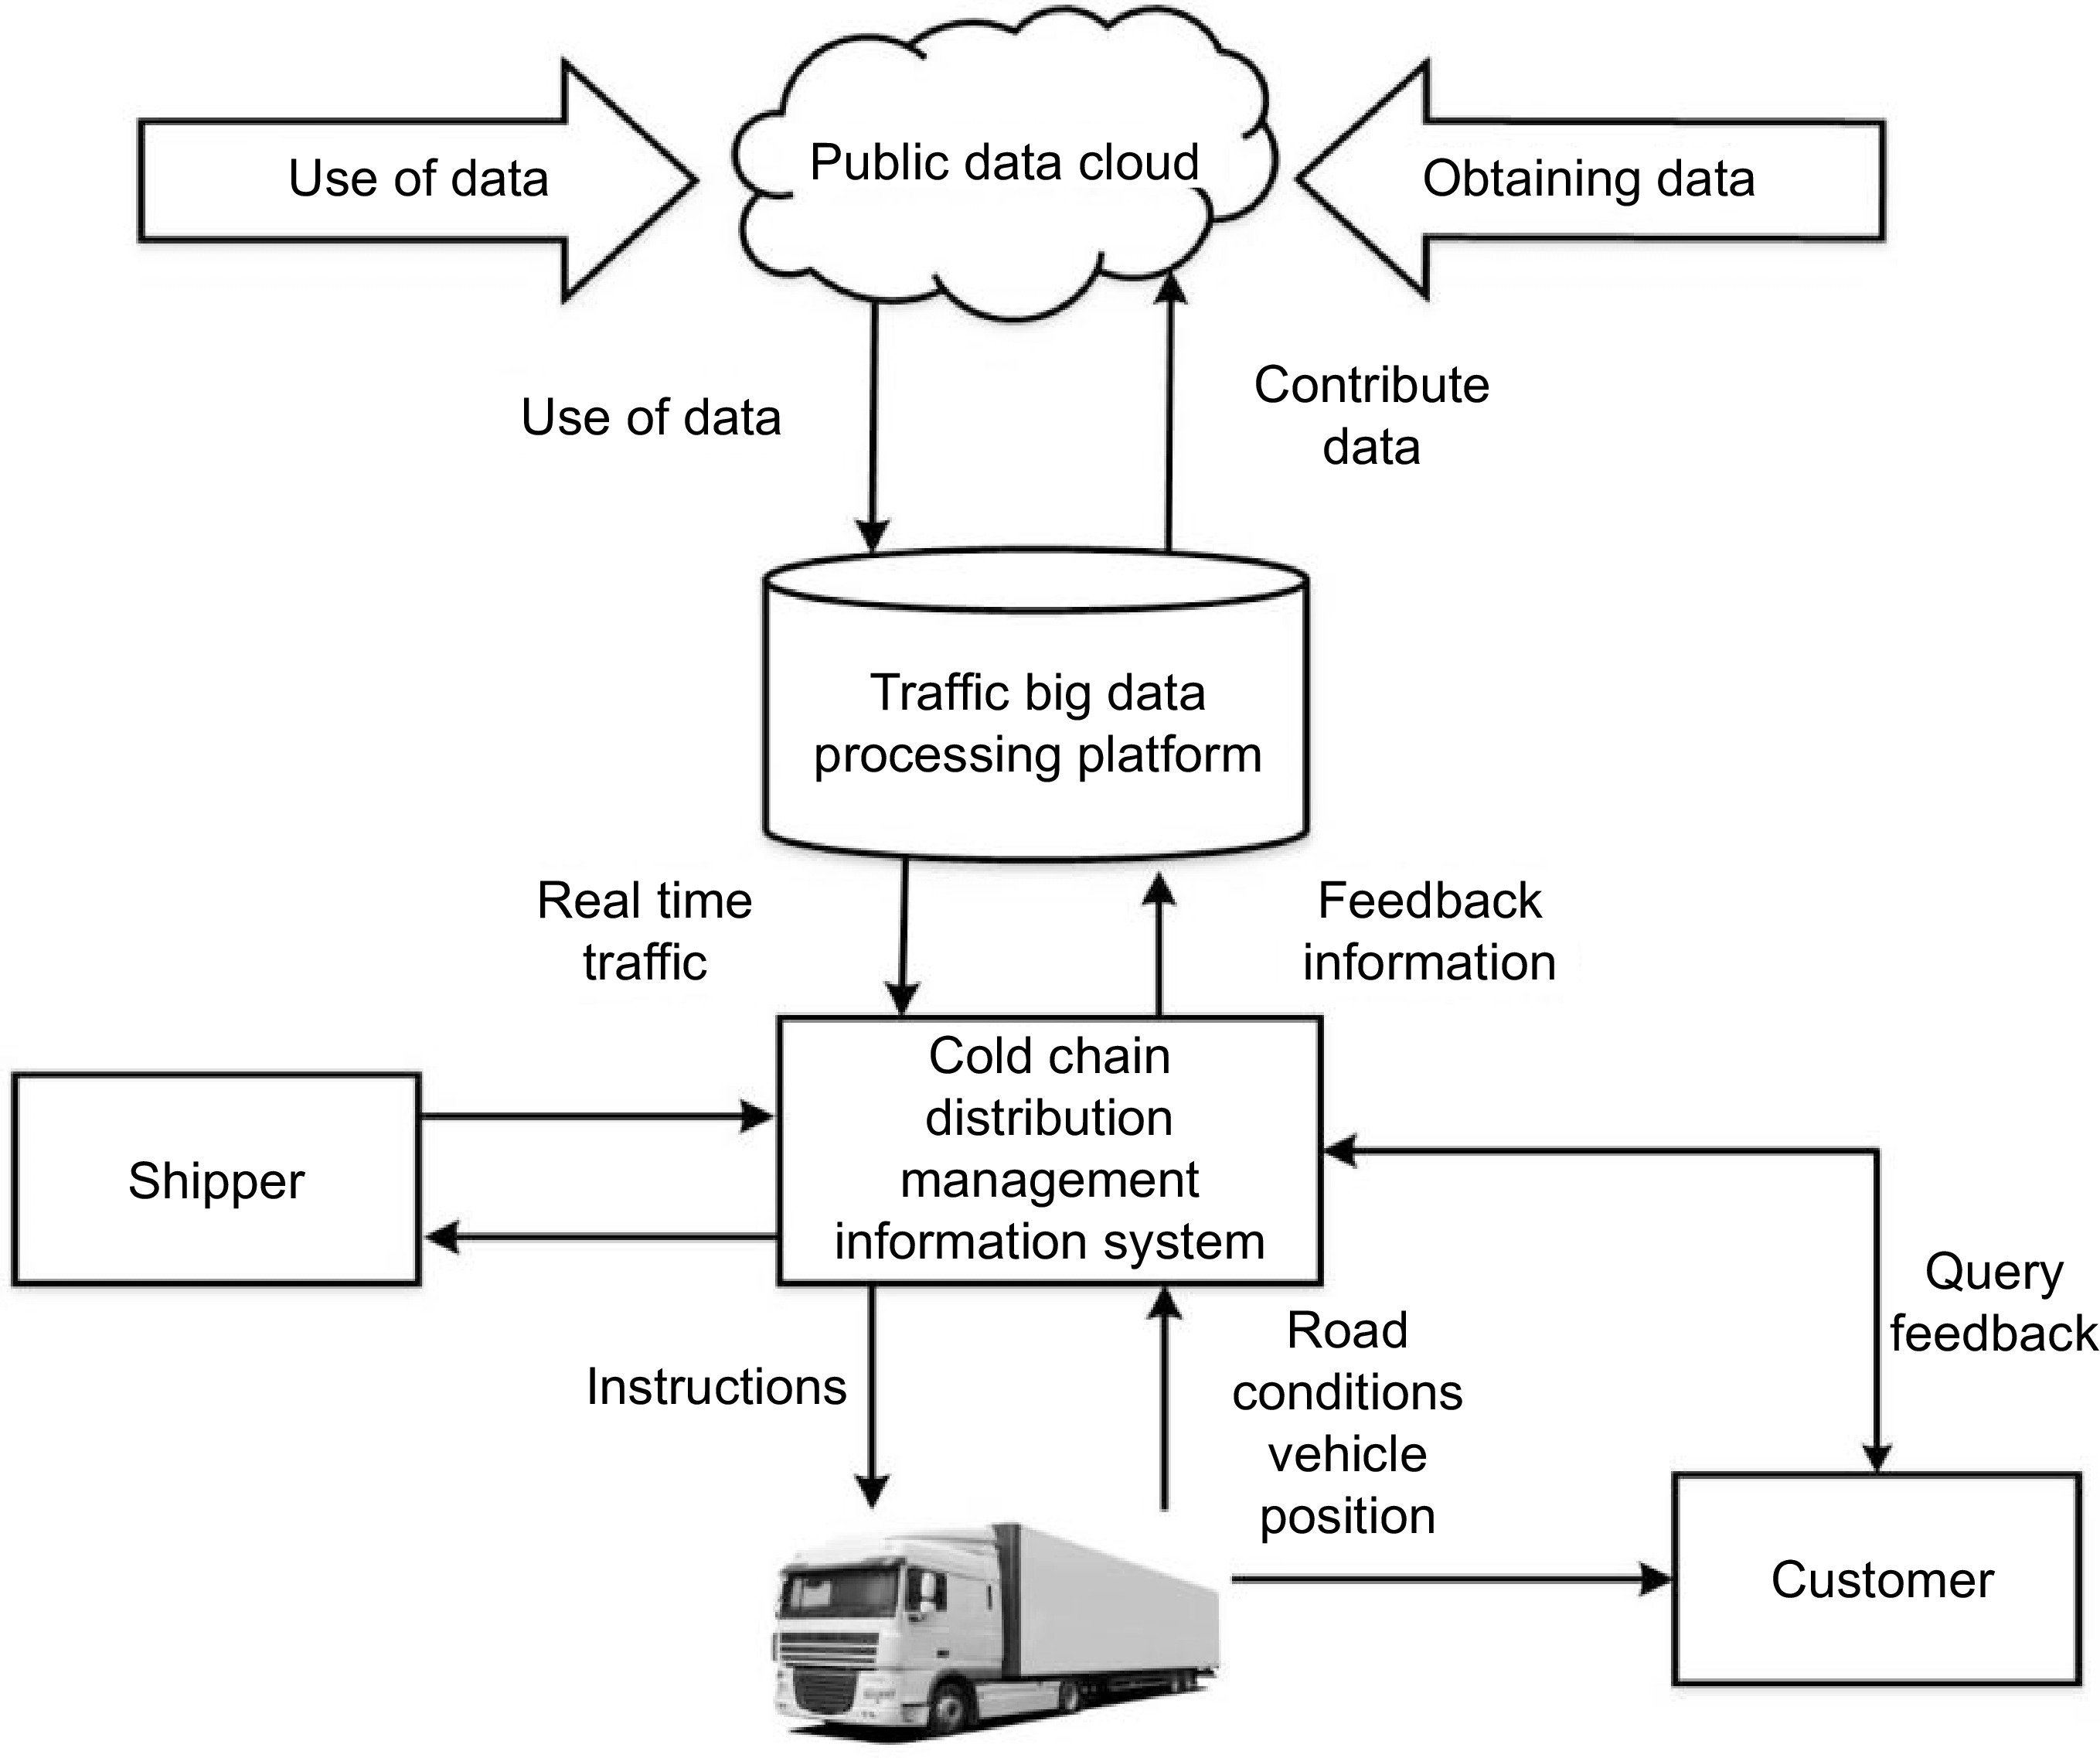
Figure 12.
Application of traffic big data in cold chain logistics distribution.
-
Publication Year Scope (WOS) Methodology Time span Count Li et al.[12] 2023 GVRP Bibliometric analysis 2000−2021 166 Pillac et al.[13] 2013 DVRP Content analysis 1995−2013 154 Qin et al.[14] 2019 VRP-CSC Systematic analysis 1983−2018 53 Ostermeier et al.[15] 2020 MCVRP Content analysis 1981−2020 89 Koç et al.[16] 2016 HVRP Content analysis 1981−2015 137 Kucukoglu et al.[17] 2021 EVRP Systematic analysis 2001−2021 165 Sar & Ghadimi[18] 2023 RLVRP Bibliometric analysis 1959−2022 109 Erdelic & Carić[19] 2019 EVRP Content analysis 1959−2018 175 Braekers et al.[20] 2016 VRP Systematic analysis 2009−2015 309 Zhang & Van Woensel[21] 2022 DVRPRR Systematic analysis 1980−2022 185 Asghari & Mirzapour Al-e-hashem[22] 2021 GVRP Systematic analysis 2000−2020 313 Li et al.[23] 2022 VRP-LBO Content analysis 1959−2020 212 Ni & Tang[24] 2023 VRP Bibliometric analysis 1955−2022 209 Demir et al.[25] 2014 GVRP Content analysis 1996−2013 118 Mardešić et al.[26] 2023 SDVRP Content analysis 1957−2022 180 Table 1.
Summary of review articles on cold chain logistics vehicle routing issues.
-
No. Web of Science category Count 1 Operations Research Management Science 2749 2 Computer Science Artificial Intelligence 1487 3 Engineering Electrical Electronic 1214 4 Computer Science Interdisciplinary Applications 1123 5 Engineering Industrial 1084 6 Computer Science Theory Methods 956 7 Transportation Science Technology 918 8 Computer Science Information Systems 707 9 Management 637 10 Transportation 531 Table 2.
Distribution of the top 10 categories in CCVRP research.
-
No. Highly published authors Highly cited authors Author Count 7,416 percentile Author Count Half-life 1 Juan AA 83 1.119 Dantzig GB 1443 10.5 2 Wang Y 69 0.93 Solomon MM 1282 10.5 3 Laporte G 63 0.85 Door G 1457 9.5 4 Gendreau M 50 0.674 T oth P 1628 9.5 5 Lim A 45 0.607 C oreau JF 1097 8.5 6 Zhang J 42 0.566 Gendreau M 1197 8.5 7 Li J 39 0.526 Clarke G 564 7.5 8 Zhang ZZ 39 0.526 B aldacca R 848 6.5 9 Van Woensel T 38 0.512 C hristofides N 261 4.5 10 Yu VF 38 0.512 Prins C 156 4.5 Table 3.
Top 10 most published and most cited authors in the study.
-
No. Citation Centrality SSCI/SCIE Journal title Count 7,416 percentile Five-Year Impact Factor 1 5787 0.86 SCIE, Q1 European Journal of Operational Research 330 4.45% 6.4 2 5338 1.51 SCIE, Q1 Computers & Operations Research 321 4.33% 4.7 3 4154 1.14 SCIE, Q1 Transportation Science 149 2.01% 5.1 4 3947 0.39 SCIE, Q1 Operations Research 27 0.36% 4.6 5 2892 0.38 SCIE, Q1 Computers & Industrial Engineering 220 2.97% 4.3 6 2387 0.2 SCIE, Q1 Expert Systems with Applications 195 2.63% 6.9 7 2273 0.38 SCIE, Q2 Journal of the Operational Research Society 52 0.70% 2.6 8 2184 0.2 SCIE, Q2 Networks 85 1.15% 2.8 9 2053 0.2 SCIE, Q1 Transportation Research Part E: Logistics and Transportation Review 160 2.16% 4.0 10 1424 0 SCIE, Q1 Transportation Research Part B: Methodological 74 1.00% 5.6 Table 4.
Top 10 CCVRP research journals with the highest citations.
-
No. Count Centrality Year Country 1 2280 0.36 2008 China 2 796 0.65 2008 USA 3 504 0.74 2008 France 4 428 0.93 2011 Canada 5 401 0.83 2008 Italy 6 344 0.13 2008 Germany 7 265 0 2009 Iran 8 262 0.81 2008 Spain 9 246 0.88 2009 England 10 215 0.13 2011 Turkey Table 5.
The top 10 countries with the highest publication rates between 2008 and 2024.
-
No. Count Centrality Year Country Institution 1 252 0.31 2008 Canada Montreal University 2 153 0.19 2008 France National Center for Scientific Research (CNRS) 3 94 0.02 2008 China Beijing Jiaotong University 4 83 0.35 2011 Canada HEC Montreal 5 74 0.25 2011 Canada Polytechnique Montreal 6 64 0.04 2009 China Huazhong University of Science & Technology 7 53 0.04 2009 Spain UOC Open University of Catalonia 8 49 0.13 2008 France University of Technology of Troyes 9 48 0.04 2008 China Tsinghua University 10 47 0.08 2019 Singapore National University of Singapore Table 6.
Top 10 institutions in terms of publication volume from 2008 to 2024.
-
No. High-published countries High-published institutions Count Centrality Country Count Centrality Institution 1 1847 0.55 China 209 0.64 University of Montreal 2 683 1.3 USA 126 0.42 Centre National de la Recherche Scientifique (CNRS) 3 424 0.97 France 77 0.05 Beijing Jiaotong University 4 374 0.85 Canada 64 0.51 Polytechnique Montreal 5 341 0.2 Italy 64 0.77 HEC Montreal 6 299 0 Germany 57 0 Huazhong University of Science & Technology 7 257 0 Iran 49 0.11 UOC Universitat Oberta de Catalunya 8 217 0.2 United Kingdom (UK, England) 47 0.2 National University of Singapore 9 196 0.37 Spain 44 0.05 Chongqing University 10 181 0 Turkey 43 0.11 Tsinghua University Table 7.
The top 10 most productive countries and institutions in the past decade.
-
No. Freq. Centrality Year Keyword 1 3617 0.16 2008 Vehicle routing problem 2 1573 0 2008 Algorithm 3 1178 0.09 2008 Optimization 4 1137 0.12 2008 Time windows 5 815 0.04 2008 Vehicle routing 6 698 0.19 2008 Genetic algorithm 7 653 0.1 2008 Tabu search 8 594 0.08 2009 Model 9 562 0.13 2008 Search 10 506 0.03 2008 Delivery 11 485 0.46 2008 Traveling salesman problem 12 460 0.15 2009 Pickup 13 440 0.04 2008 Algorithms 14 365 0.23 2010 Variable neighborhood search 15 345 0.09 2009 Local search 16 305 0.19 2008 System 17 276 0.1 2013 Large neighborhood search 18 258 0.05 2008 Ant colony optimization 19 250 0.12 2011 Models 20 244 0.62 2008 Particle swarm optimization Table 8.
Top 20 keywords with the highest co -occurrence frequency.
-
No. Keywords Year Burst BurstBegin BurstEnd 1 Tabu search 2008 33.9 2008 2015 2 Vehicle routing 2008 23.95 2009 2013 3 Constraints 2008 22.83 2012 2018 4 Scheduling problems 2008 20.22 2008 2017 5 Genetic algorithm 2008 19.7 2008 2010 6 Reinforcement learning 2021 13.37 2021 2024 7 Last-mile delivery 2020 12 2021 2024 8 Vehicle routing problem 2008 11.58 2008 2010 9 Deep reinforcement learning 2022 11.39 2022 2024 10 Stochastic demands 2011 11.24 2016 2019 11 Bee colony algorithm 2019 10.33 2019 2021 12 Mathematical model 2019 10.29 2020 2021 13 Electric vehicle routing problem 2022 10.21 2022 2024 14 Shortest path problem 2011 10.16 2013 2015 15 Vehicle routing problems 2011 10.07 2011 2015 16 Multi-depot vehicle routing problem 2011 9.87 2011 2018 17 Approximation algorithms 2011 9.84 2011 2016 18 Resource constraints 2013 9.62 2013 2015 19 Hybrid 2019 9.53 2021 2024 20 Search problems 2020 9.49 2020 2022 21 Carbon emission 2022 9.44 2022 2024 22 Machine learning 2021 9.3 2021 2024 23 Energy consumption 2019 9.27 2022 2024 24 Column generation 2009 9.23 2013 2014 25 Fleet 2019 9.16 2021 2024 26 Task analysis 2022 9.01 2022 2024 27 Optimization model 2020 8.82 2020 2022 28 Tabu search algorithm 2011 8.72 2013 2016 Table 9.
Top 28 keywords with a surge in citations between 2008 and 2024.
-
No. Article title Author Freq. Journal title 1 The vehicle routing problem: State of the art classification and review Braekers K (2016)[20] 181 Computers & Industrial Engineering 2 Vehicle Routing: Problems, Methods, and Applications Toth P (2014)[42] 168 Society for Industrial and Applied Mathematics 3 Survey of green vehicle routing problem: past and future trends Lin CH (2014)[41] 141 Expert Systems with Applications 4 An adaptive large neighborhood search metaheuristic for the vehicle routing problem with drones Sacramento D (2019)[43] 124 Transportation Research Part C: Emerging Technologies 5 A review of dynamic vehicle routing problems Pillac V (2013)[13] 122 European Journal of Operational Research 6 The electric fleet size and mix vehicle routing problem with time windows and recharging stations Hiermann G (2016)[44] 116 European Journal of Operational Research 7 The electric vehicle-routing problem with time windows and recharging stations Schneider M (2014)[45] 112 Transportation Science 8 New benchmark instances for the capacitated vehicle routing problem Uchoa E (2017)[46] 112 European Journal of Operational Research 9 Vehicle routing problem with drones Wang Z (2019)[47] 112 Transportation Research Part B: Methodological 10 Optimization approaches for the traveling salesman problem
with droneAgatz N (2018)[48] 107 Transportation Science Table 10.
The top 10 most cited references in CCVRP research.
-
Cluster ID Size Silhouette Label (LLR) Average year 0 28 0.986 Traveling salesman problem 2019 1 25 0.98 Delivery request 2007 2 25 0.923 Split delivery vehicle 2007 3 22 1 Green vehicle 2013 4 21 0.948 Electric vehicle 2017 5 20 0.982 Path flexibility 2014 6 20 1 Electric vehicle 2016 7 20 0.9 Multi-depot vehicle 2005 8 19 0.965 Electric vehicle 2010 9 16 0.878 Electric vehicle 2013 10 15 1 Multiple stack 2008 11 13 1 Grain logistics vehicle 2005 12 13 0.892 Periodic location-routing problem 2004 13 11 0.879 Different traffic condition 2006 14 5 1 Neighborhood-based search heuristic 2010 Table 11.
The top 15 largest reference co-citation clusters in CCVRP studies.
-
Objective function type Priorities of optimization objectives Ref. Multiple targets Based on minimizing the total cost of distribution [56, 57] Based on maximizing customer satisfaction and minimizing total distribution cost [14, 58−63] Based on carbon emission minimization, total distribution cost minimization [14, 64], etc. Based on the minimization of total distribution cost and multi temperature co distribution [75, 76] Based on real-time road conditions and minimize total distribution cost [77−82] Based on minimizing total distribution cost, minimizing carbon emissions, and maximizing customer satisfaction [14] Single target Based on minimizing carbon emissions [65] Table 12.
Objective function types and characteristics of cold chain logistics vehicle routes.
-
Scene type Content of scenario construction Ref. Distribution
cost scenarioTransportation cost [60, 62, 97] Fixed cost, transportation cost [56] Cargo damage cost [75] Carbon emission cost [66, 70], etc. Fixed cost, refrigeration cost [57] Refrigeration cost [69, 85] Refrigeration cost, transportation cost [59, 64], etc. Cargo damage cost, transportation cost [76] Transportation cost, carbon emission cost [61, 64], etc. Refrigeration cost, cargo damage cost [76] Refrigeration cost, carbon emission cost [64] Cost of cargo damage, carbon emission [73, 88] Transportation cost, refrigeration cost, cargo damage cost [76] Transportation cost, refrigeration cost, carbon emission cost [64] Time window penalty cost
and customer satisfaction scenarioTime window penalty cost [60] Maximize customer satisfaction [63] Real time
traffic sceneGet real-time road conditions based on big data [81, 82] Fuzzy comprehensive evaluation method based on road smoothness [78] Real time traffic scene construction [77, 79] Based on time-varying road network theory [80] Table 13.
Cold chain logistics vehicle routing problem scenario types and characteristics.
-
Type Refs Improved advantage Ant colony algorithm [61, 63, 73, 75, 83]
[62, 86, 107, 108, 112][63] Good optimization effect, high solution stability, and stronger search ability, suitable for medium and large-scale data sets;
[73, 85]: Overall cost reduction;
[75]: High timeliness and low cost greatly improve the distribution and transfer efficiency of multi-temperature co-distribution cold chain logistics;
[107, 112]: fast convergence speed and high solving efficiency;
[108]: Reduction in convergence time, total distance and total cost of carbon emissions satisfaction.Genetic algorithm [60, 70, 72, 74]
[76, 84, 86, 109][60]: Double optimization that effectively takes into account cost and customer satisfaction, the total distribution cost is better than the standard genetic algorithm;
[70]: Significant cost reduction;
[72]: Has better convergence efficiency and optimization capabilities;
[74, 76, 109]: Total cost reduction, closer to reality;
[86]: More suitable for solving distribution problems with narrow time windows and random geographical locations of customers or partial clustering and partial randomization.Simulated annealing algorithm Particle swarm optimization [56] [56]: Lower total cost and 100% on-time rate. A* algorithm Artificial fish
swarm algorithm[66] [66]: Fast convergence speed, strong global search capability, and can further balance costs such as fuel consumption, refrigeration, and carbon emissions during the distribution process. Hybrid algorithm [62, 111] [62]: The time penalty cost is significantly reduced, and the total distribution cost is lower;
[111]: Reduce costs, improve robustness, and effectively avoid blindness in distribution.Table 14.
Solving algorithm types and characteristics.
Figures
(12)
Tables
(14)