-
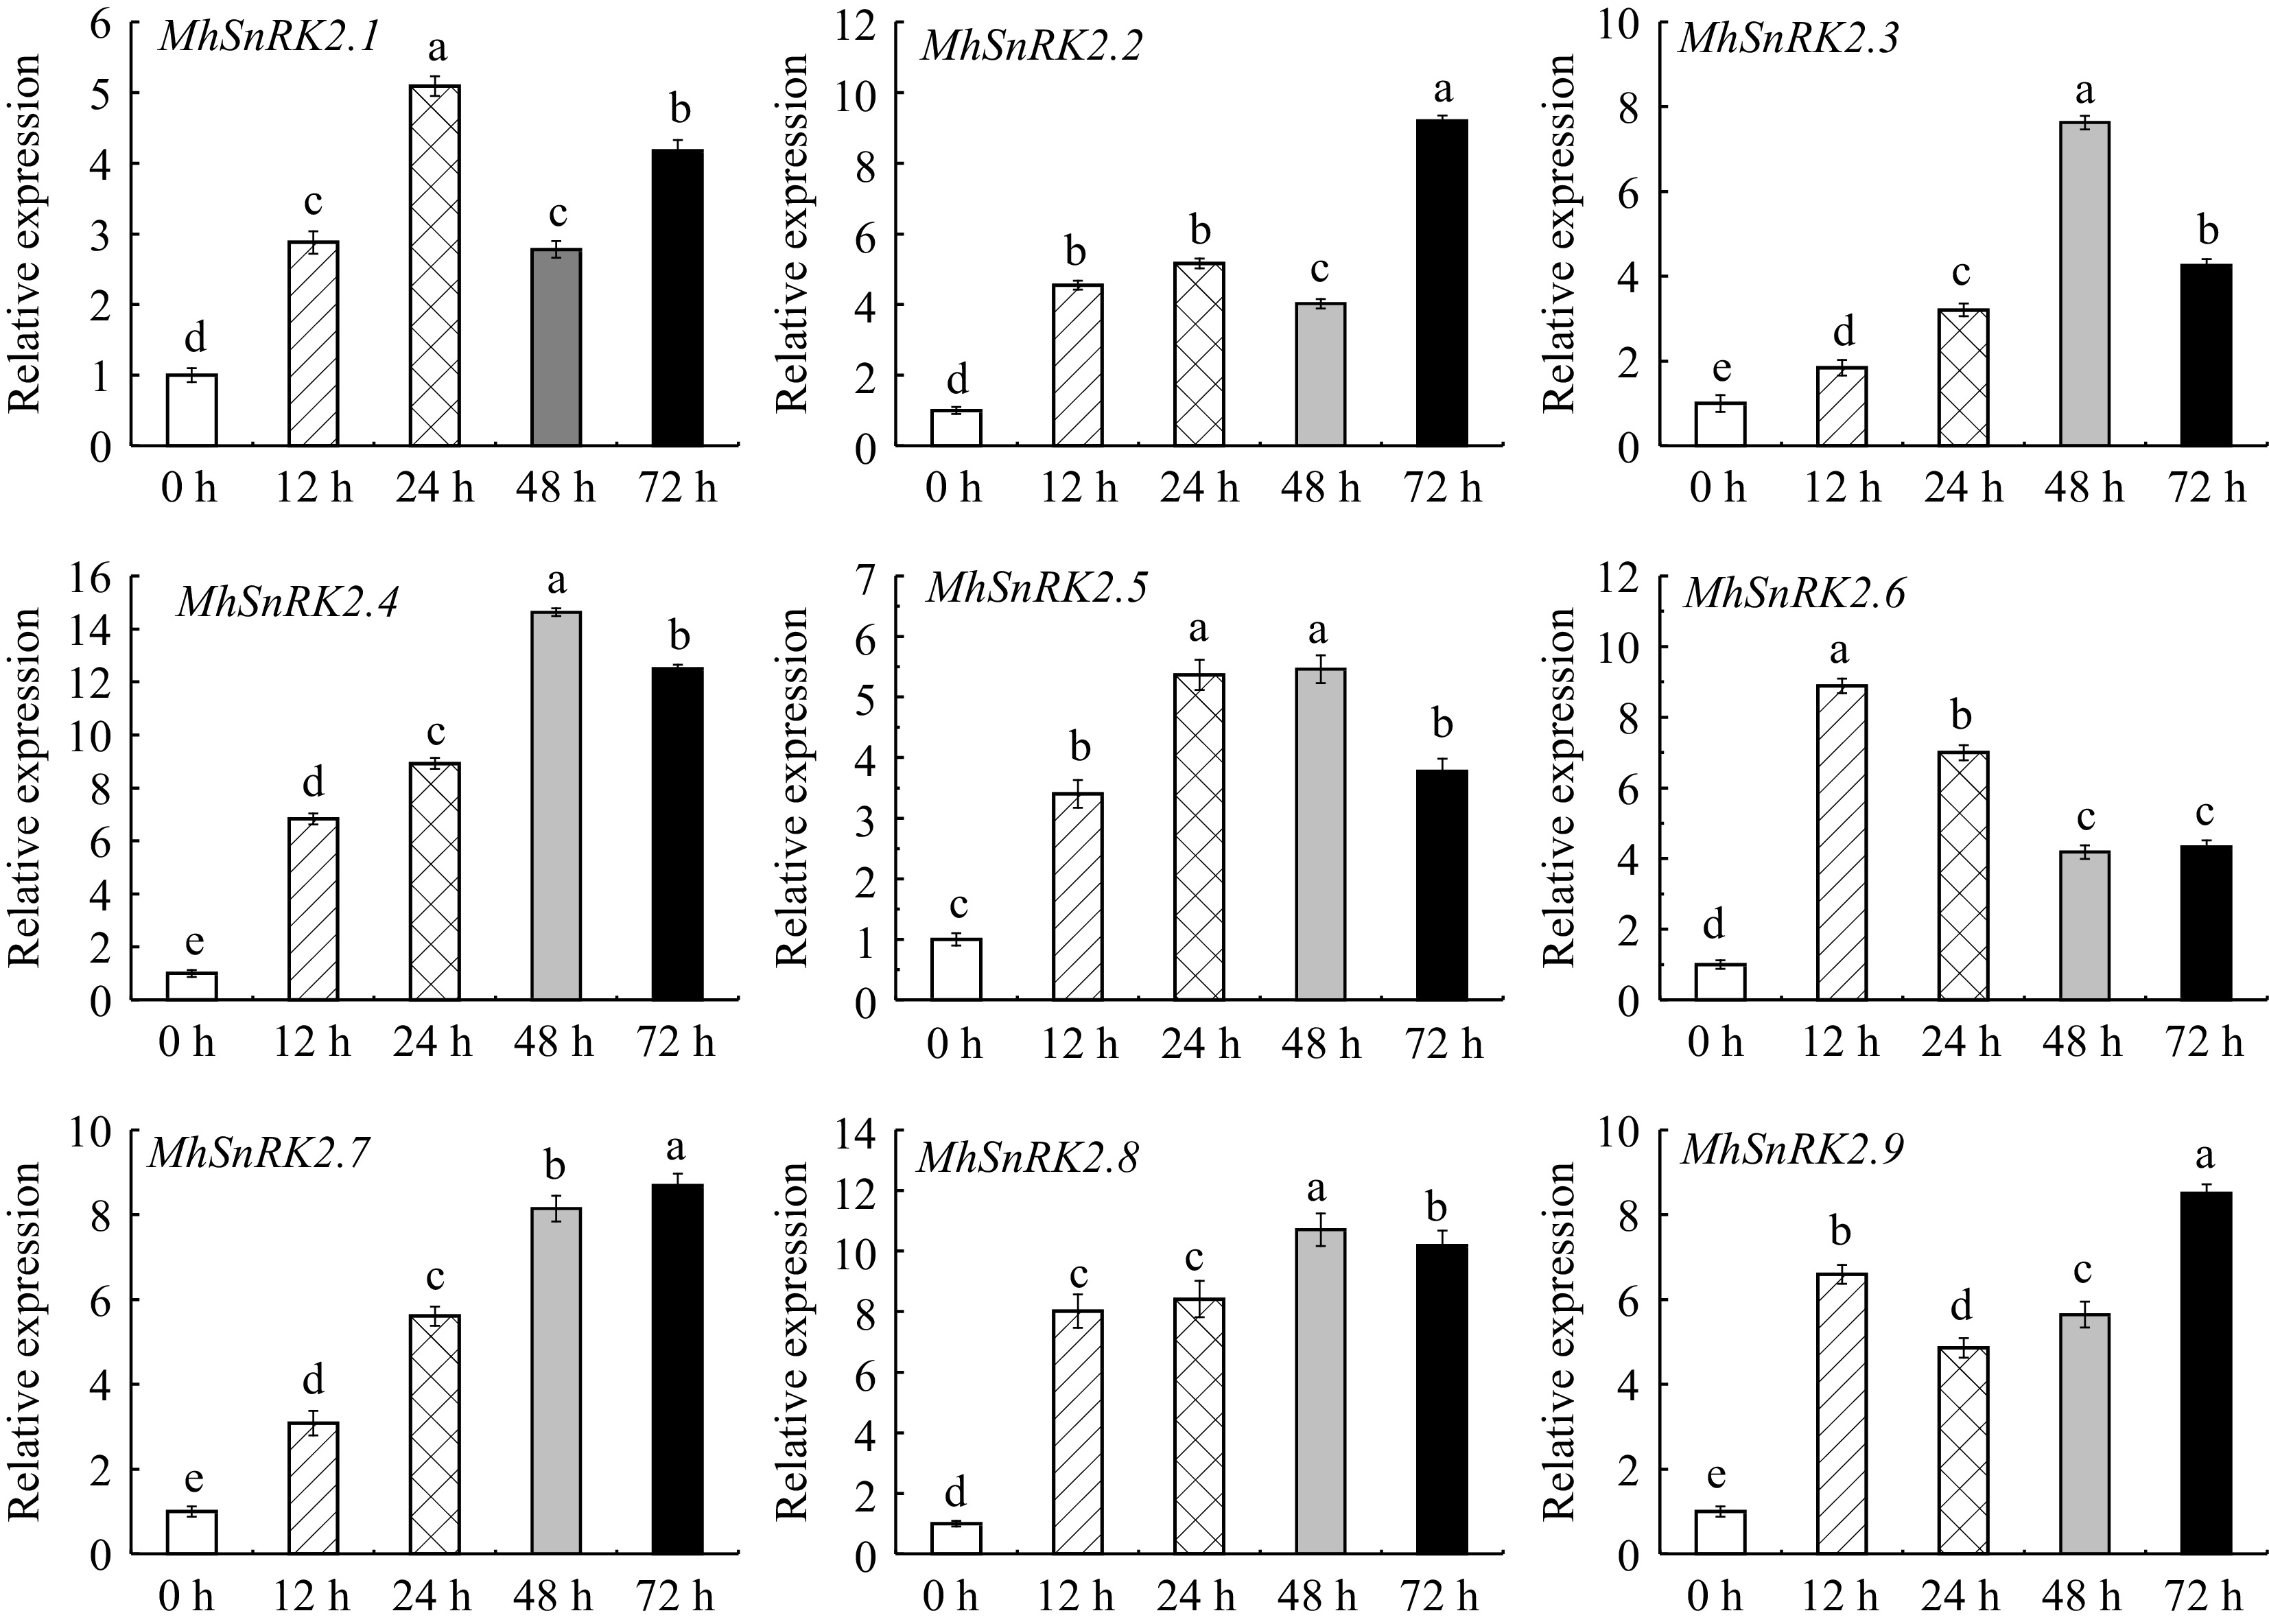
Figure 1.
Expression levels of eight Fe-deficiency functional genes on Fe-deficiency at 0, 12, 24, 48, and 72 h in Malus halliana. Different letters above the bars indicate significant differences (p < 0.05) as assessed by one-way ANOVA and the LSD test (p < 0.05).
-

Figure 2.
PCR amplification of the MhSnRK2.4 gene and the MhSnRK2.4-Anti gene was performed using cDNA from Malus halliana as a template. (a) Electrophoresis of PCR products for cloning of MhSnRK2.4. (b) Electrophoresis images of MhSnRK2.4-Anti amplifcation.
-
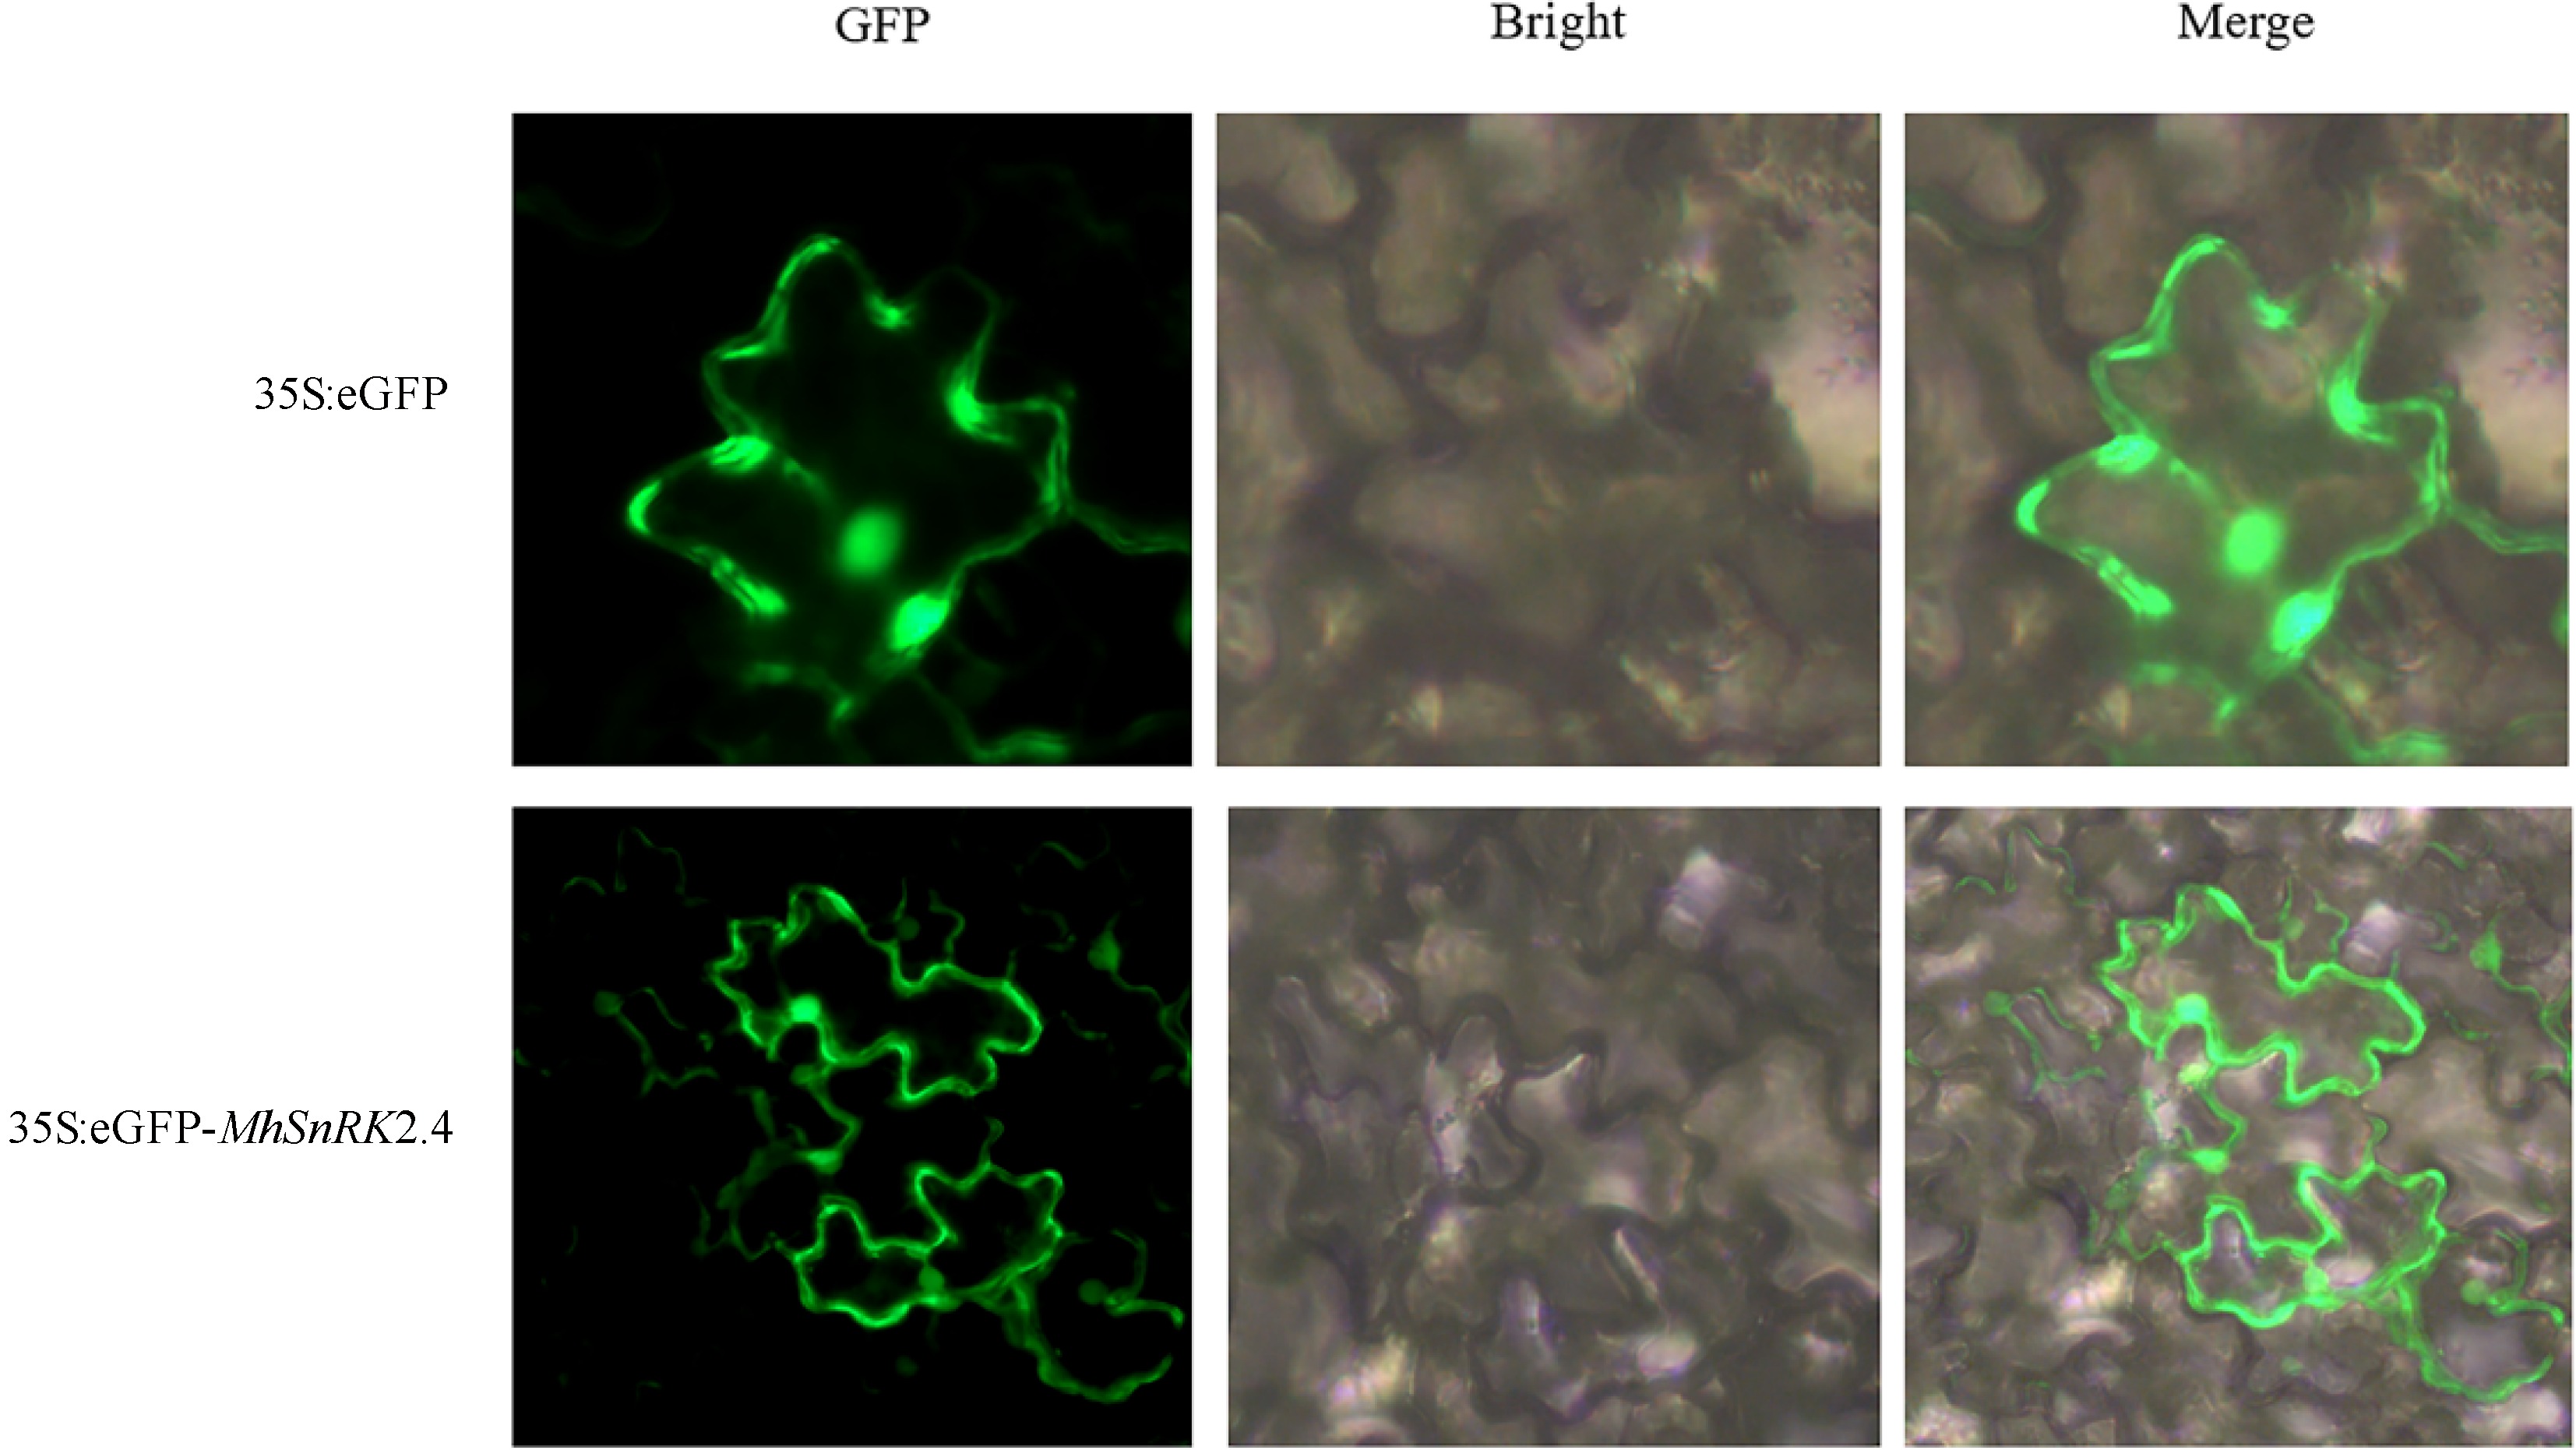
Figure 3.
Subcellular localization of MhSnRK2.4 genes. Tobacco transformed with 35S-GFP were used as the control. Co-transformed tobacco with 35S-MhSnRK2.4 -GFP, and 35S-GFP were used for subcellular localization. The nucleus (of cell) autofuorescence was also visualized by a laser scanning confocal microscopy.
-
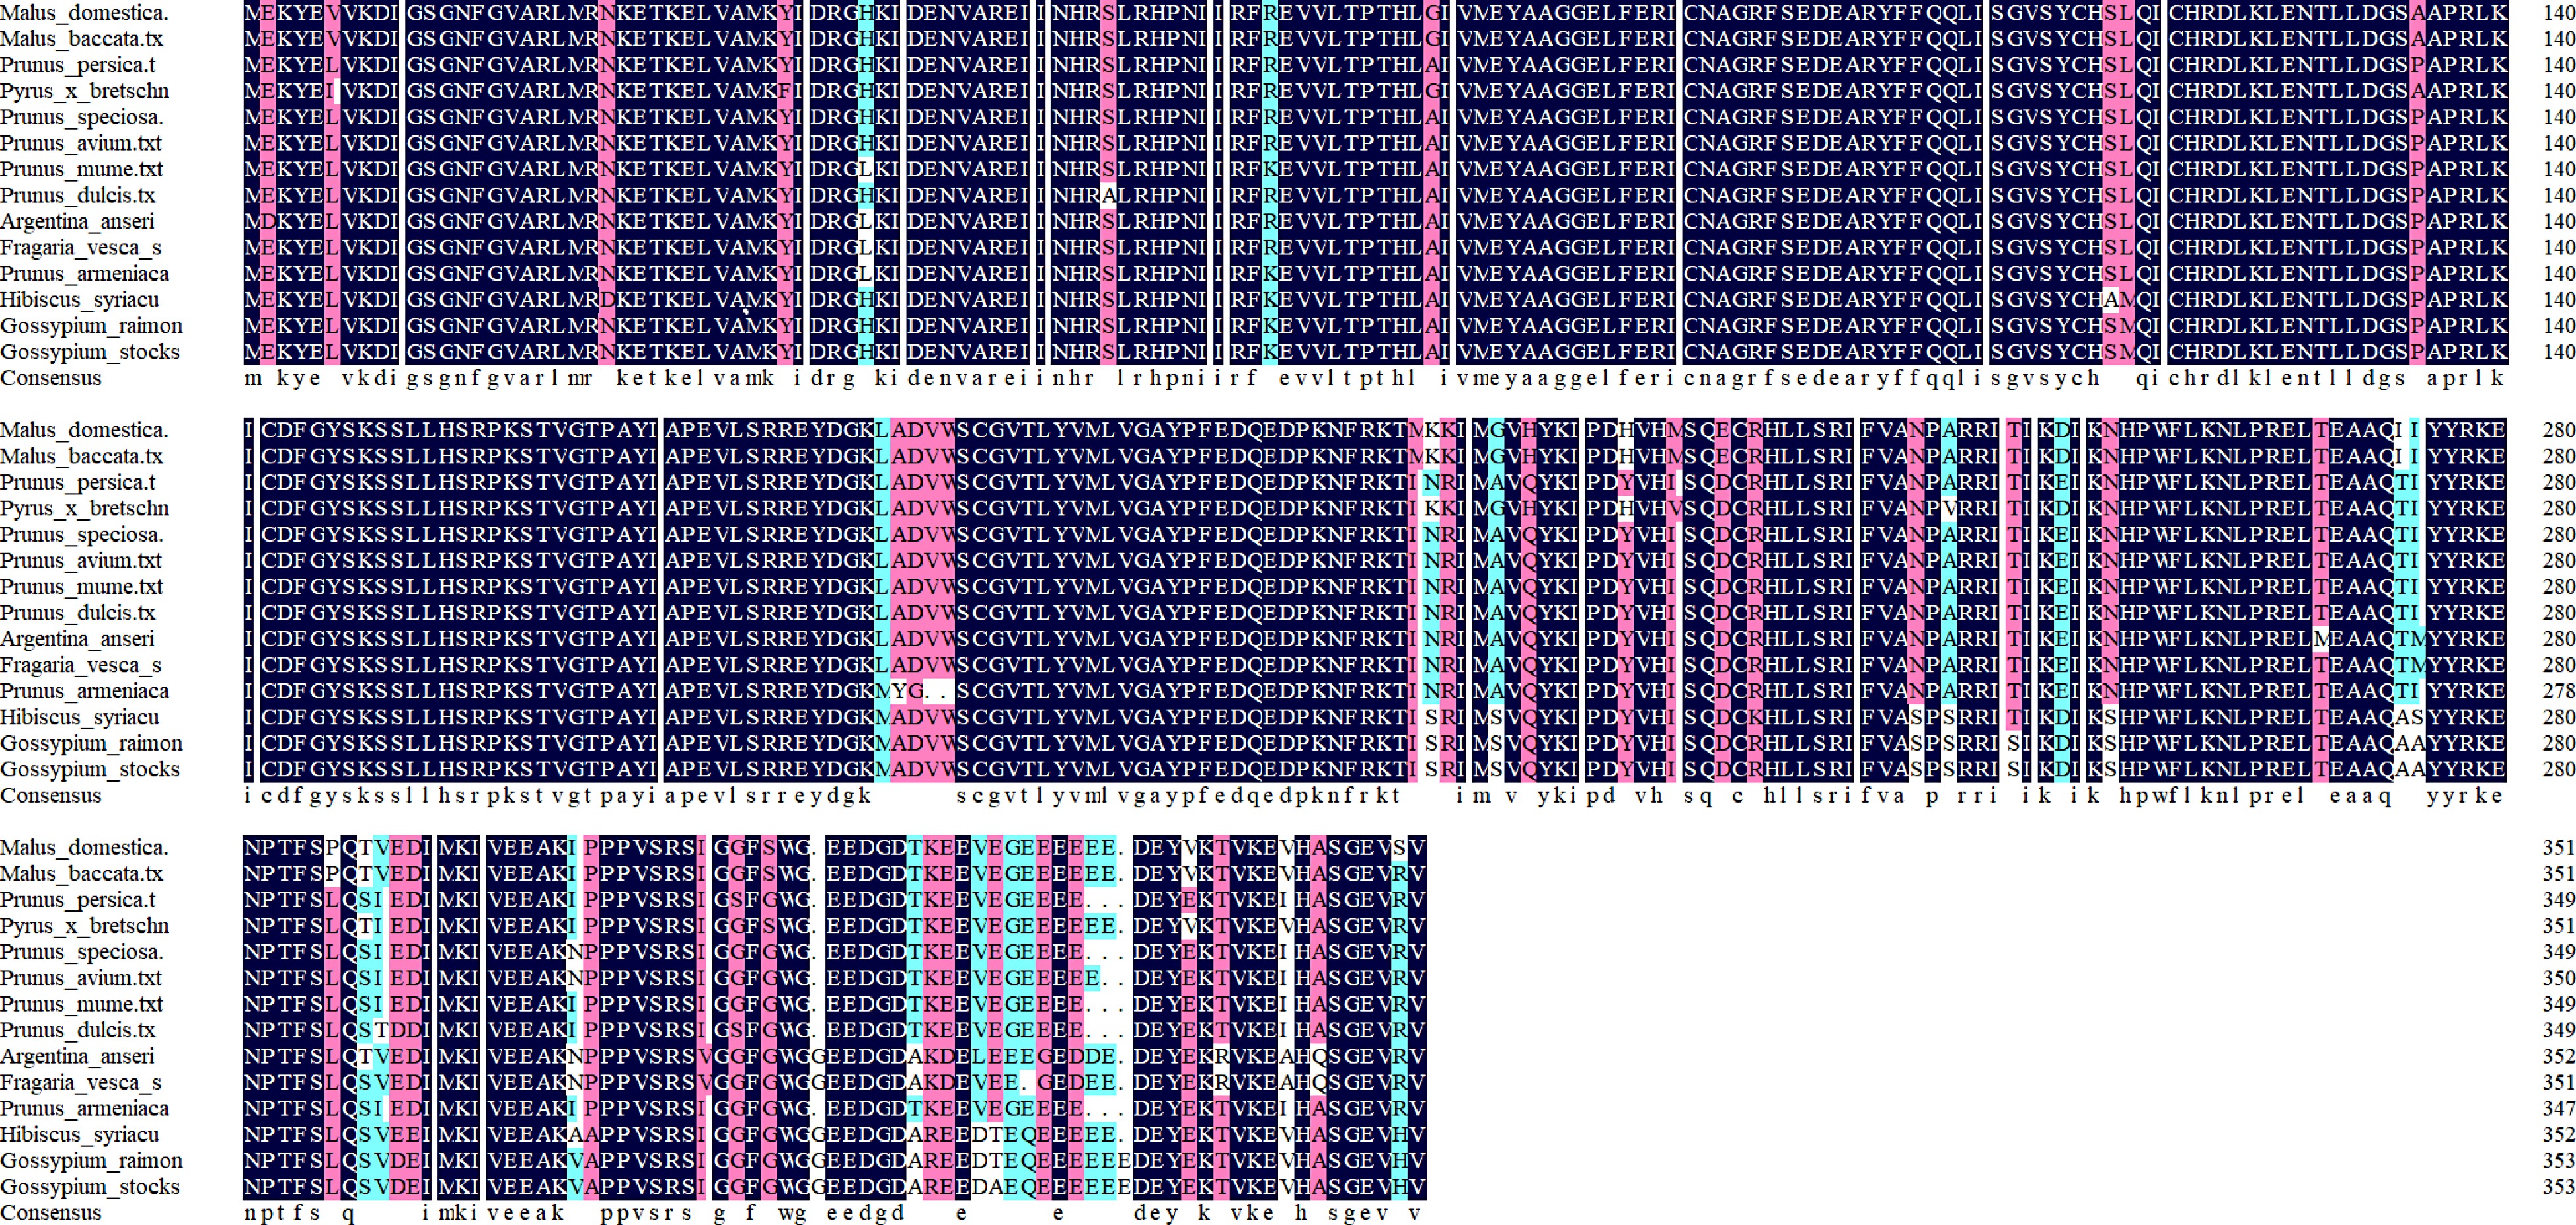
Figure 4.
The protein sequence of the Malus halliana MhSnRK2.4 gene was selected for analysis using DNAMAN, comparing it with protein sequences of other species.
-
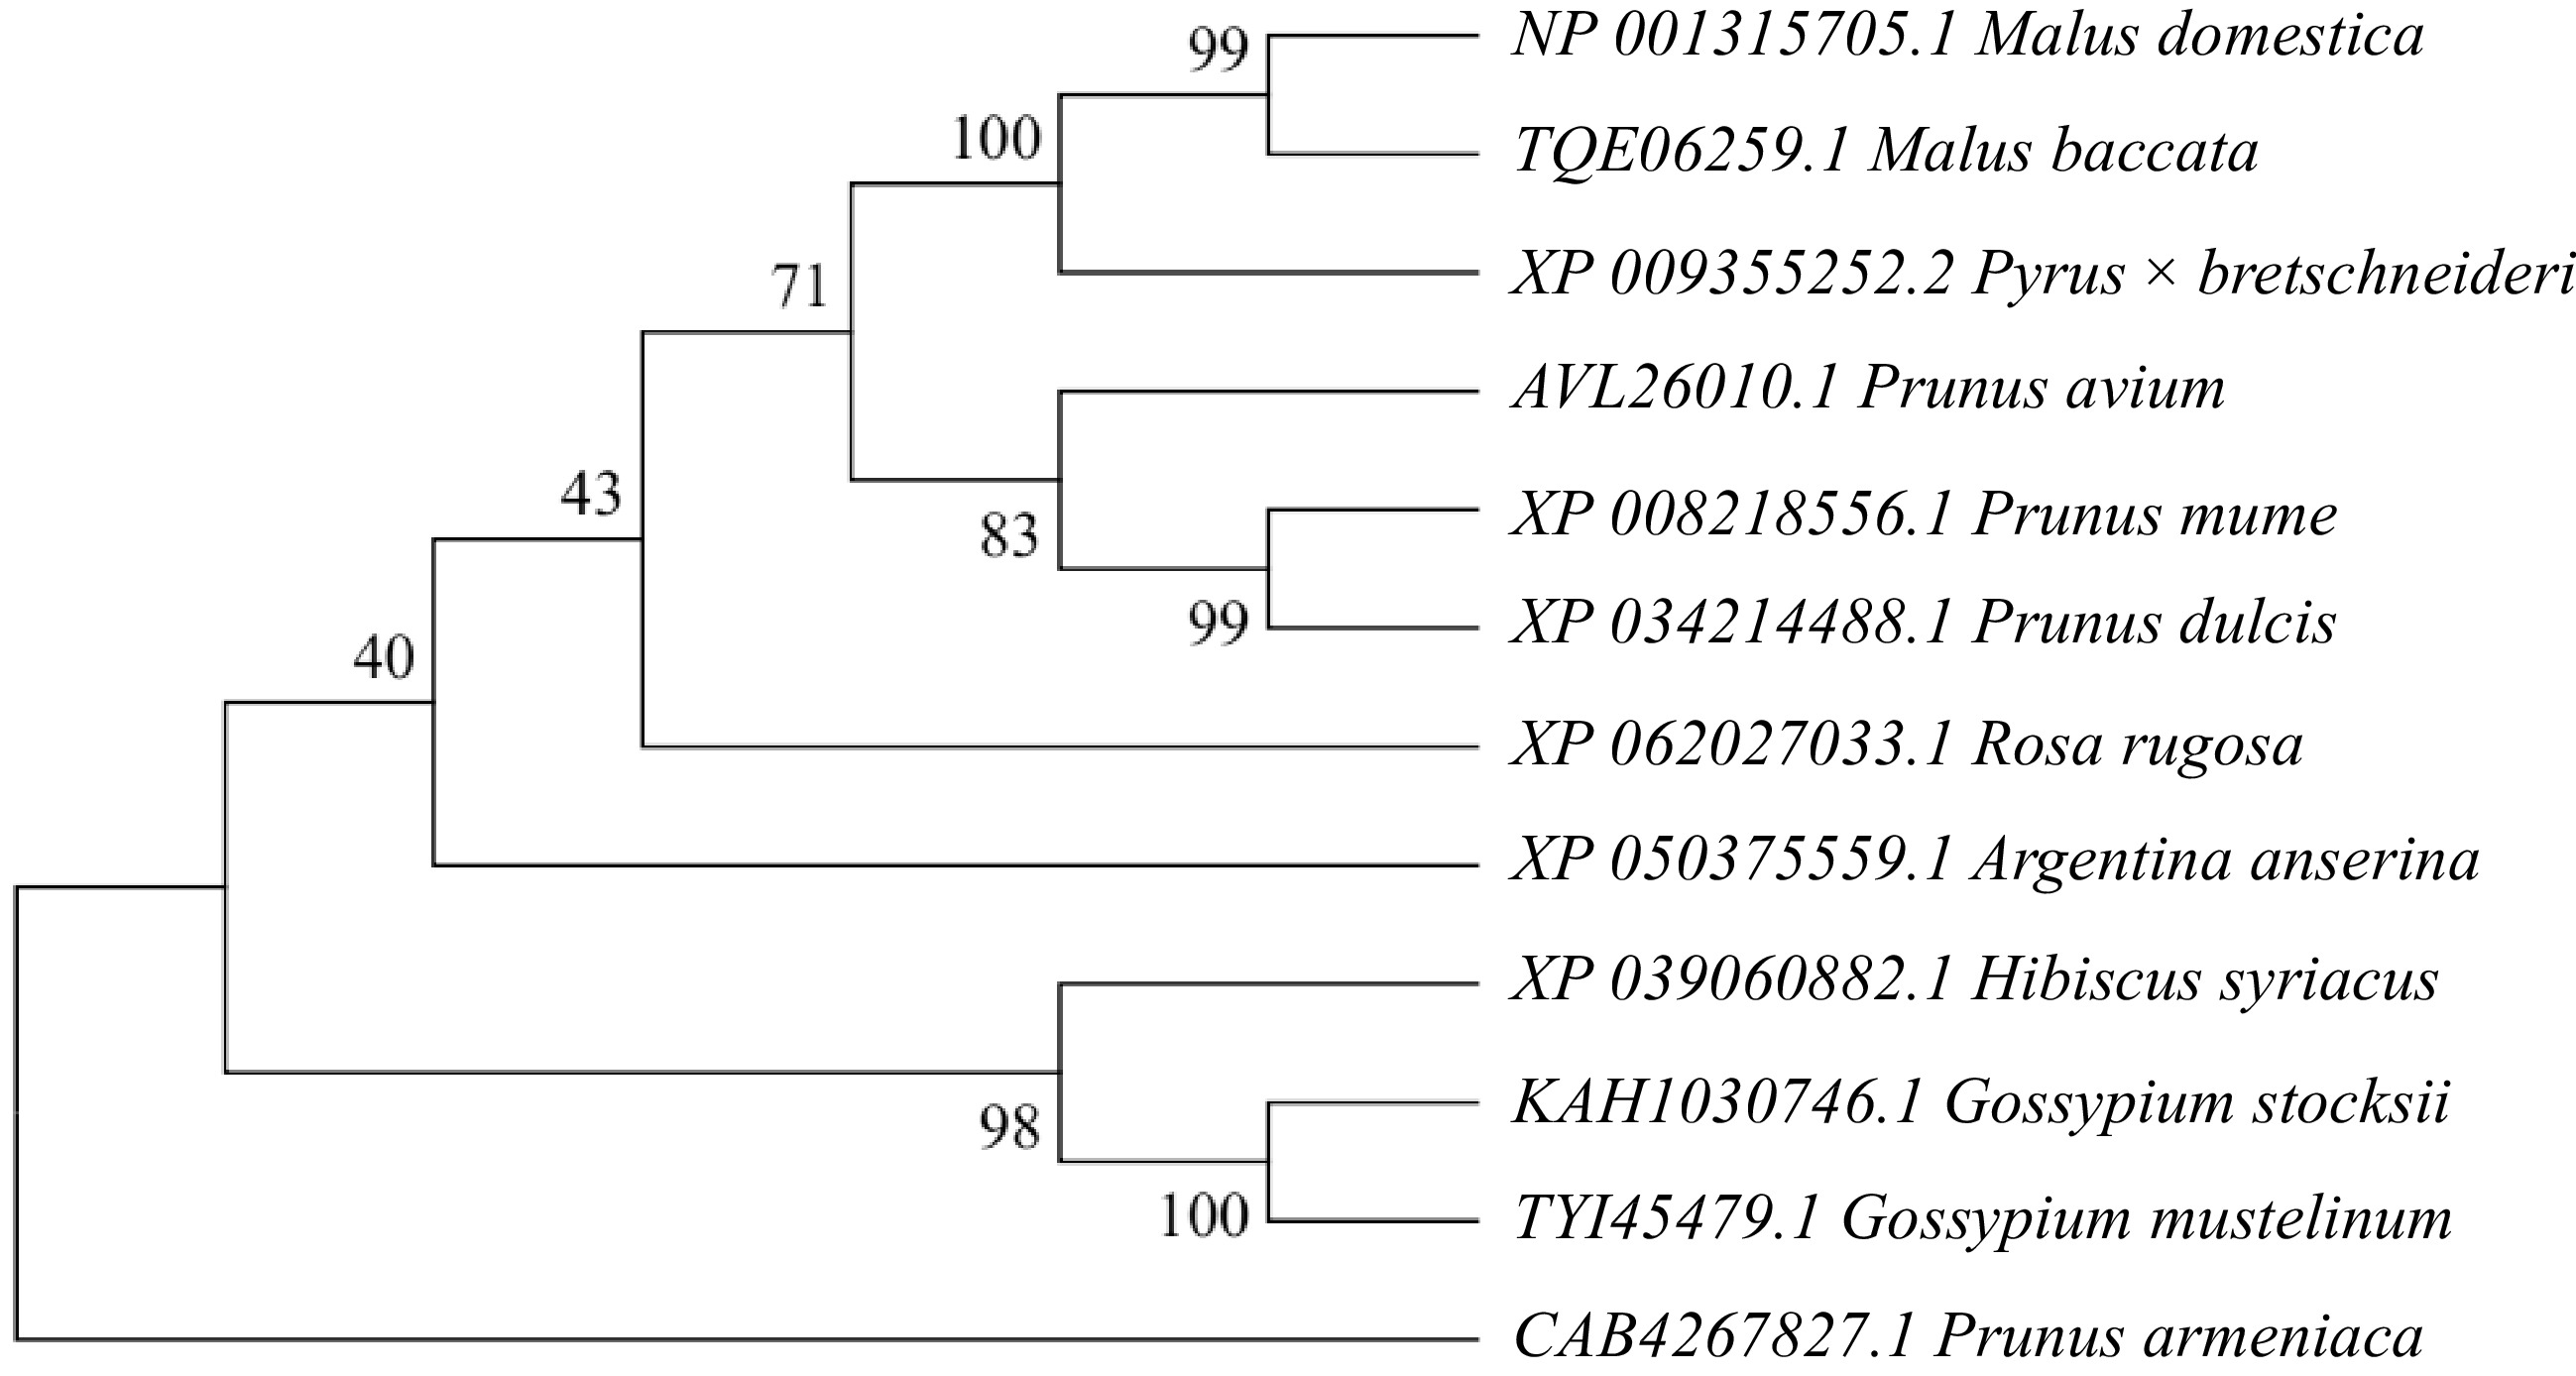
Figure 5.
Phylogenetic analysis of the Malus halliana MhSnRK2.4 gene was conducted in comparison with other species. The numbers at the branches of the evolutionary tree indicate the confidence levels of those branches; the larger the value, the higher the reliability.
-

Figure 6.
Expression level of MhSnRK2.4. (a) Expression level of MhSnRK2.4 in Arabidopsis thaliana. (b) Expression level of MhSnRK2.4 in apple calli. (c) Expression level of MhSnRK2.4-Anti in apple calli. Resistance of transgenic MhSnRK2.4 Arabidopsis thaliana and apple calli to Fe-deficiency stress. Error bars denote the SD of three replicates. Different letters above the bars indicate significant differences (p < 0.05) as assessed by one-way ANOVA and the least significant difference (LSD) test.
-
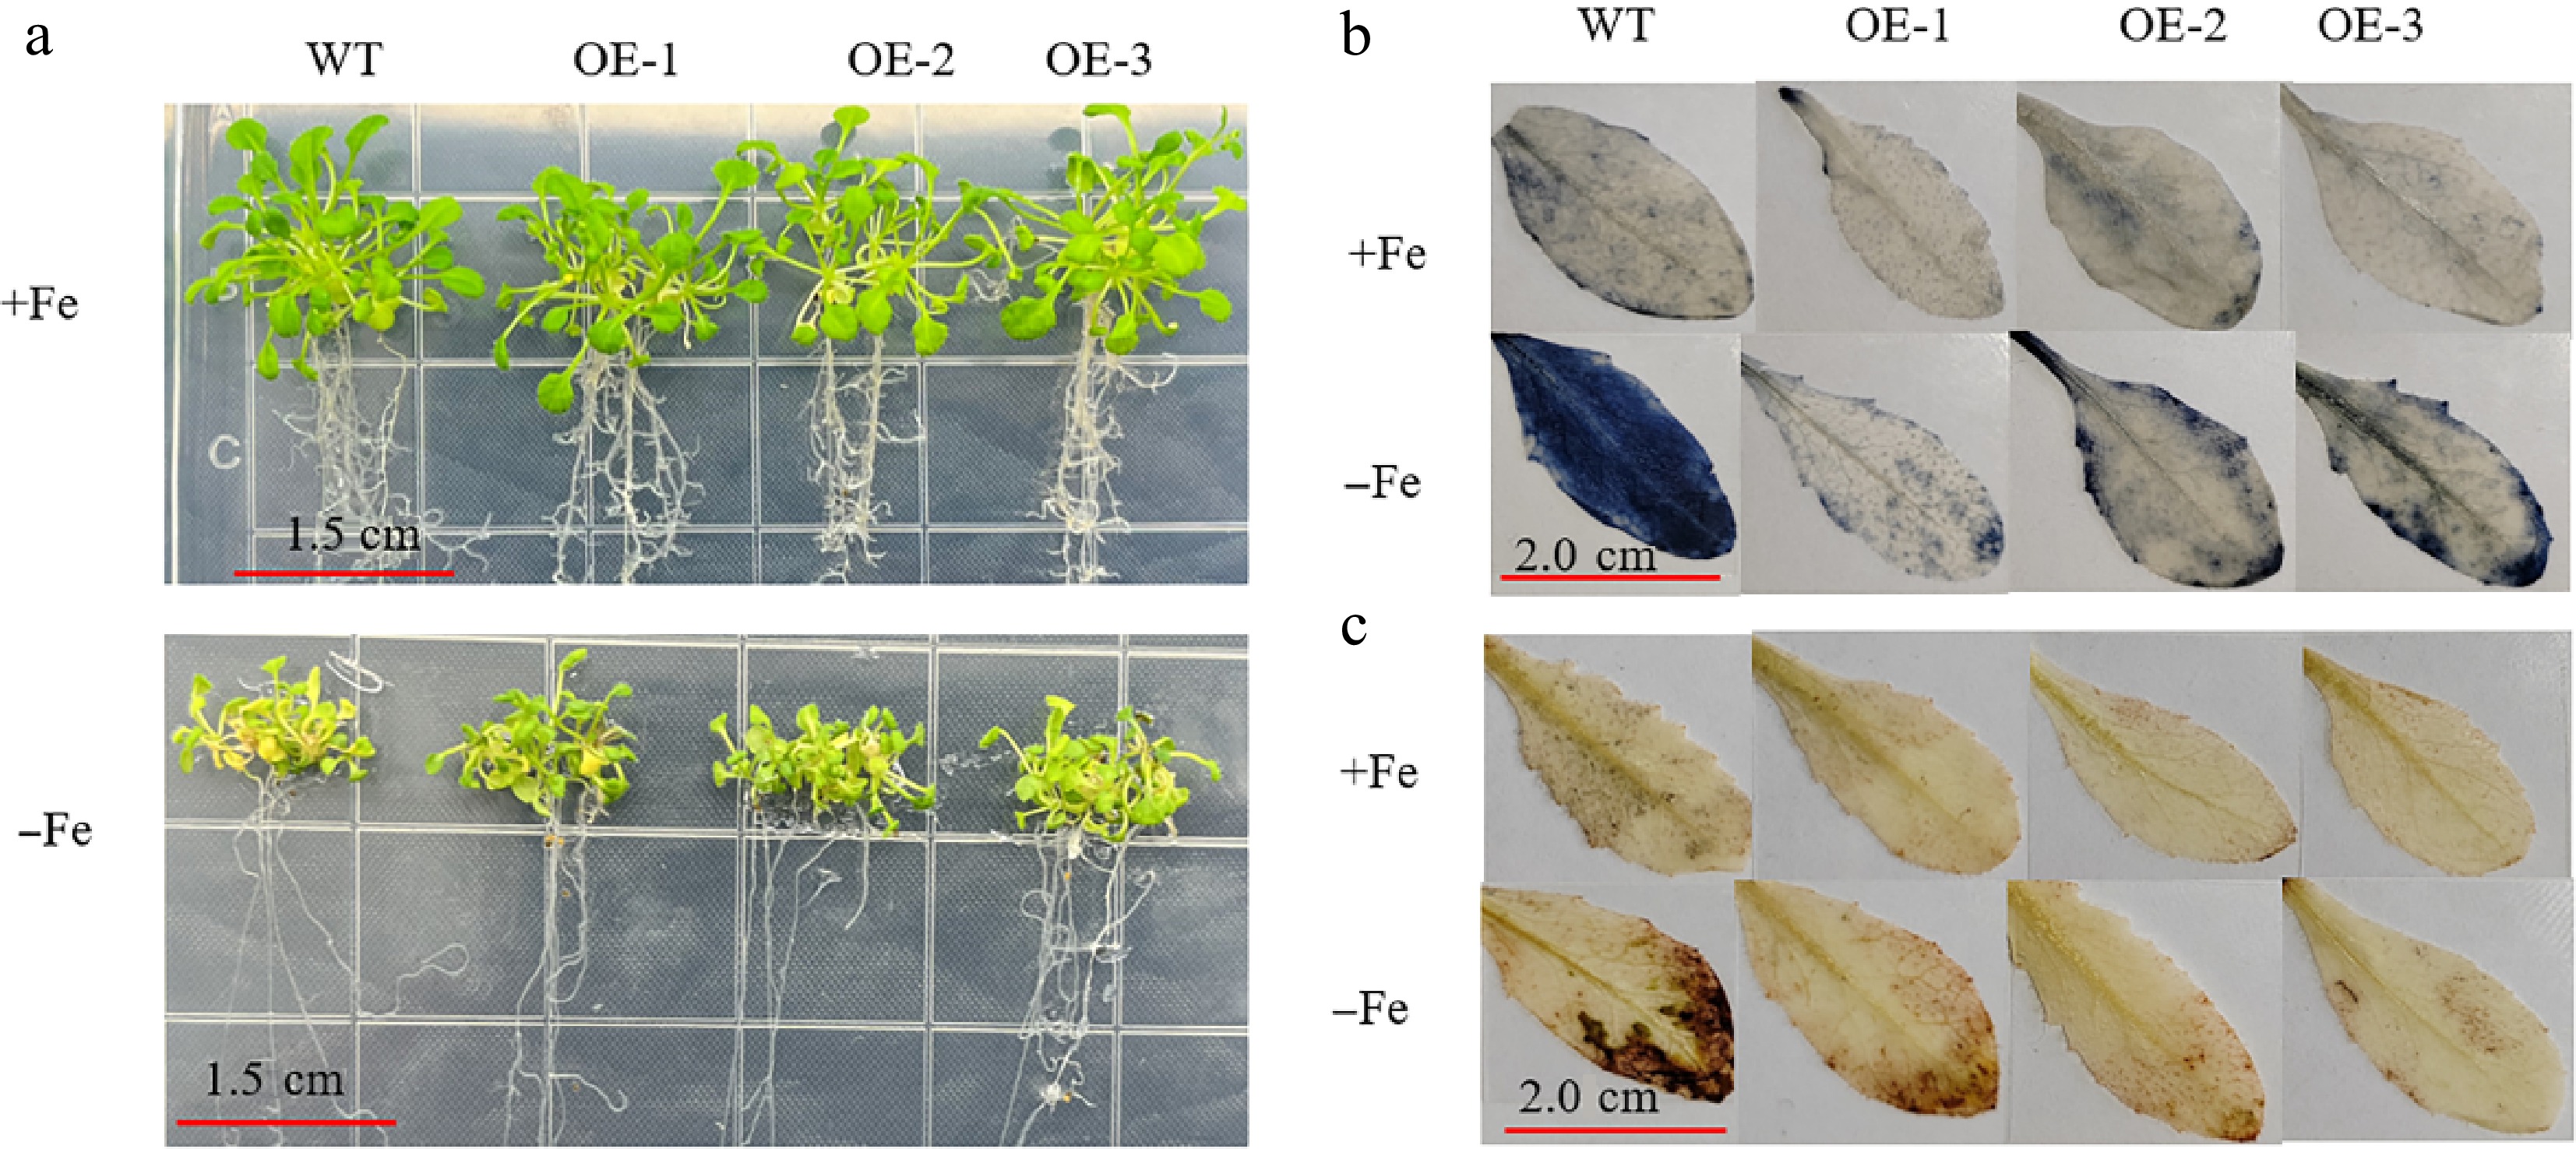
Figure 7.
The accumulation of reactive oxygen species (ROS) and the resulting phenotypes in MhSnRK2.4 transgenic and wild-type (WT) Arabidopsis thaliana were assessed after 20 d of growth under both Fe-sufficient (+Fe) and Fe-deficient (−Fe) conditions. (a) Phenotypes. (b) NBT staining. (c) DAB staining.
-
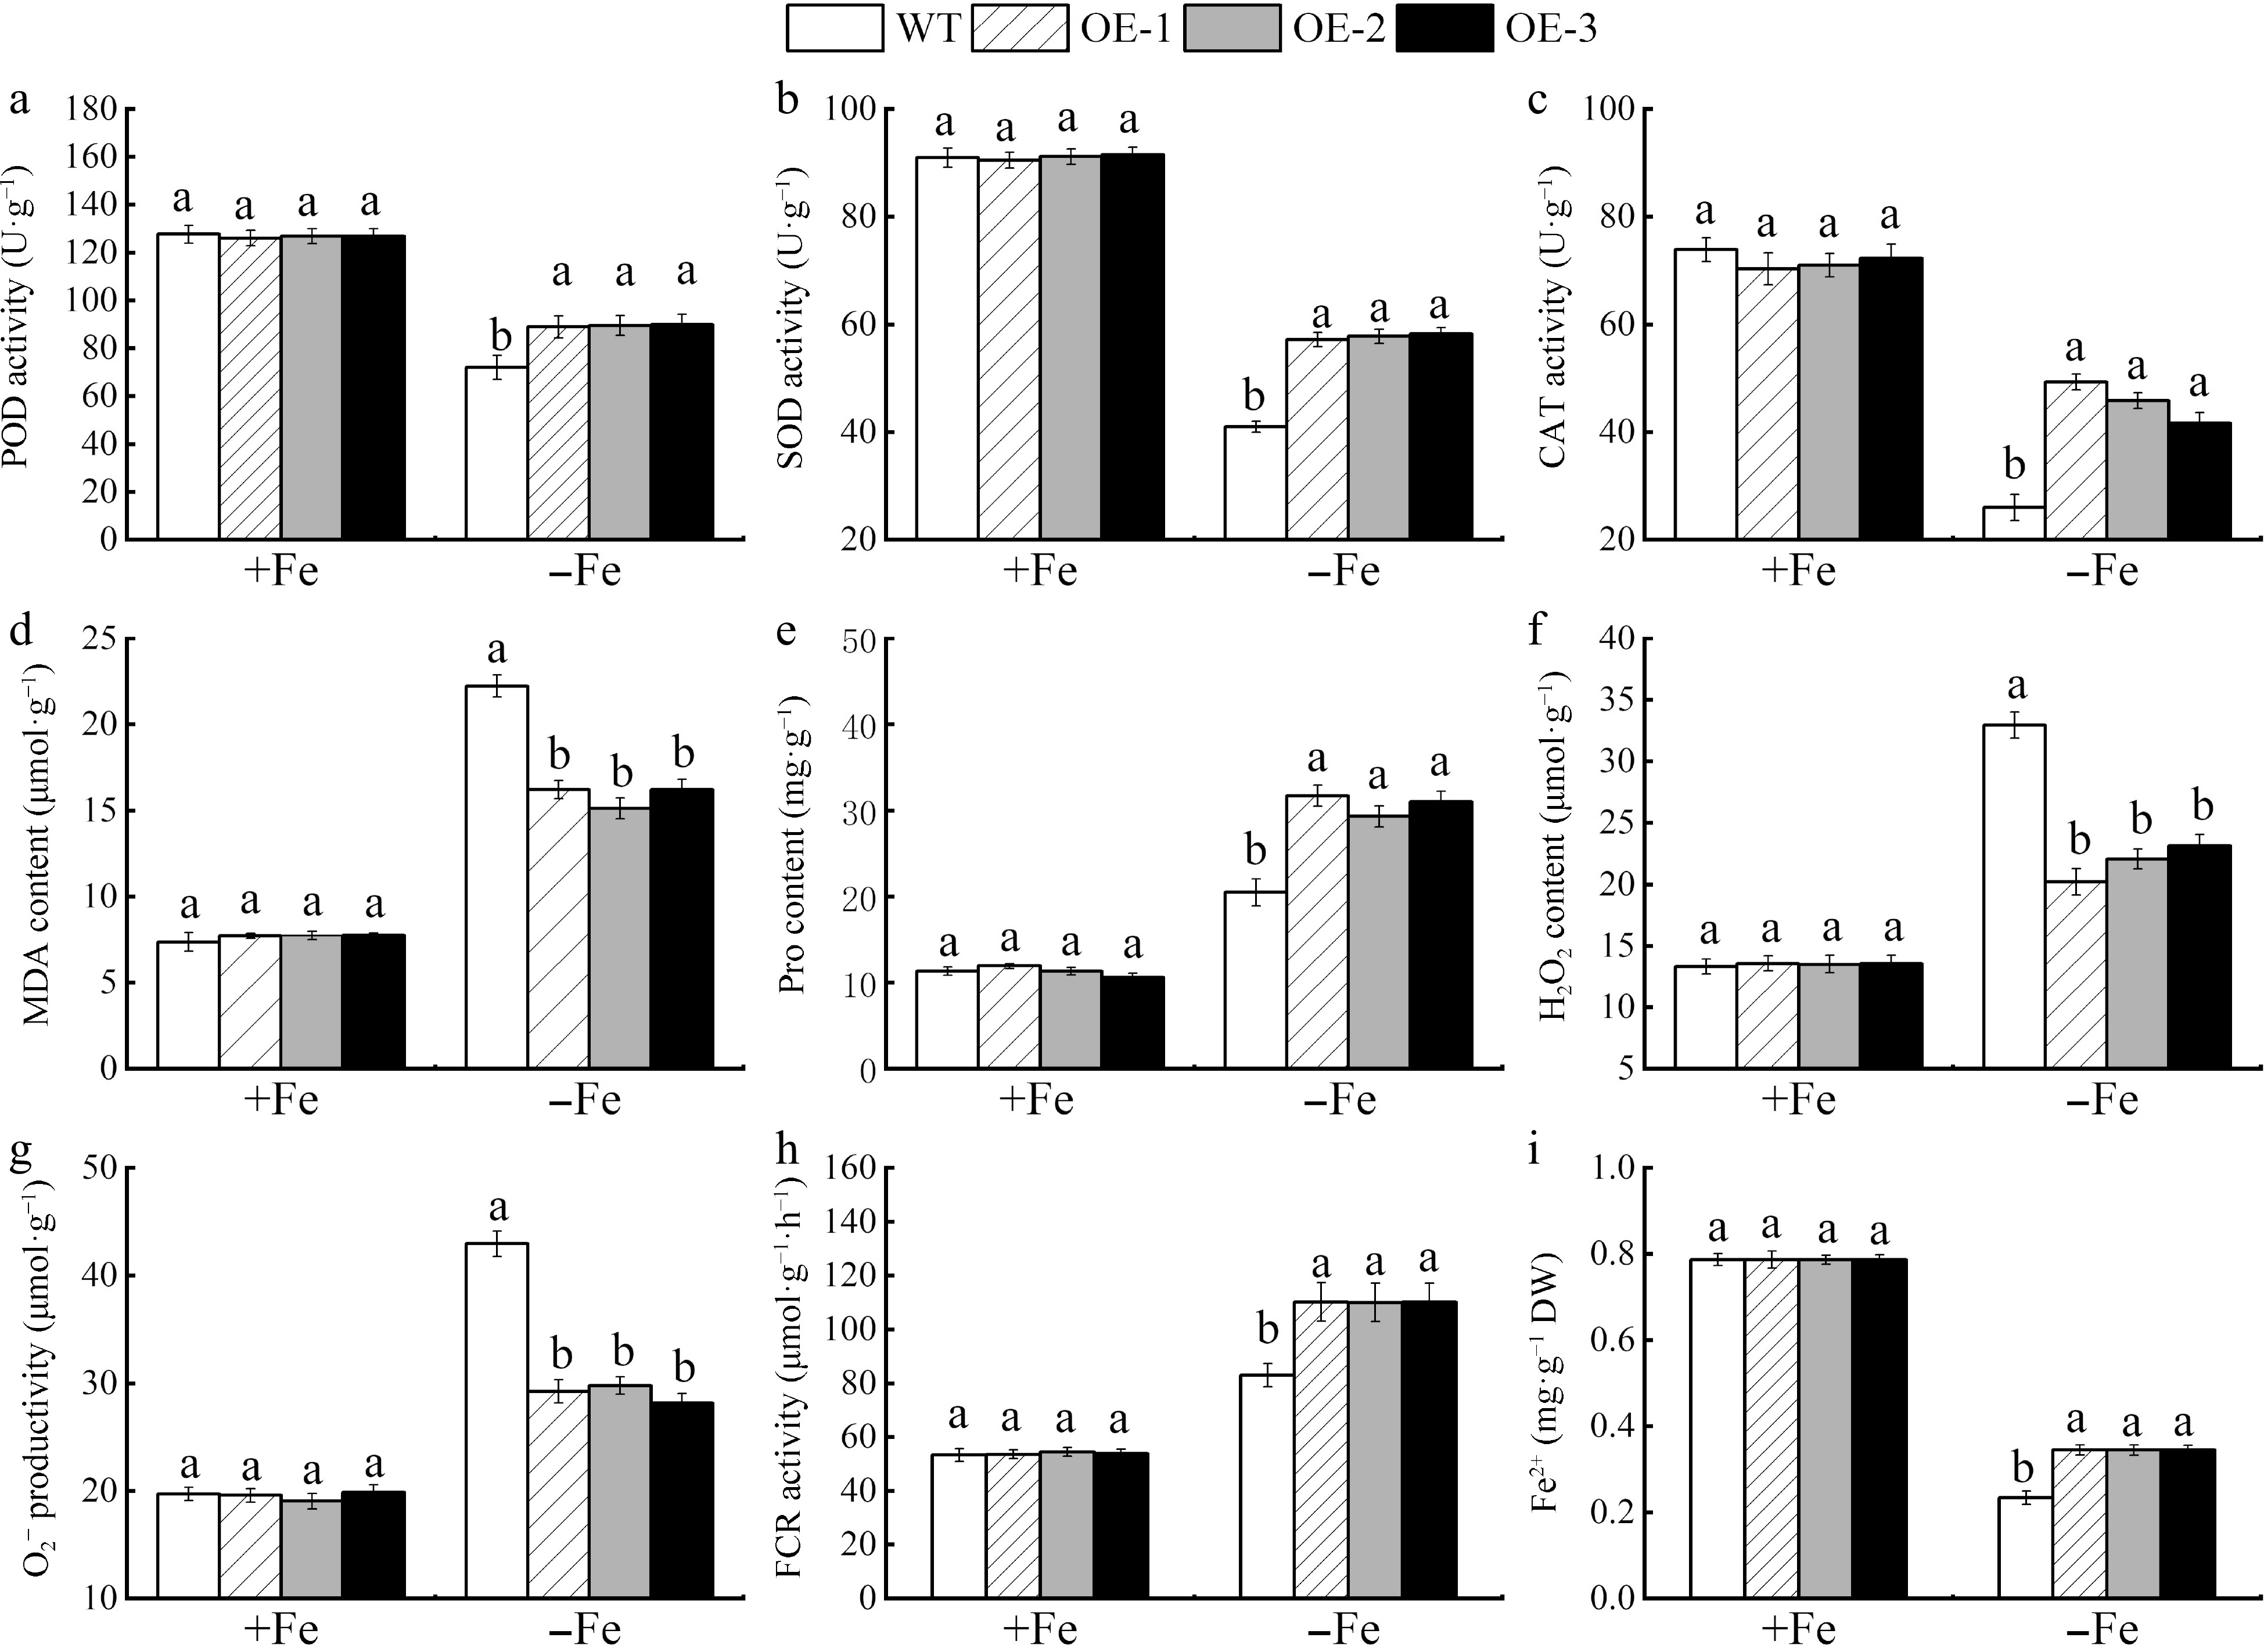
Figure 8.
The photosynthetic pigment content and enzyme activities were measured in MhSnRK2.4 transgenic and wild-type Arabidopsis thaliana plants that were grown for 20 d under either Fe-sufficient (+Fe) and Fe-deficient (−Fe) conditions. (a) POD activity. (b) SOD activity. (c) CAT activity. (d) MDA content. (e) Pro content. (f) H2O2. (g) O2−. (h) FCR activity. (i) Fe2+ activity. Different letters above the bars indicate significant differences (p < 0.05) as assessed by one-way ANOVA and the LSD test (p < 0.05).
-
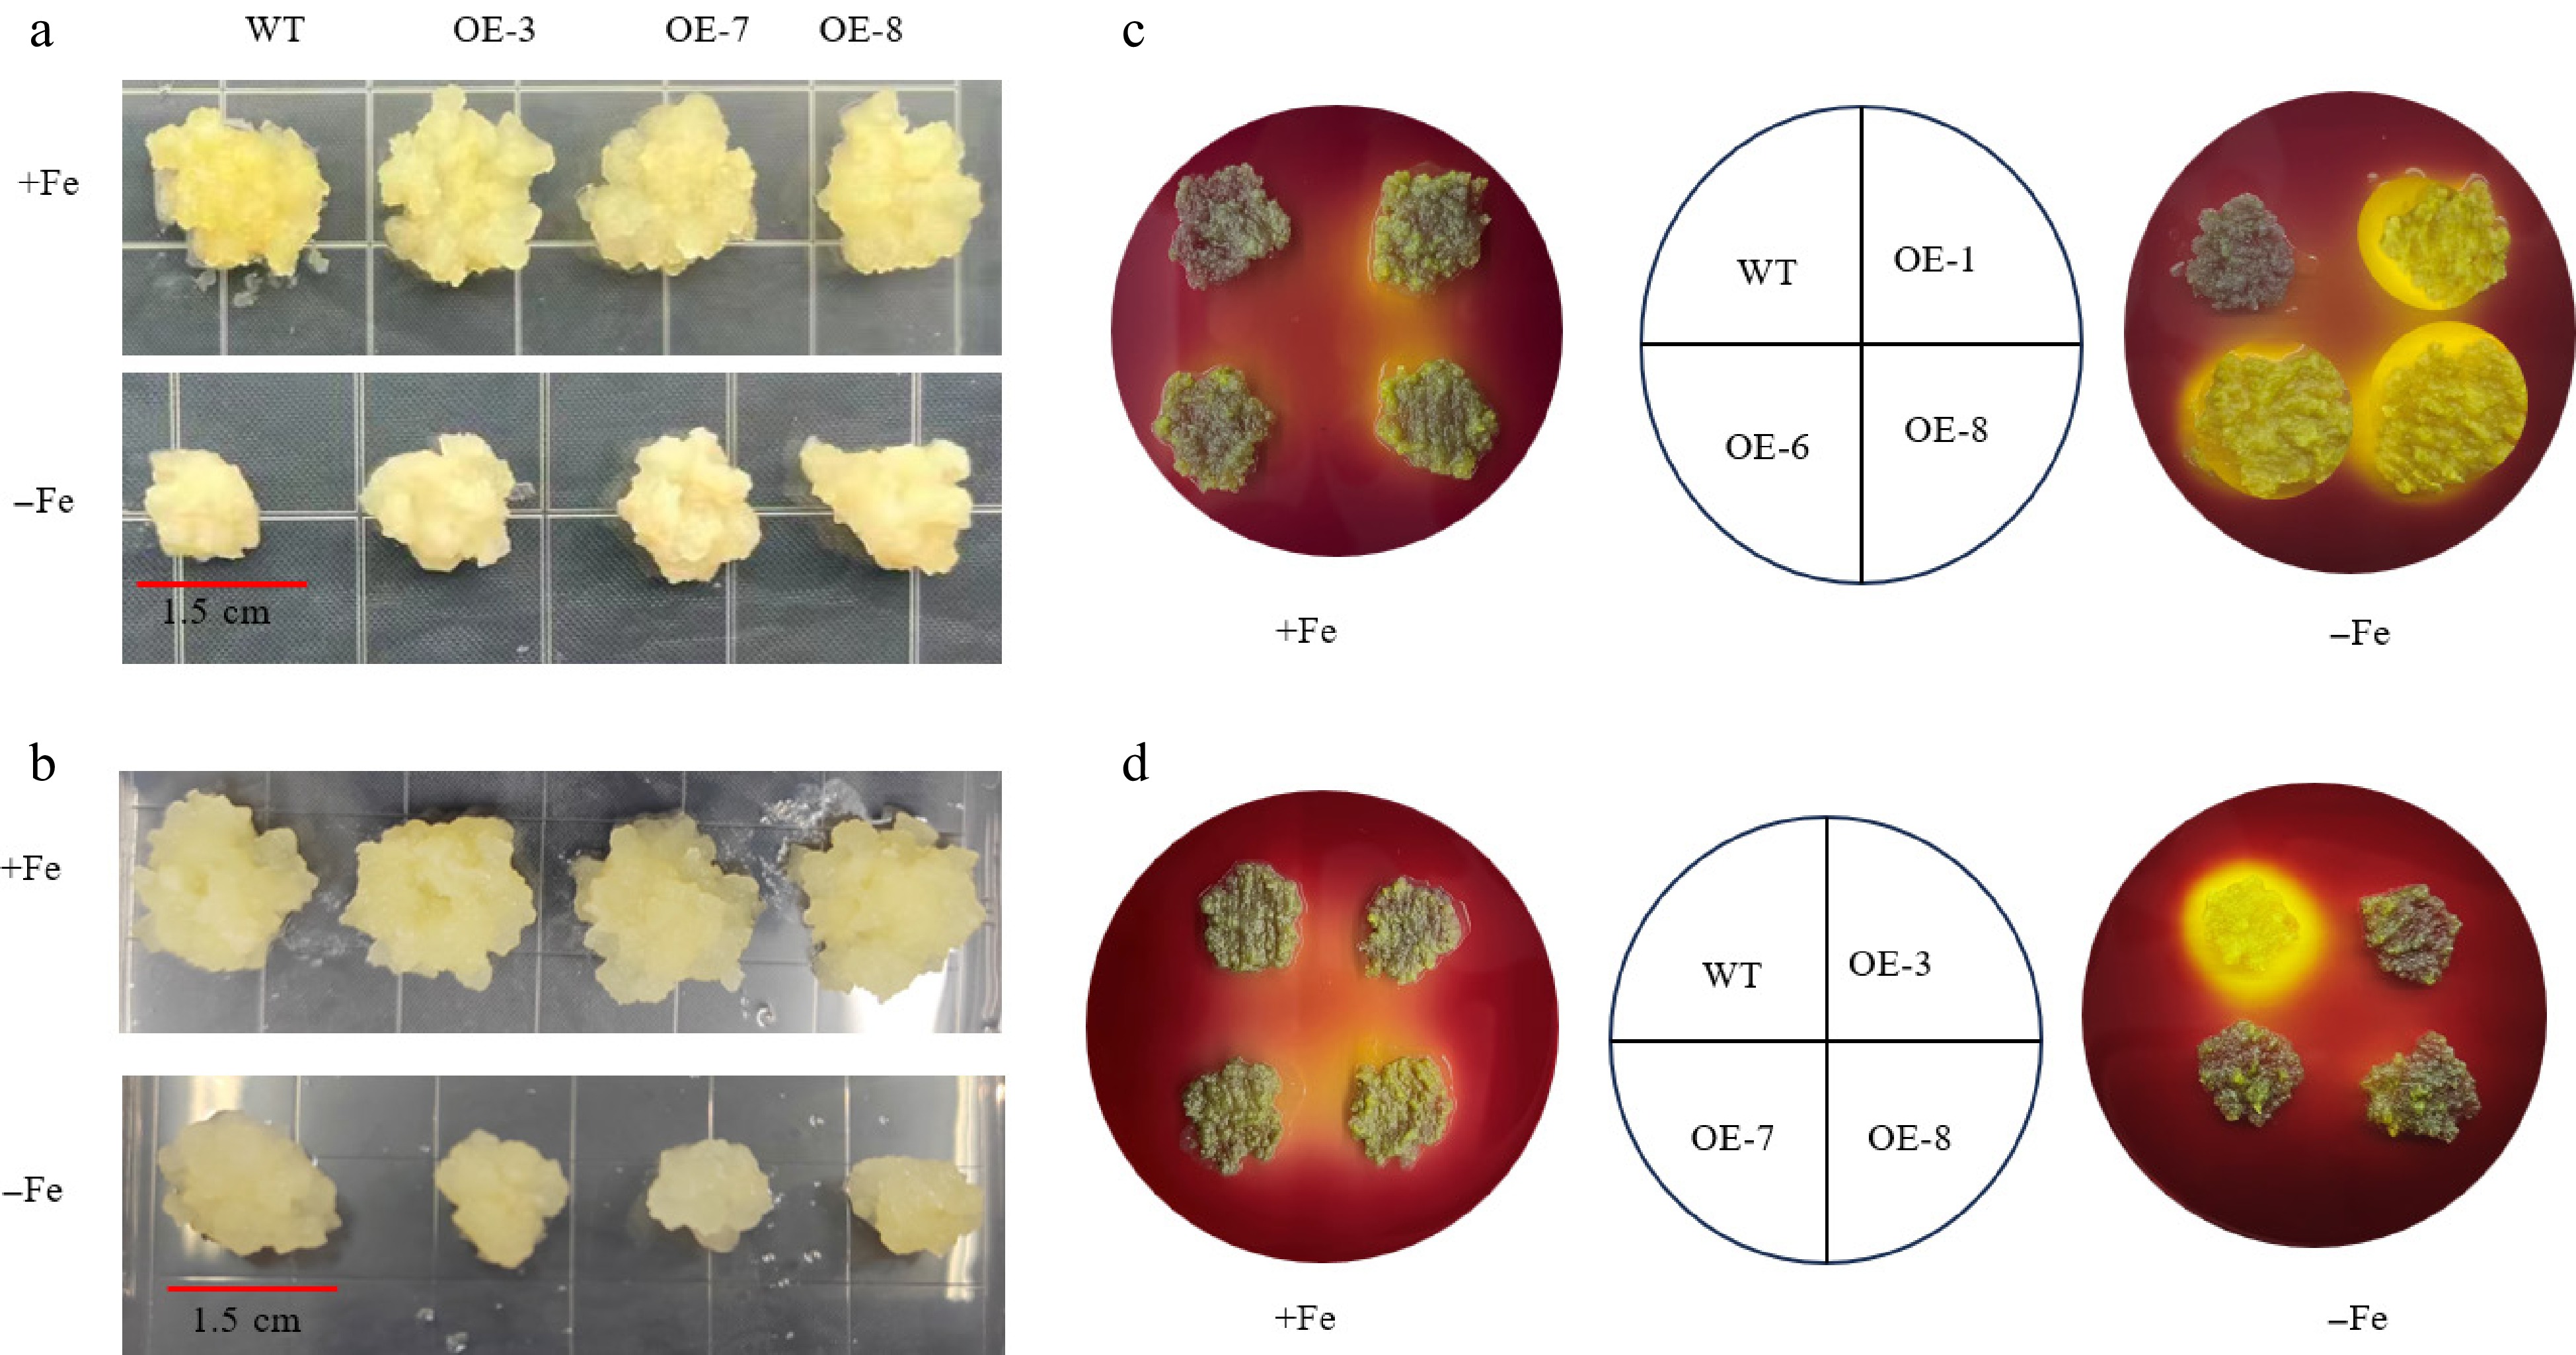
Figure 9.
The phenotypes of apple calli overexpressing MhSnRK2.4 and MhSnRK2.4-Anti and the wild-type (WT) control, cultivated on Fe-sufficient or Fe-deficient media for 15 d, were evaluated through acidification analysis using a medium containing the pH indicator dye bromocresol violet. (a) MhSnRK2.4 lines. (b) MhSnRK2.4-Anti lines. (c) MhSnRK2.4 apple calli. (d) MhSnRK2.4-Anti apple calli.
-
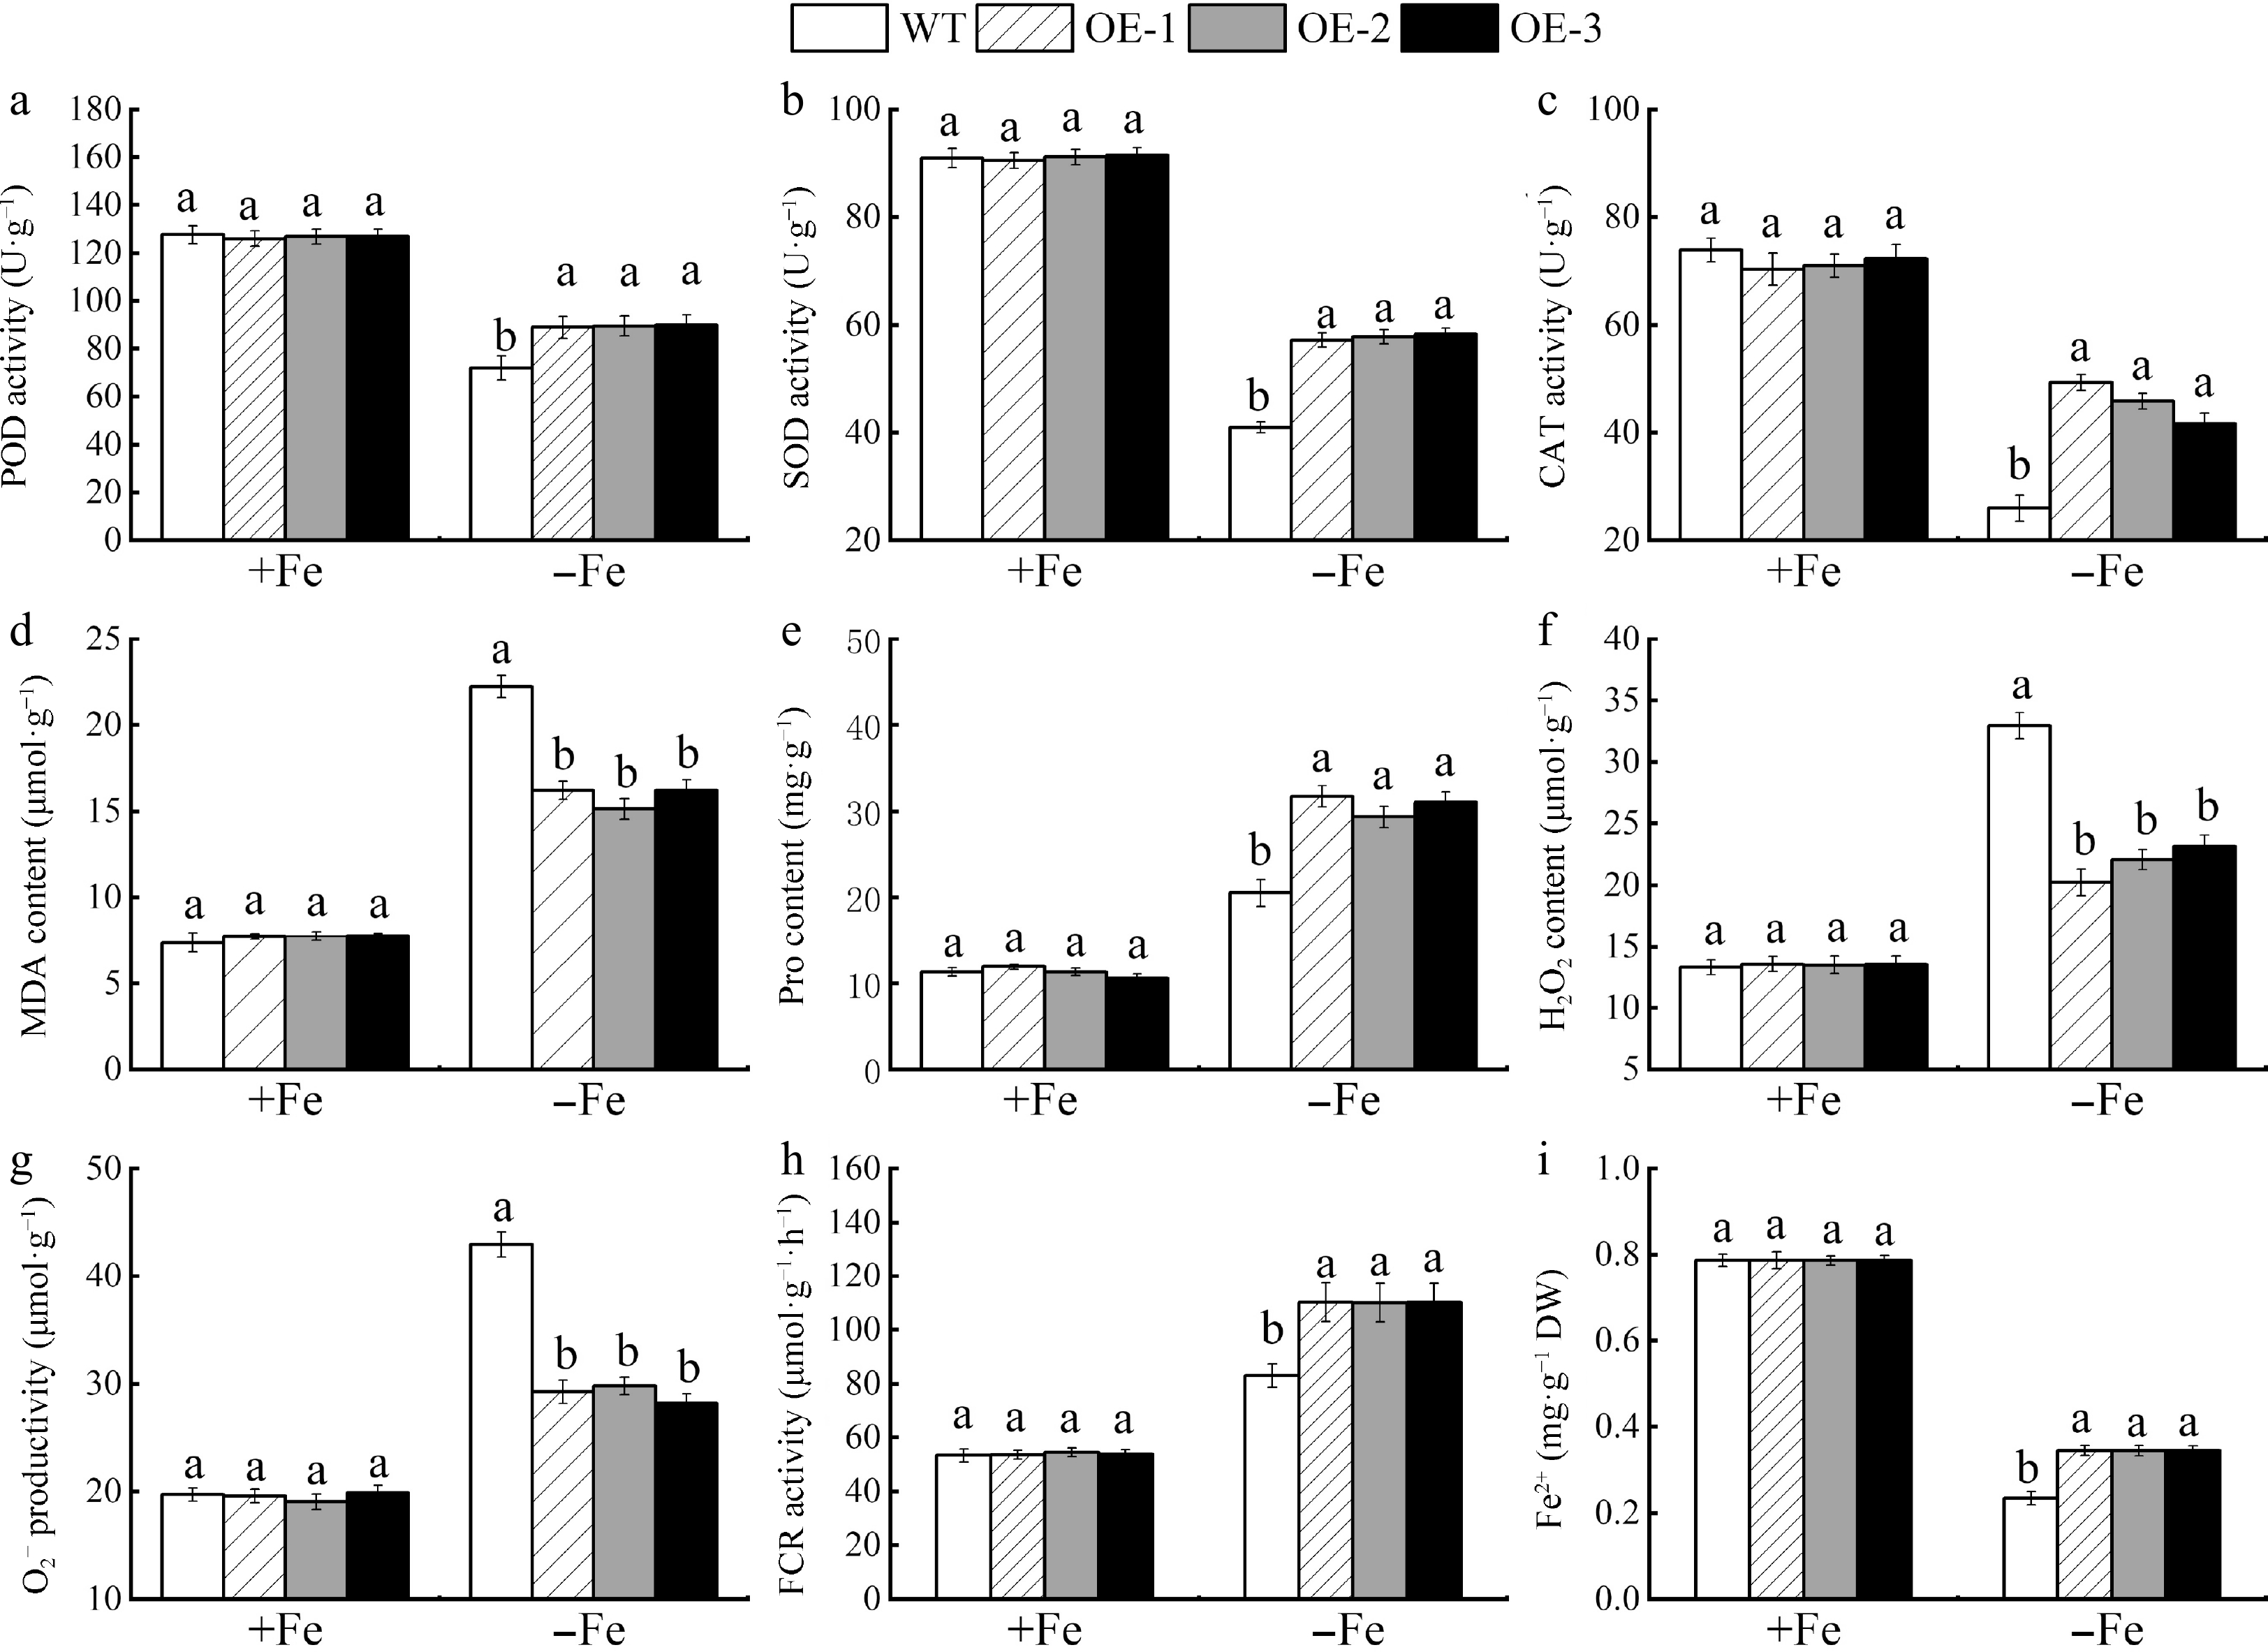
Figure 10.
In apple calli, the activities of antioxidant enzymes, the Fe-reducing capacity, and growth factors were assessed between MhSnRK2.4 overexpressing and wild-type (WT) samples under both Fe-sufficient and Fe-deficient condition. (a) POD. (b) SOD. (c) CAT. (d) MDA content. (e) Pro content. (f) H2O2 content. (g) O2−. (h) FCR. (i) Fe2+ content. Different letters above the bars indicate significant differences (p < 0.05) as assessed by one-way ANOVA and the LSD test (p < 0.05).
-
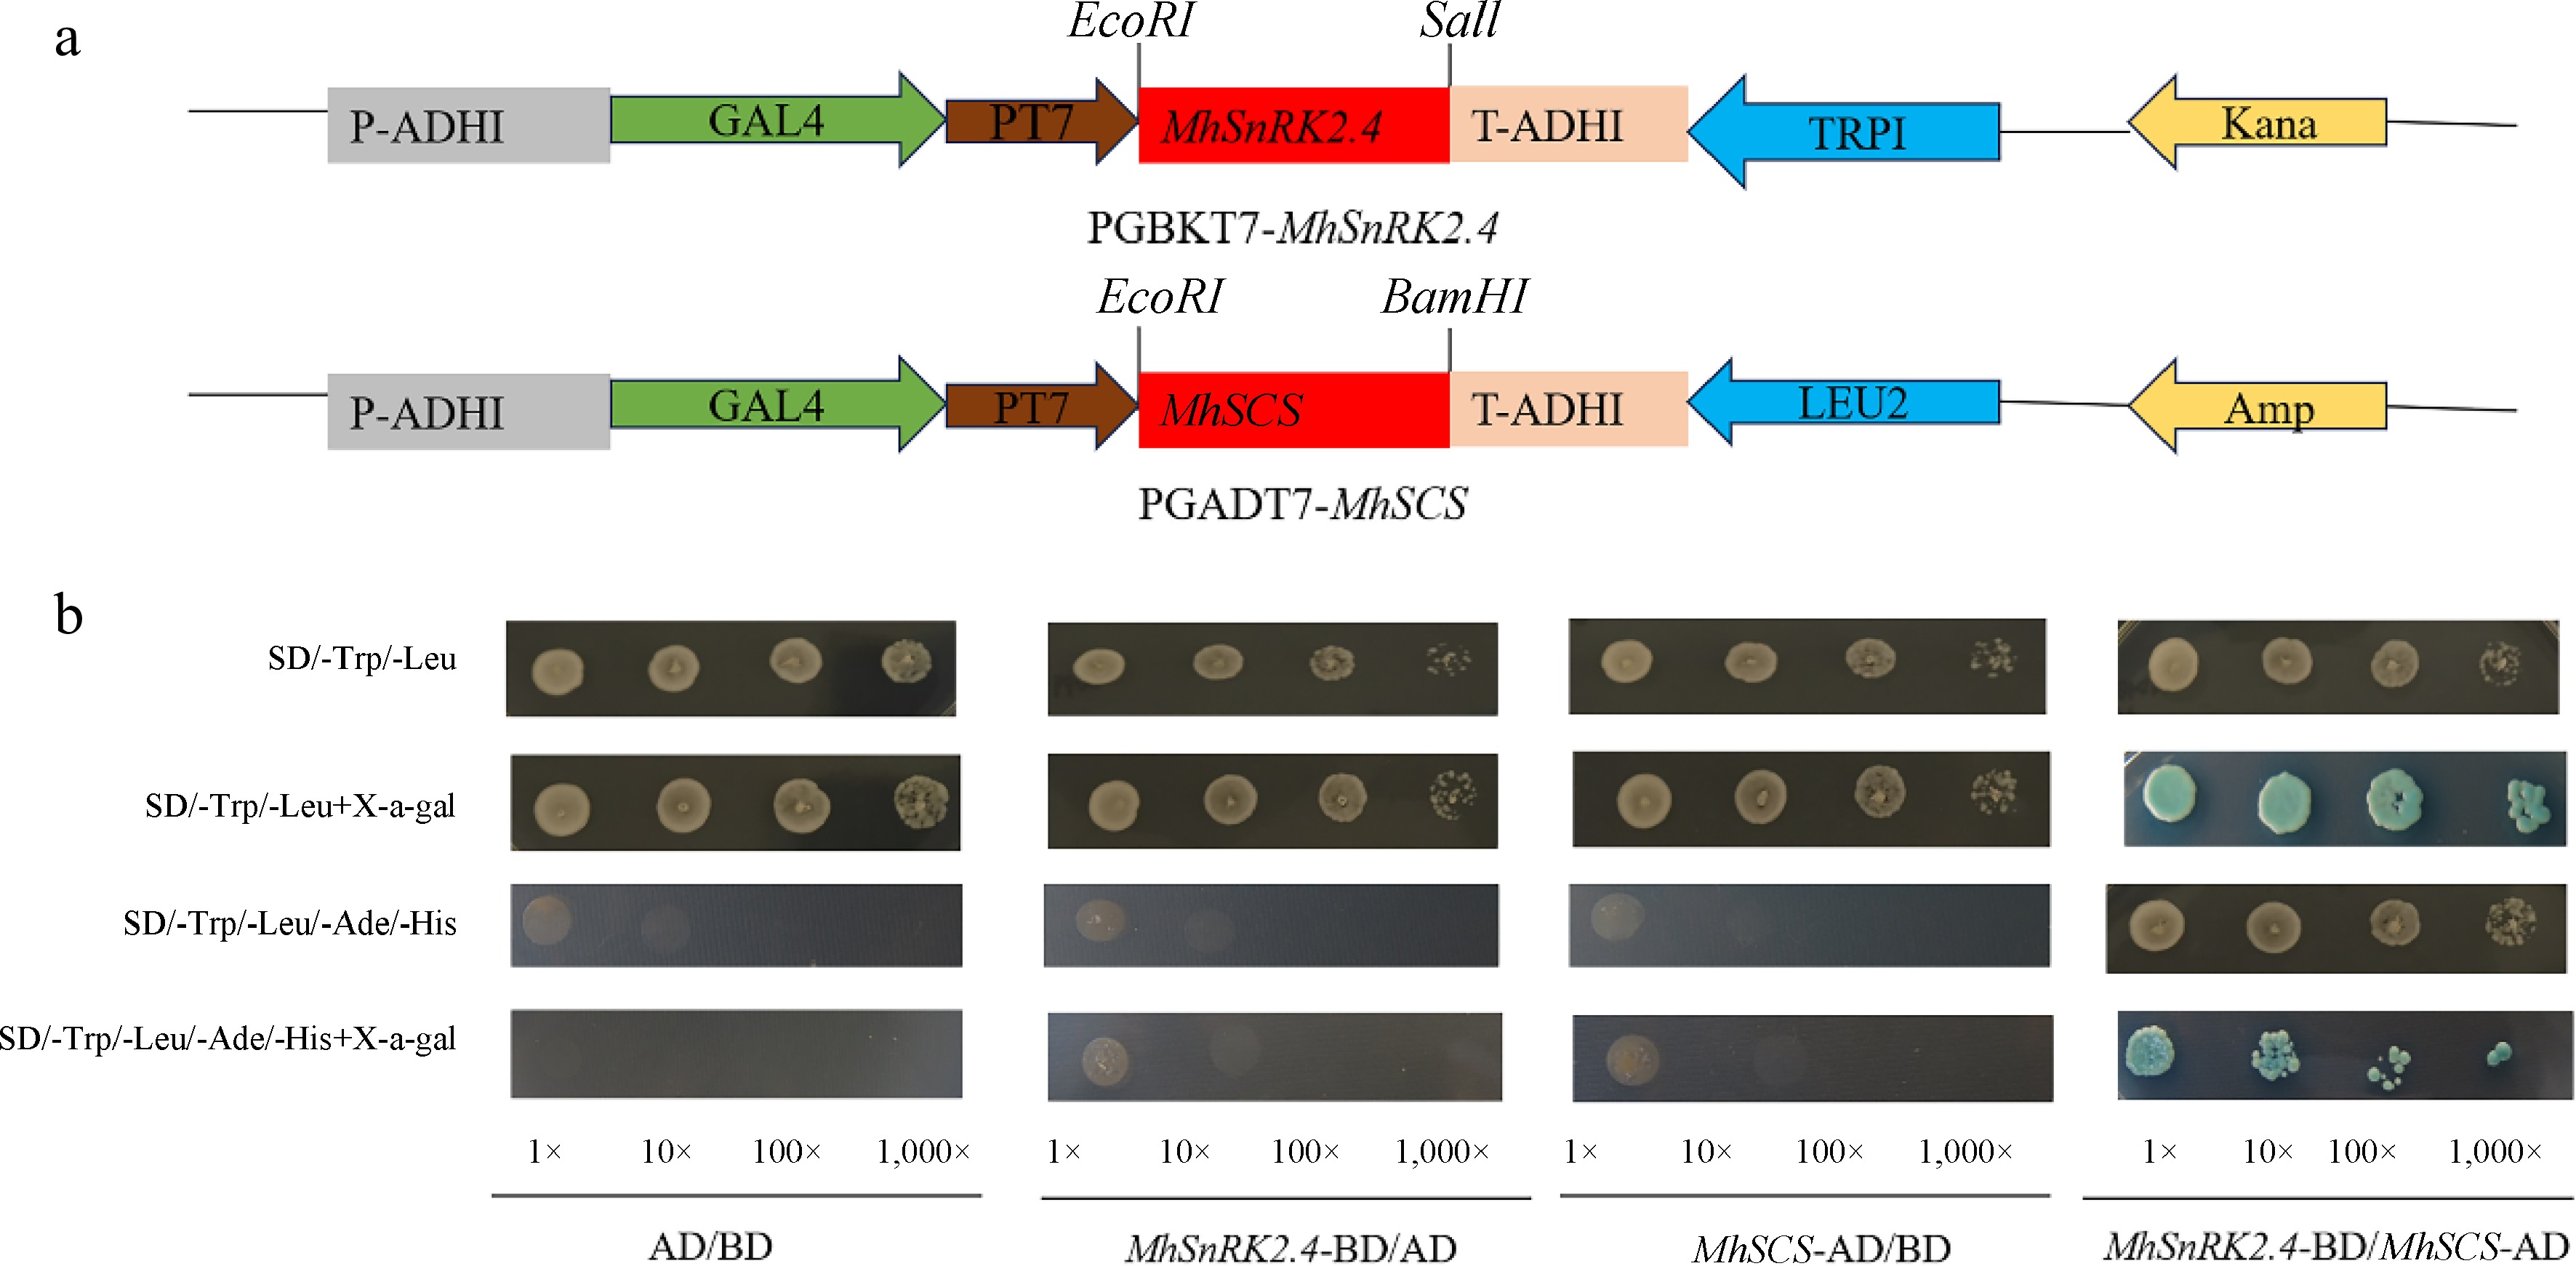
Figure 11.
Yeast two-hybrid assay showing the specific interaction of MhSnRK2.4 with MhSCS. (a) Model diagram of pGBKT7-MhSnRK2.4-BD vector construct, model diagram of pGADT7-MhSCS AD vector construct. (b) Yeast two-hybrid analysis of MhSnRK2.4 protein.
-
Gene
namePrimer sequence (5'-3') Forward primer Reverse primer MhSnRK2.1 GAGAACAAACTATGCGTCAGT
GGAGTGGTGTCCTTGCCTCGTGTATG MhSnRK2.2 GCAACCAGTTTGAAGAGCCAGATC CATGTACGAGCCCAGACCAAGG MhSnRK2.3 TGACGGACAAGCAGACCAAAGAG GATGTTCGGGTGCCTCAGAGAC MhSnRK2.4 ACCACAGATCGCTTCGCCATC CCACCAGCCGCATACTCCATC MhSnRK2.5 AGCGTGACCAGCCTAAACAGAG ACGGCTTGACCTCCTGCTTTG MhSnRK2.6 GCCTCGTCCTCGCTGAATCG CTCCGCTGCTGTCAATGTCAATG MhSnRK2.7 AACCACAGGTCCTTGAAGCATCC GCCTCGTCCTCGCTGAATCG MhSnRK2.8 ACCCCGAAAAGAGAATAACCA
TCCCACTGCCAACTTCCTCCTTCCATC MhSnRK2.9 ATCGCTTCGCCACCCAAACATC CCACCAGCCGCATACTCCATAAC Table 1.
Using the NCBI database, the CDS sequences associated with the gene family were found, and real-time quantitative PCR was performed to analyze the primer list.
-
Gene Amino acids Molecular weight (KD) Theoretical pI Positive residues Negative residues Aliphatic index Instability index Grand average of hydropathicity MhSnRK2.4 352 40.33 6.15 49 55 81.93 44.47 −0.487 Table 2.
The protein sequence of MhSnRK2.4 was extracted, and the physicochemical properties of MhSnRK2.4 were analyzed using Expasy software.
-
cis-Acting element Sequence Start sites (bp) End sites (bp) Function TGA-element AACGAC +68 +74 Auxin-responsive element LTR CCGAAA +1,403 +1,409 cis-Acting element involved in low-temperature responsiveness ABRE ACGTG −301 −306 cis-Acting element involved in the abscisic acid responsiveness A-box CCGTCC +1,458 +1,464 cis-Acting regulatory element G-box CACGTC +301 +307 cis-Acting regulatory element involved in light responsiveness O2-site GATGA +334 +342.5 cis-Acting regulatory element involved in zein metabolism regulation P-box CCTTTTG +1,572 +1,579 Gibberellin-responsive element GT1-motif GGTTAA −1,580 −1,586 Light responsive element MBS CAACTG +151 +157 MYB binding site involved in drought-inducibility MRE AACCTAA +1,723 +1,730 MYB binding site involved in light responsiveness Table 3.
Some important cis-regulatory elements regulated by the 2,000 bp genomic sequence upstream of MhSnRK2.4.
Figures
(11)
Tables
(3)