-
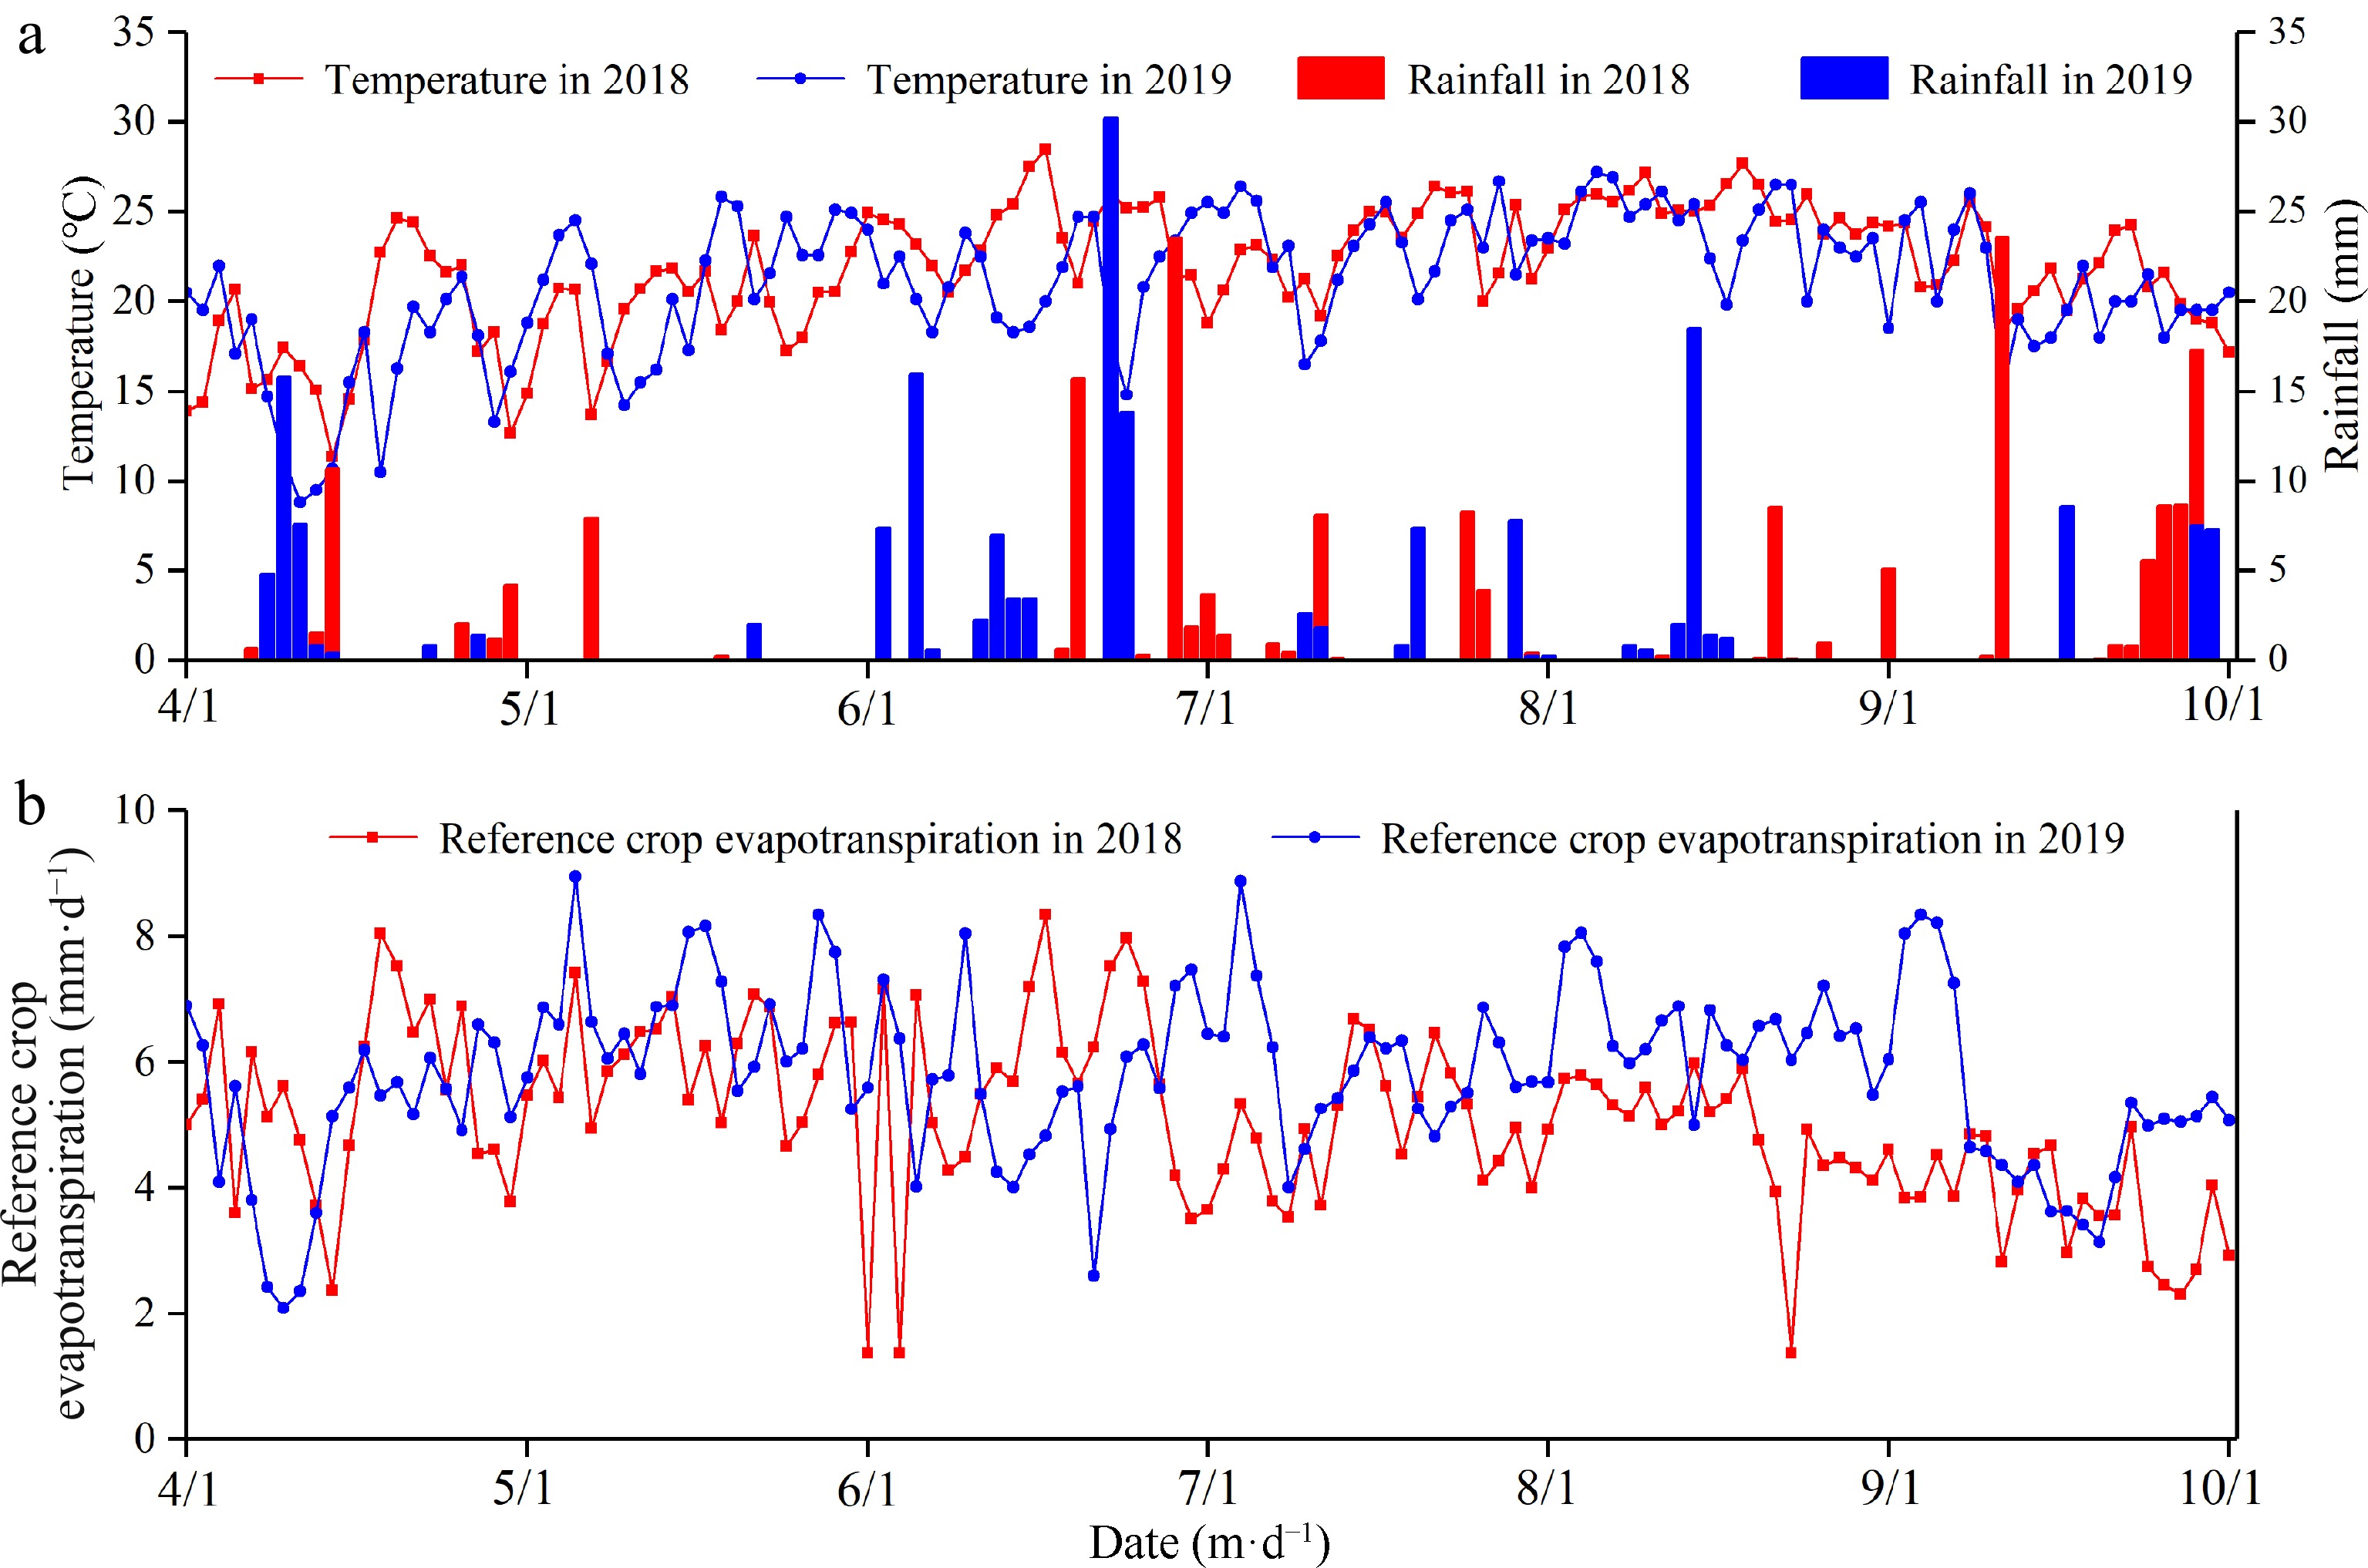
Figure 1.
(a) Daily rainfall and daily mean temperature, and (b) reference crop evapotranspiration (ET0) during the study period in 2018 and 2019.
-
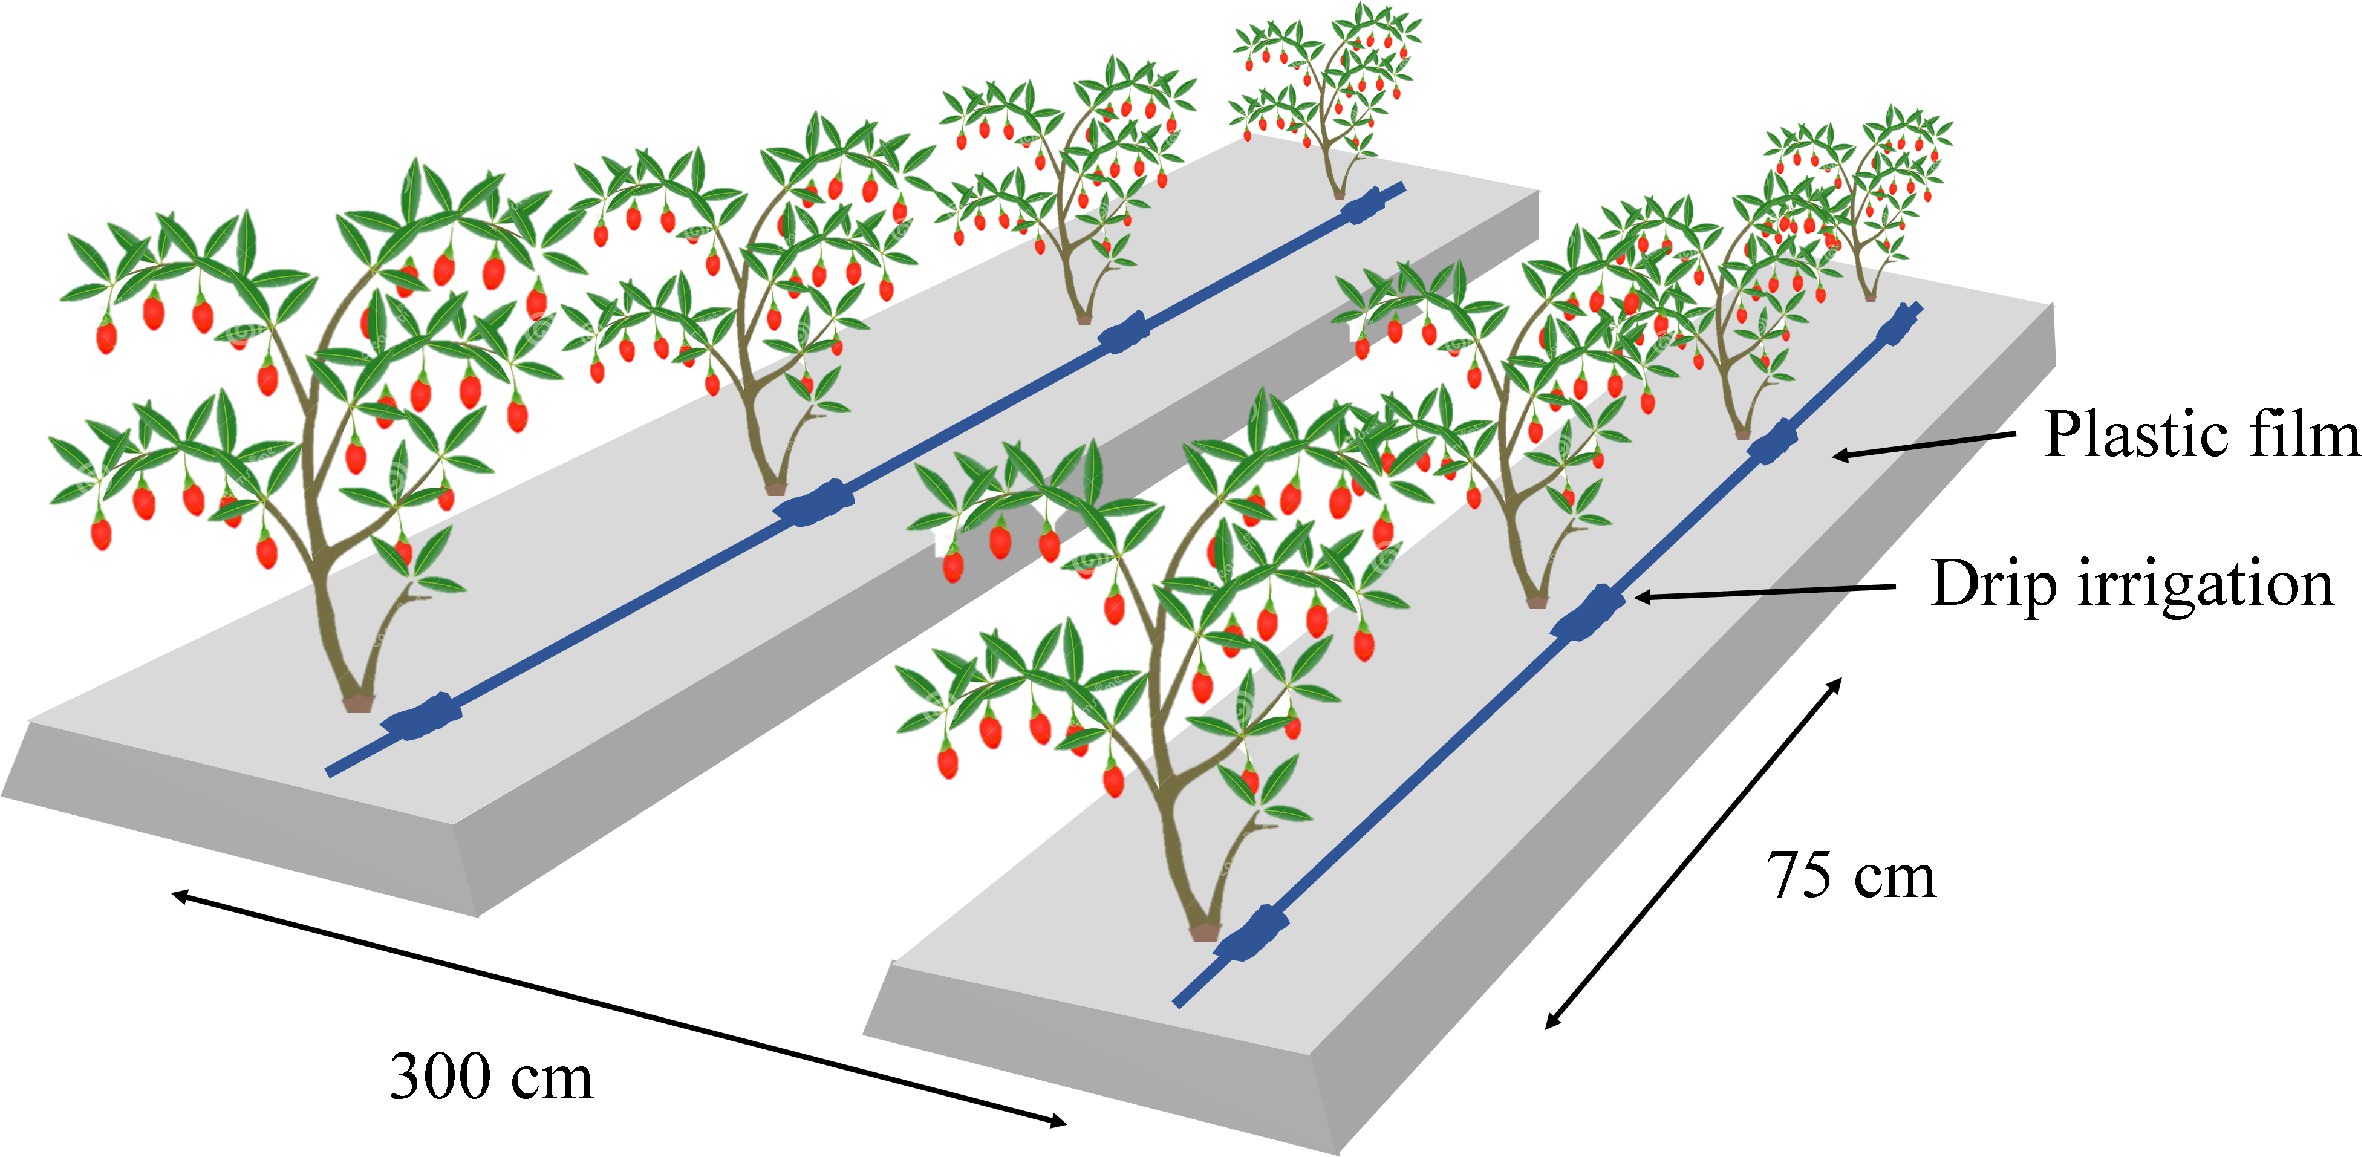
Figure 2.
The layout of the plants, spacing, and drip irrigation used in the field experiments.
-
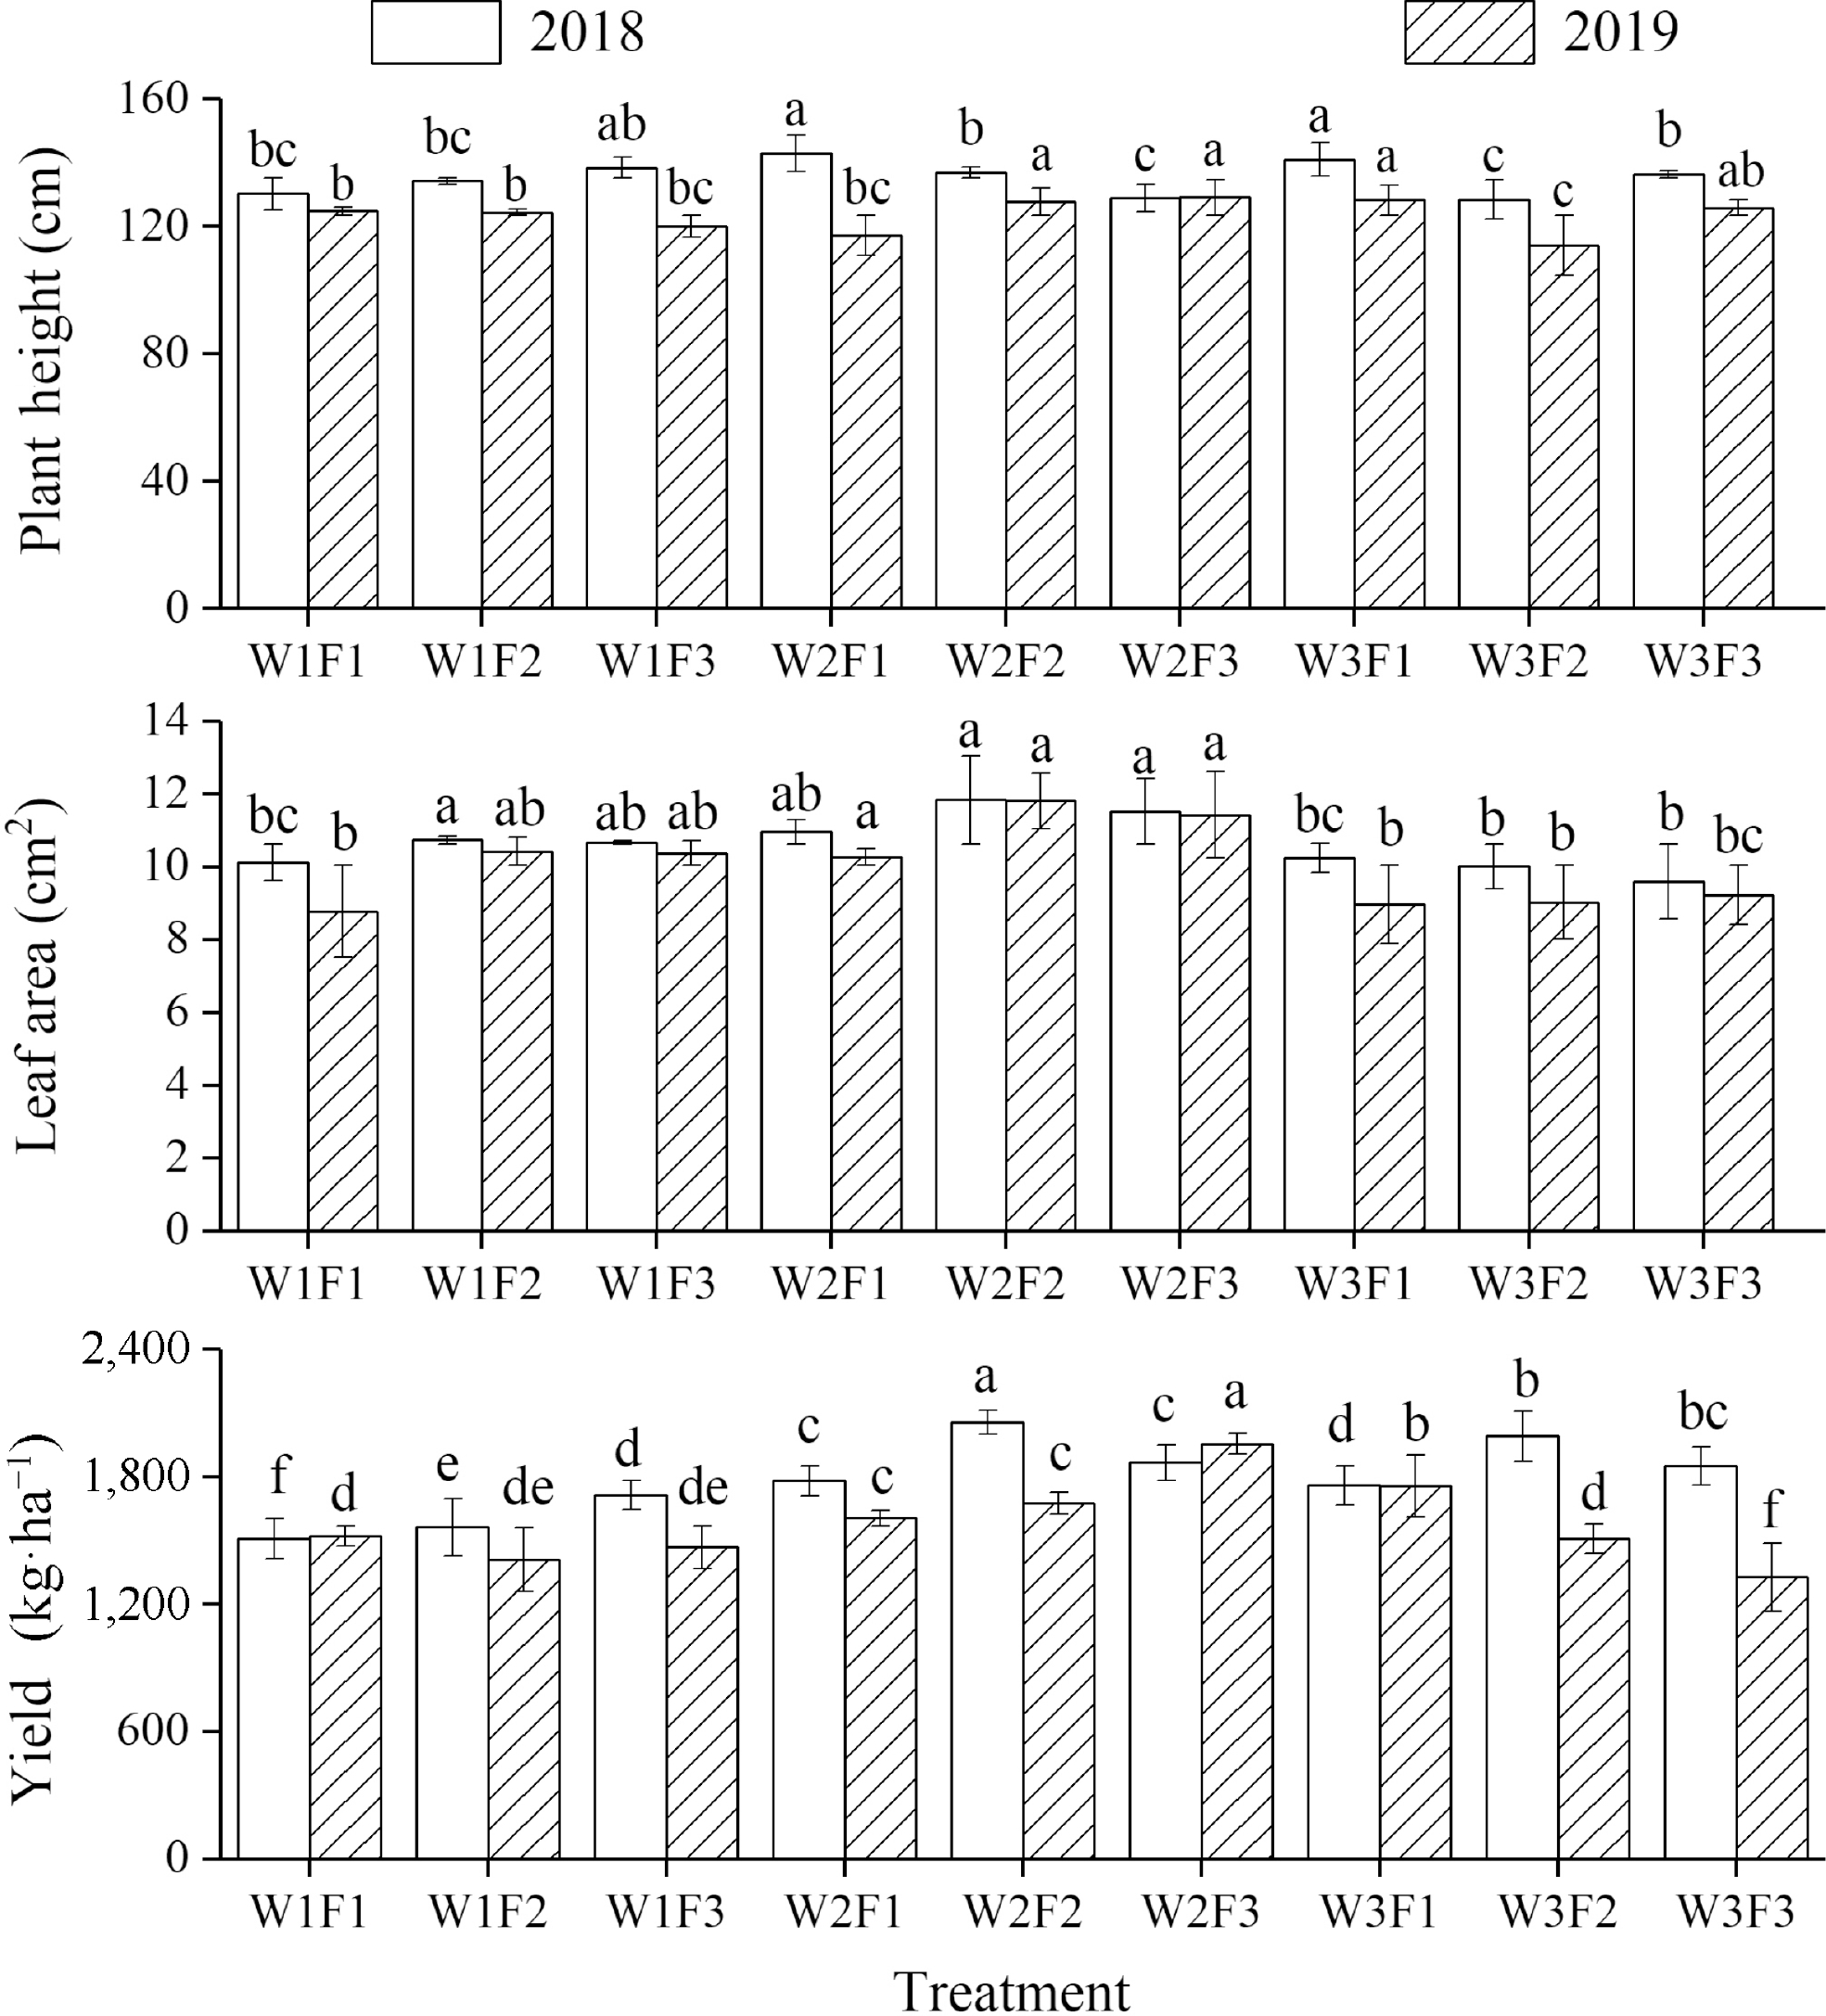
Figure 3.
Effects of different irrigation and fertilizer treatments on plant height, leaf area, and yield in 2018 and 2019. Error bars show the standard error (n = 3). Different letters on top of the bar indicate a significant difference for the means at p < 0.05 according to the LSD test.
-
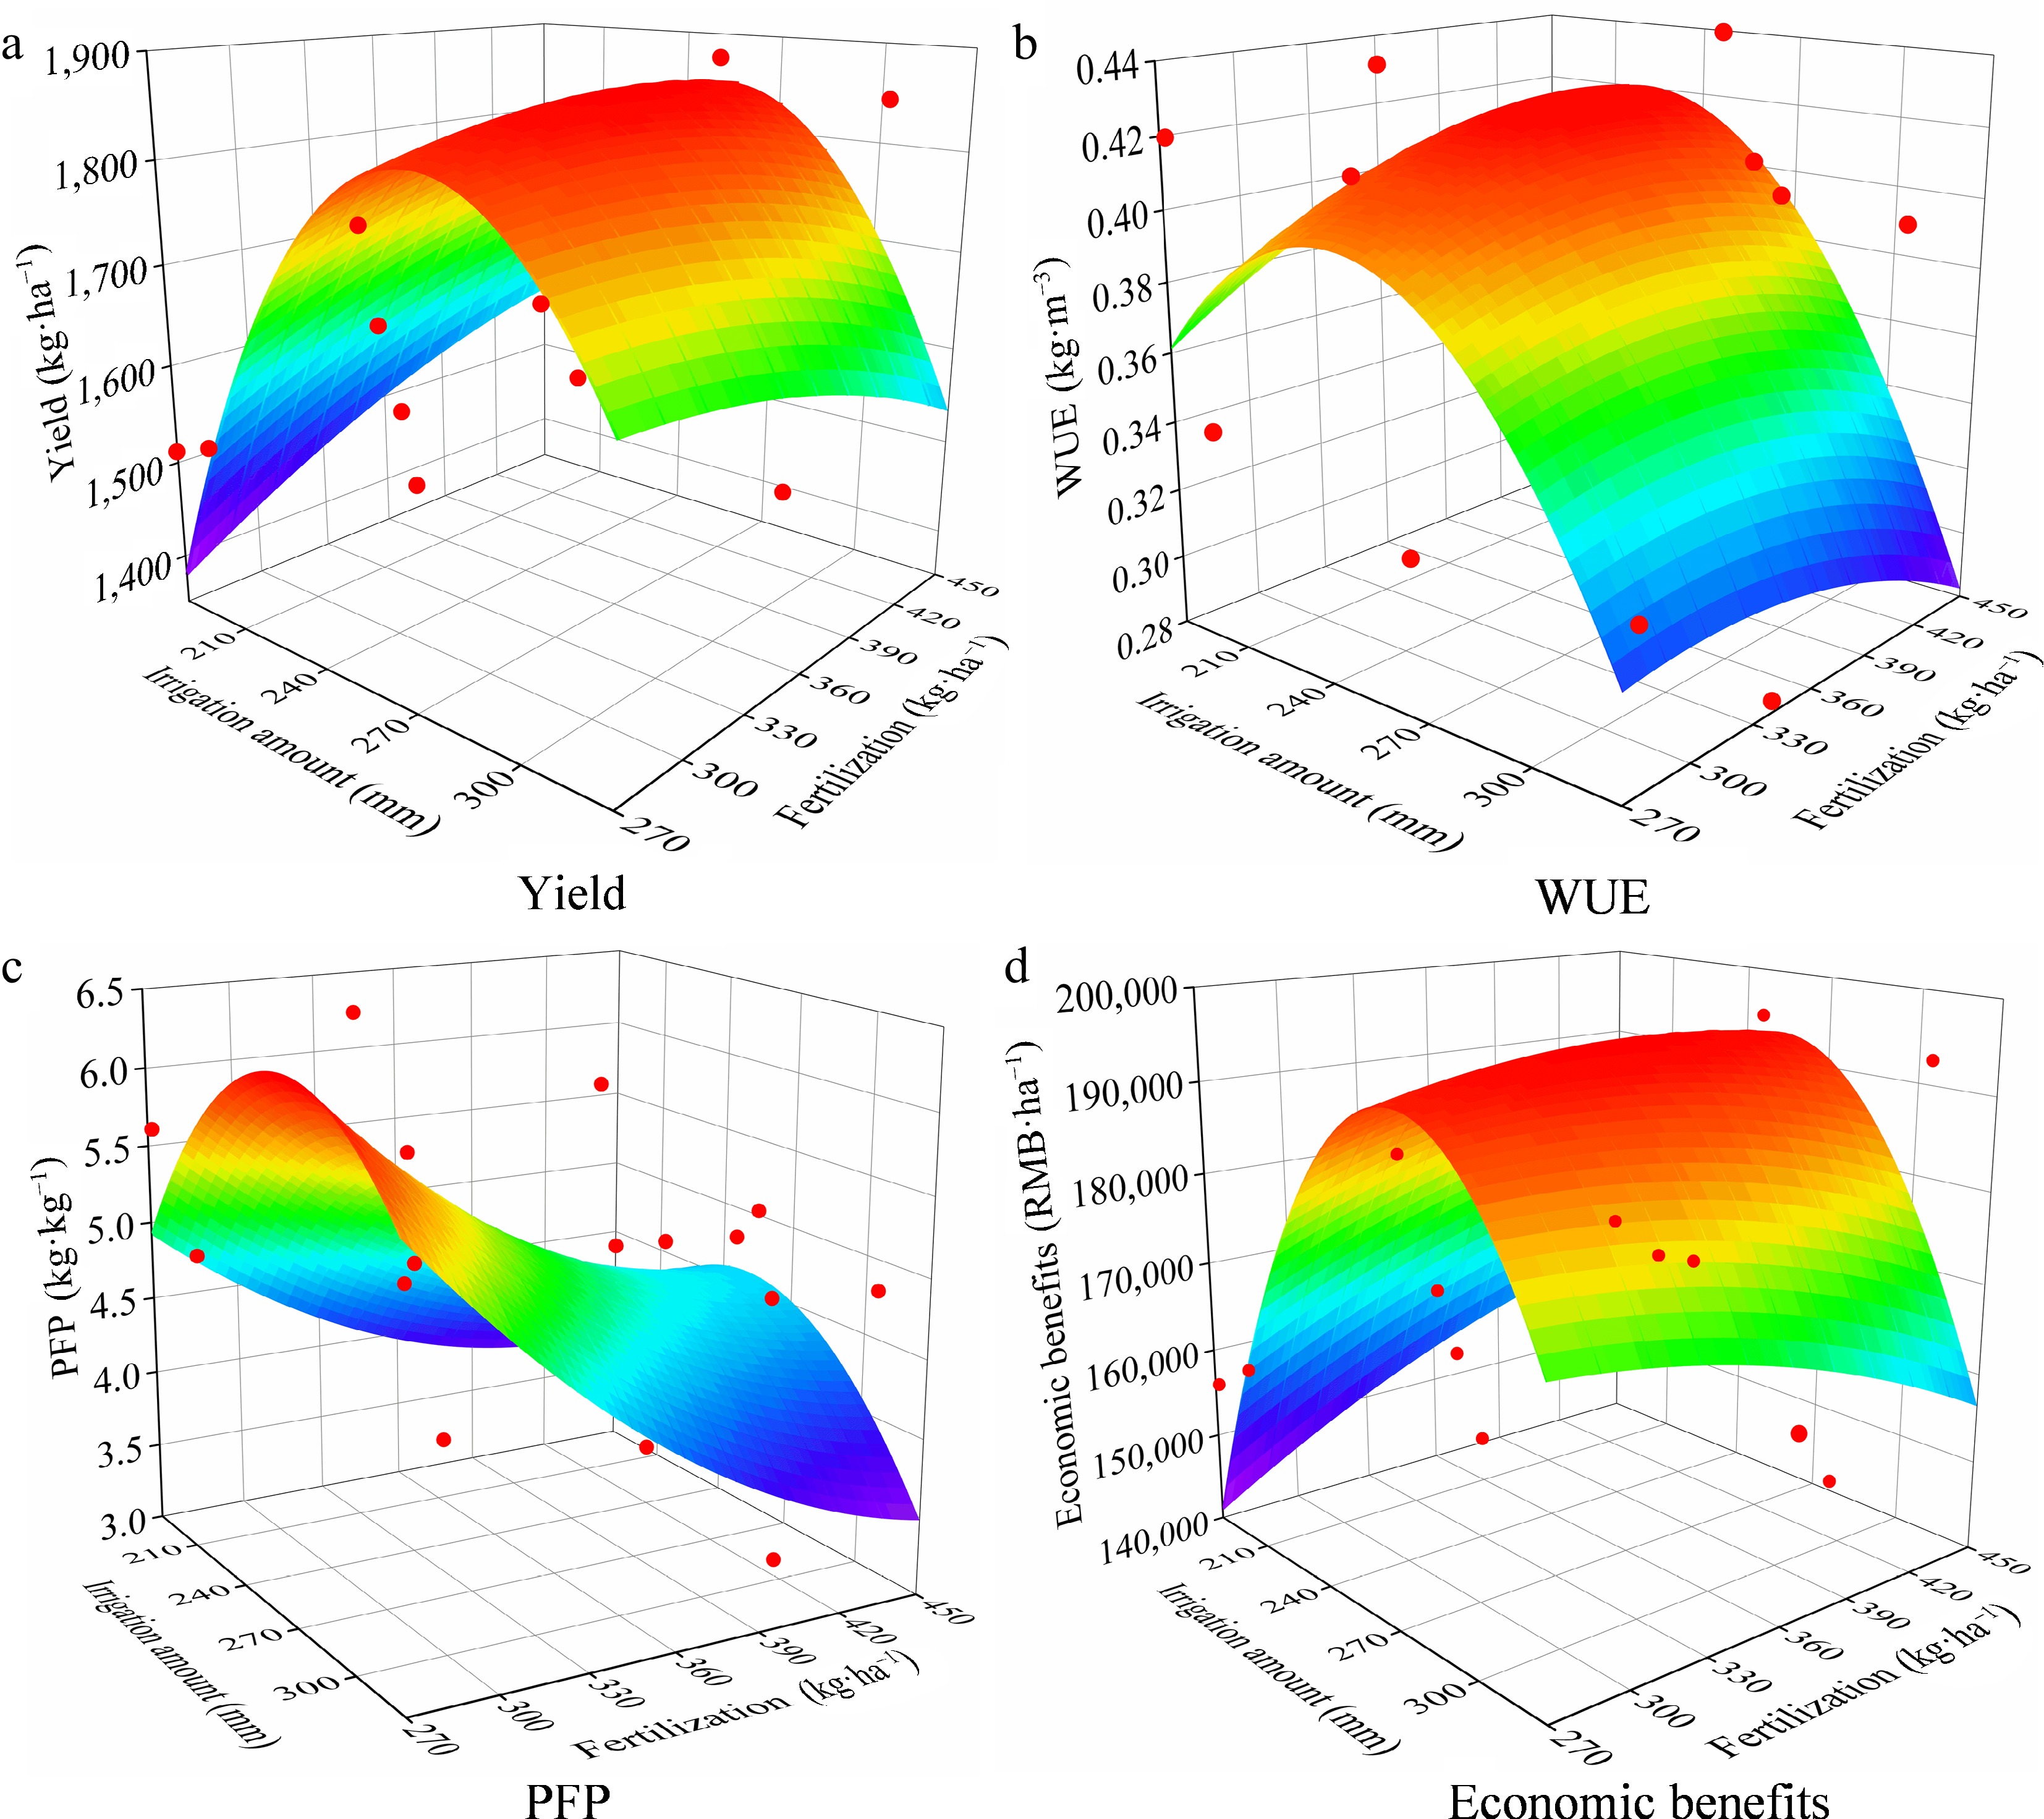
Figure 4.
Relationship of (a) yield, (b) water use efficiency (WUE), (c) partial factor productivity (PFP) and (d) economic benefits with the amount of irrigation and fertilization (N-P2O5-K2O) during the two years. The red dots in the figure represent the measured experimental data during 2018 to 2019.
-
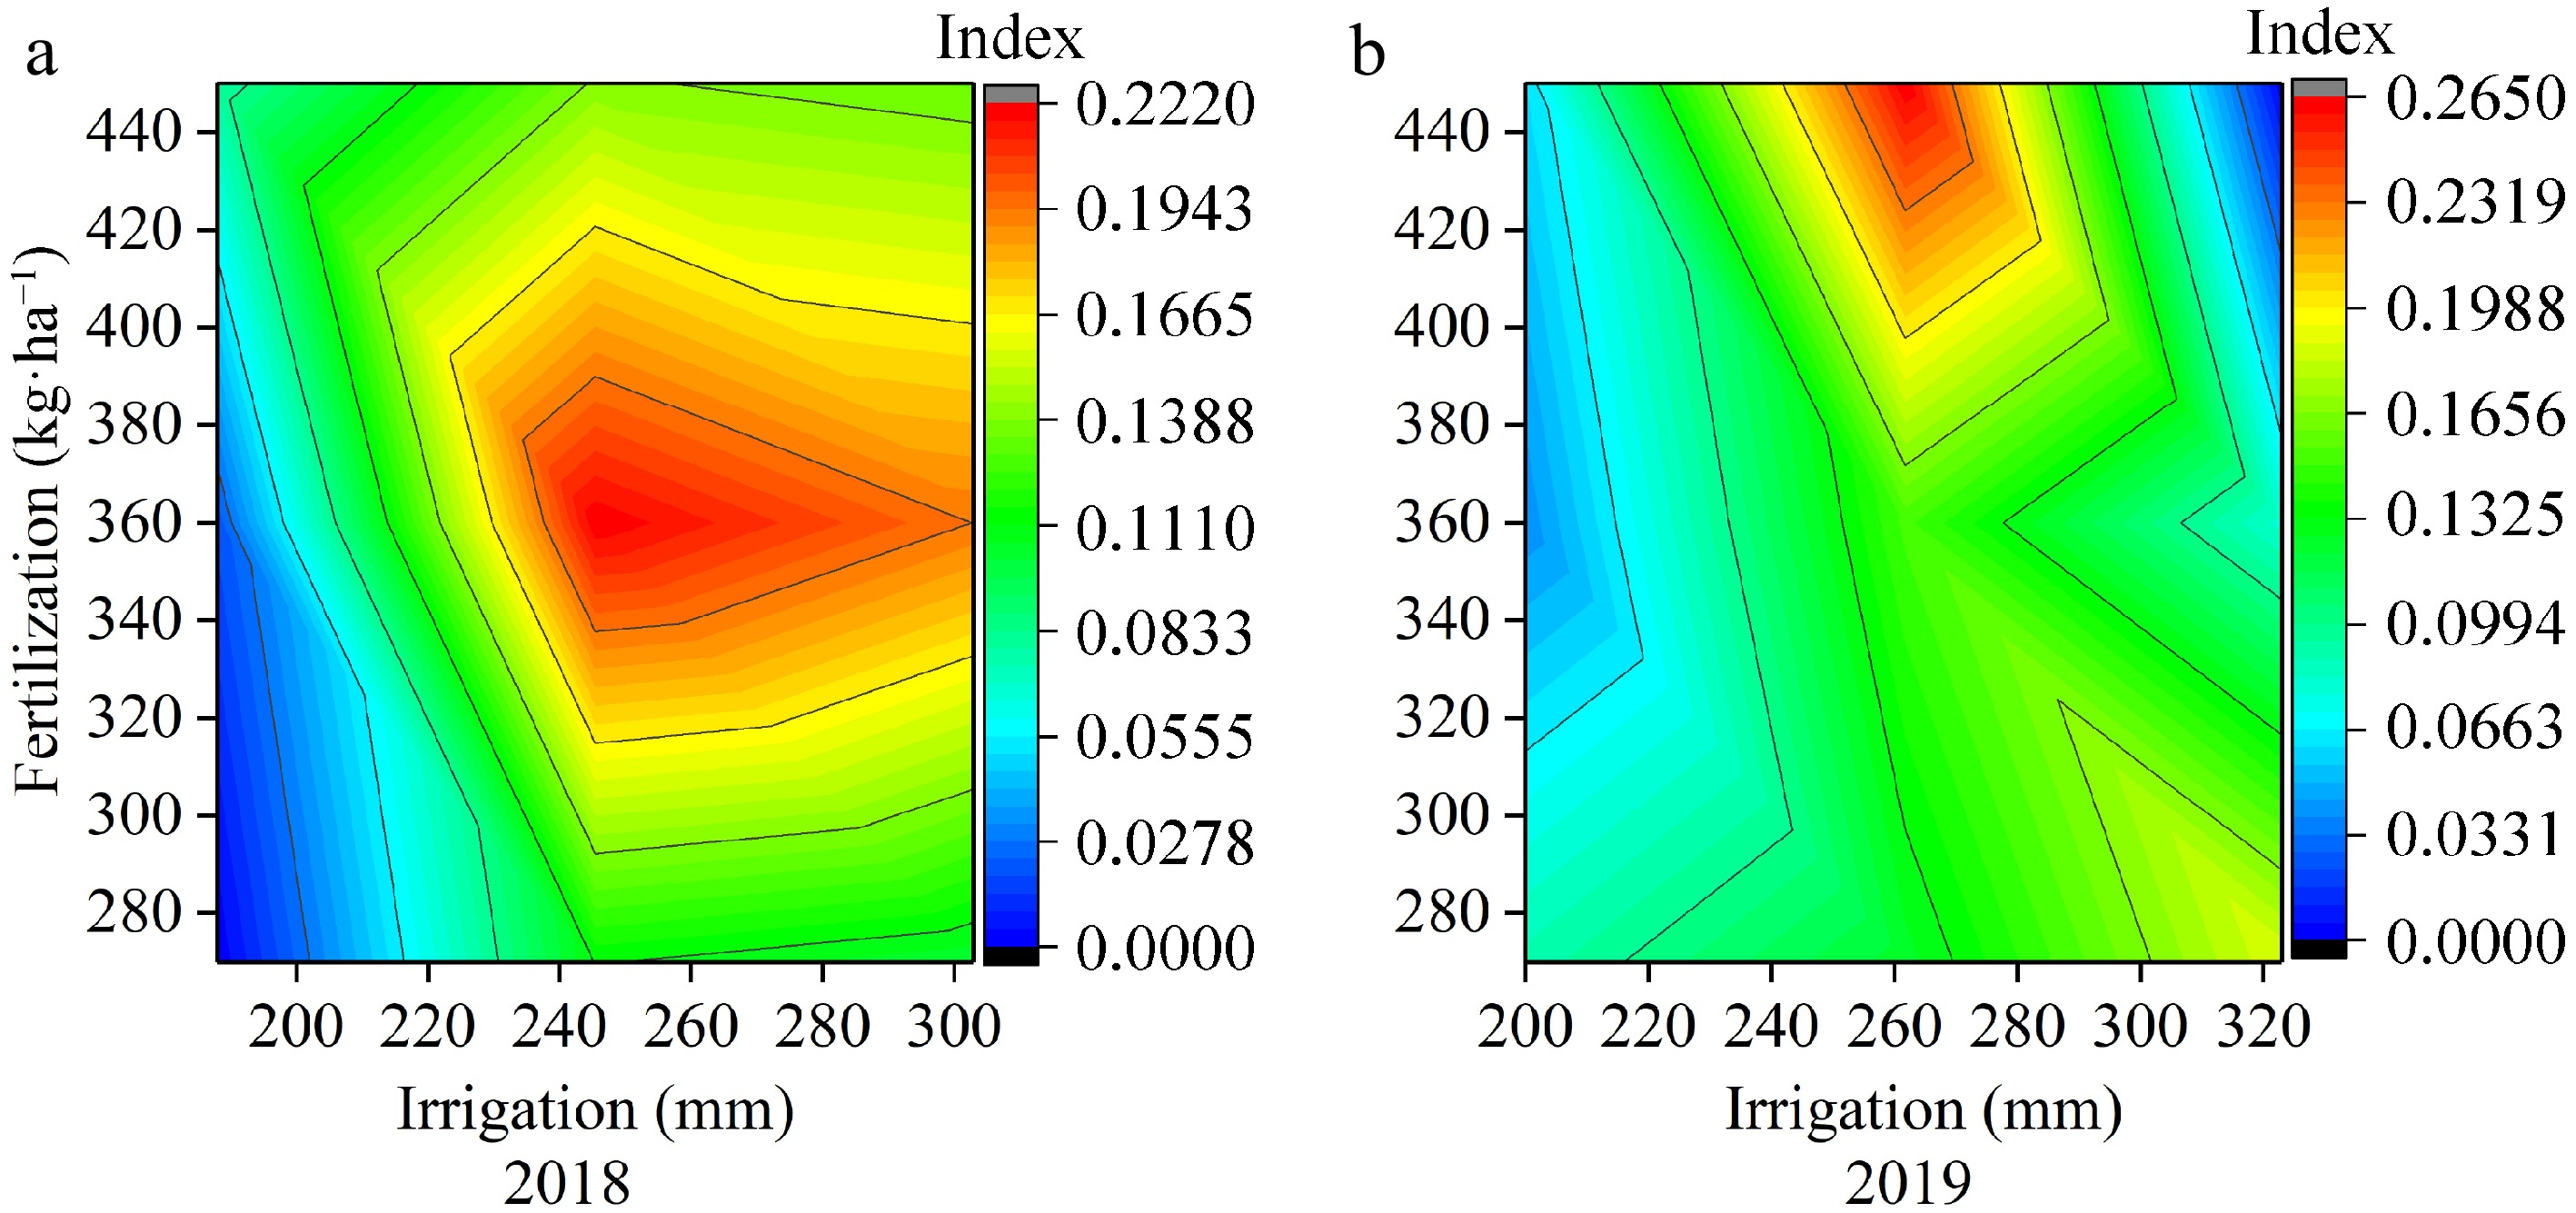
Figure 5.
Effects of irrigation and fertilization on comprehensive evaluation index for (a) 2018, and (b) 2019.
-
Year pH Organic
matter
(g·kg−1)Total
N
(g·kg−1)Available
N
(mg·kg−1)Available
P
(mg·kg−1)Available
K
(mg·kg−1)Total
salt
(g·kg−1)2018 8.27 9.77 0.41 13.7 4.87 112 2.22 2019 8.25 9.95 0.47 14.2 5.64 91 2.09 Table 1.
Soil physicochemical properties of the experimental site during the study period.
-
Year Growth stage Irrigation
date (m/d)Number of irrigation Irrigation (mm) Low (W1) Medium (W2) High (W3) 2018 Spring slightly growing stage 5/4 1 17.8 23.3 28.8 Flowering stage 5/17 2 22.6 29.6 36.5 6/2 3 26.3 34.5 42.6 Fruit ripening stage 6/19 4 39.3 51.4 63.5 7/5 5 30.6 40.0 49.5 7/21 6 26.7 34.9 43.1 Deciduous stage 8/4 7 24.3 31.7 39.2 Total 187.6 245.4 303.2 2019 Spring slightly growing stage 5/5 1 18.3 24.0 29.6 Flowering stage 5/19 2 24.5 32.1 39.2 6/4 3 38.7 50.7 62.6 Fruit ripening stage 6/20 4 35.2 46.1 56.9 7/3 5 30.3 39.6 48.9 7/13 6 27.4 35.8 44.2 Deciduous stage 8/5 7 25.7 33.6 41.5 Total 200.1 261.9 322.9 Table 2.
Irrigation scheduling of Chinese wolfberry during the two years of experiments.
-
Treatment Plant height Leaf area Yield 2018 2019 2018 2019 2018 2019 Level of significance Irrigation * * * ** * * Fertilization ns ns ns * * ns Irrigation × fertilization ns * ns ns ** ** * means significant at the 0.05 probability level, ** means significant at the 0.01 probability level, and ns means non-significant. Table 3.
Level of significance of growth parameters and yield under different irrigation and fertilizer treatments in 2018 and 2019.
-
Treatment Water use efficiency
(kg·m−3)Partial factor
productivity of
fertilizer (kg·kg−1)2018 2019 2018 2019 W1F1 0.42d 0.34b 5.58b 4.89b W1F2 0.43c 0.31cd 4.40cd 3.36cd W1F3 0.47b 0.33bc 4.34d 3.24d W2F1 0.42d 0.32c 6.59a 5.2a W2F2 0.55a 0.31cd 6.55a 3.82c W2F3 0.44c 0.39a 4.78c 4.5b W3F1 0.37ef 0.32c 6.52a 5.76a W3F2 0.42d 0.27d 5.55b 3.63c W3F3 0.39e 0.23e 4.75c 2.89e Level of significance Irrigation ** * * * Fertilization * ns ** ** Irrigation × fertilization * * * * Means with different letters are significantly different (p < 0.05) based on the LSD test. * Means significant at the 0.05 probability level, ** means significant at the 0.01 probability level, and ns means non-significant. Table 4.
Treatment effects on water use efficiency (kg·m−3) and partial factor productivity of fertilizer (kg·kg−1).
-
Treatment Water fee
(CNY¥ ha−1)Fertilizer cost
(CNY¥ ha−1)Harvesting cost
(CNY¥ ha−1)Other costs
(CNY¥ ha−1)Gross profit
(CNY¥ ha−1)Economic benefits
(CNY¥ ha−1)2018 2019 2018 2019 2018 2019 2018 2019 2018 2019 2018 2019 W1F1 500 534 2,878 6,778 6,847 15,000 180,752 182,584 155,596 157,325 W1F2 500 534 3,838 7,027 6,344 15,000 187,375 169,178 161,010 143,462 W1F3 500 534 4,797 7,706 6,606 15,000 205,499 176,150 177,496 149,213 W2F1 654 698 2,878 8,010 7,218 15,000 213,607 192,474 187,065 166,680 W2F2 654 698 3838 9,253 7,536 15,000 246,746 200,947 218,001 173,875 W2F3 654 698 4,797 8,397 8,793 15,000 223,925 234,487 195,077 205,199 W3F1 808 862 2,878 7,917 7,900 15,000 211,108 210,656 184,505 184,016 W3F2 808 862 3,838 8,958 6,785 15,000 238,883 180,940 210,279 154,455 W3F3 808 862 4,797 8,330 5,964 15,000 222,120 159,046 193,185 132,423 Table 5.
Effects of different irrigation and fertilization treatments on economic benefits.
-
Dependent variable/Y Regression equation R2 P Yield/Y1 Y1 = −4120.2737 + 37.5905I + 5.7081Y − 0.0628I2 − 0.0031F2 − 0.0129IF
0.67 * (0.037) WUE/Y2 Y2 = −0.7415 + 0.007I + 0.0018F − 0.000013I2 − 0.00000144F2 − 0.000003IF
0.63 * (0.043) PFP/Y3 Y3 = −3.233 + 0.122I − 0.0325F − 0.0002I2 + 0.000047F2 − 0.000043IF
0.74 * (0.029) Economic benefits/Y4 Y4 = −490877.3168 + 4339.0072I + 648.5543F − 7.2545I2 − 0.3537F2 − 1.4897IF
0.67 * (0.038) I and F represent the amounts of irrigation and fertilization, respectively. * Means significant at the 0.05 probability level. Table 6.
Regression equations between irrigation and fertilization inputs and yield, WUE, PFP and economic benefits.
-
Dependent variable/Y Maximum value of dependent variable Irrigation
amount
(mm)Fertilization
(N-P2O5-K2O)
(kg·ha−1)Yield/Y1 1859.74 259.7 192-64-128 WUE/Y2 0.42 225.5 204-68-136 PFP/Y3 6.31 269.5 135-45-90 Economic benefits/Y4 195,101.33 261.5 183-61-122 Table 7.
The optimum level of irrigation and fertilization for maximum yield, WUE, PFP, and economic benefits.
Figures
(5)
Tables
(7)