-
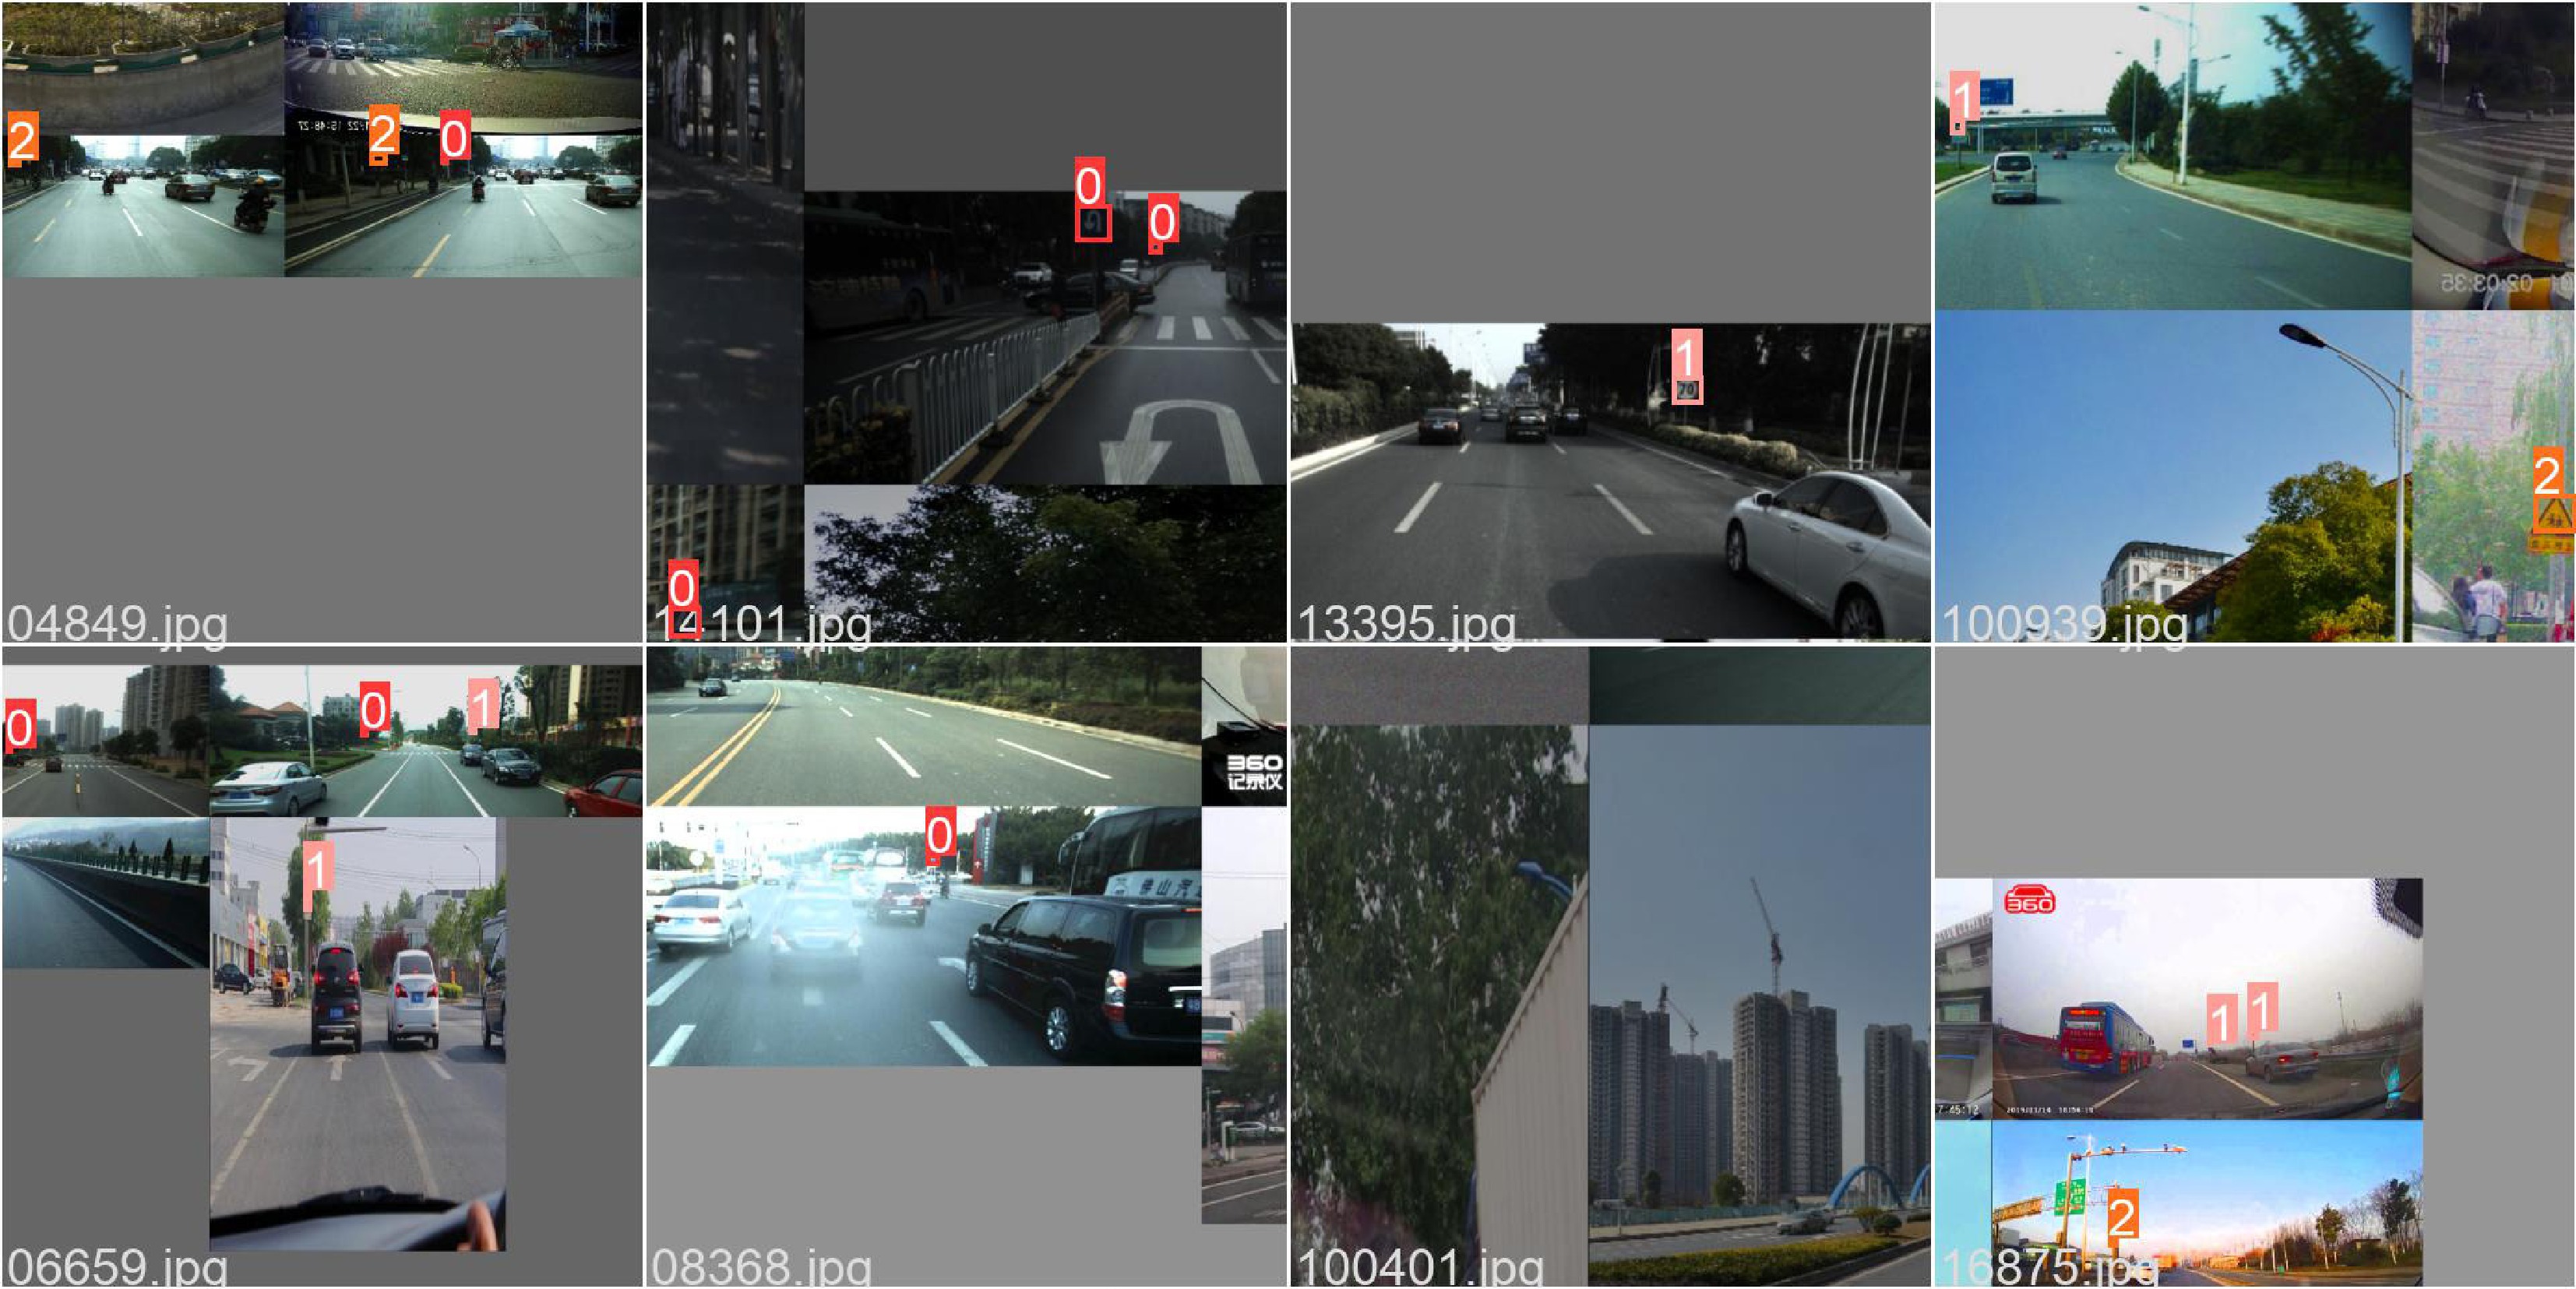
Figure 1.
Results of data processing.
-
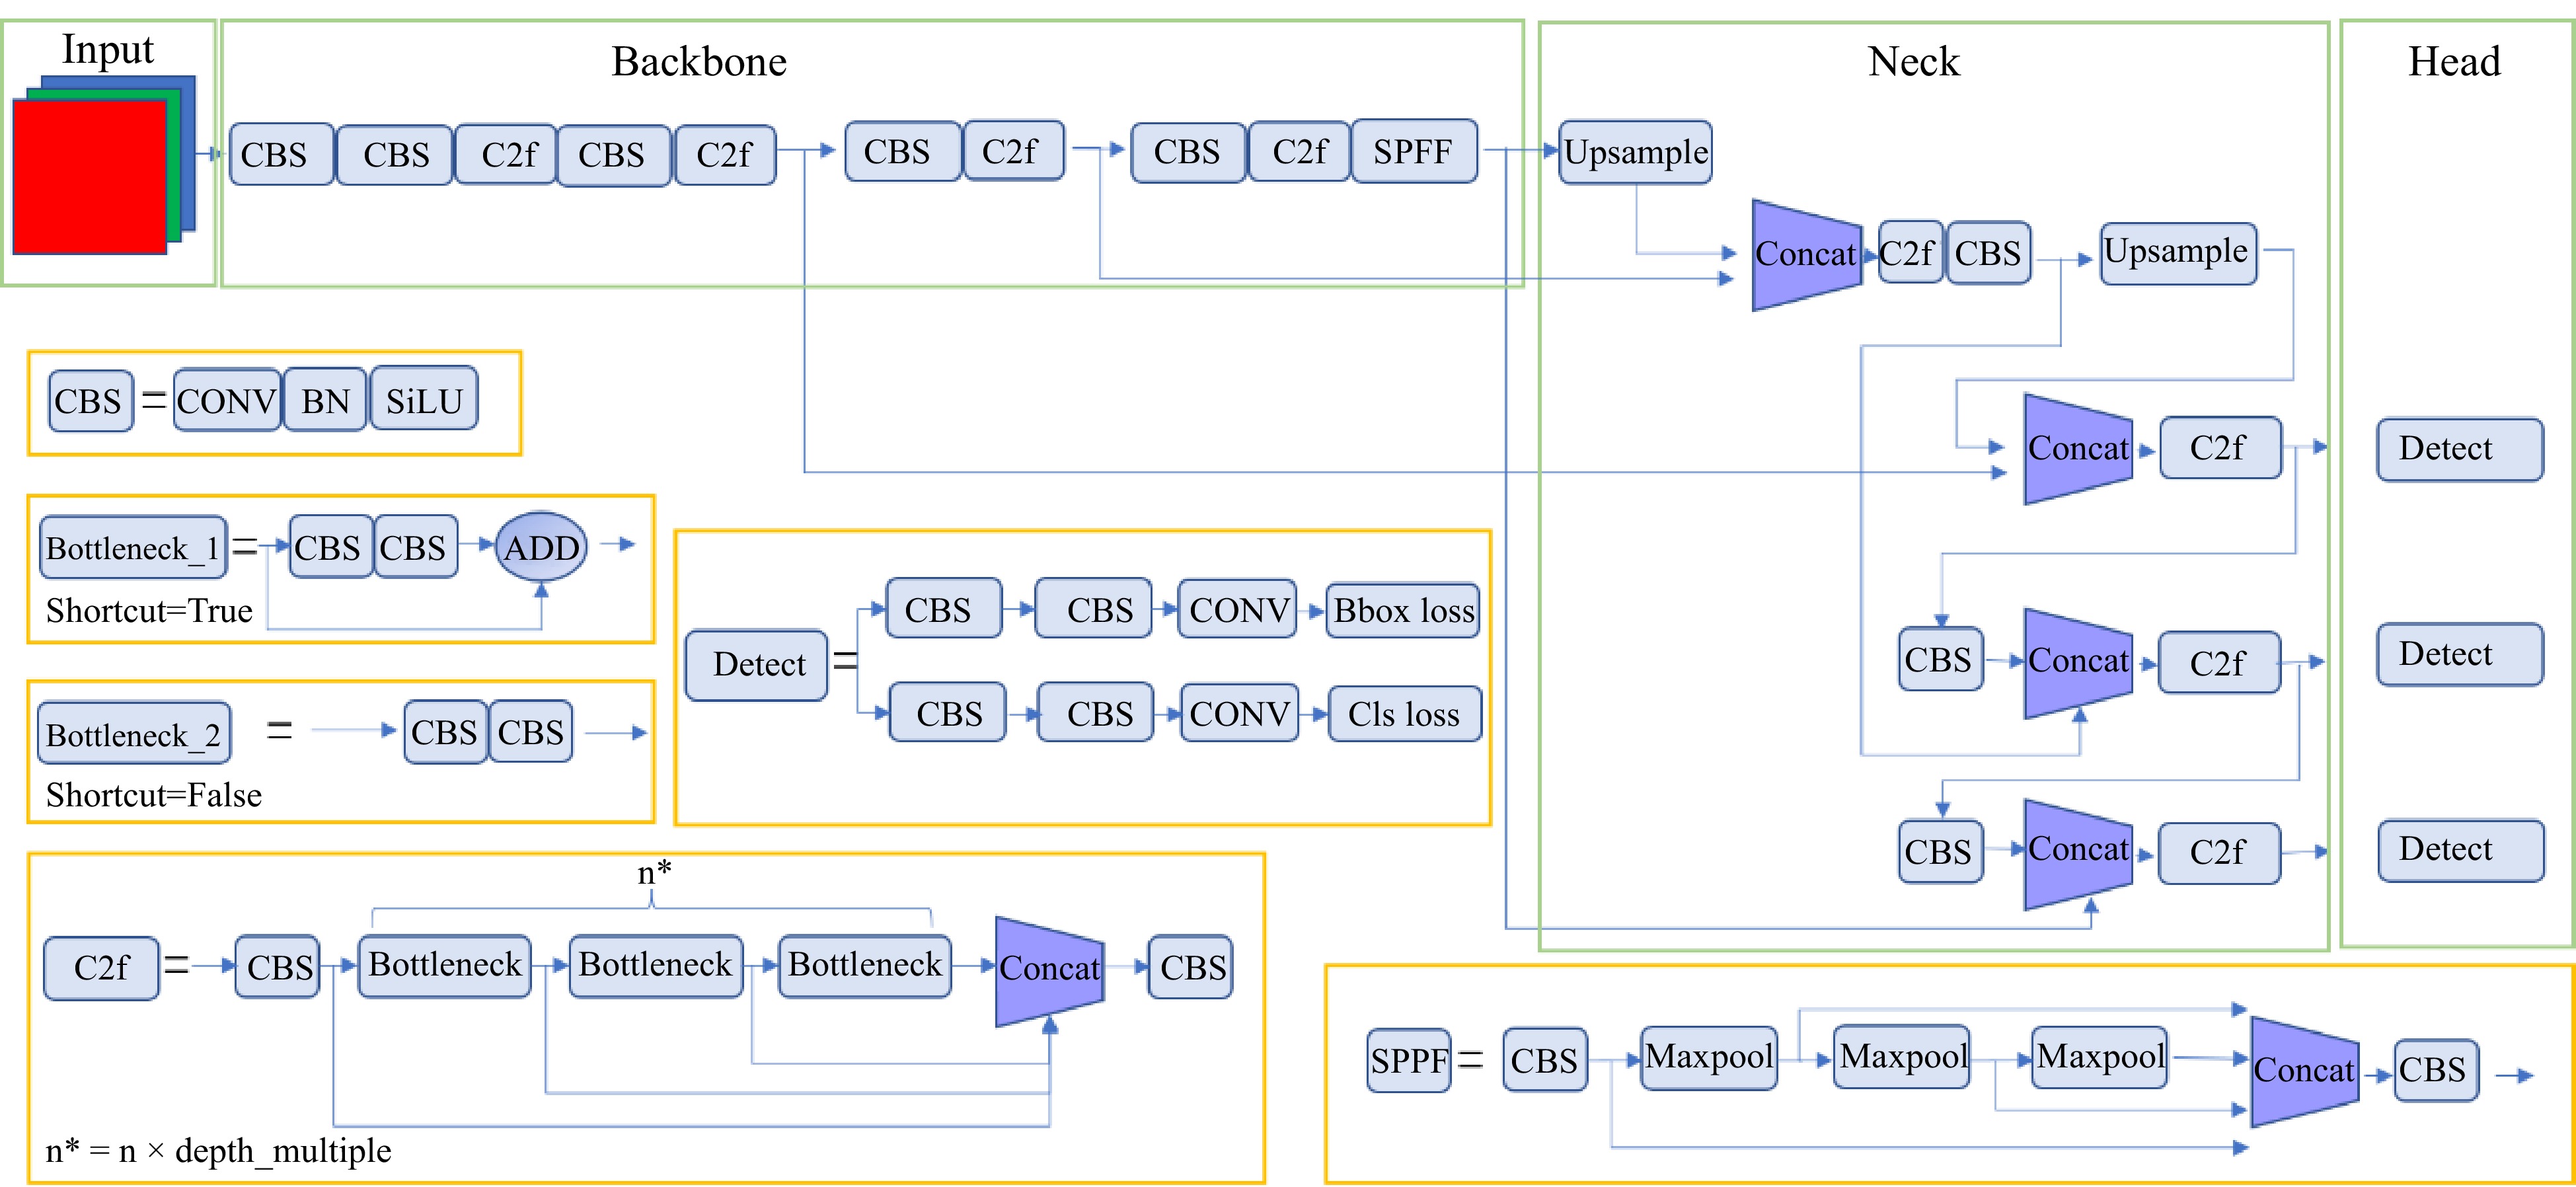
Figure 2.
Structure of YOLOv8.
-
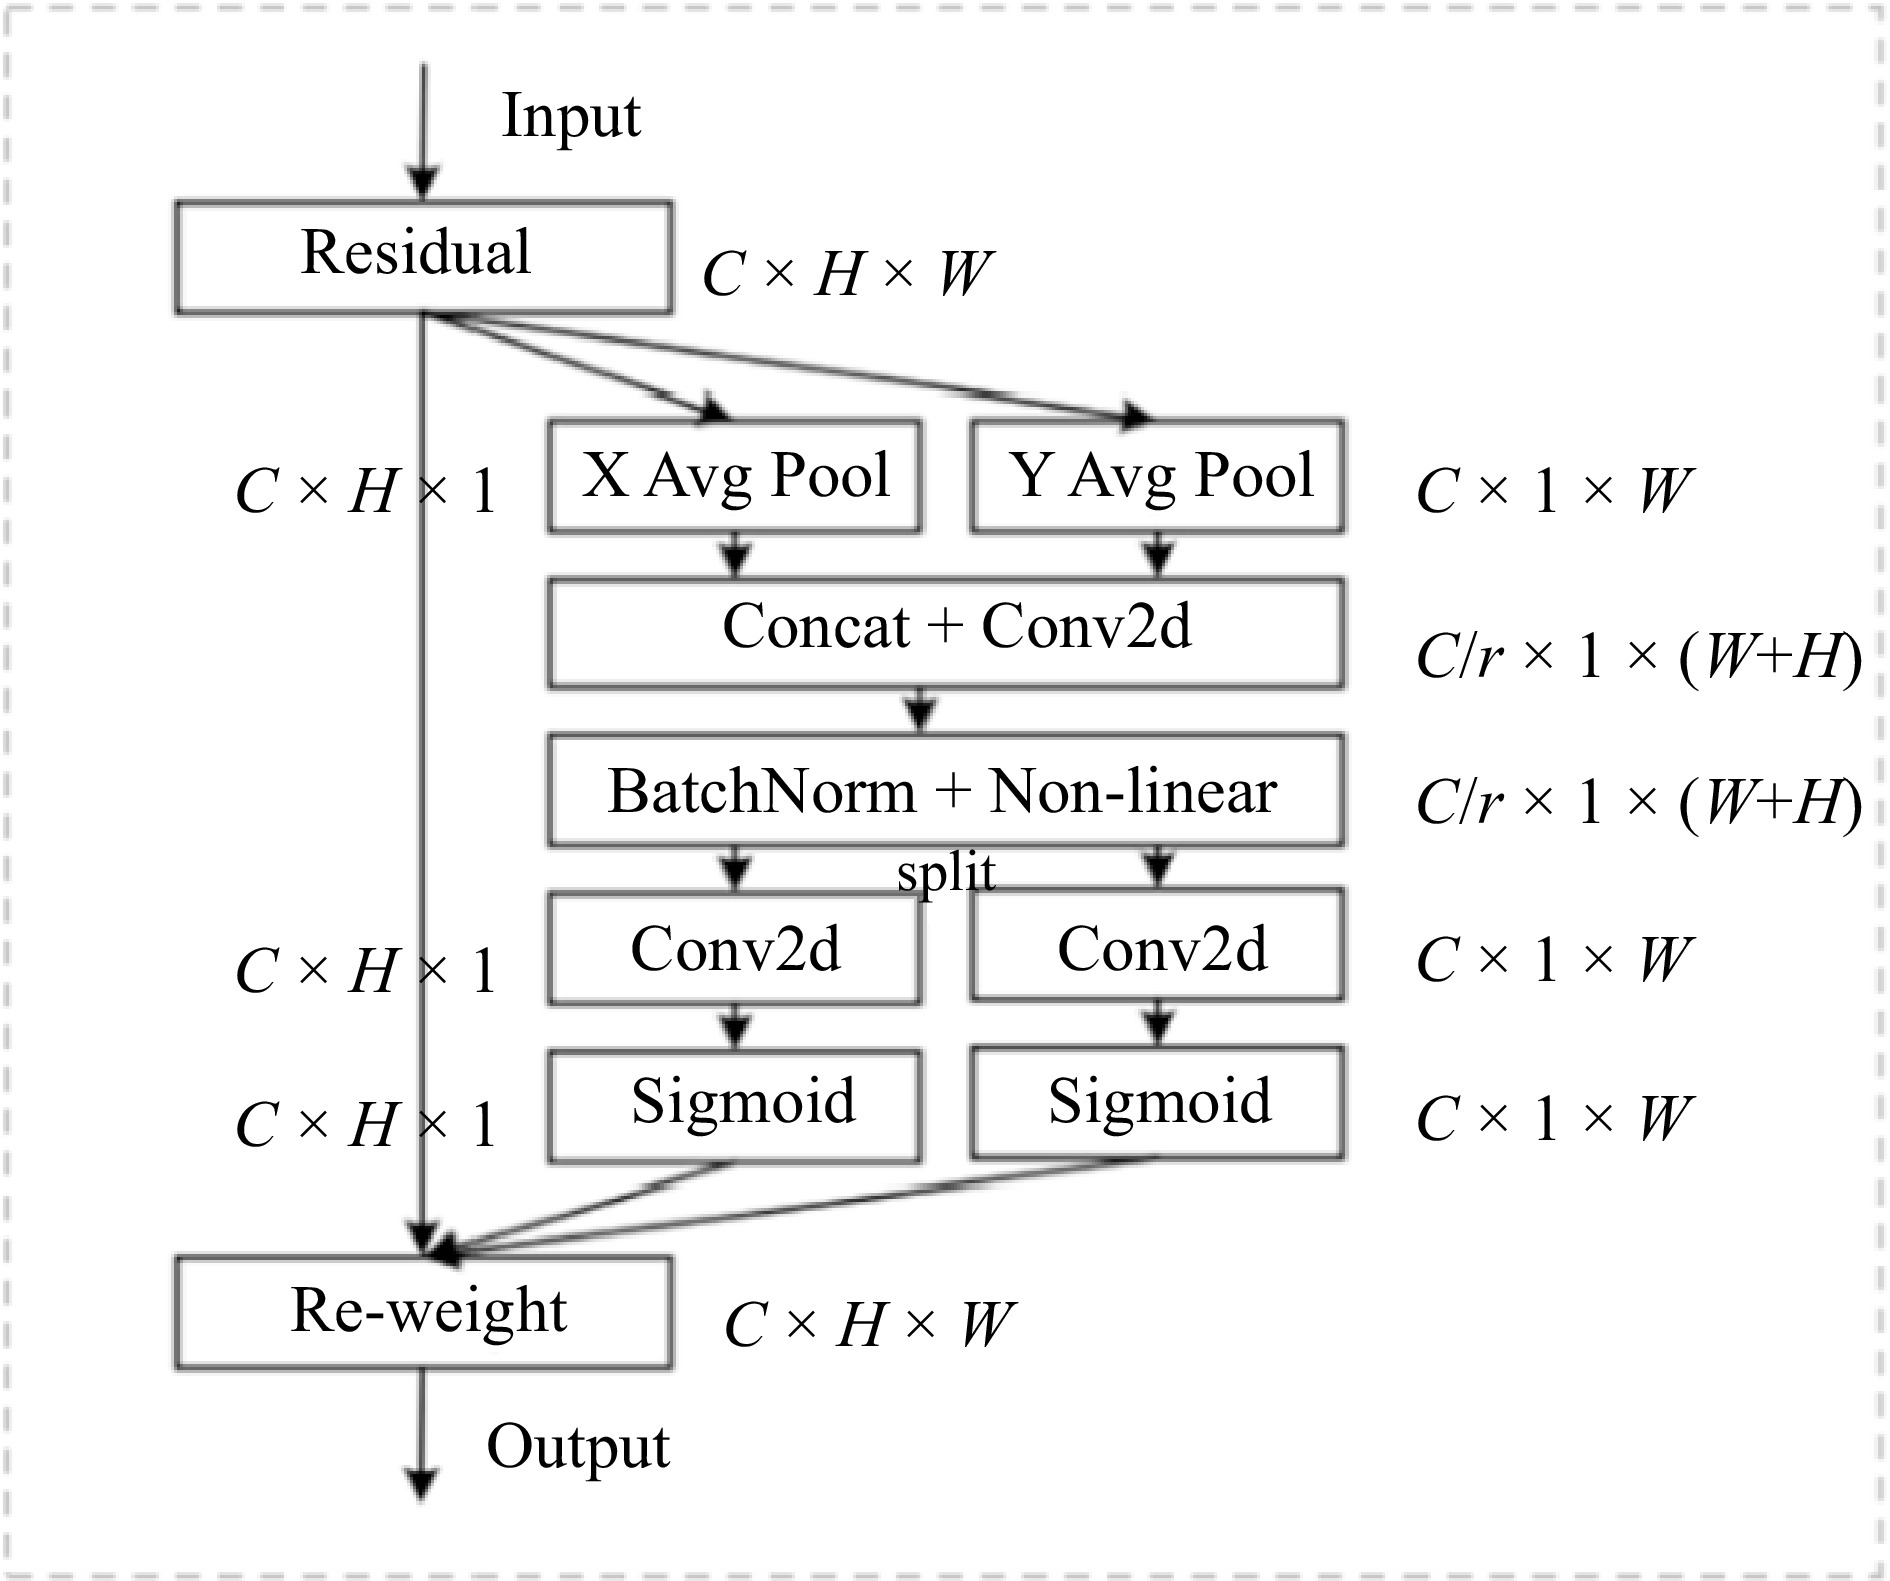
Figure 3.
Structure of coordinate attention.
-
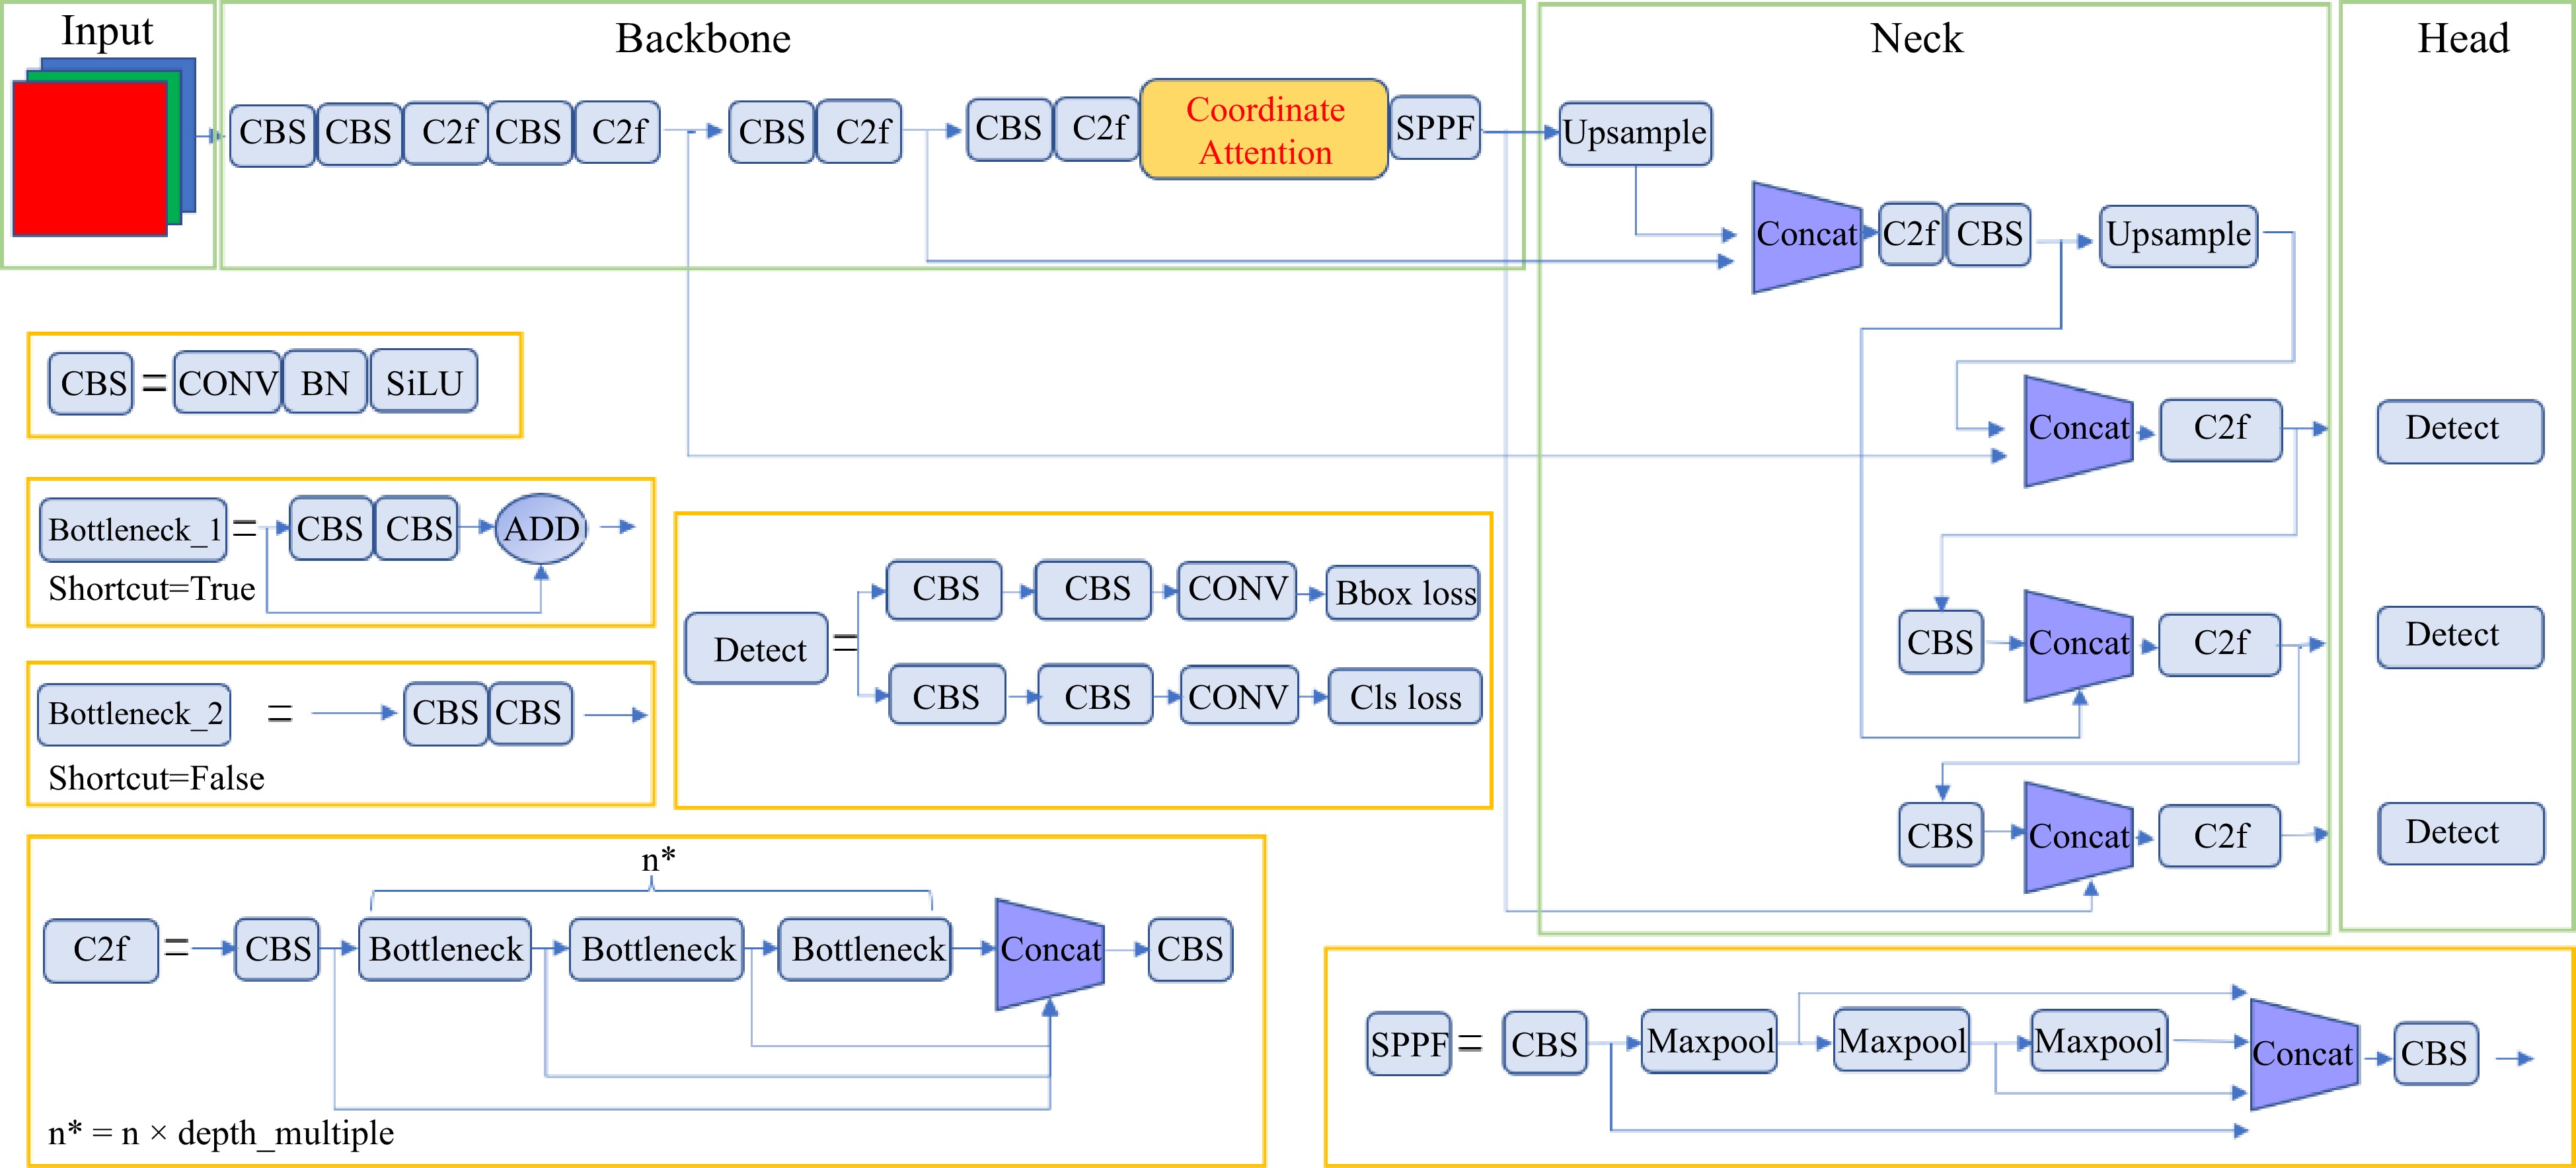
Figure 4.
Structure of the improved YOLOv8.
-
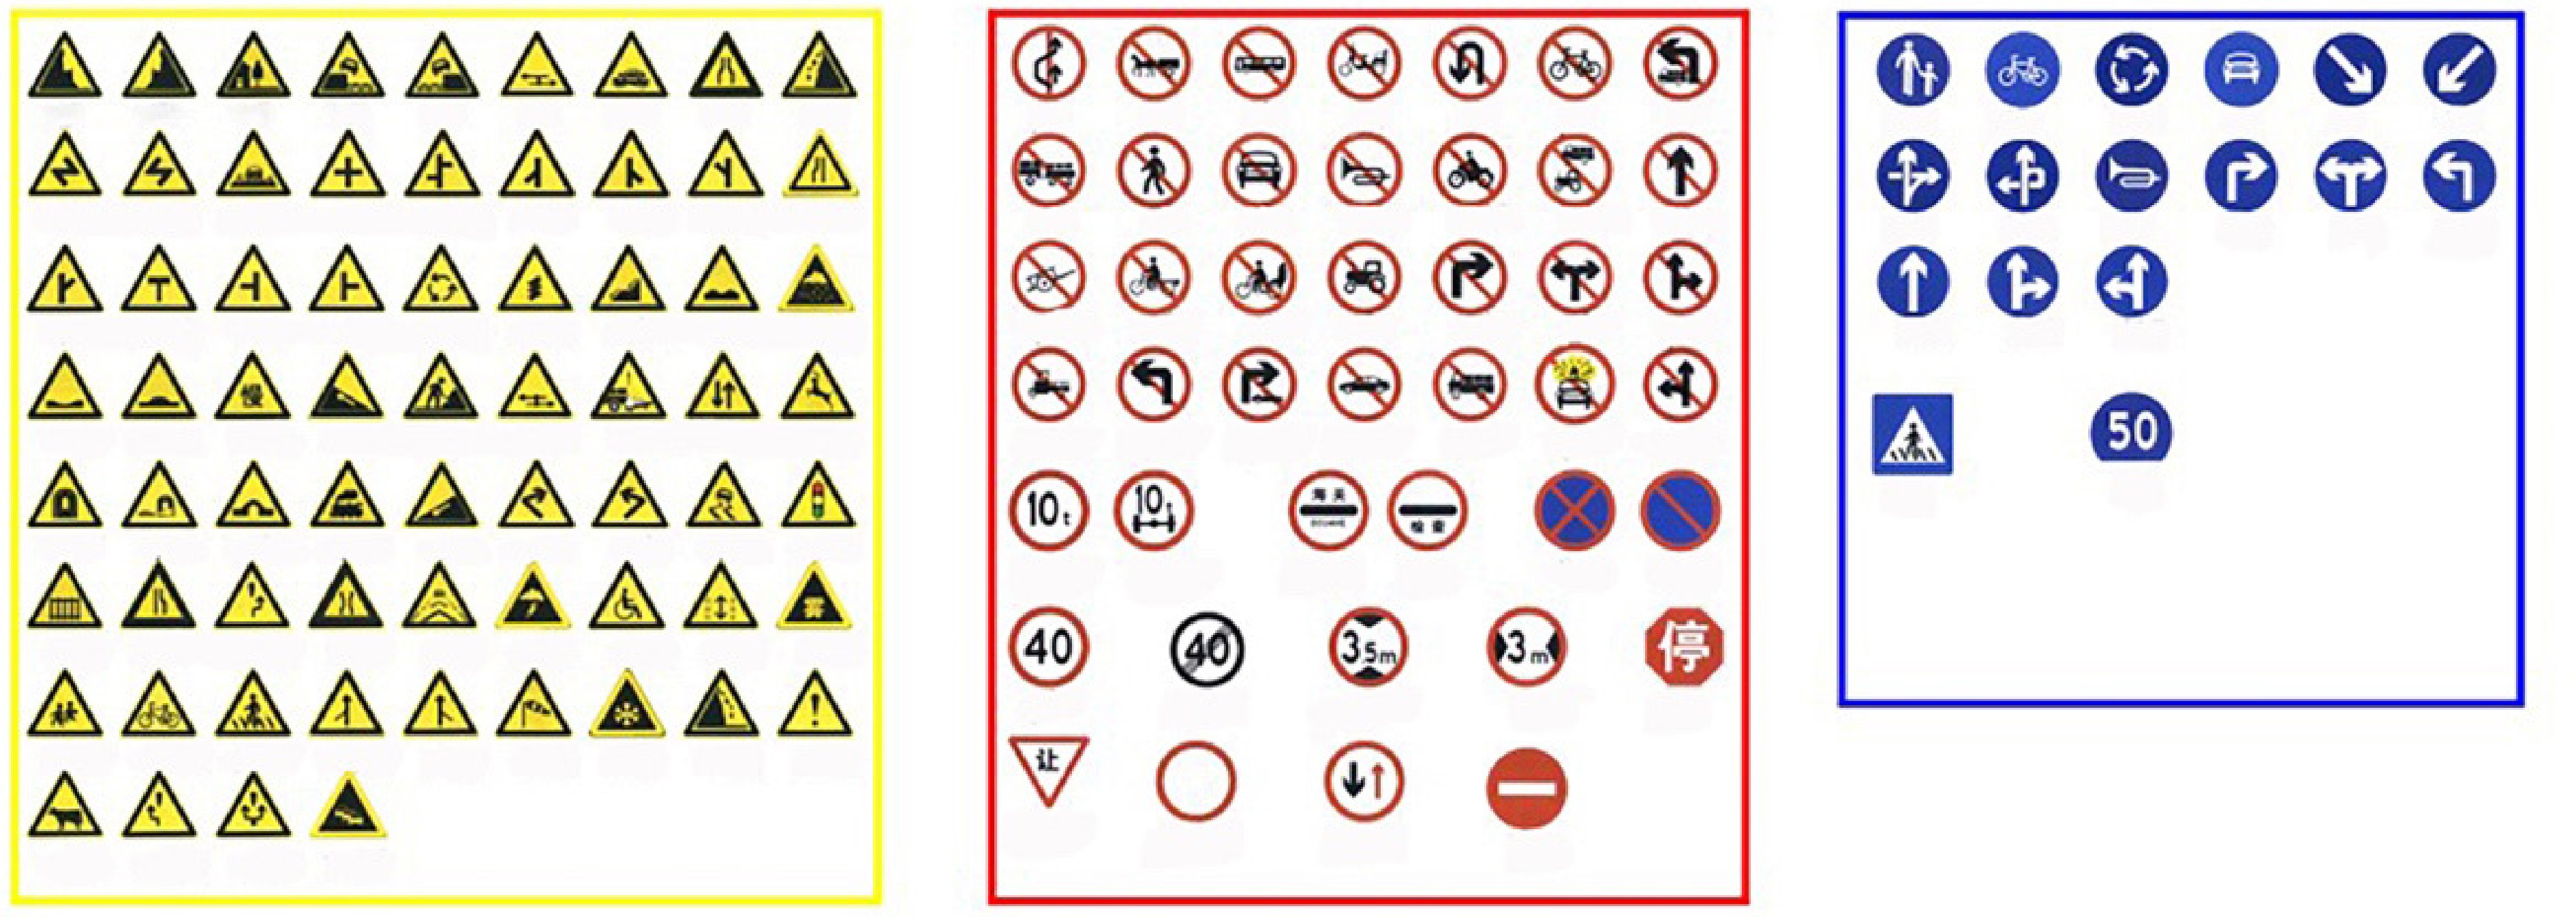
Figure 5.
Traffic sign categories.
-
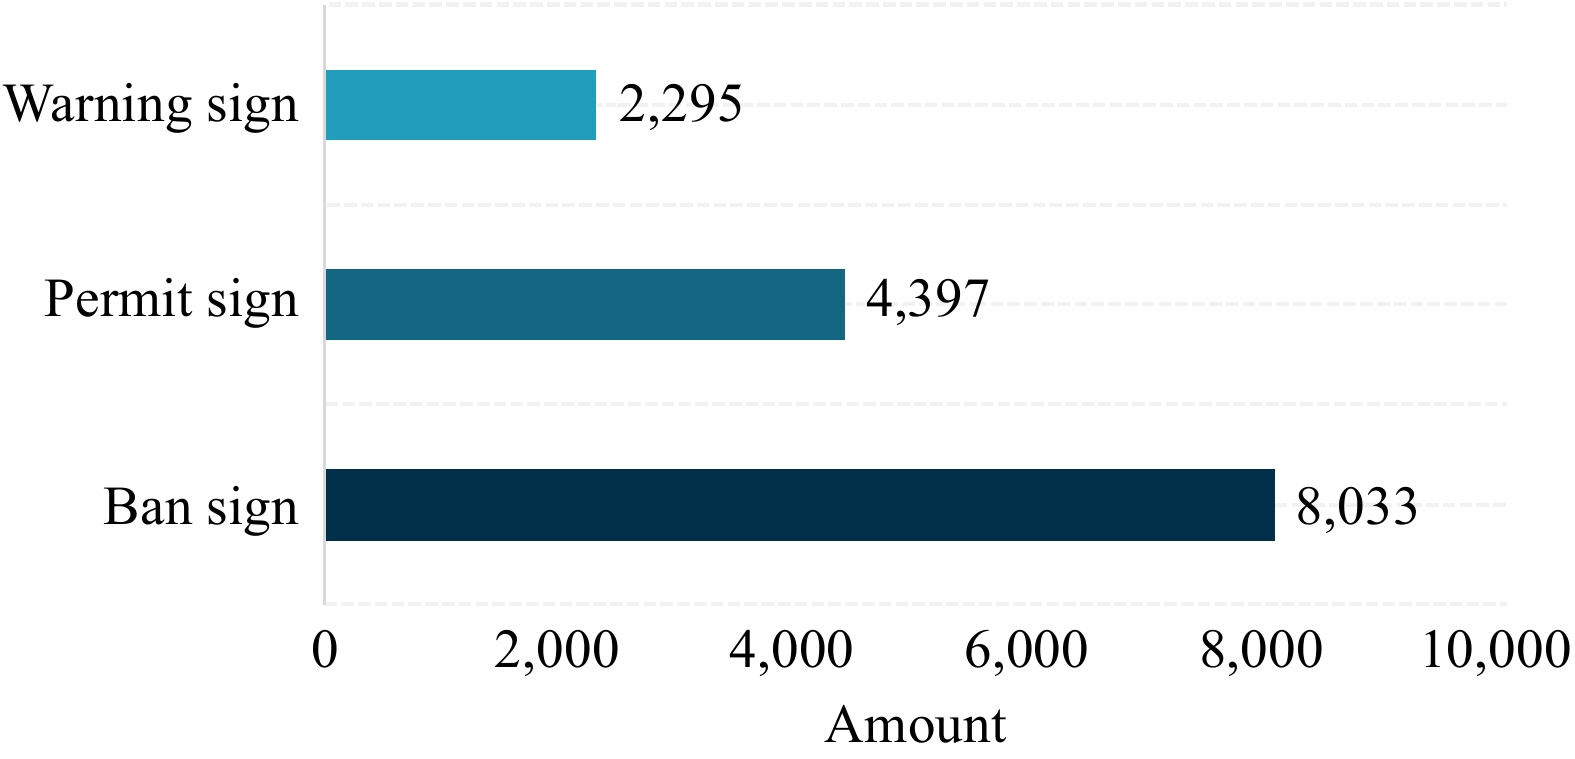
Figure 6.
Number of traffic signs for each category.
-
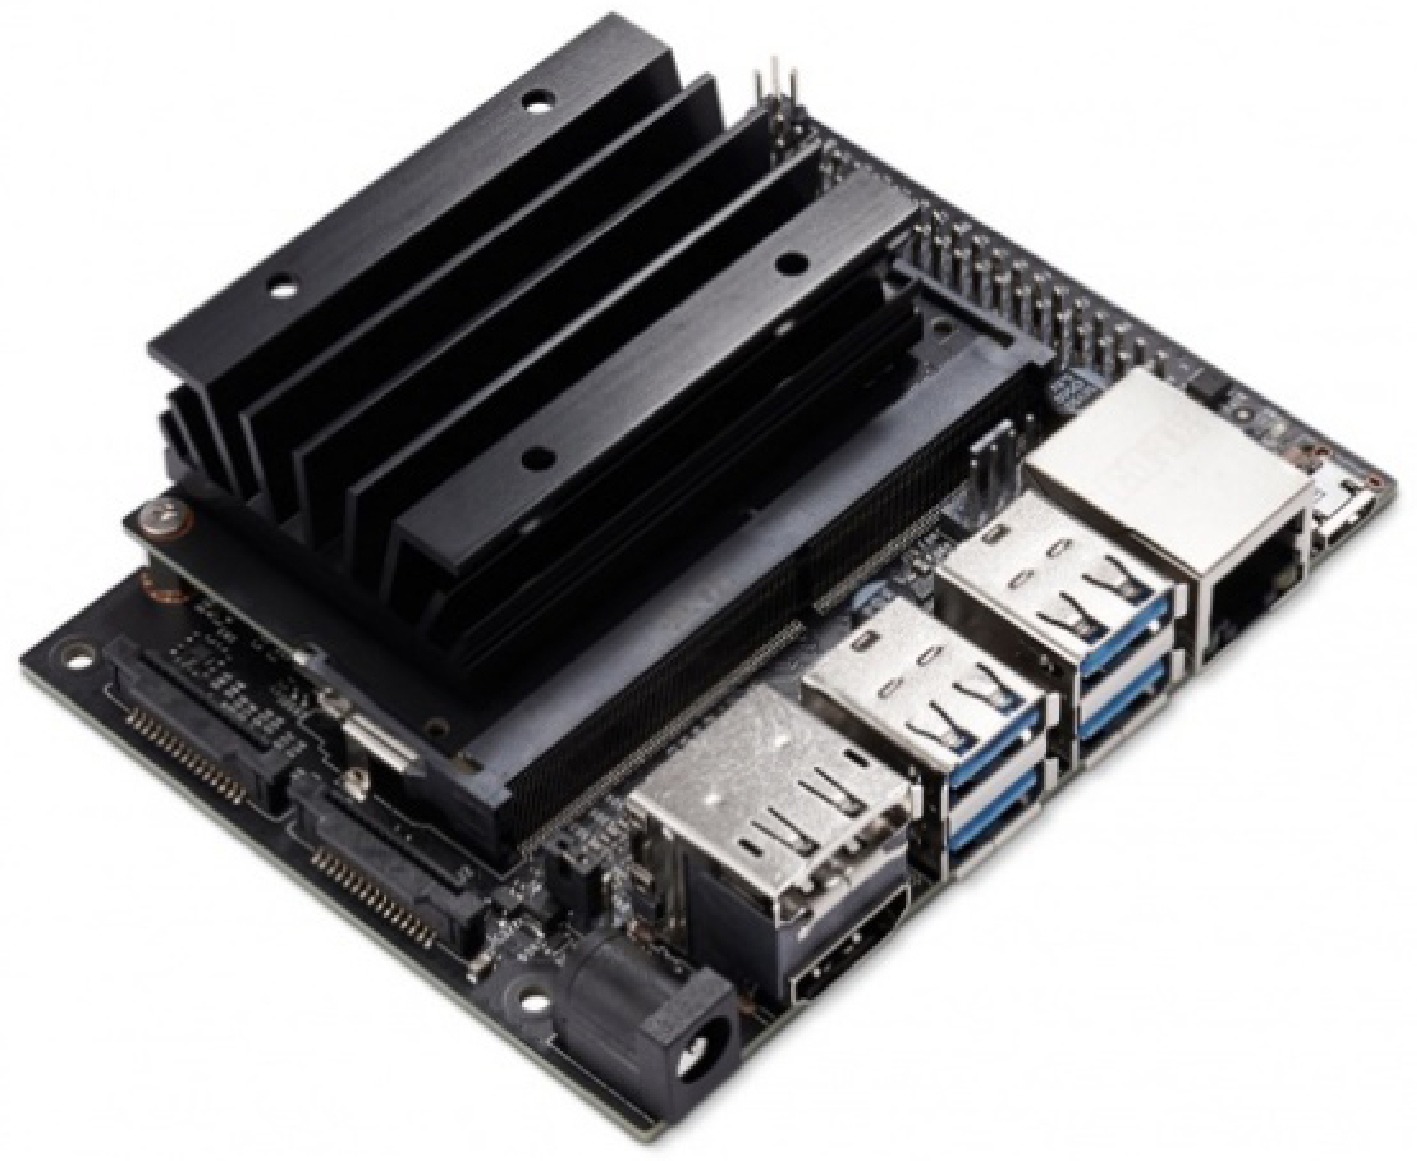
Figure 7.
Structure of Jetson Nano.
-
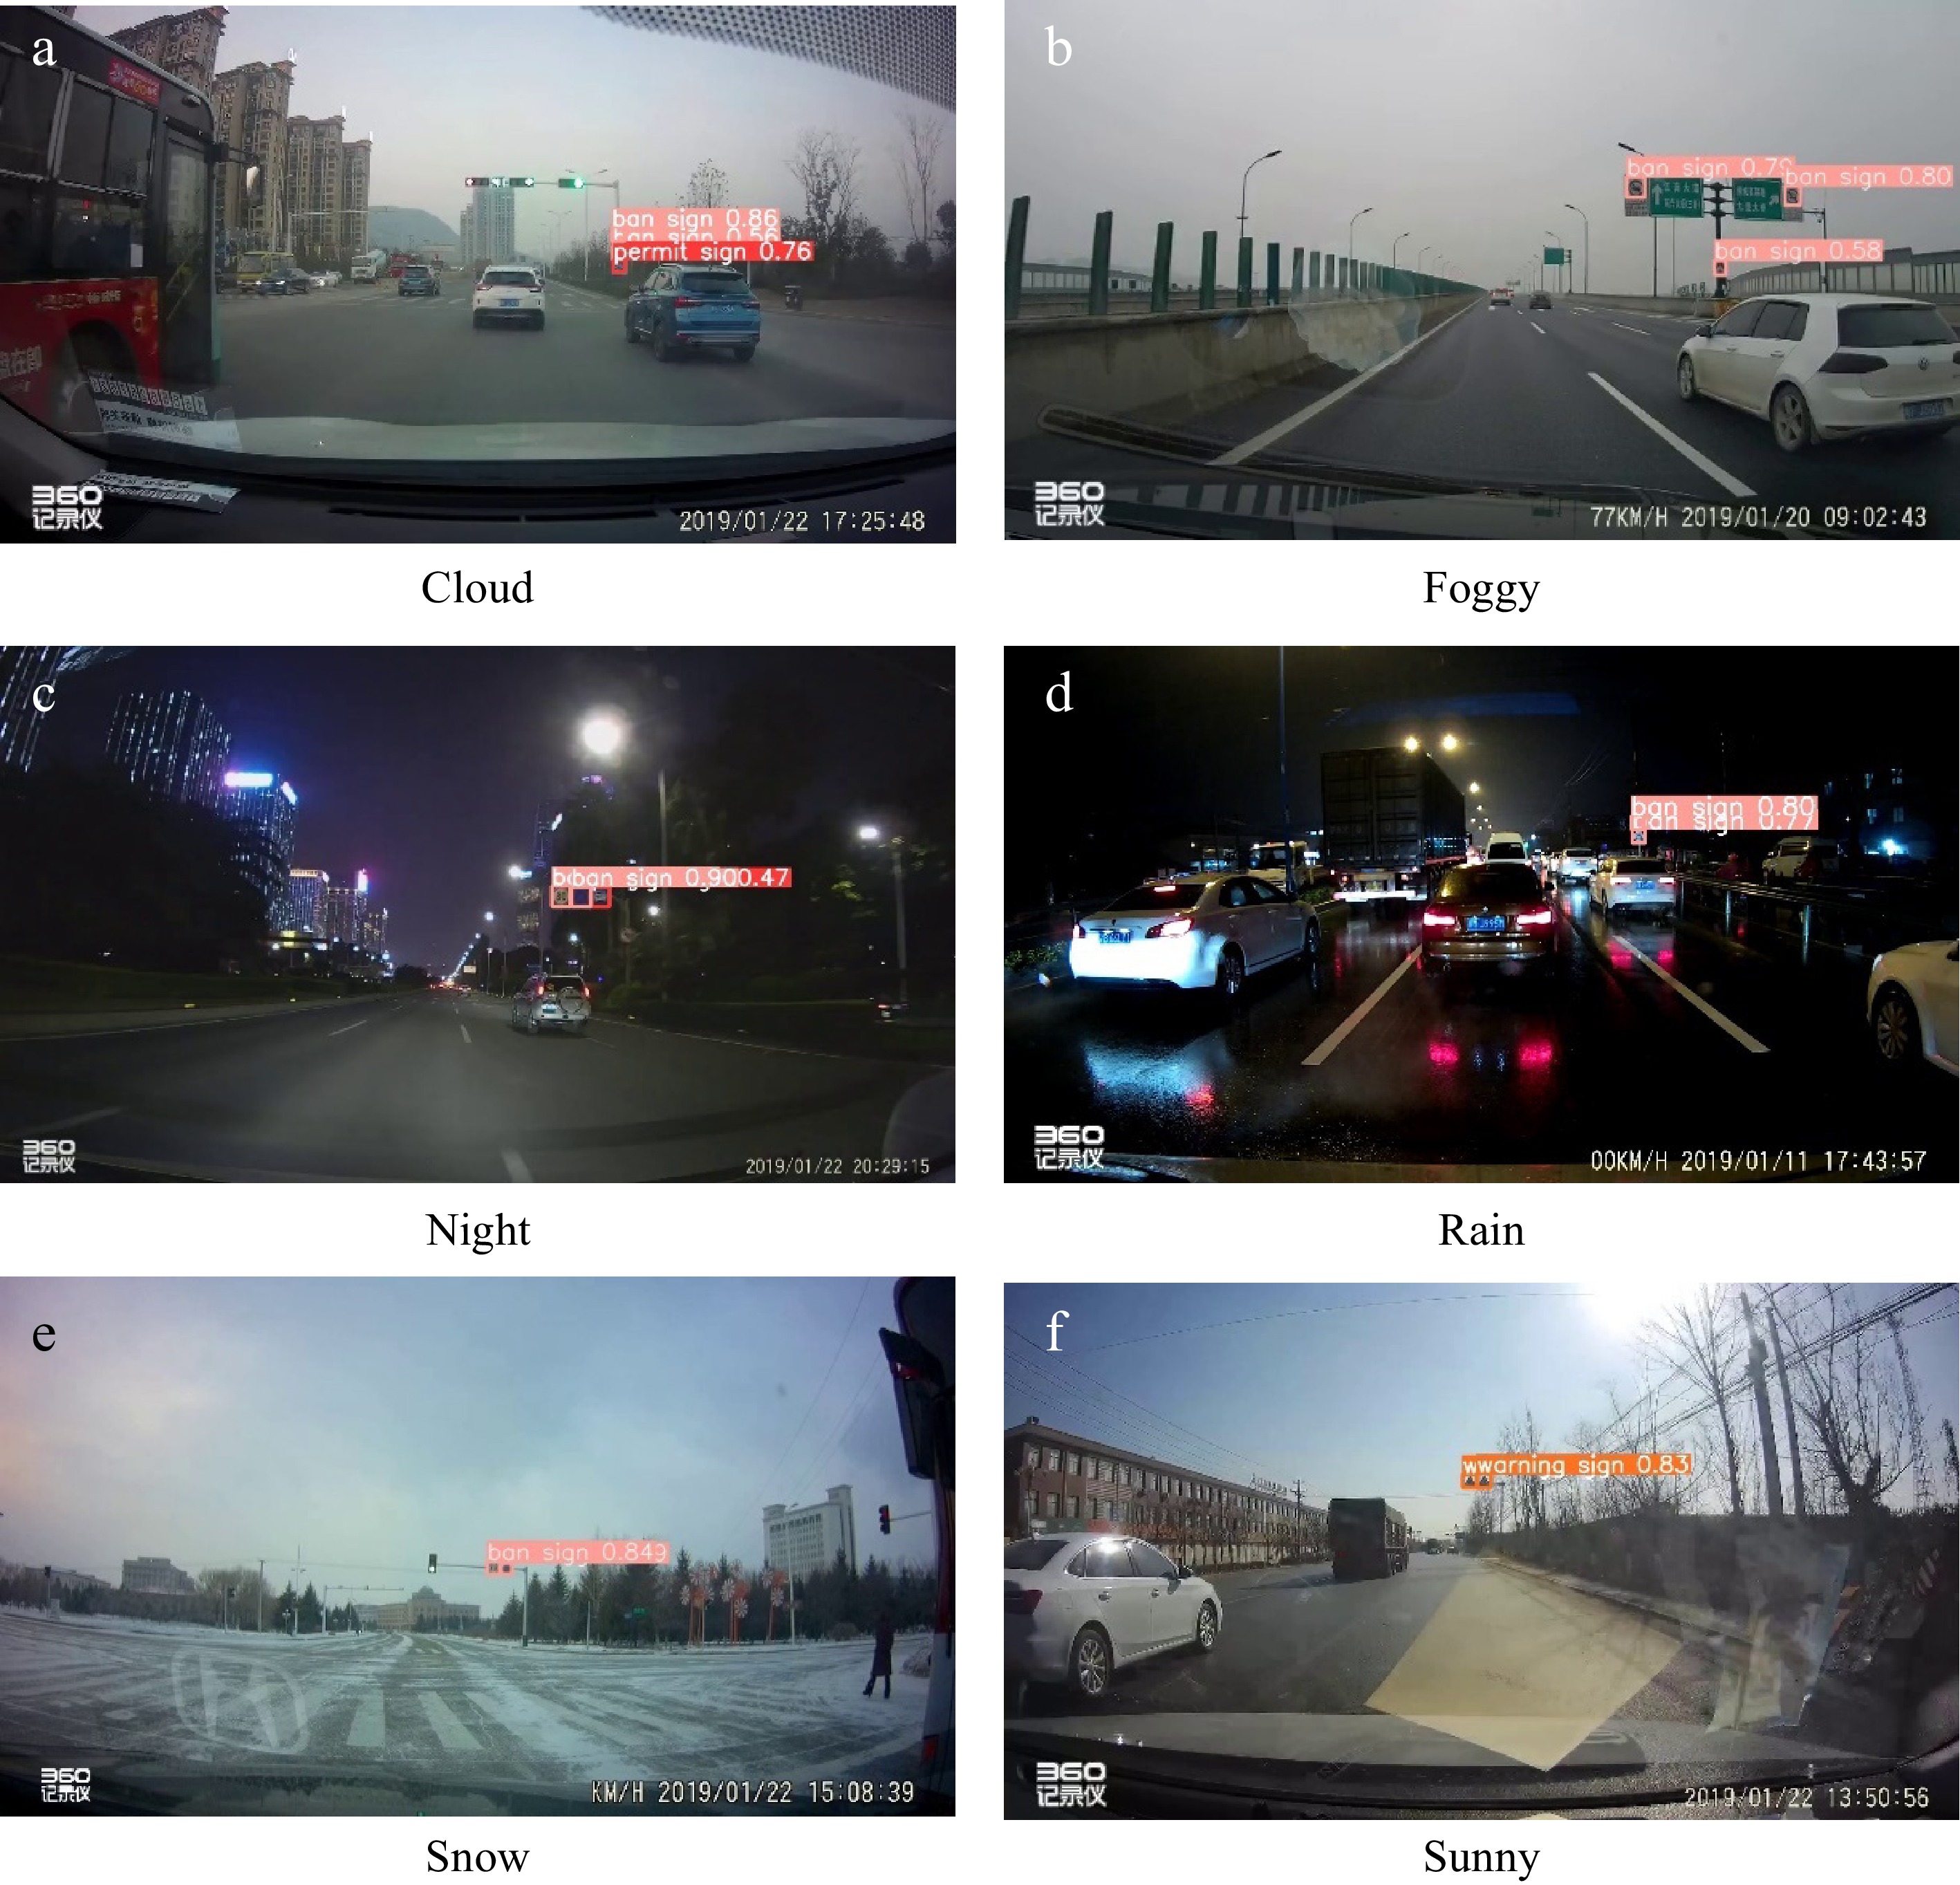
Figure 8.
Detection results of YOLOv8-CE under different weather test sets.
-
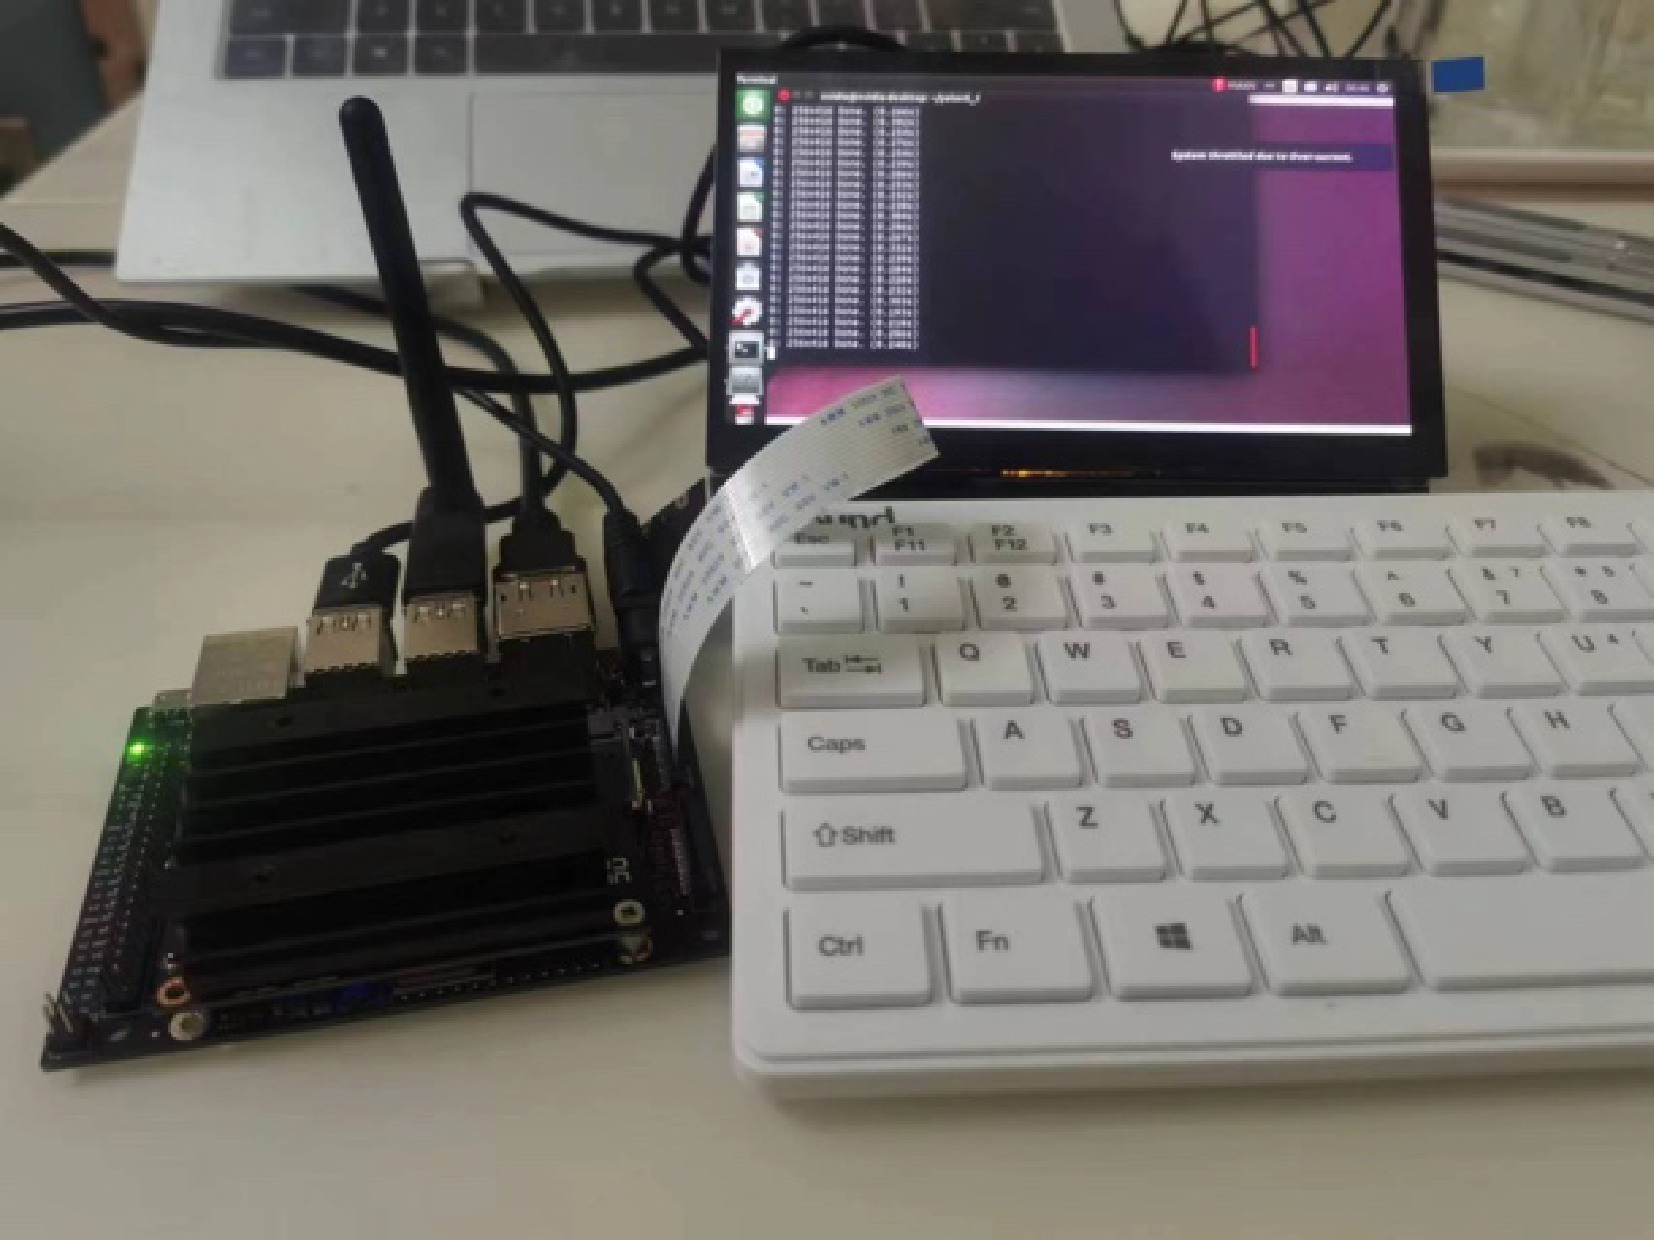
Figure 9.
Hardware system of Jetson Nano.
-
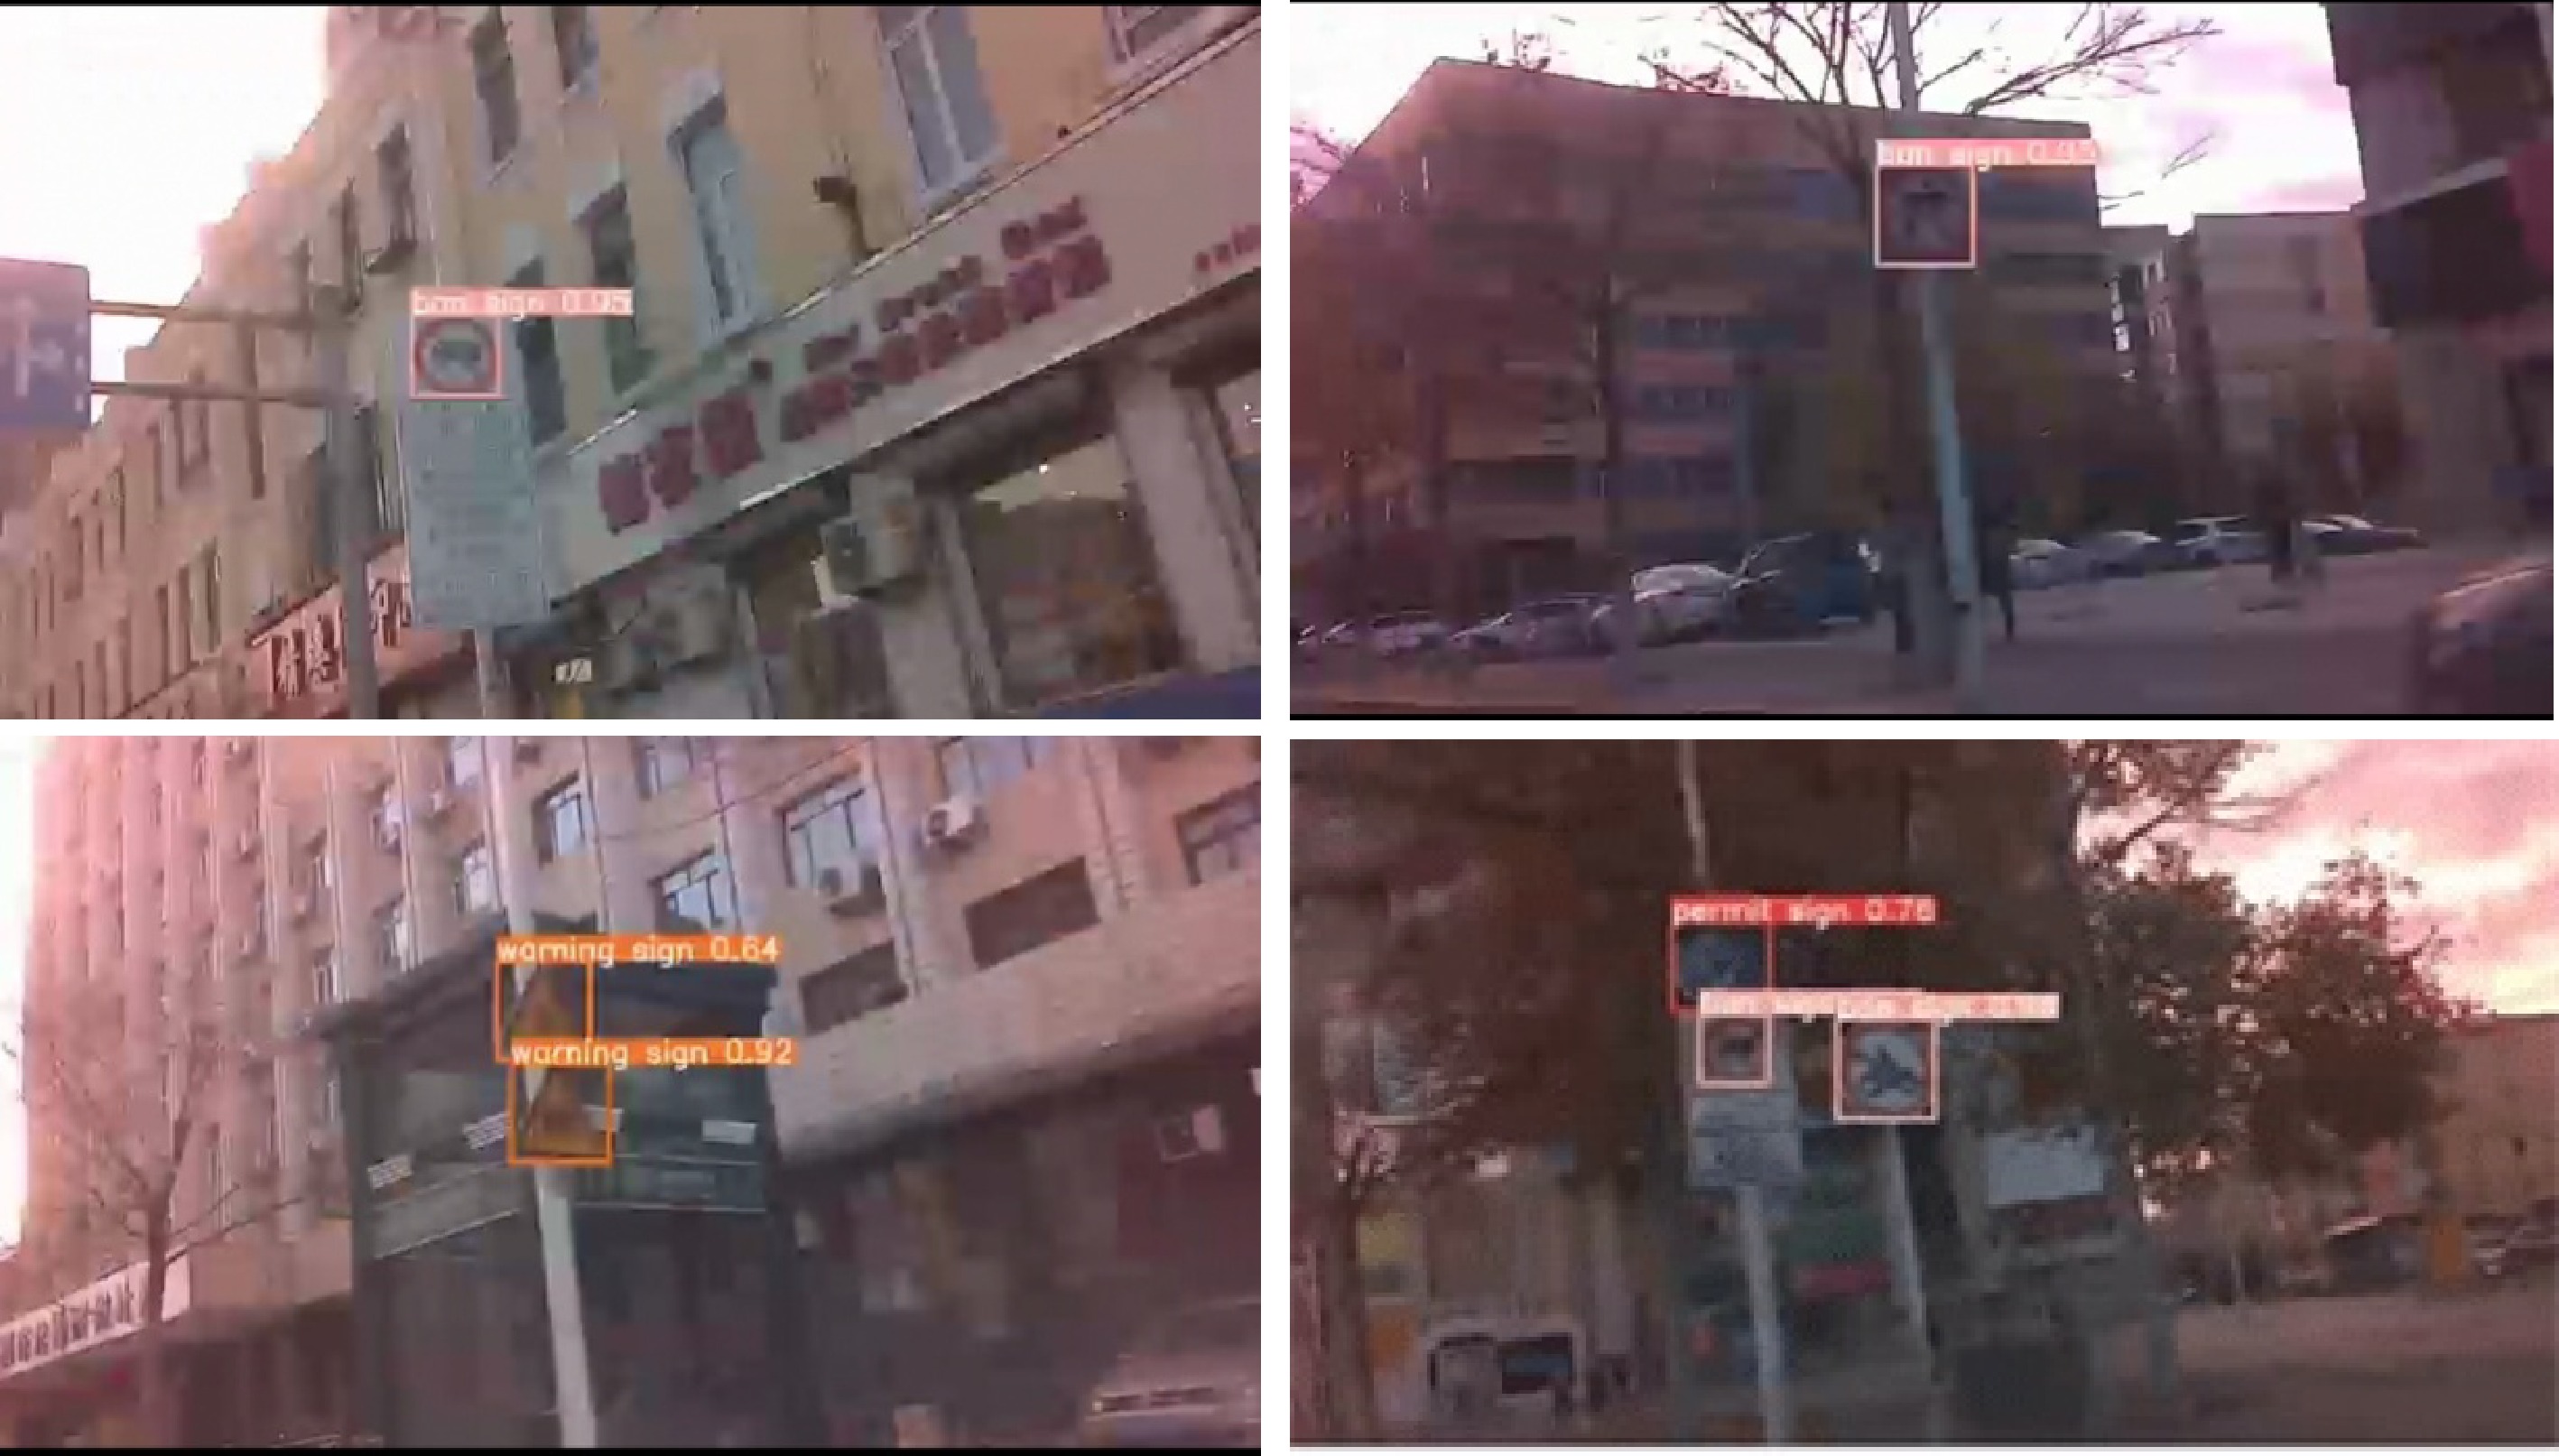
Figure 10.
Field test on Jetson Nano in Harbin, China.
-
Parameter Technical specifications AI performance 472 GFLOPs GPU 128-core Maxwell Memory 4 GB 64-bit LPDDR4 25.6 GB/s CPU Quad-core ARM A57 @ 1.43 GHz CPU max frequency 1.43 GHz Storage microSD (not included) Connectivity Gigabit Ethernet, M.2 Key E USB 4x USB 3.0, USB 2.0 Micro-B Power 5 W - 1 0W Table 1.
Hardware parameters of Jetson Nano.
-
Model Precision Recall mAP@0.5 YOLOv8n 88.7% 73.6% 83.3% CA 89.6% 75.4% 84.9% EIoU 87.9% 75.1% 84.5% CA + EIoU 90.2% 78.1% 86.1% Table 2.
Results of the ablation study.
-
Model Precision Recall mAP@50 mAP@50-95 Inference time (ms) YOLOv8-CE(ours) 90.2 78.1 86.1 57.2 96 YOLOv8n 88.7 73.6 83.3 53.7 92 YOLOv8-ghost 89.2 72.5 82.1 52.1 243 YOLOv8-ghostv2 89.1 71.6 82.2 52.5 230 YOLOv8-shufflenetv2 81.1 53.6 61.8 61.8 110 YOLOv8-mobilenetv3 73.4 54.6 61.4 35.7 65 Table 3.
Comparison of traffic sign detection models.
-
Model Orinal Cloud Foggy Night Rain Snow Sunny YOLOv8-CE(ours) 86.1 92.5 81.6 76.5 43.1 86.5 94.8 YOLOv8n 83.3 89.5 68.3 73.8 32.7 77.8 93.2 YOLOv8-ghost 82.1 88.8 77.9 75.5 29.8 82.5 91.3 YOLOv8-ghostv2 81.9 89.2 63.9 73.0 39.9 70.0 91.3 YOLOv8-shufflenetv2 61.4 74.9 53.7 40.6 10.8 45.7 80.0 YOLOv8-mobilenetv3 61.8 75.9 55.2 40.6 16.9 58.6 77.6 Table 4.
Comparison of traffic sign detection models under different weather test sets.
-
Model FLOPs
(G)Weight size
(MB)Inference time (ms) Jetson Nano Raspberry pi 4B YOLOv8-CE(ours) 8.1 5.99 96 690 YOLOv8n 8.1 5.96 92 678 YOLOv8-ghost 6.8 5.97 243 810 YOLOv8-ghostv2 6.8 5.17 230 791 YOLOv8-shufflenetv2 5.0 3.48 110 580 YOLOv8-mobilenetv3 2.8 2.52 65 313 Table 5.
Experiments on different devices.
Figures
(10)
Tables
(5)