-
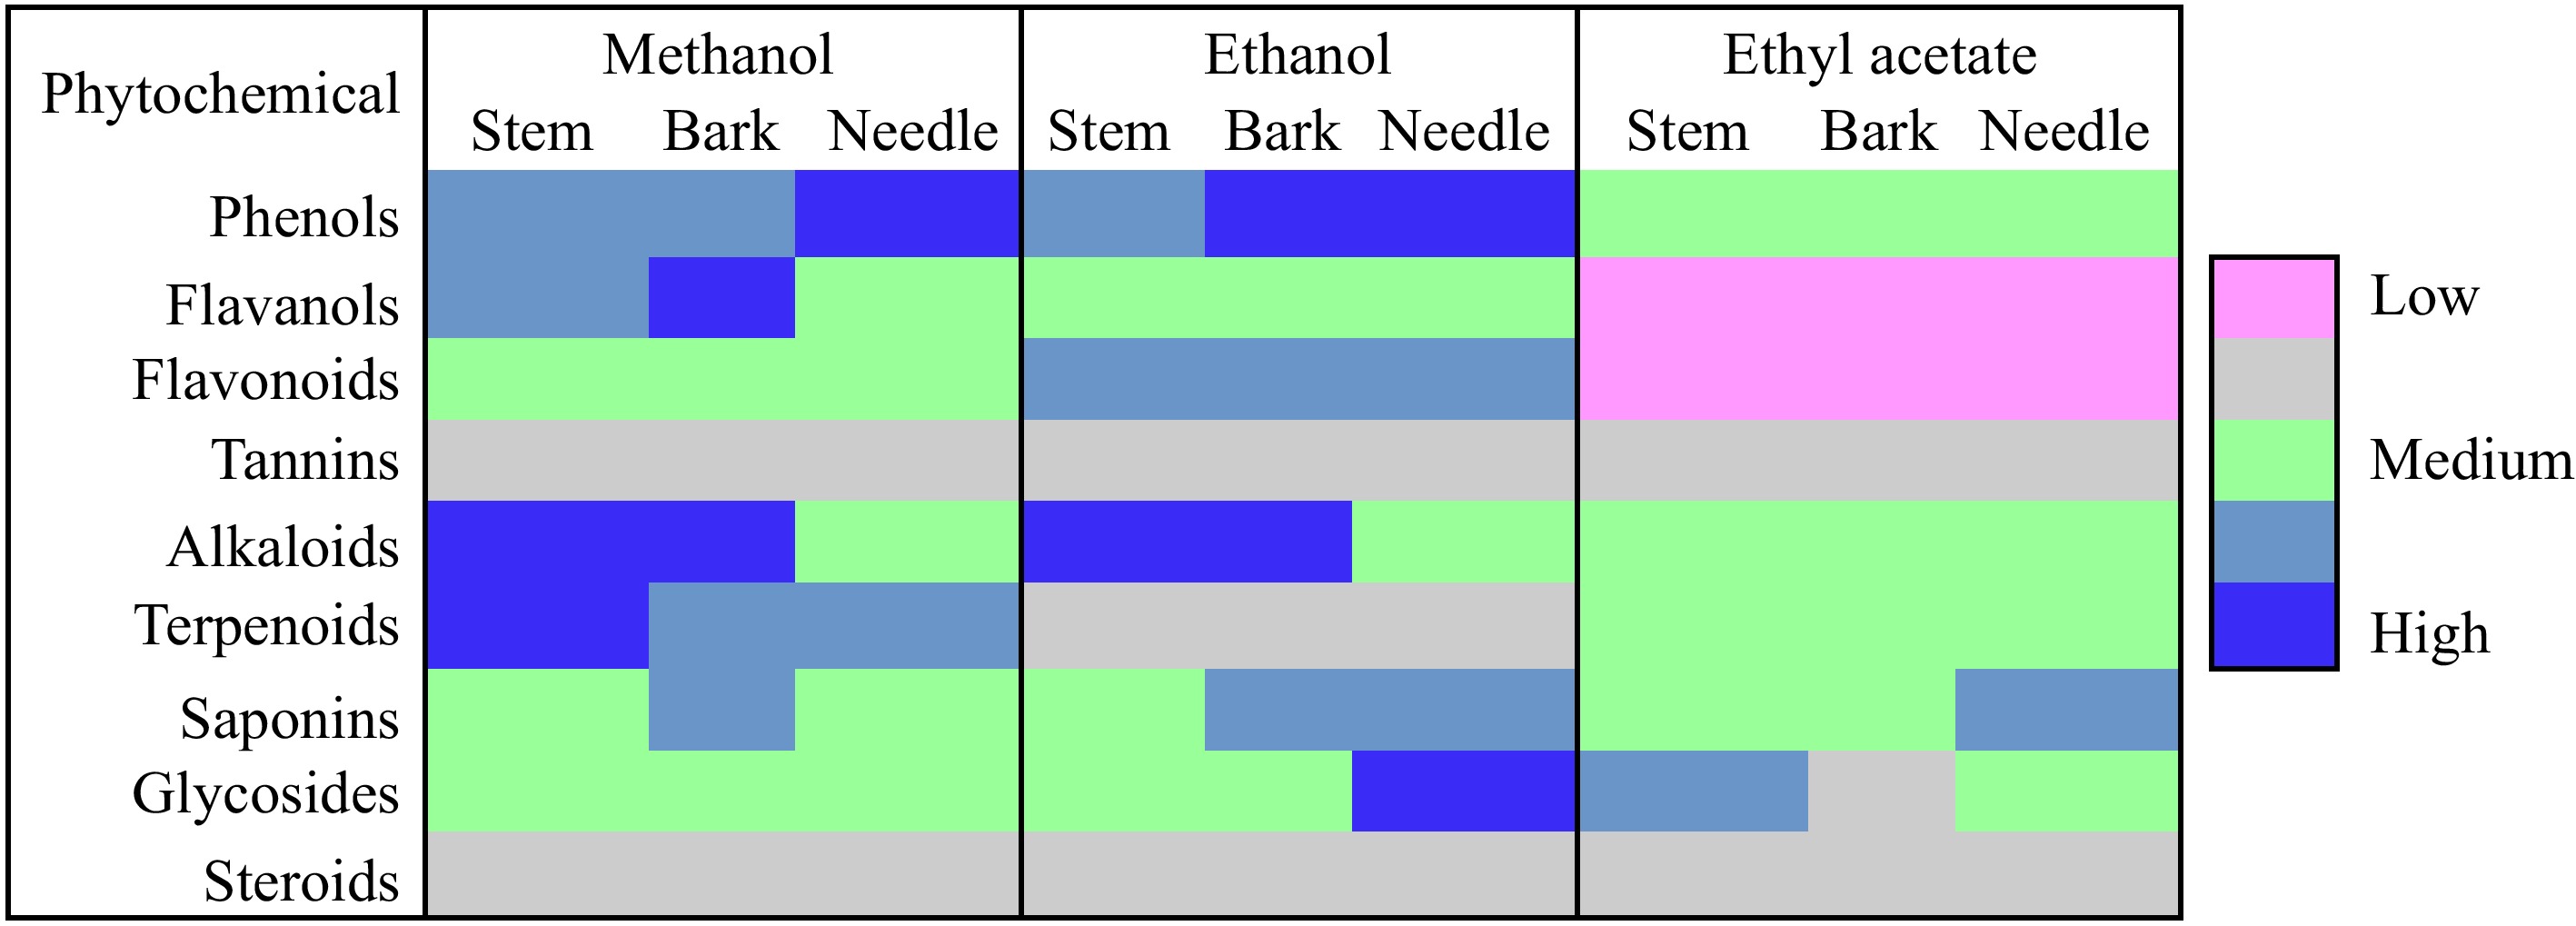
Figure 1.
Qualitative phytochemical screening for stem, bark, and needle extracts.
-

Figure 2.
Total phenolic content, total flavonoids content, and total tannin content of stem, bark, and needle extracts of T. wallichiana.
-
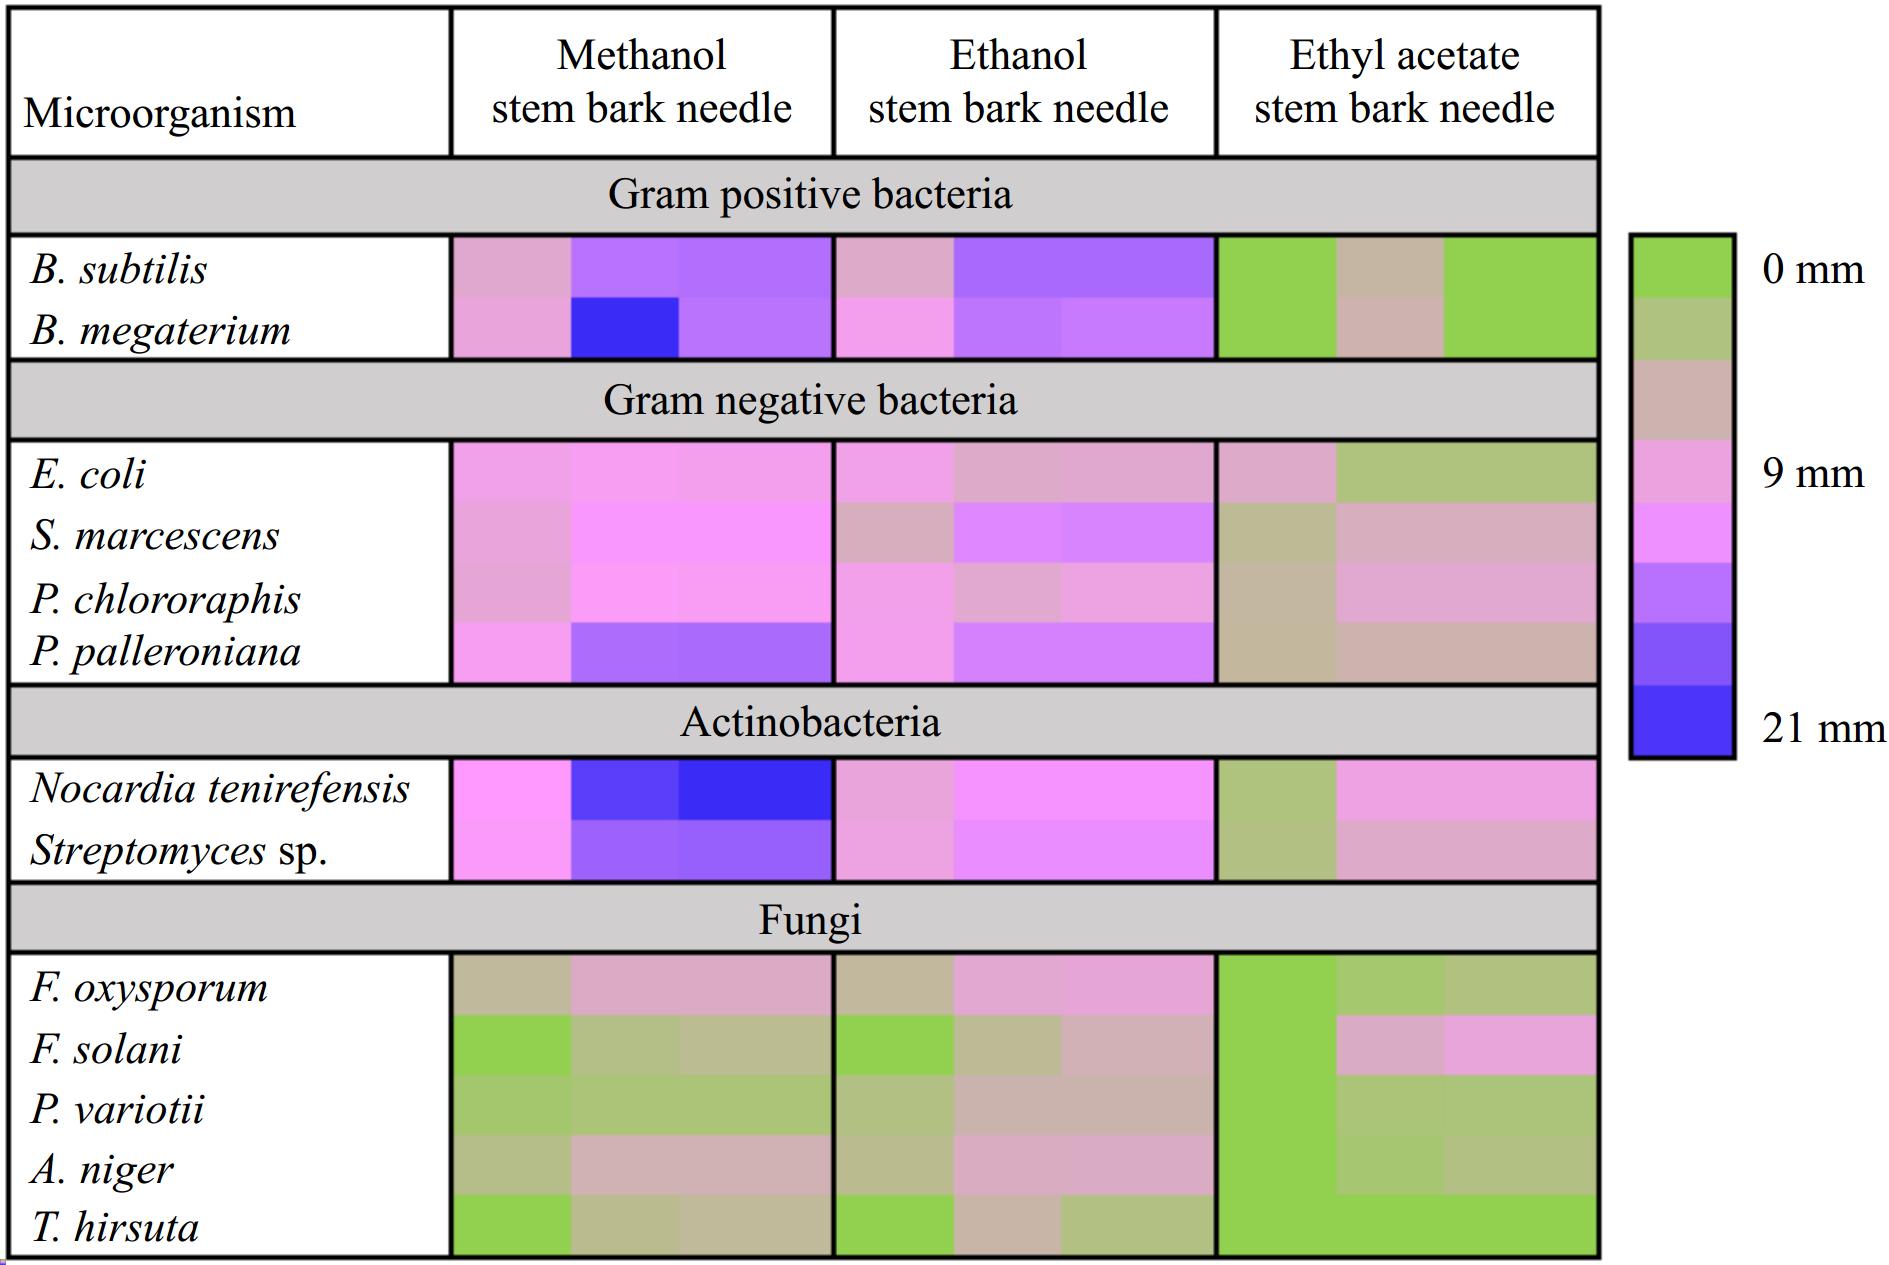
Figure 3.
Heatmap showing preliminary screening of antimicrobial potential (zone of inhibition (mm)) of needle, stem, and bark of T. wallichiana.
-
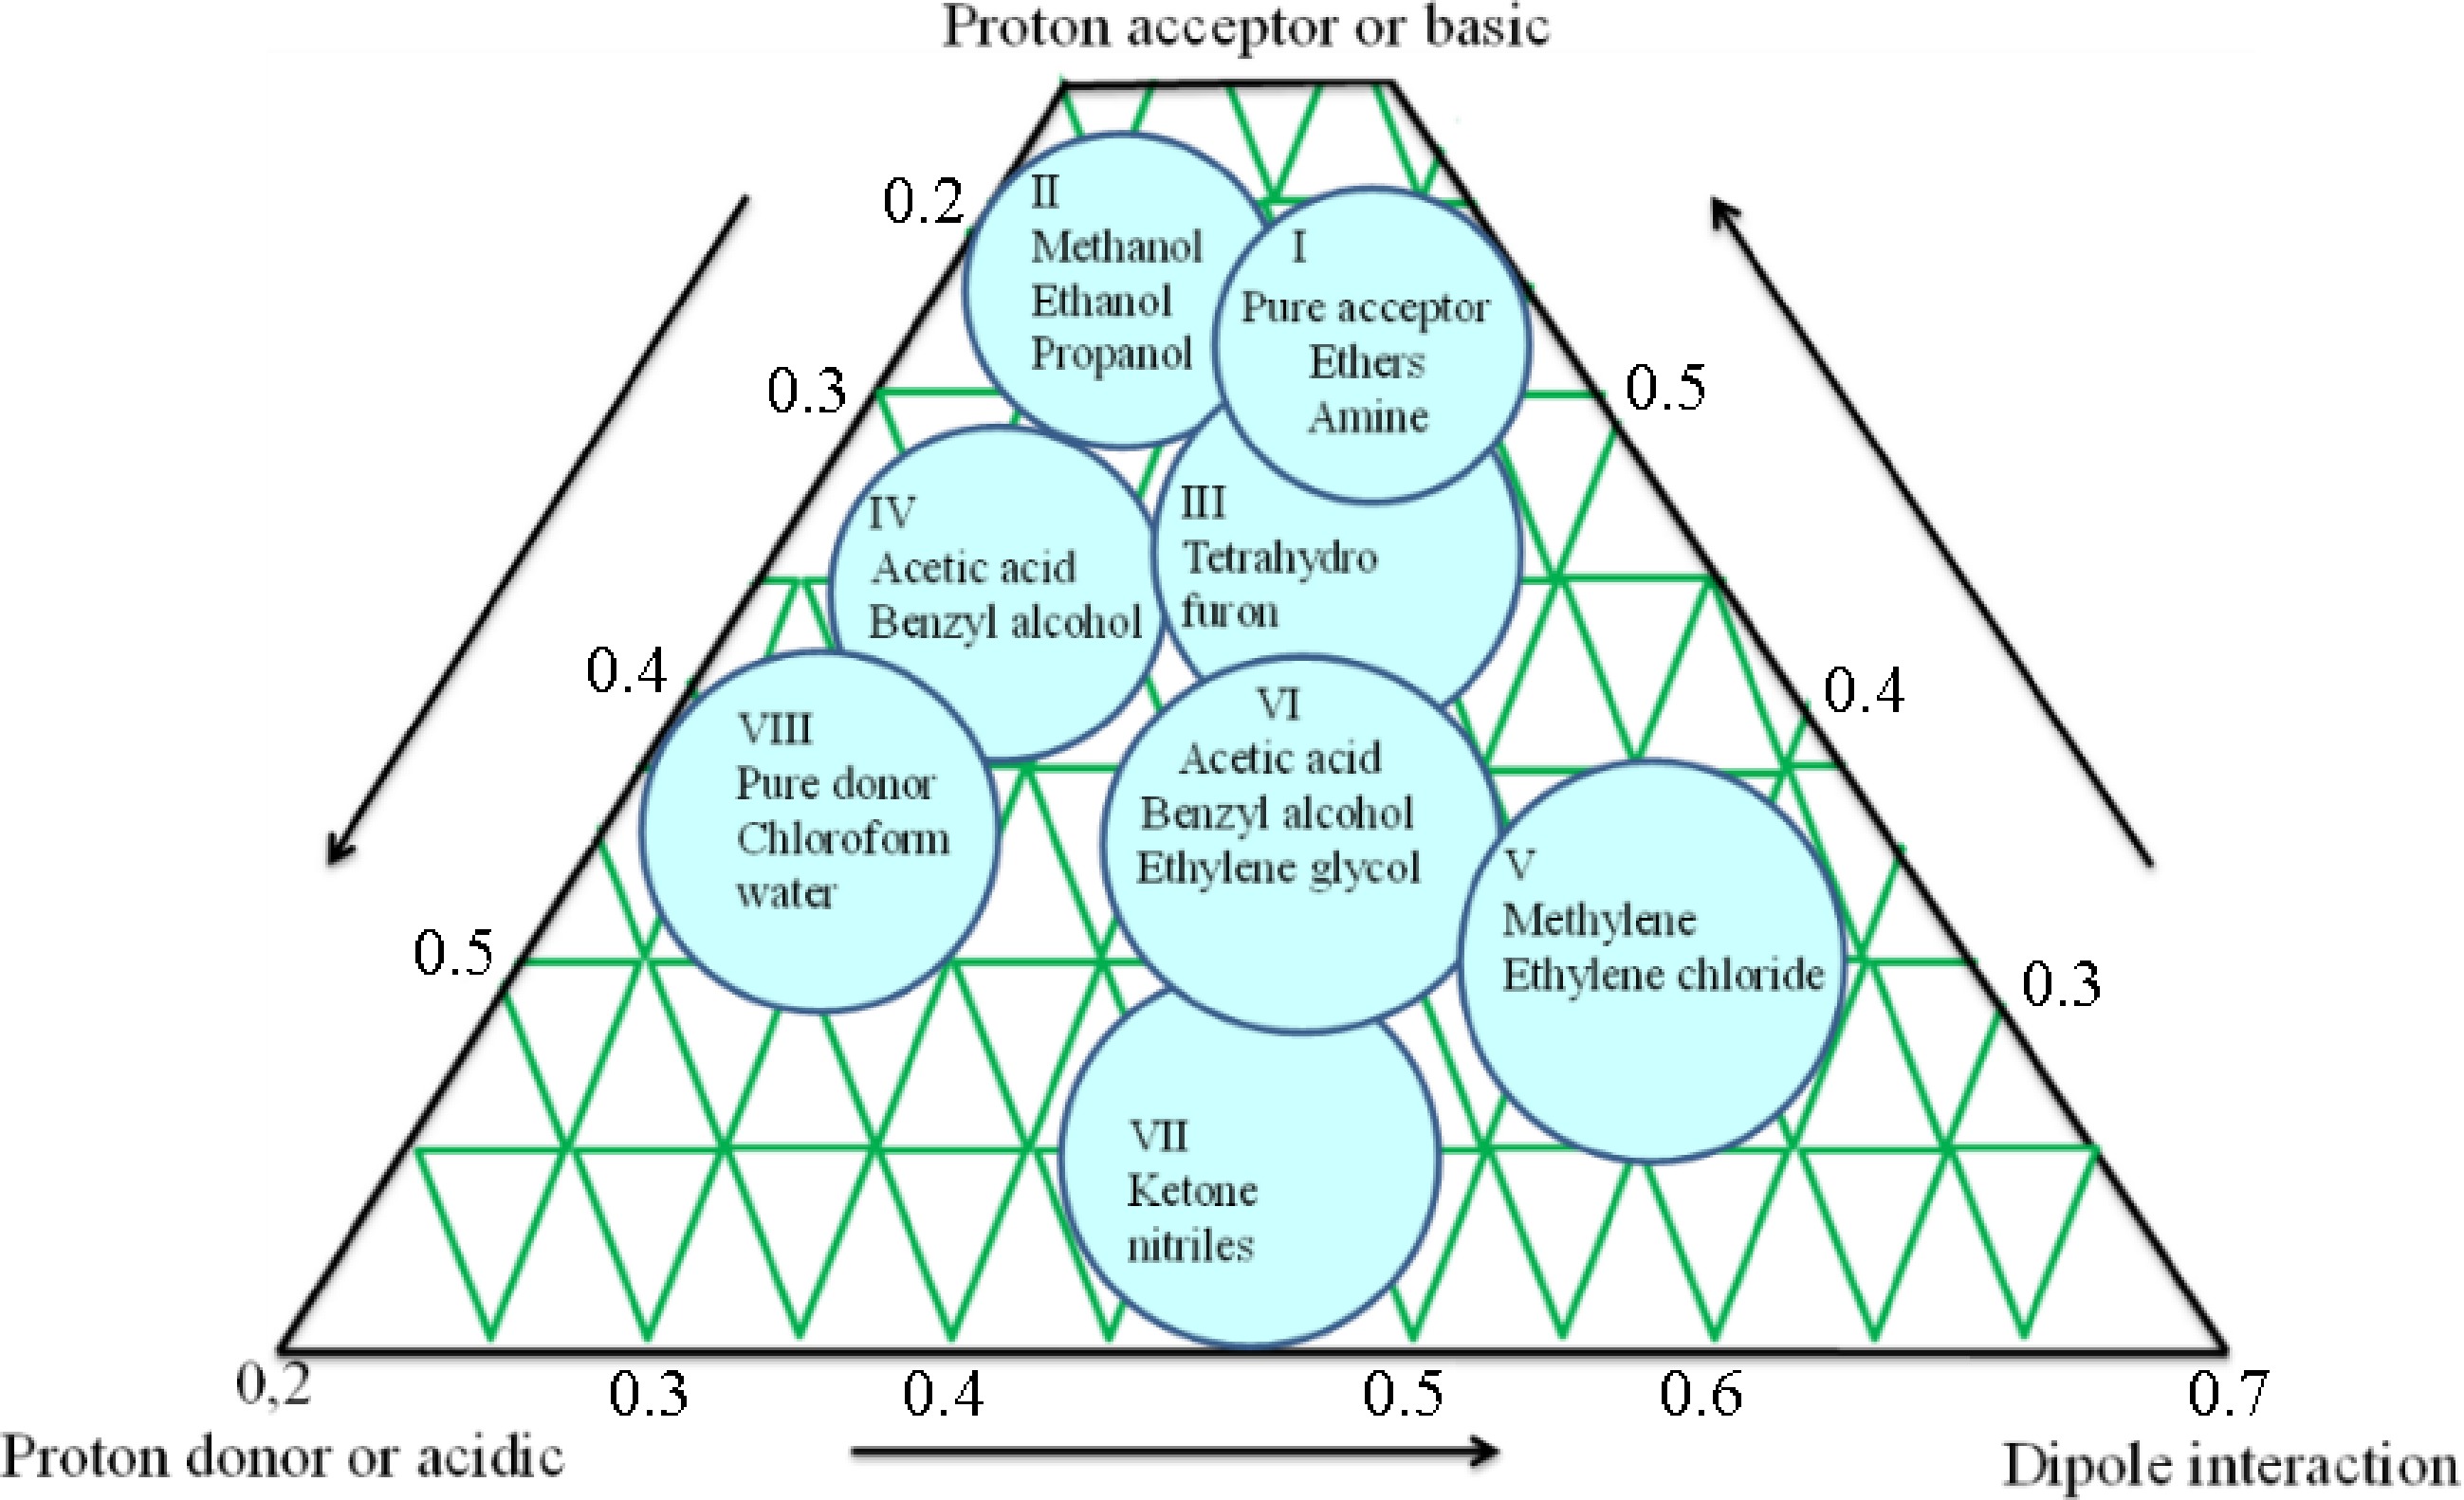
Figure 4.
Schematic diagram of selectivity triangle principle for mobile phase optimization.
-
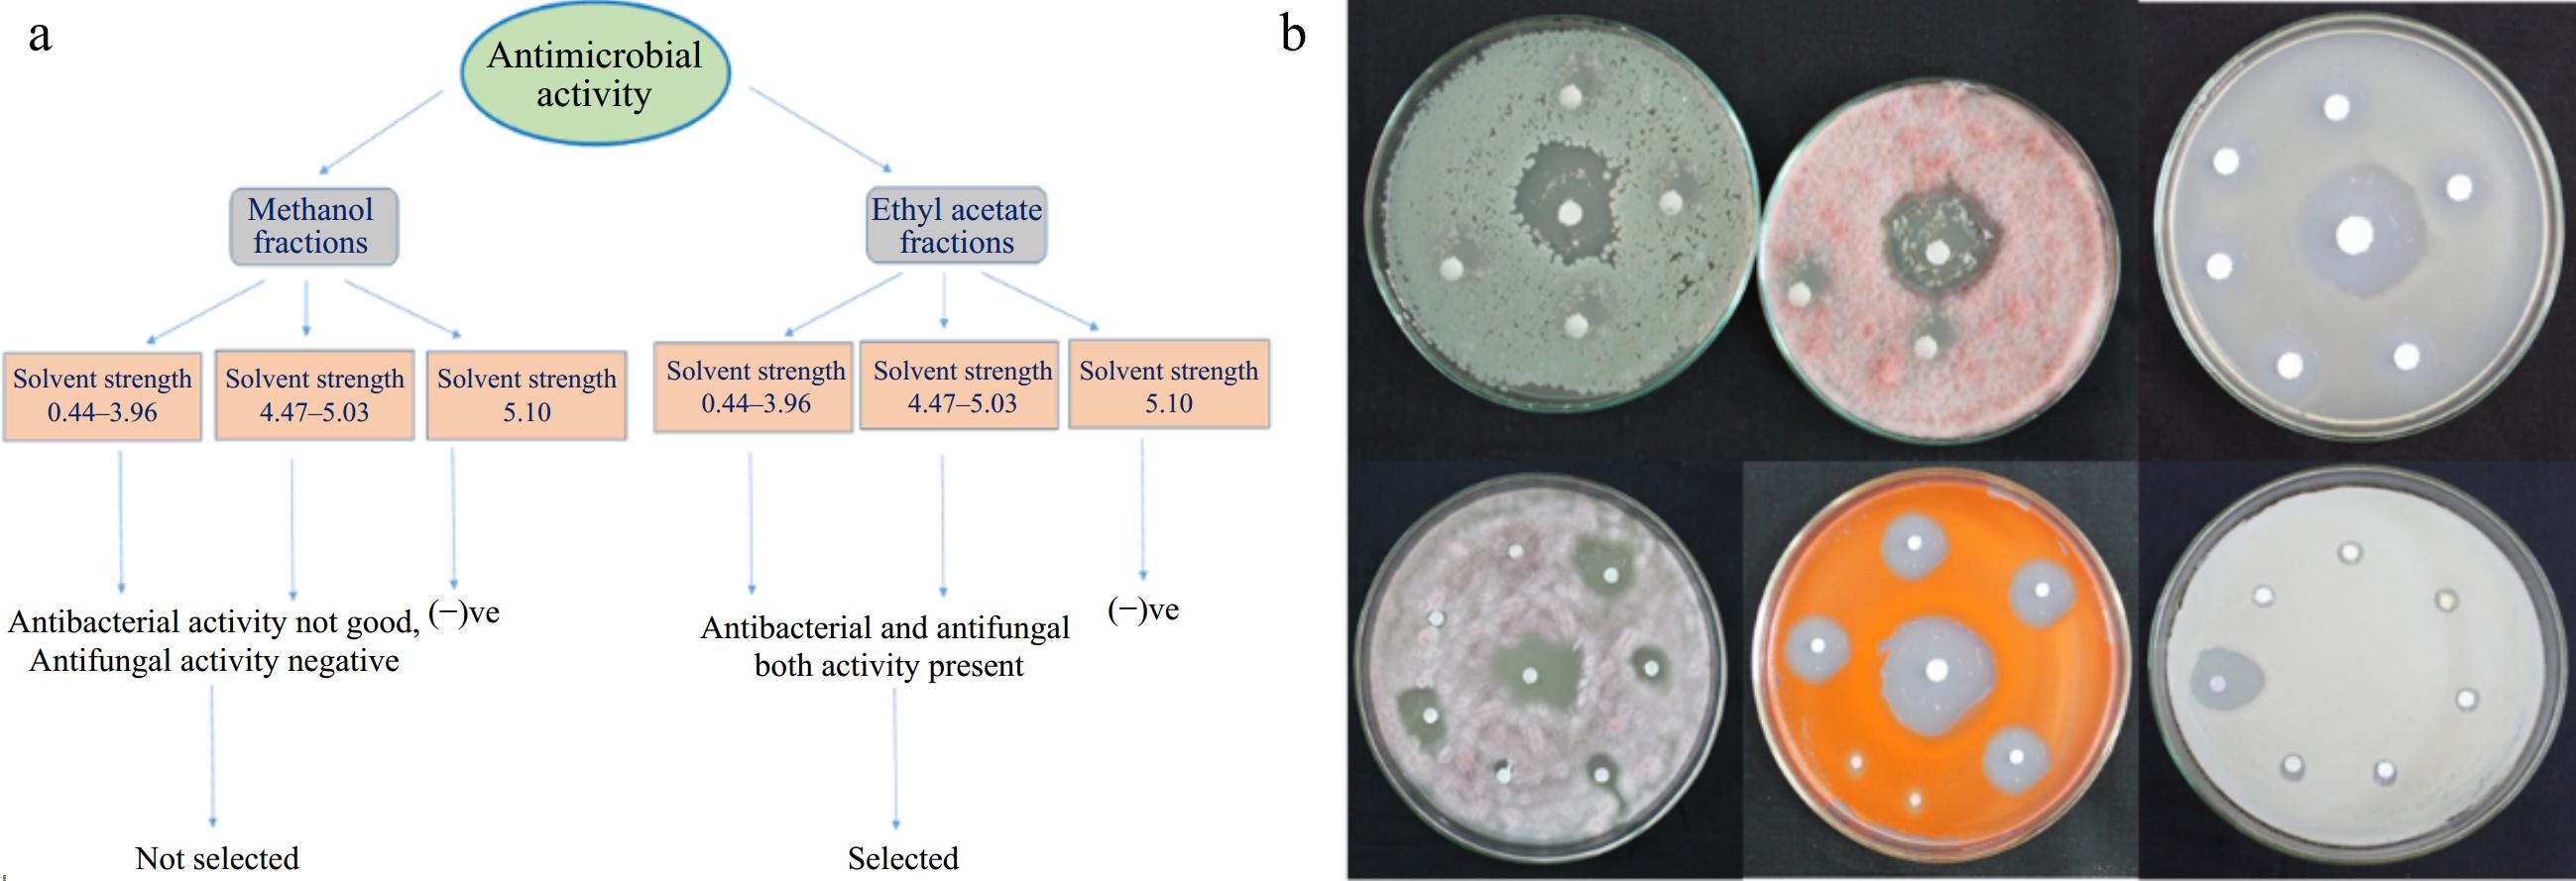
Figure 5.
(a) Schematic representation of different subfractions collected from fractionation of methanol and ethyl acetate fraction of T. wallichiana needle. (b) Antimicrobial activity of collected fractions of ethyl acetate extract through column chromatography.
-
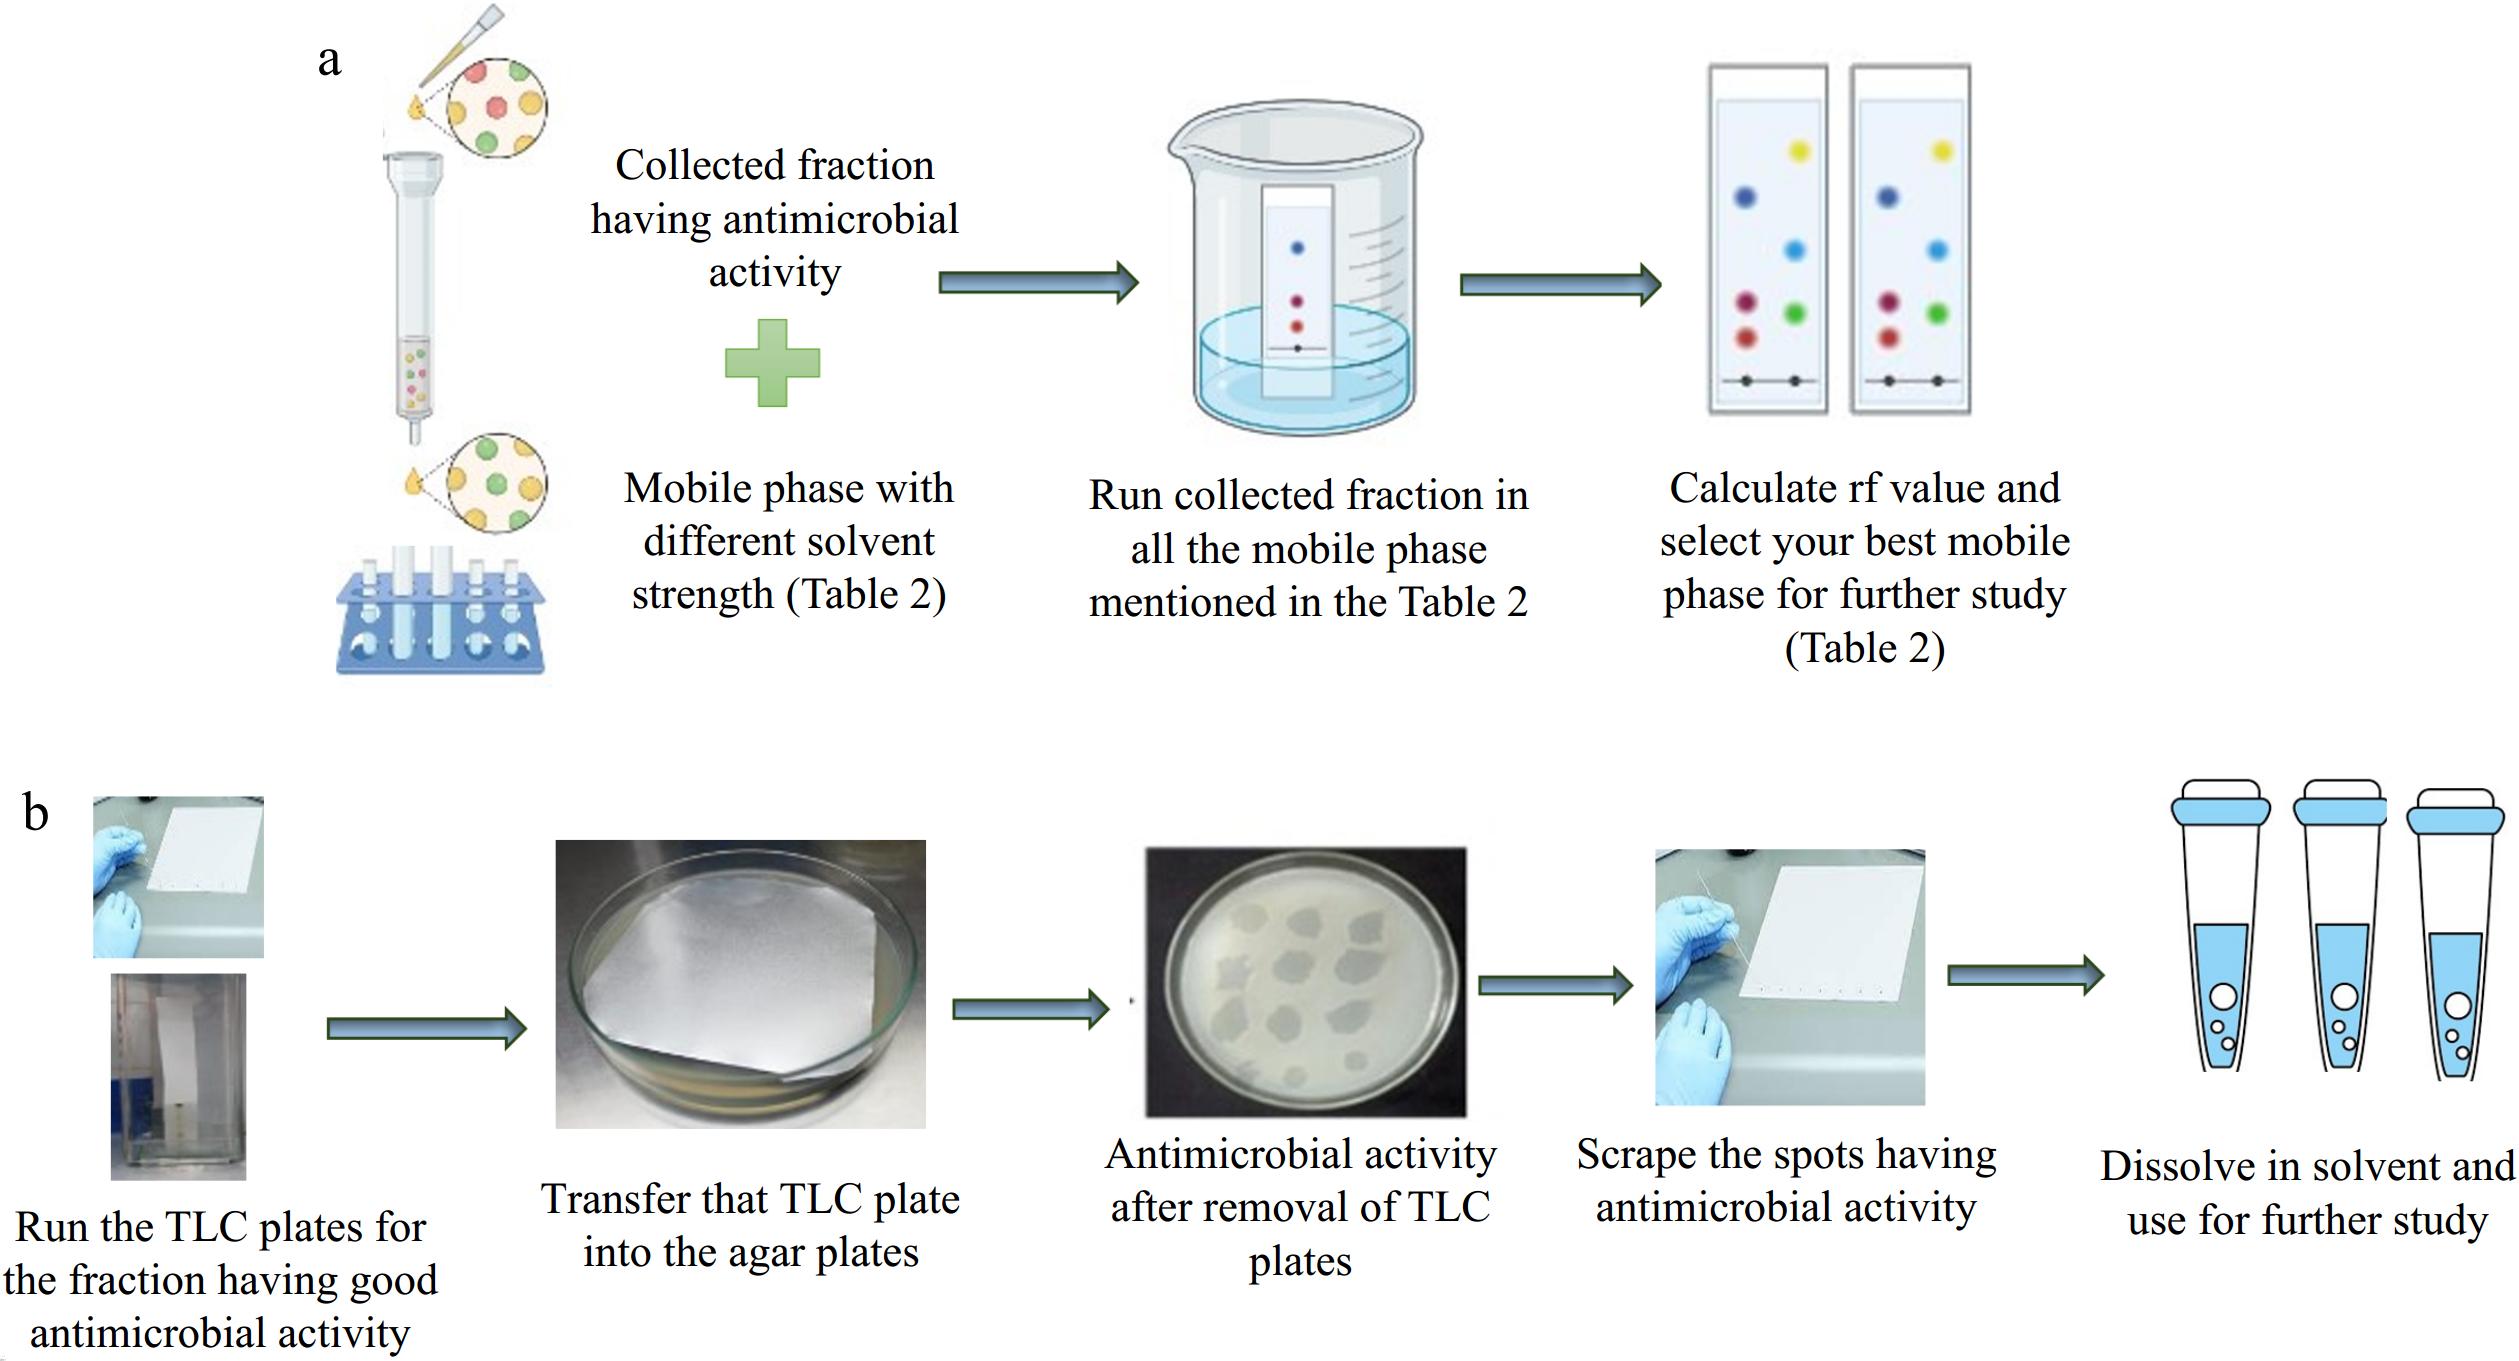
Figure 6.
(a) Schematic diagram for finalizing the mobile phase for the TLC. (b) Schematic diagram for the TLC-bioautography.
-
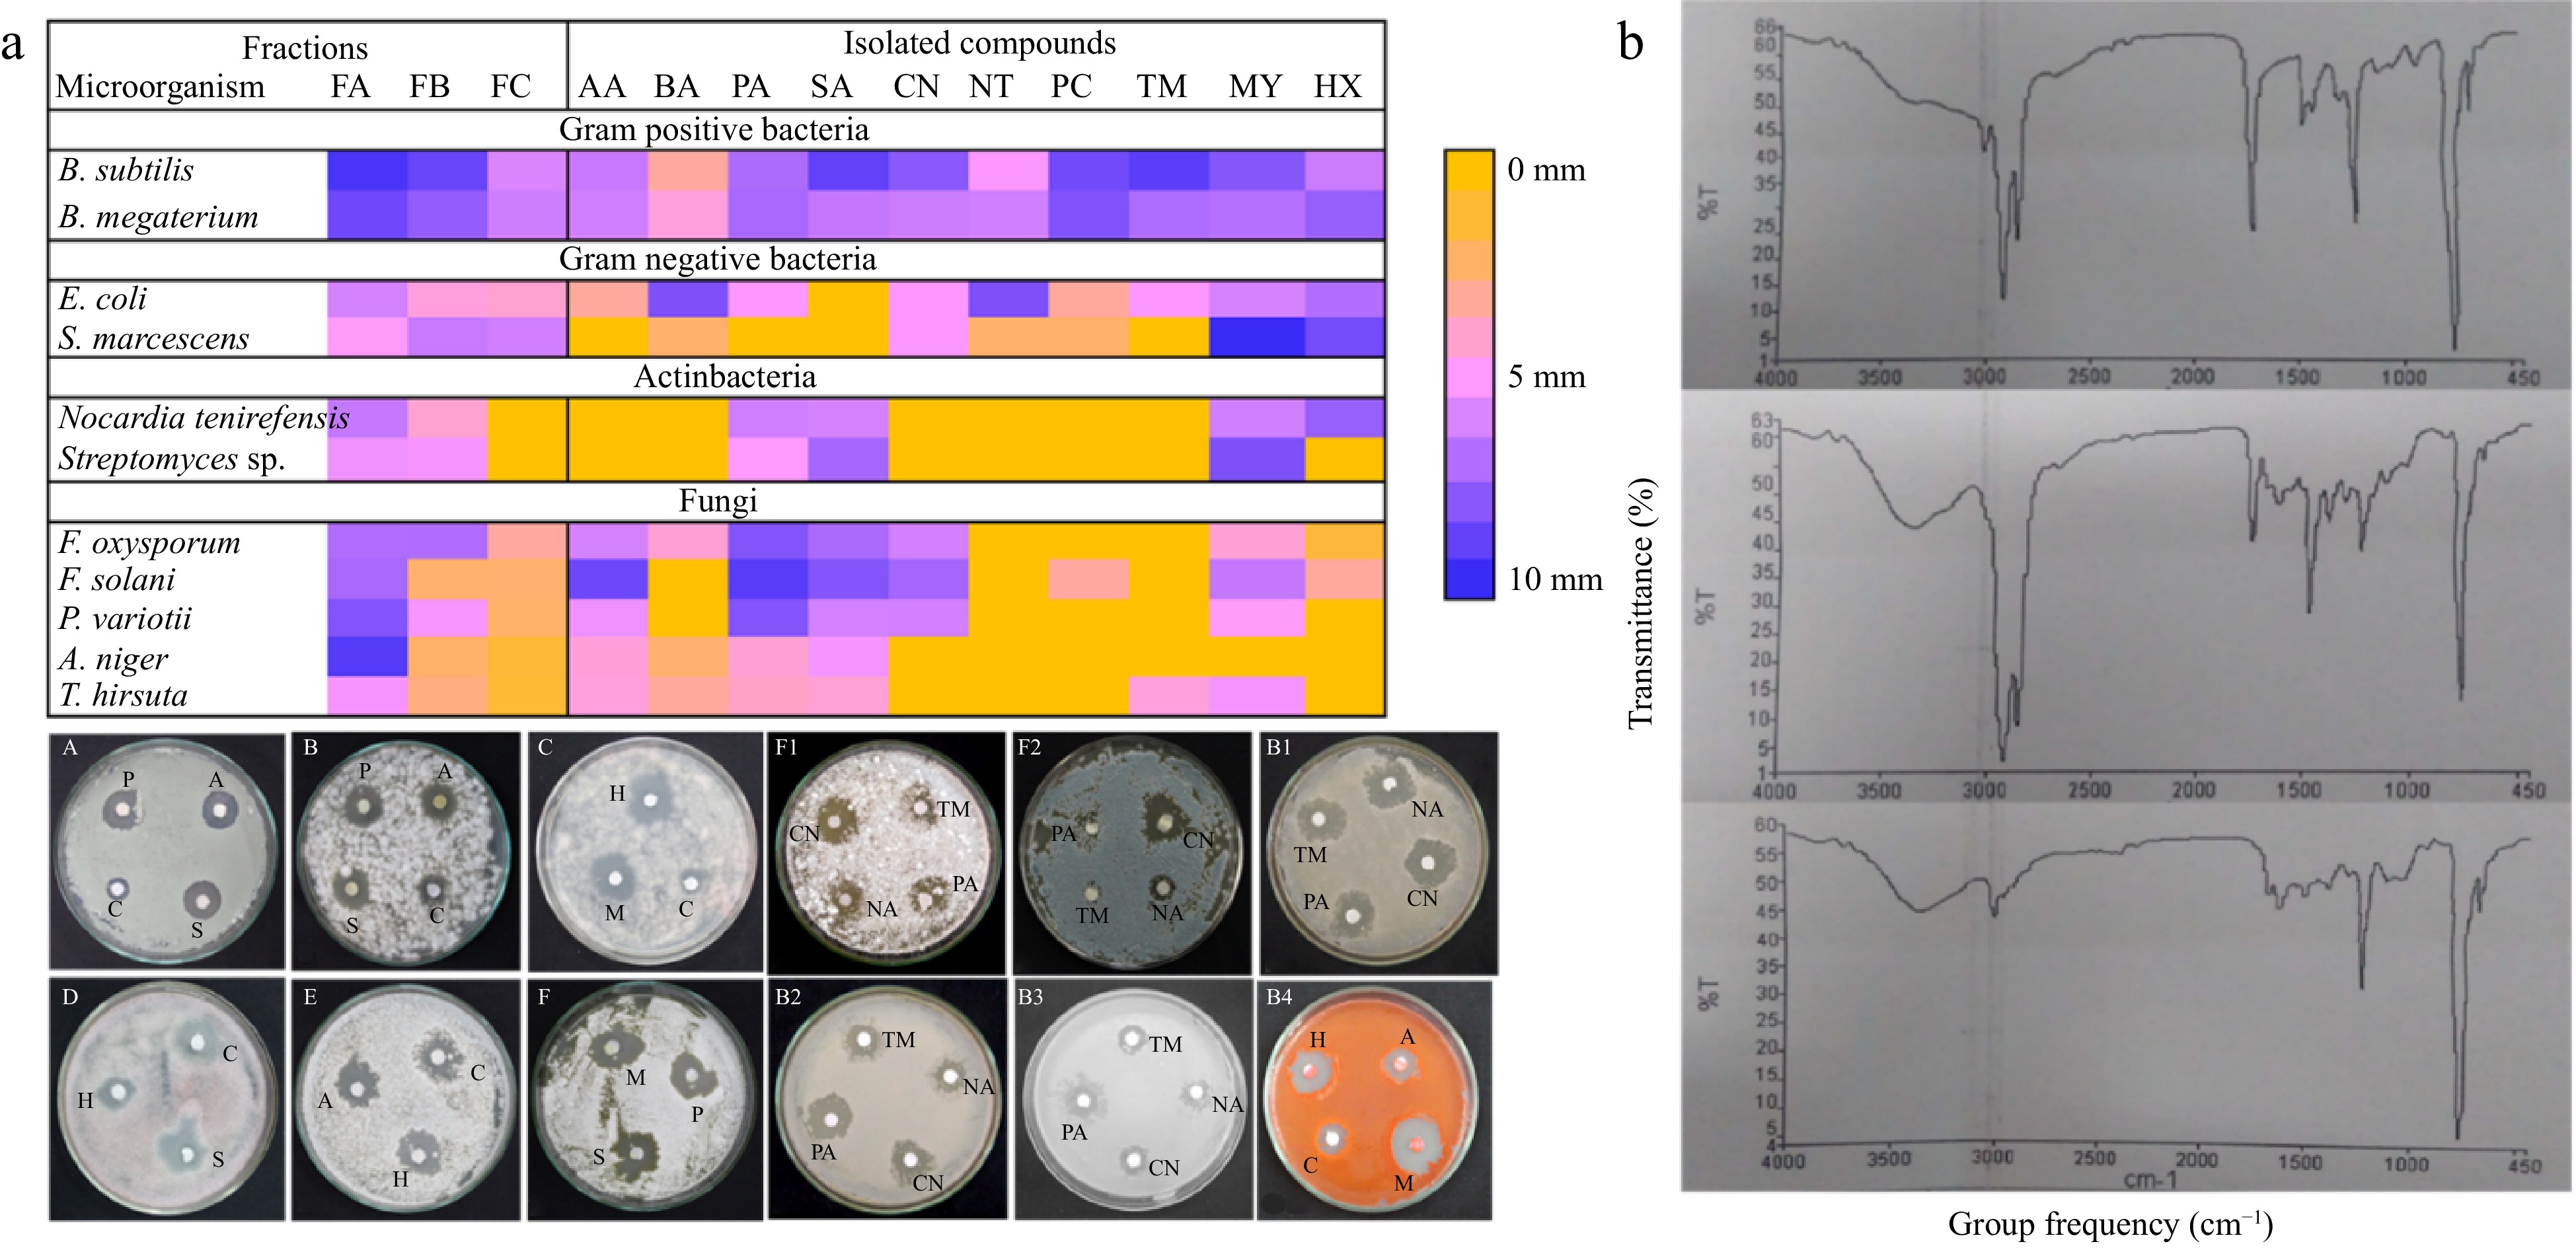
Figure 7.
(a) Heatmap showing antimicrobial potential (zone of inhibition (mm)) of final fraction and isolated compounds having antimicrobial activity. PA= palmitic acid, SA= stearic acid, AA= arachidic acid, MY = myoinositol, and HA = hexadecane, PA = procainamide, CN = cinchonine, NA = nicotinamide, TM = timolol. B1) B. megaterium, B2) B. Subtilis, B3) E. coli; and B4) S. marcescens. (A and F2) A. niger, B and C P. variotii, D) F. oxysporum E and F) T. hirsuta. B) FTIR spectra of rich fraction FA, FB, and FC of T. wallichiana needles.
-
Solvent strength Mobile phase I (%) Hexane (100) − 0 Hexane (90) E. acetate (10) 0.44 Hexane (80) E. acetate (20) 0.88 Hexane (70) E. acetate (30) 1.32 Hexane (60) E. acetate (40) 1.76 Hexane (50) E. acetate (50) 2.2 Hexane (40) E. acetate (60) 2.64 Hexane (30) E. acetate (70) 3.08 Hexane (20) E. acetate (80) 3.52 Hexane (10) E. acetate (90) 3.96 Mobile phase II (%) E. acetate (100) − 4.4 E. acetate (90) Methanol (10) 4.47 E. acetate (80) Methanol (20) 4.54 E. acetate (70) Methanol (30) 4.61 E. acetate (60) Methanol (40) 4.68 E. acetate (50) Methanol (50) 4.75 E. acetate (40) Methanol (60) 4.82 E. acetate (30) Methanol (70) 4.89 E. acetate (20) Methanol (80) 4.96 E. acetate (10) Methanol (90) 5.03 Mobile phase III (%) Acetic acid (0.1) Methanol (99.9) 5.1 Table 1.
Solvent strength of mobile phase used for separation of compounds using column chromatography.
-
Code Mobile phase Ratio Solvent strength Separation Spot Rf value M1 Chloroform : E. acetate : Formic acid 5:4:1 4.4 Yes 2 0.6, 0.7 M2 E. acetate : Methanol : Benzene 2:0.5:2.5 3.6 Yes 3 0.3, 0.6, 0.68 M3 Ethanol : Chloroform 1:1 4.2 Yes 4 0.4, 0.56, 0.64, 0.83 M4 Toluene : E. acetate : Formic acid 6:4:0.5 3.2 Yes 5 0.25, 0.38, 0.43, 0.64 and 0.81 M5 Hexane : Acetone : Toluene : Ethanol 10:7:7:6 5.2 No No No M6 Chloroform : Acetonitrile 7:3 4.6 Yes 3 0.77, 0.8, 0.85 M7 Chloroform : Methanol 7:1 3.9 Yes 8 0.67, 0.15, 0.19, 0.32, 0.40, 0.45,0.62, 0.75 M8 E. acetate : 2-Propanol 95:5 4.3 No No No M9 Chloroform : E. acetate : Methanol 25:20:5 4.3 Yes 5 0.25,0.4, 0.54, 0.68, 0.76 M10 Chloroform : Formic acid : Acetonitrile 6:0.5:3.5 3.3 No No No Table 2.
Solvent strength of mobile phase used for separation of compounds using thin layer chromatography.
-
Code Mobile phase Ratio Solvent strength M11 Hexane : E. acetate 7:3 1.32 M12 Toluene : Methanol 8:2 2.94 M13 Methanol : Chloroform 1:1 4.6 M14 DMF : DCM : Acetonitrile 5:1:4 5.83 M15 Acetic acid : Methanol : Water 5:2.5:2.5 6.77 Table 3.
Solvent strength of mobile phase used for separation of compounds present in spot 2 through thin layer chromatography and column chromatography.
-
Fraction (FA) compounds Fraction (FB) compounds Fraction (FC) compounds GC-MS 1,6-Octadine-3-ol Benzoic acid Benzenepropanol Benzoic acid 4-Tetradecene Megastigmatrienone Benzene, 1-methoxy 4-(2-propenyl) 2,4-Ditert-butylphenol Ar-tumerone Phenol, 2-methyl-5-(1-methylethyl) 9-Octadecanoic acid Mome-inositol 1-Tridecene Hexadecane Hexadecanoic acid Pentadecane 1,4-Dimethyl-2 phenoxybenzene 9-Octadecenoic acid Succinic acid E-15-Heptadecenal Eicosanoic acid E-14-Hexadecenal Benzene dicarboxylic acid Di-n-octyl phthalate Neophytadiene Hexadecanoic acid Hexadecanoic acid 1-Nonadecene 1-Nonadecene Ecosanoic acid Docosanoic acid Octacosanol 1-Tetradecanol Phenol, 2,4-bis(1-phenylethyl) Benzene dicarboxylic acid Di-n-octyl phthalate LC-MS 1-aminocyclopropane-1-carbocyclic acid Nicotinamide Nicotinamide Methyl methanethiosulfonate Cinchonine Dodecylsulfonylacetic acid Methionyl-Glycin Ranitidine Diphenoxylic acid Ergothioneine Psoralenol Cinchonine Procainamide Squamocin B Ergothioneine Alcoifosfamide Trimethaphan Timolol Timolol Boviquinone Trimethaphan Lobaric acid Frangulanine Table 4.
A list of identified compounds in fractions showed antimicrobial activity.
-
S. No. Compounds Formula Molar mass (g/mol) Classification Concentration in needles (mg/g (dw)) GC-FID analysis 1 Arachidic acid C20H40O2 312.53 Saturated fatty acid 22.94 ± 0.09 2 Behenic acid C22H44O2 340.58 Saturated fatty acid 31.04 ± 0.05 3 Palmitic acid C16H32O2 256.43 Saturated fatty acid 16.81 ± 0.03 4 Stearic acid C18H36O2 284.48 Saturated fatty acid 20.10 ± 0.06 RP-HPLC-PDA analysis 5 Cinchonine C19H22N2O 294.17 Alkaloid 3.75 ± 1.21 6 Nicotinamide C6H6N2O 122.12 Vitamin 21.14 ± 0.53 7 Procainamide C13H21N3O 235.325 aminobenzamides 14.61 ± 0.71 8 Timolol C13H24N4O3S 316.421 Alkaloid 6.31 ± 0.54 9 Myoinositol C6H12O6 180.16 carbocyclic sugar 1.45 ± 1.01 10 Hexadecane C16H34 226.41 alkane hydrocarbon − Table 5.
List of compounds identified in the separated fraction (spot 2) having antimicrobial potential.
Figures
(7)
Tables
(5)