-
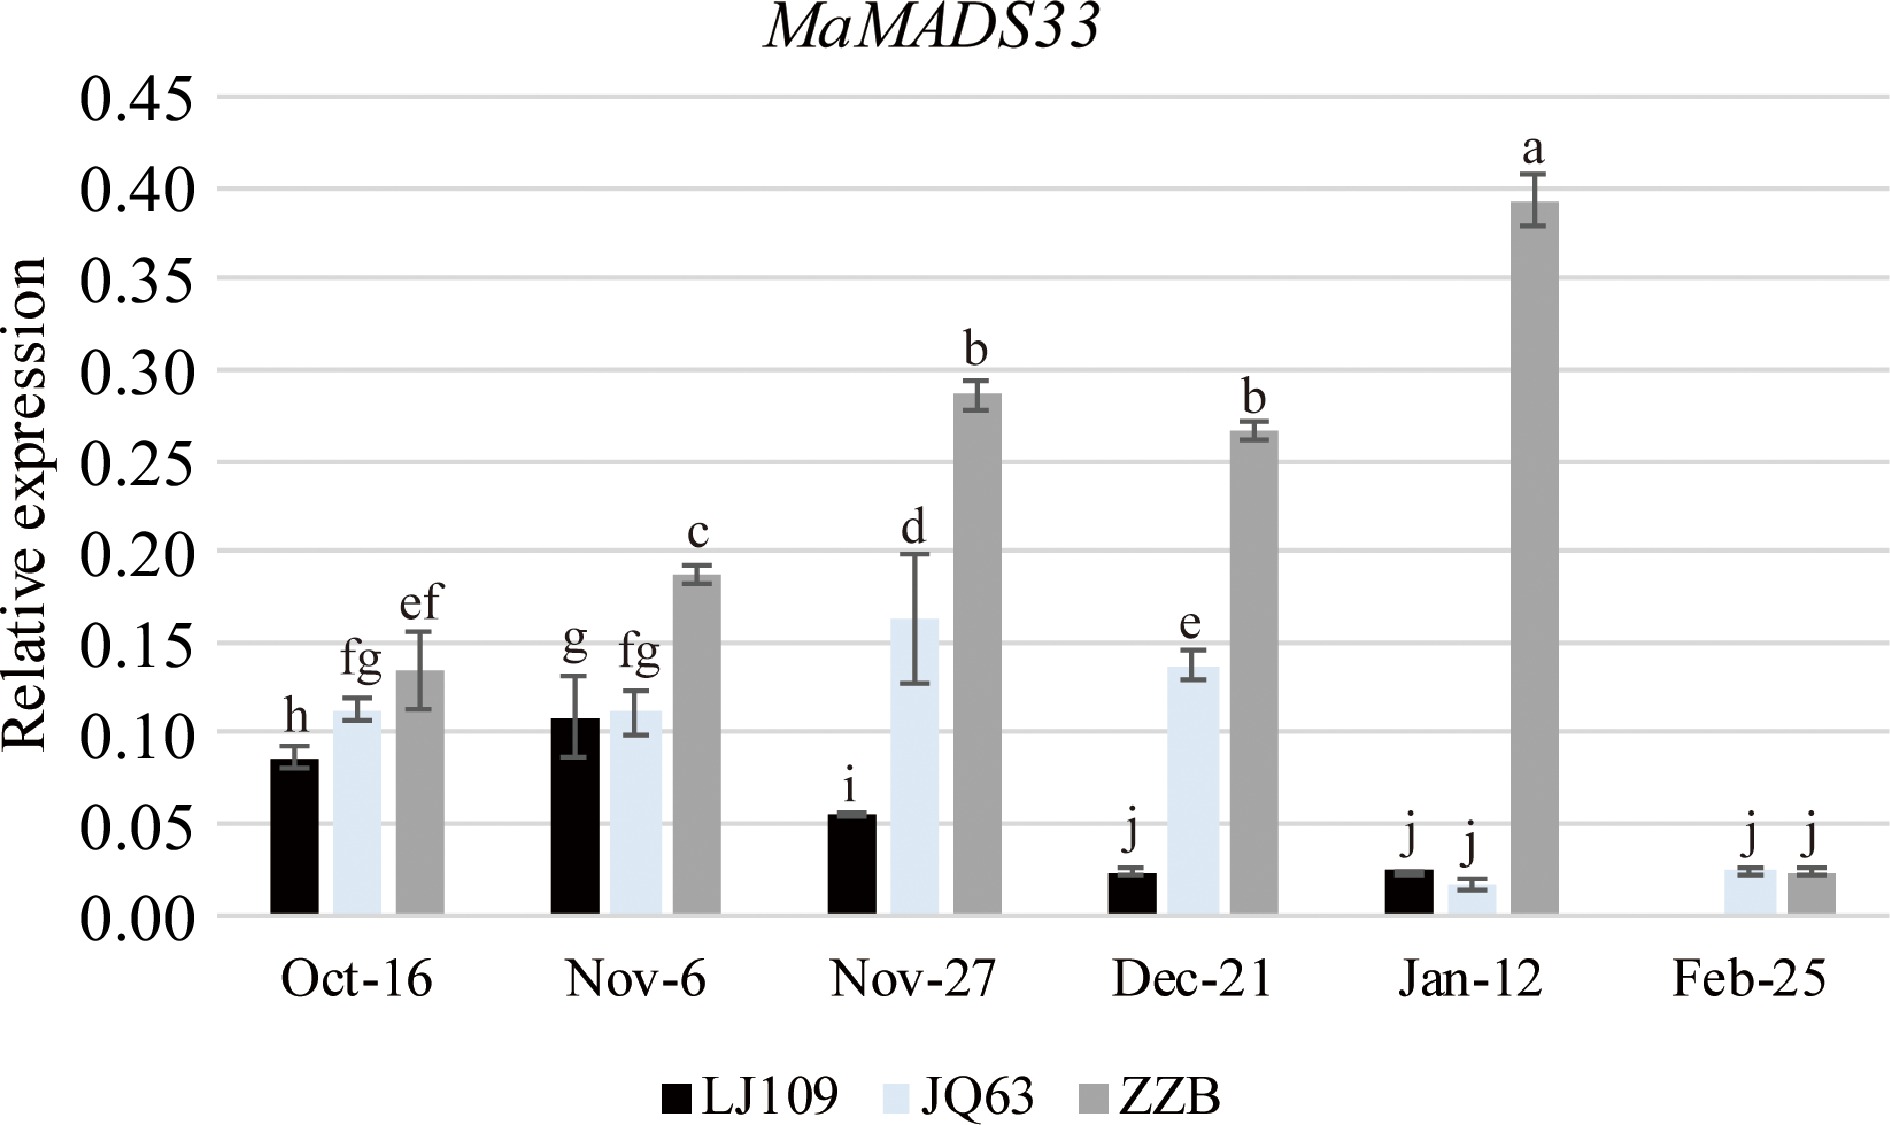
Figure 1.
MaMADS33 expression is positively associated with dormancy in mulberry. MaMADS33 expression in the mulberry varieties 'Lunjiao109' (LJ109), 'Jinqiang63' (JQ63), and 'Zhenzhubai' (ZZB) was measured throughout dormancy by qRT–PCR using primers targeting the conserved sequence of the MADS-box domain. MaRPL15 was the internal control gene for normalization of the expression data (n = 3; mean ± measurement range). Significant differences are indicated by different lowercase letters (ANOVA and Duncan's multiple range test; p < 0.05).
-
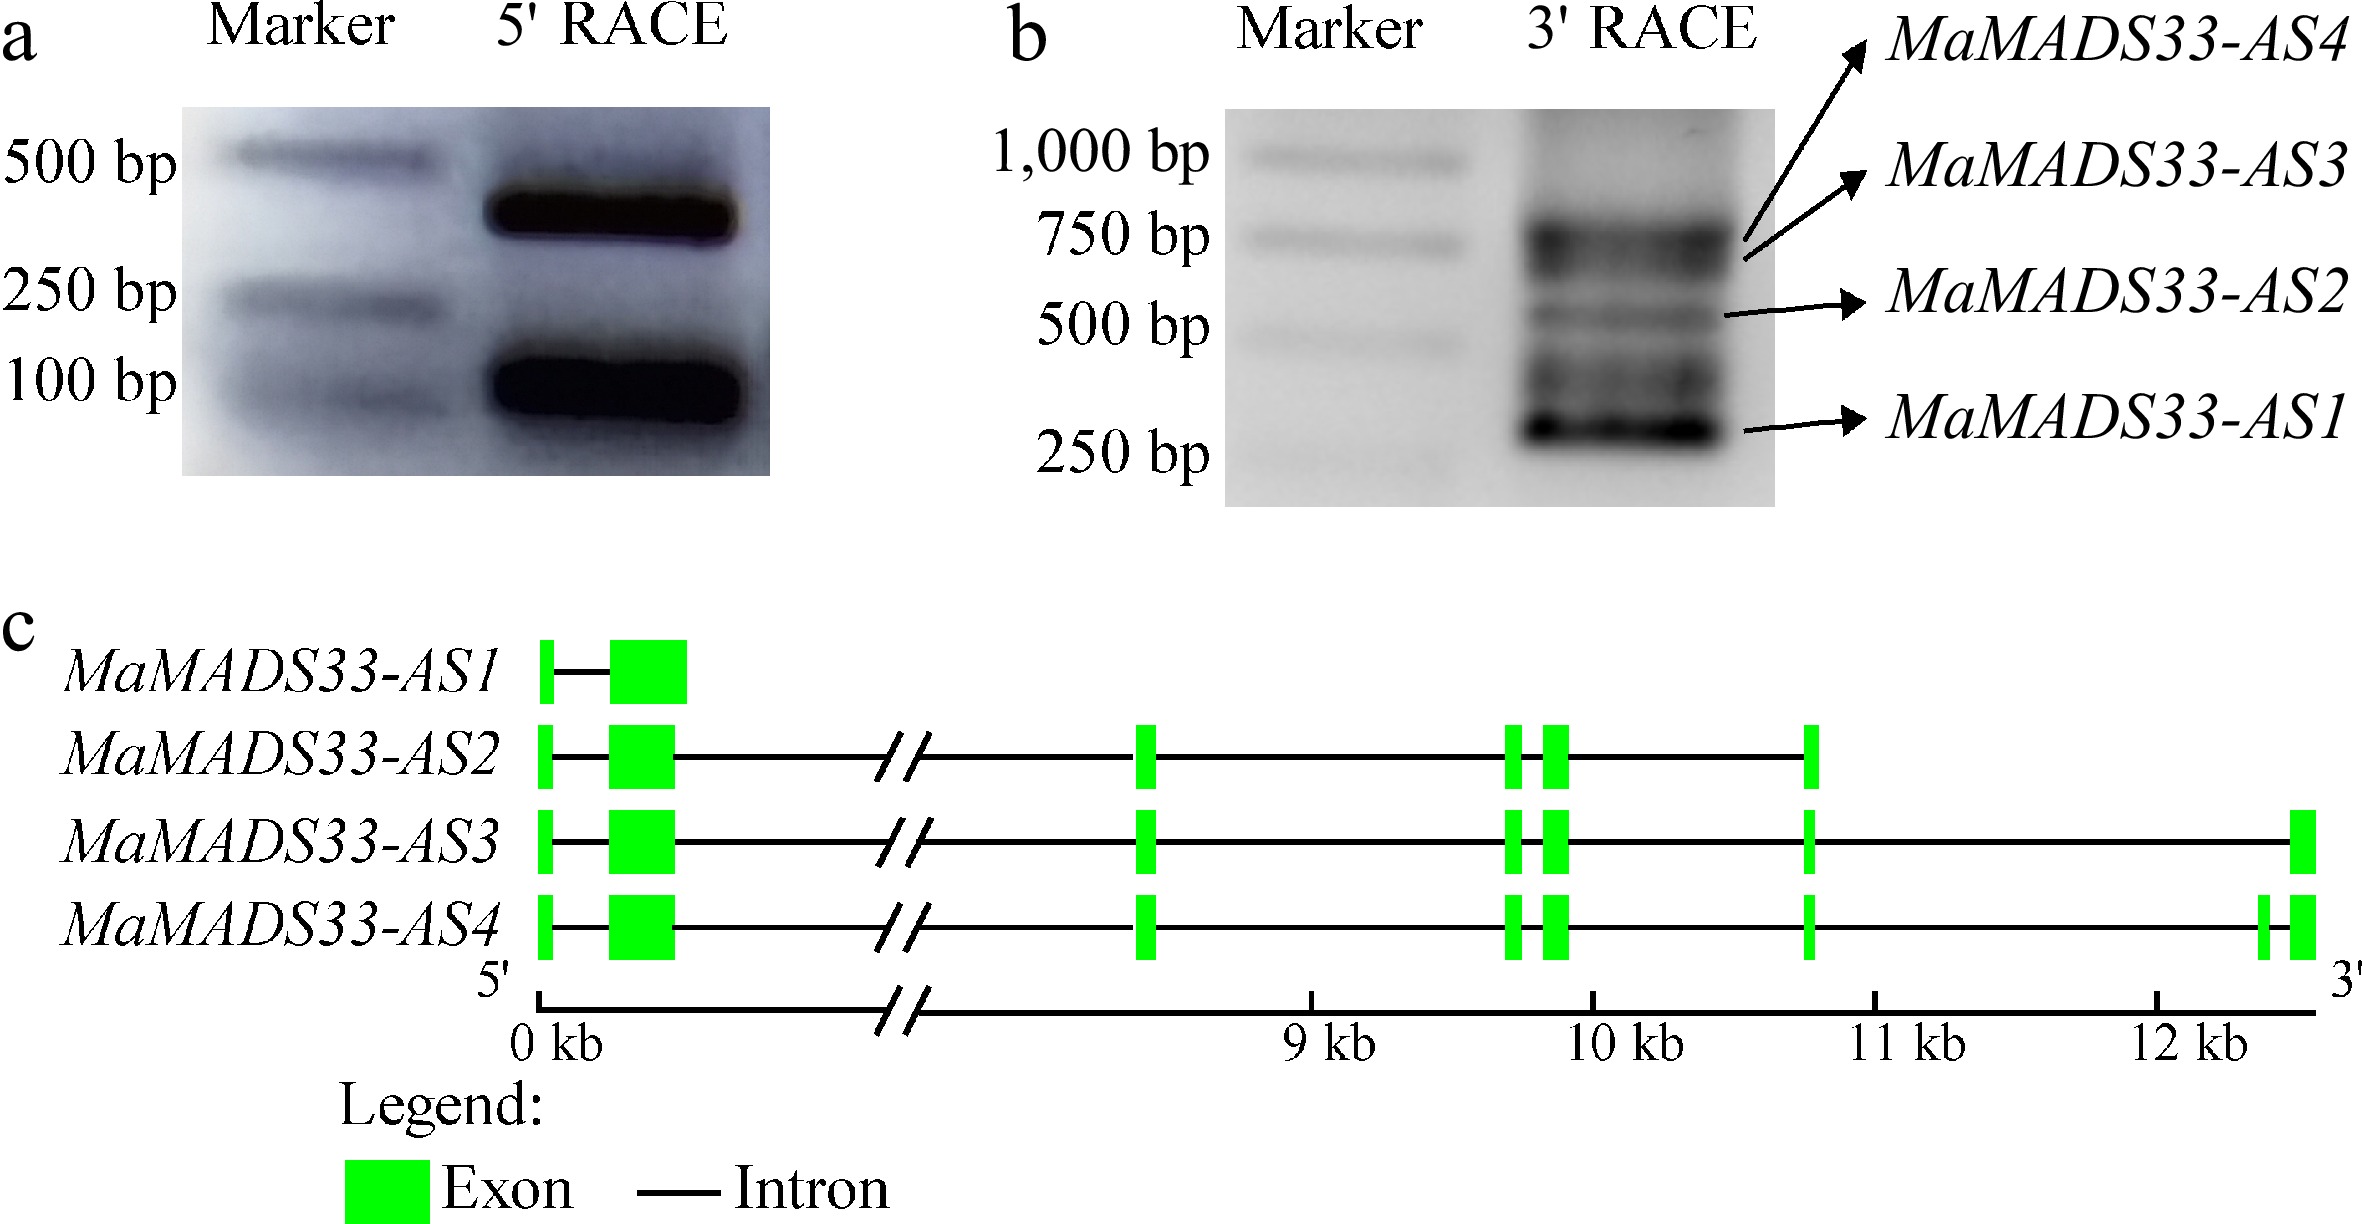
Figure 2.
Alternative splicing (AS) of mulberry MaMADS33 from endodormancy through ecodormancy. (a) 5' RACE, and (b) 3' RACE methods were used to amplify MaMADS33 transcripts in cDNA pools from JQ63 flower buds collected on five dates from October 2020 through February 2021. Primers were designed to target the conserved sequence of the MADS-box domain. Bands corresponding to MaMADS33-AS1, MaMADS33-AS2, MaMADS33-AS3, and MaMADS33-AS4 are indicated by arrows. (c) Schematic of MaMADS33 AS isoforms. Exons are represented by green boxes and introns by lines.
-
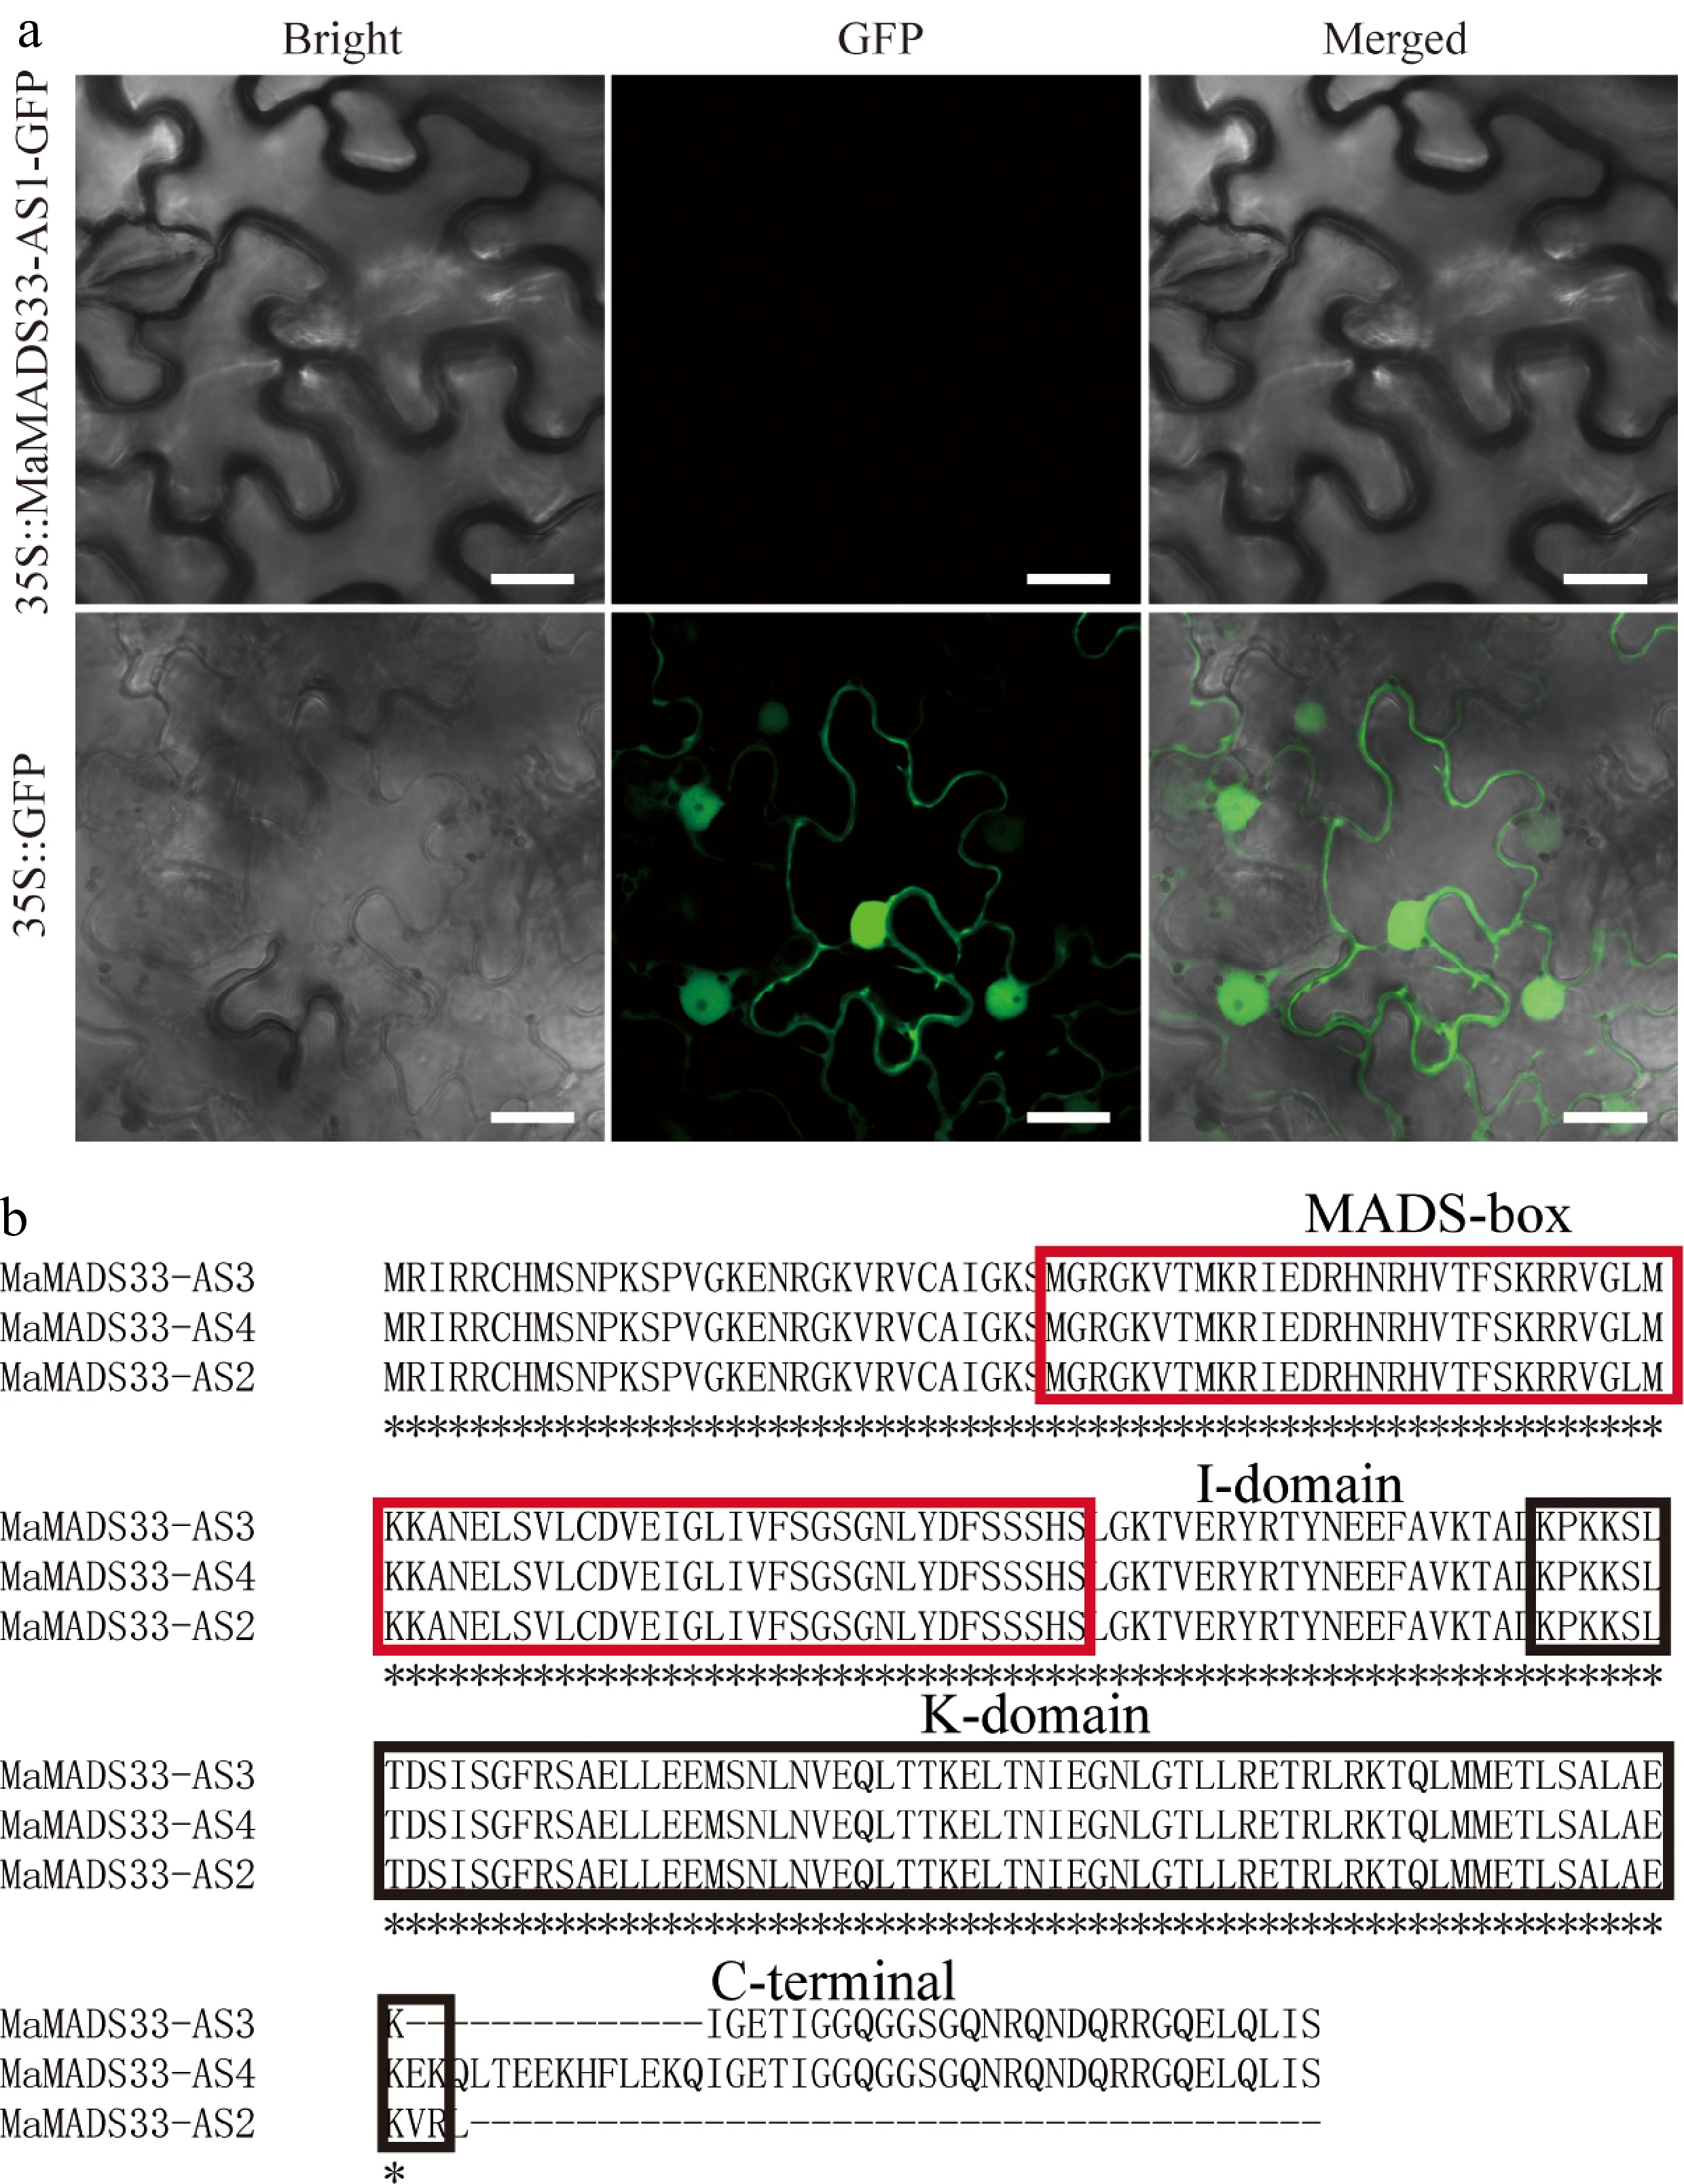
Figure 3.
Assessment of MaMADS33-AS1 coding potential and alignment of amino acid sequences. (a) The coding potential of MaMADS33-AS1 was examined by transient expression in Nicotiana benthamiana leaves. Scale bar = 20 μm. (b) Amino acid sequences of MaMADS33-AS2, MaMADS33-AS3, and MaMADS33-AS4. The MADS-box and K-domains are indicated by red and black boxes, respectively. The I-domain and C-terminal domain are marked above the sequences.
-
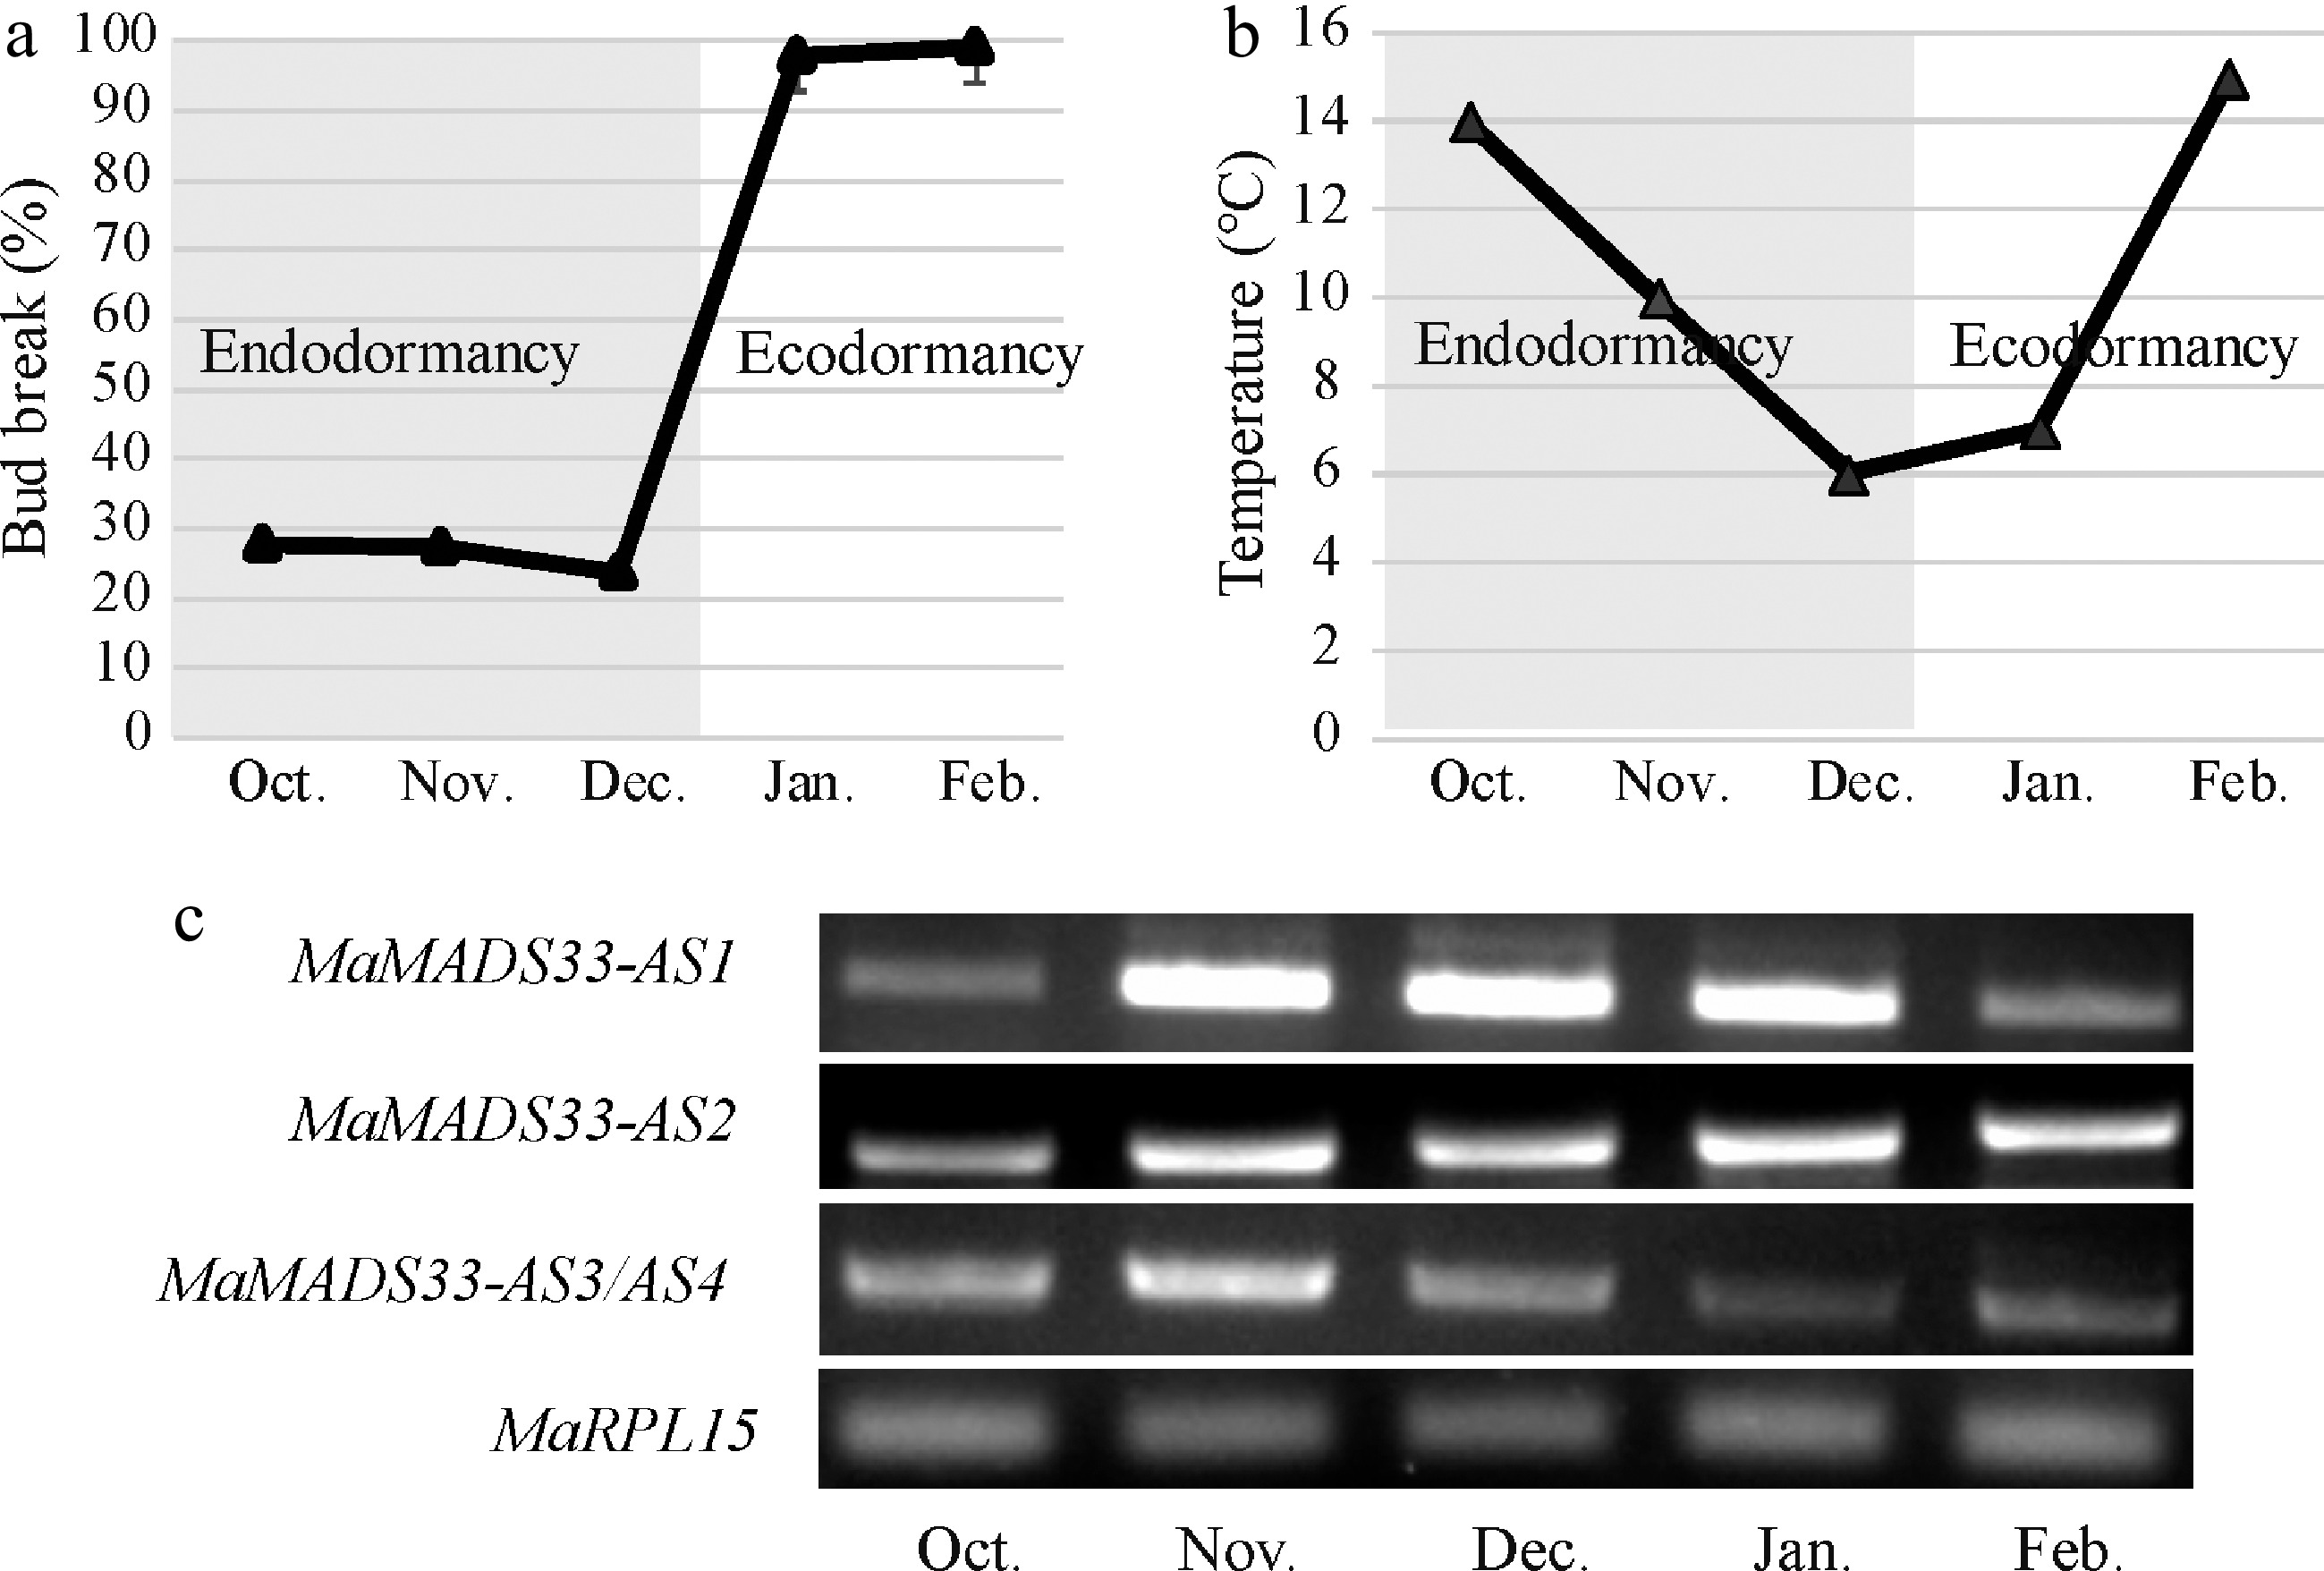
Figure 4.
Expression profiles of four MaMADS33 AS isoforms during dormancy. Dormancy stages of mulberry flower buds. Flower buds of JQ63 were collected from October 2020 through February 2021, and the (a) bud break percentage (n = 3, mean ± measurement range), and (b) temperature were recorded. (c) Expression profiles of four MaMADS33 AS isoforms in flower buds measured by RT–PCR with MaRPL15 as the reference gene. PCR products were separated on 1% agarose gels.
-
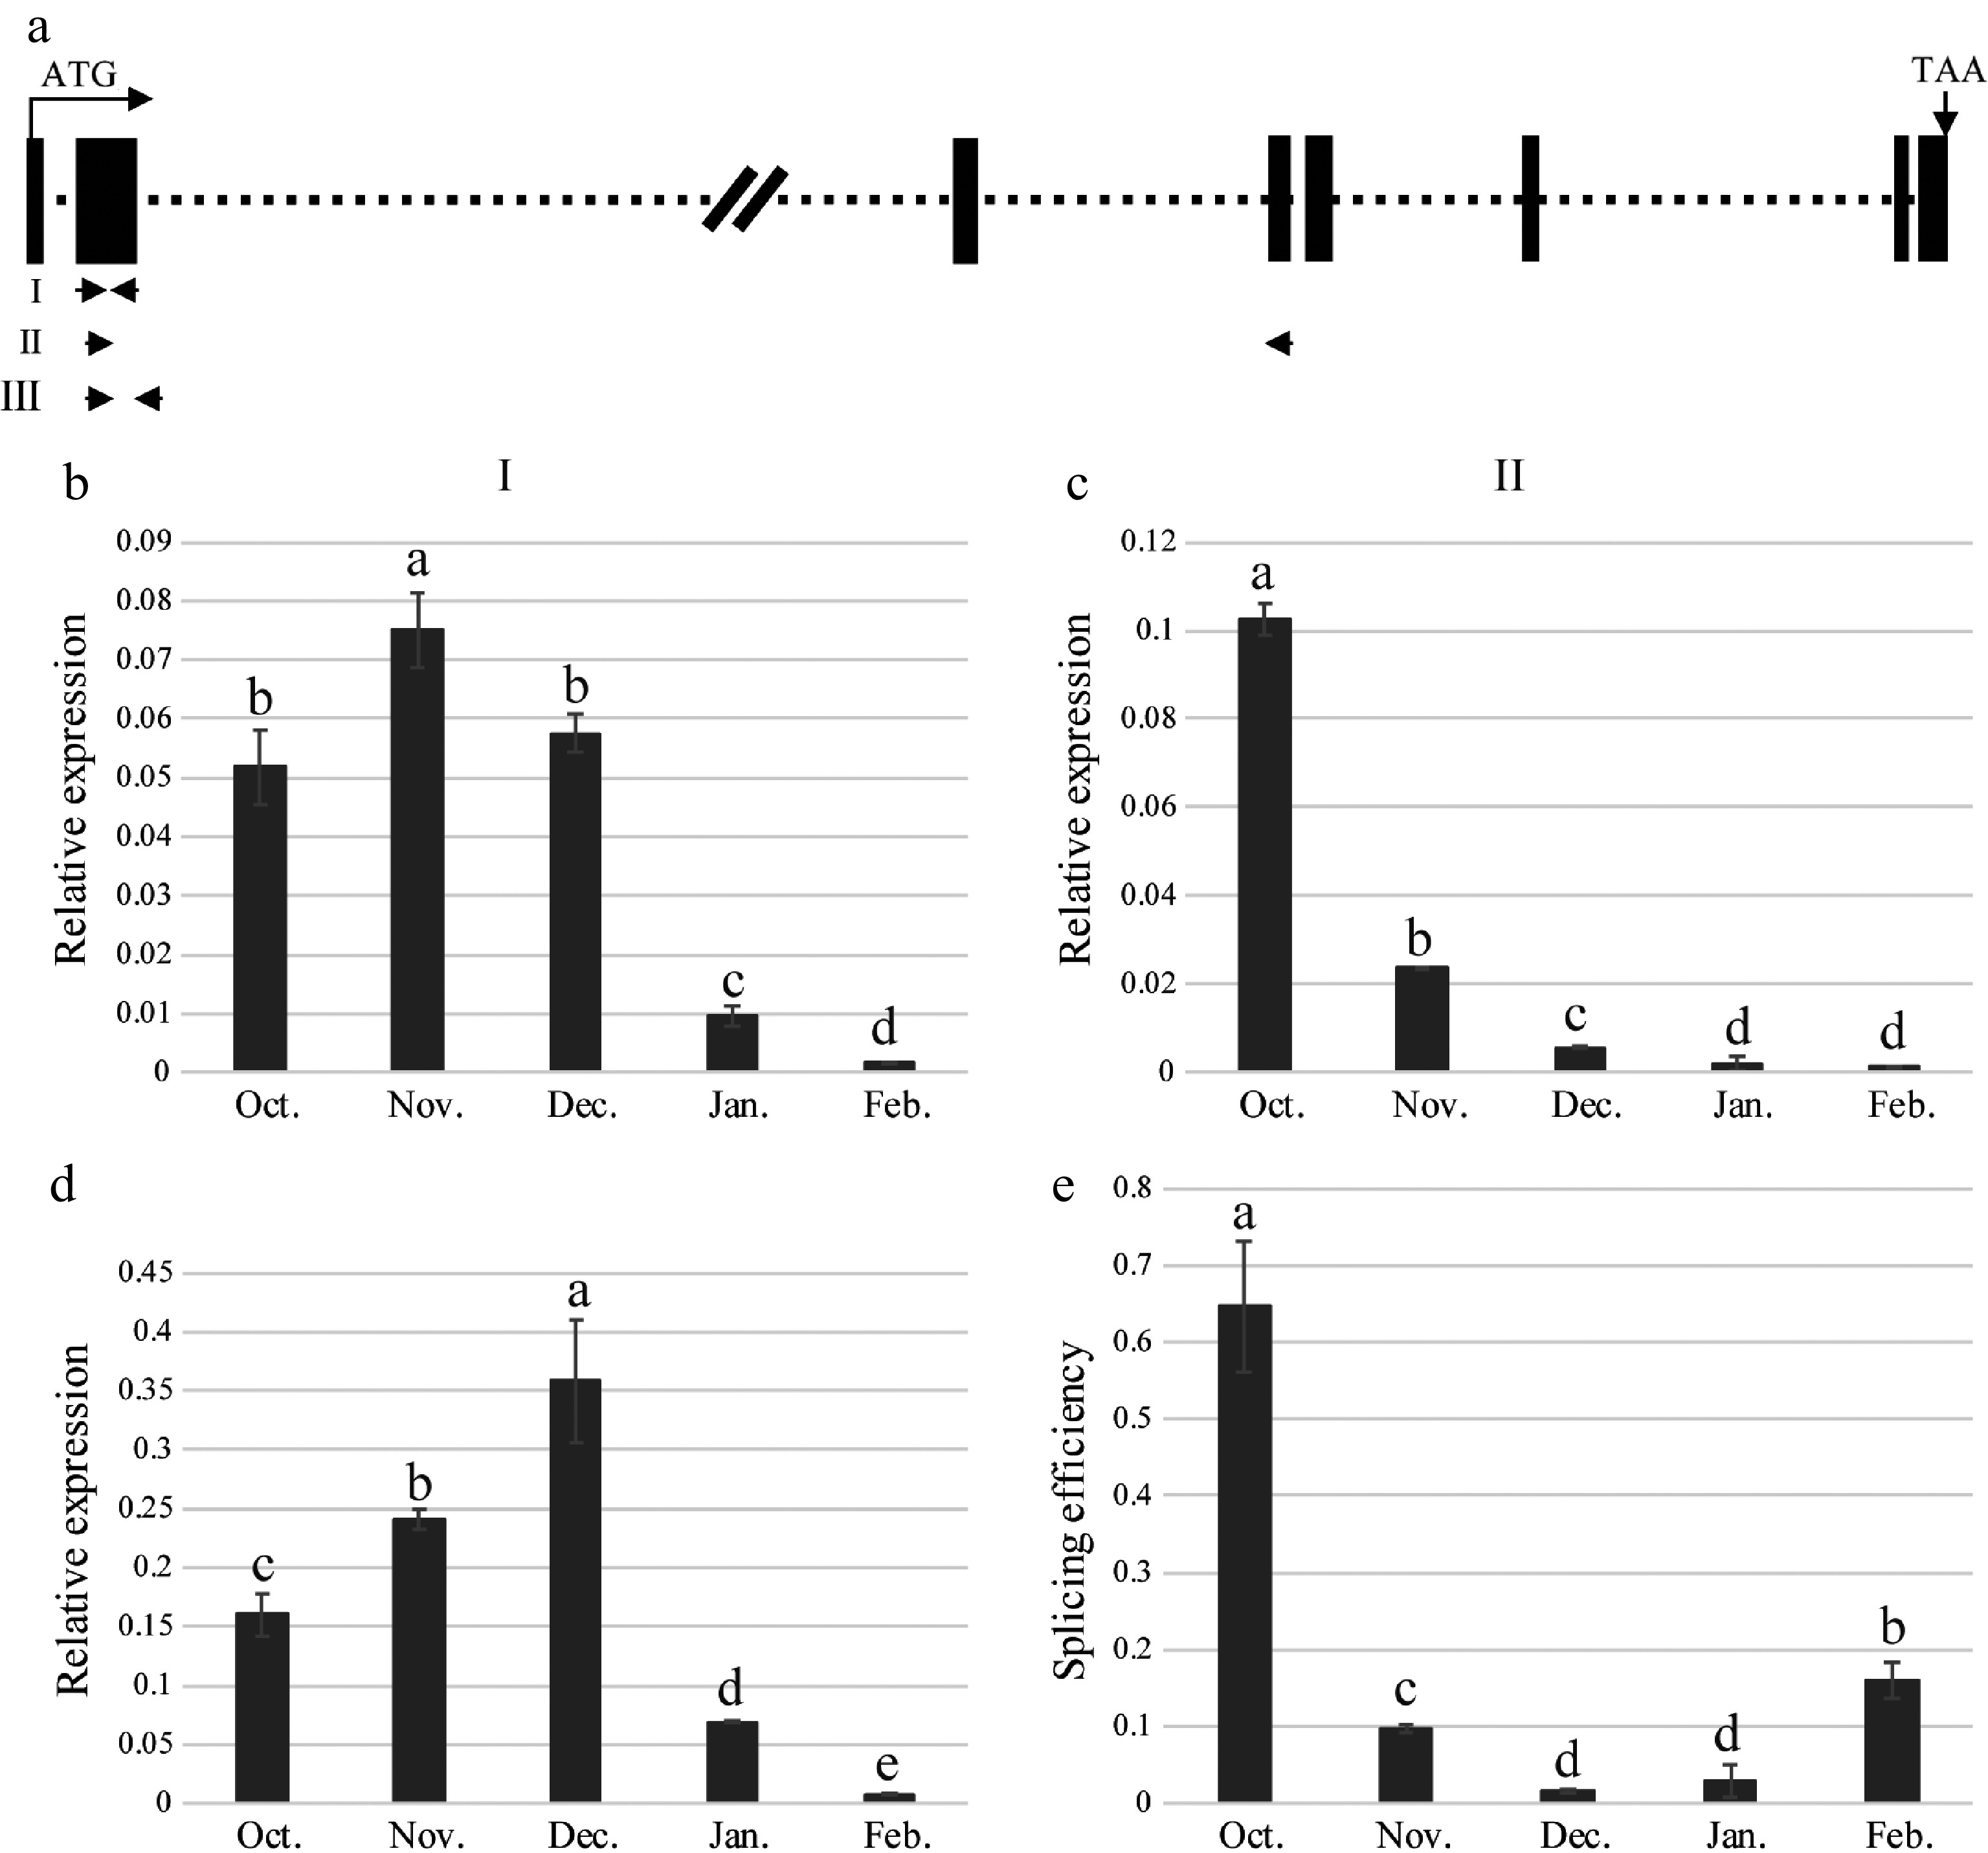
Figure 5.
Splicing efficiency of MaMADS33 intron 2. (a) Schematic of the MaMADS33 gene. The locations of primers I, II, and III are indicated with arrows. (b) Primer I, located in the conserved MADS-box domain, targeted all spliced and unspliced isoforms of MaMADS33. (c) Primer II targeted mRNA from which intron 2 had been spliced, corresponding to transcripts of MaMADS-AS2, MaMADS-AS3, and MaMADS-AS4. (d) Primer III targeted unspliced pre-mRNA for intron 2. (e) Splicing efficiency was calculated as the spliced/unspliced ratio. Relative expression was measured by qRT–PCR using MaRPL15 as a reference gene (n = 3; mean ± measurement range). Flower buds of JQ63 were collected from October 2020 through February 2021. Significant differences are indicated by different lowercase letters (ANOVA and Duncan's multiple range test; p < 0.05).
-
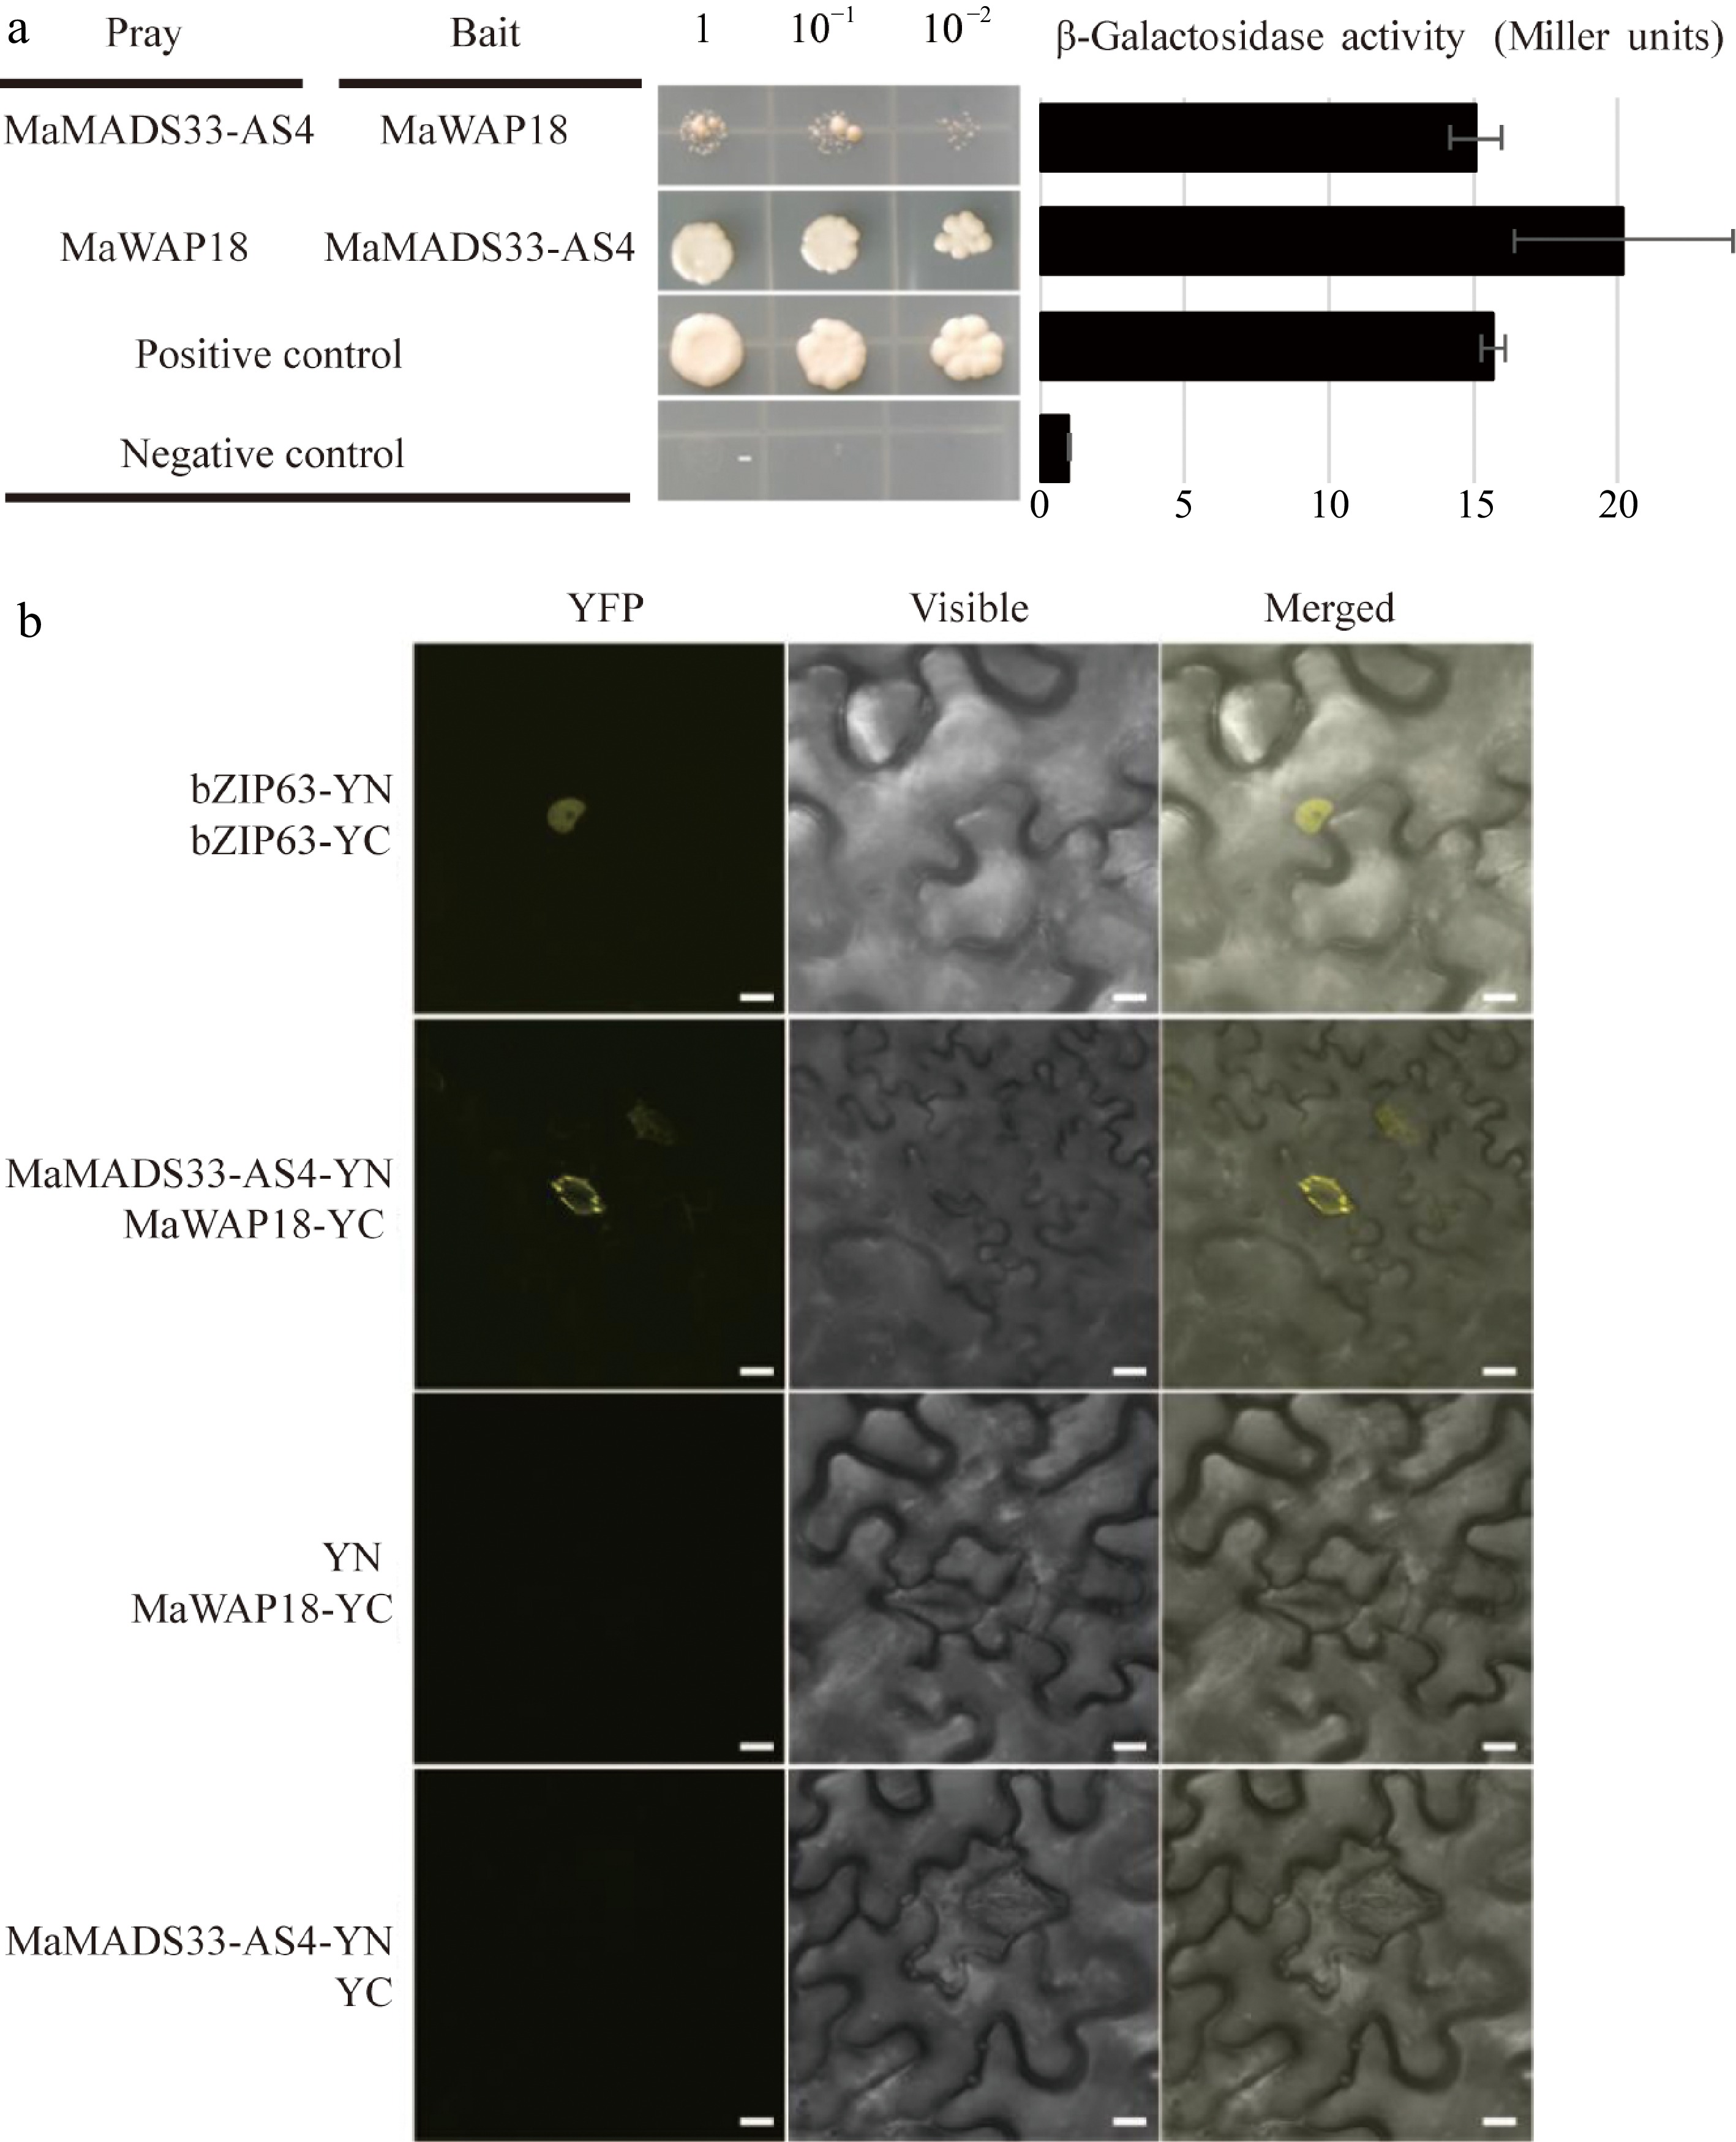
Figure 6.
Interaction between MaMADS33-AS4 and MaWAP18. (a) Interaction of MaMADS33-AS4 and MaWAP18 in yeast. pGBKT7-p53 was mated with pGADT7-T as a positive control, and pGBKT7-Lam was mated with pGADT7-T as a negative control. Yeast was diluted 1, 10, and 100 fold before plating onto quadruple dropout (QDO) medium. Corresponding measurements of β-galactosidase activity are shown. Three independent experiments were performed with similar results. (b) BiFC assay in 4-week-old Agrobacterium-infiltrated N. benthamiana leaves. MaMADS33-AS4 and MaWAP18 were independently fused to the N-terminal and C-terminal halves of yellow fluorescent protein (YFP), respectively. Images of YFP fluorescence were obtained using a confocal microscope. Scale bar = 10 μm. Three independent experiments were performed with similar results.
-
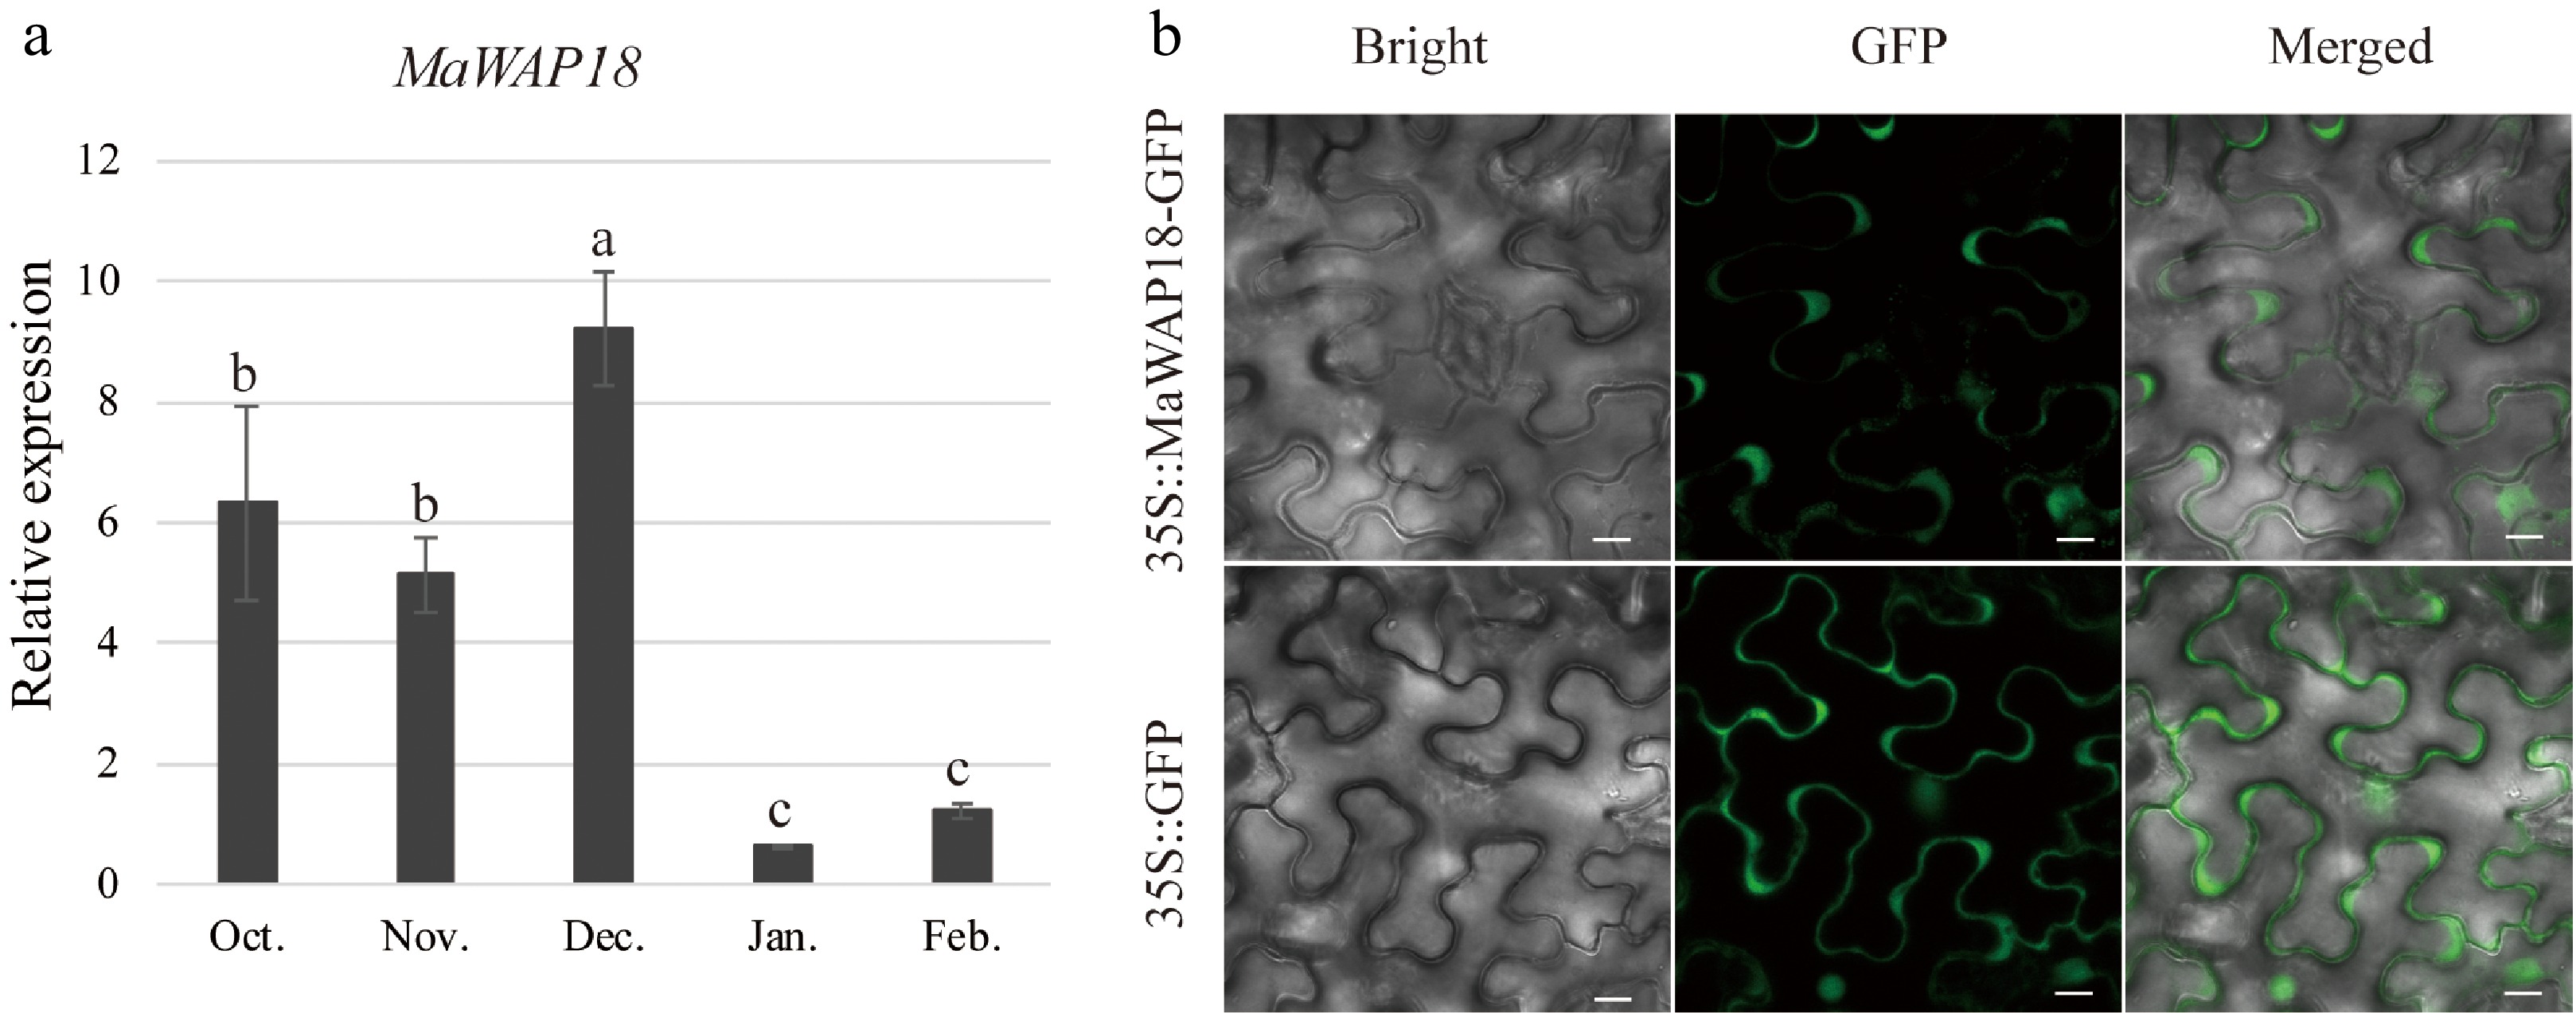
Figure 7.
Expression and subcellular localization analyses of MaWAP18. (a) Relative expression was measured by qRT–PCR using MaRPL15 as the reference gene (n = 3; mean ± measurement range). Flower buds of JQ63 were collected from October 2020 through February 2021. (b) Subcellular localization of MaWAP18. Images of 4-week-old Agrobacterium-infiltrated N. benthamiana leaves expressing the MaWAP18-GFP fusion protein driven by the CaMV 35S promoter were obtained under green fluorescence, merged light, and visible light. 35S:GFP was used as a positive control. Scale bar = 10 μm. Significant differences are indicated by different lowercase letters (ANOVA and Duncan's multiple range test; p < 0.05).
-
ID Label Coding probability Peptide length (aa) ORF
integrityMaMADS33-AS1 noncoding 0.232883 109 complete MaMADS33-AS2 coding 0.977475 185 complete MaMADS33-AS3 coding 0.969709 211 complete MaMADS33-AS4 coding 0.985029 225 complete Table 1.
Coding potential of the four MaMADS33 AS isoforms were predicted using Coding Potential Calculator 2 (CPC2).
Figures
(7)
Tables
(1)