-

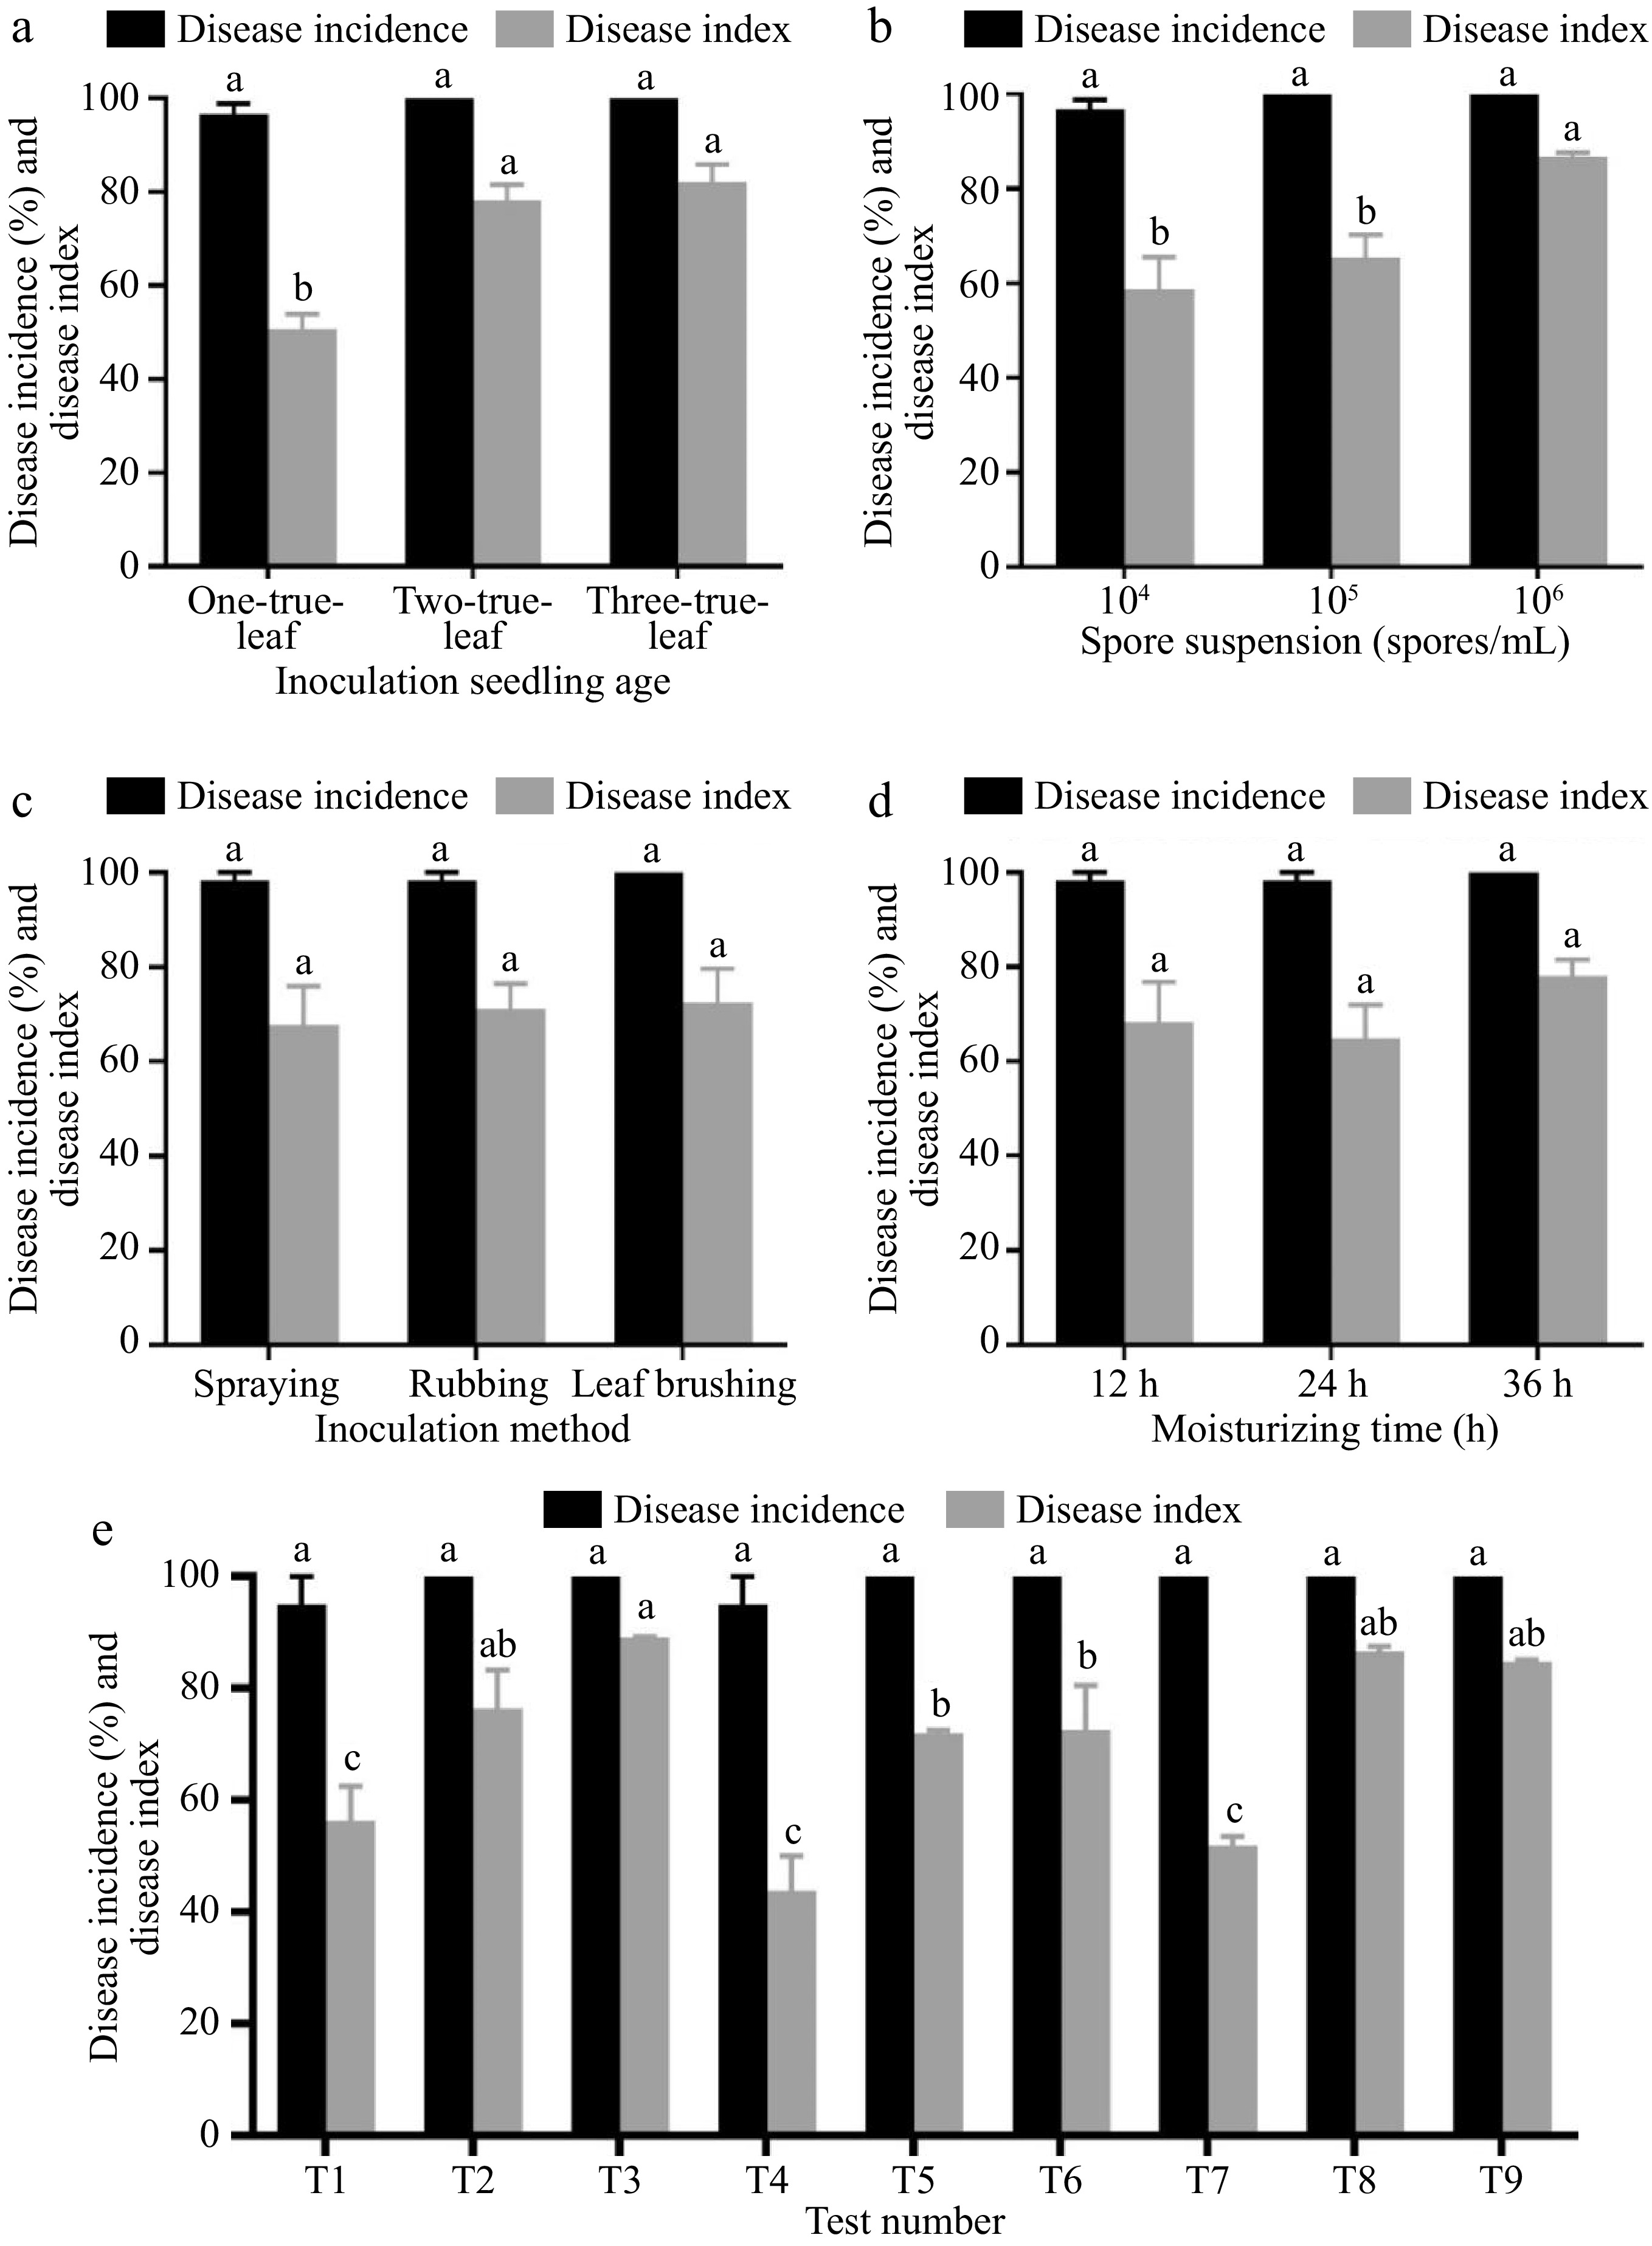
Figure 1.
Resistance identification results of combinations of indoor seedling resistance identification methods (15 d). Effects of (a) different seedling ages, (b) spore suspension concentrations, (c) inoculation methods, and (d) moisturizing time on the incidence rate and disease index of cucumber seedlings. (e) The influence of different inoculation schemes on the incidence rate and disease index of cucumber seedlings. Values are means of minimum two replicates, with each containing 9 to 10 seedlings. Data are expressed as mean ± Standard error of mean, and significances were examined by one-way ANOVA, followed by Duncan's multiple comparisons test and different letters represent significant differences (p < 0.05).
-

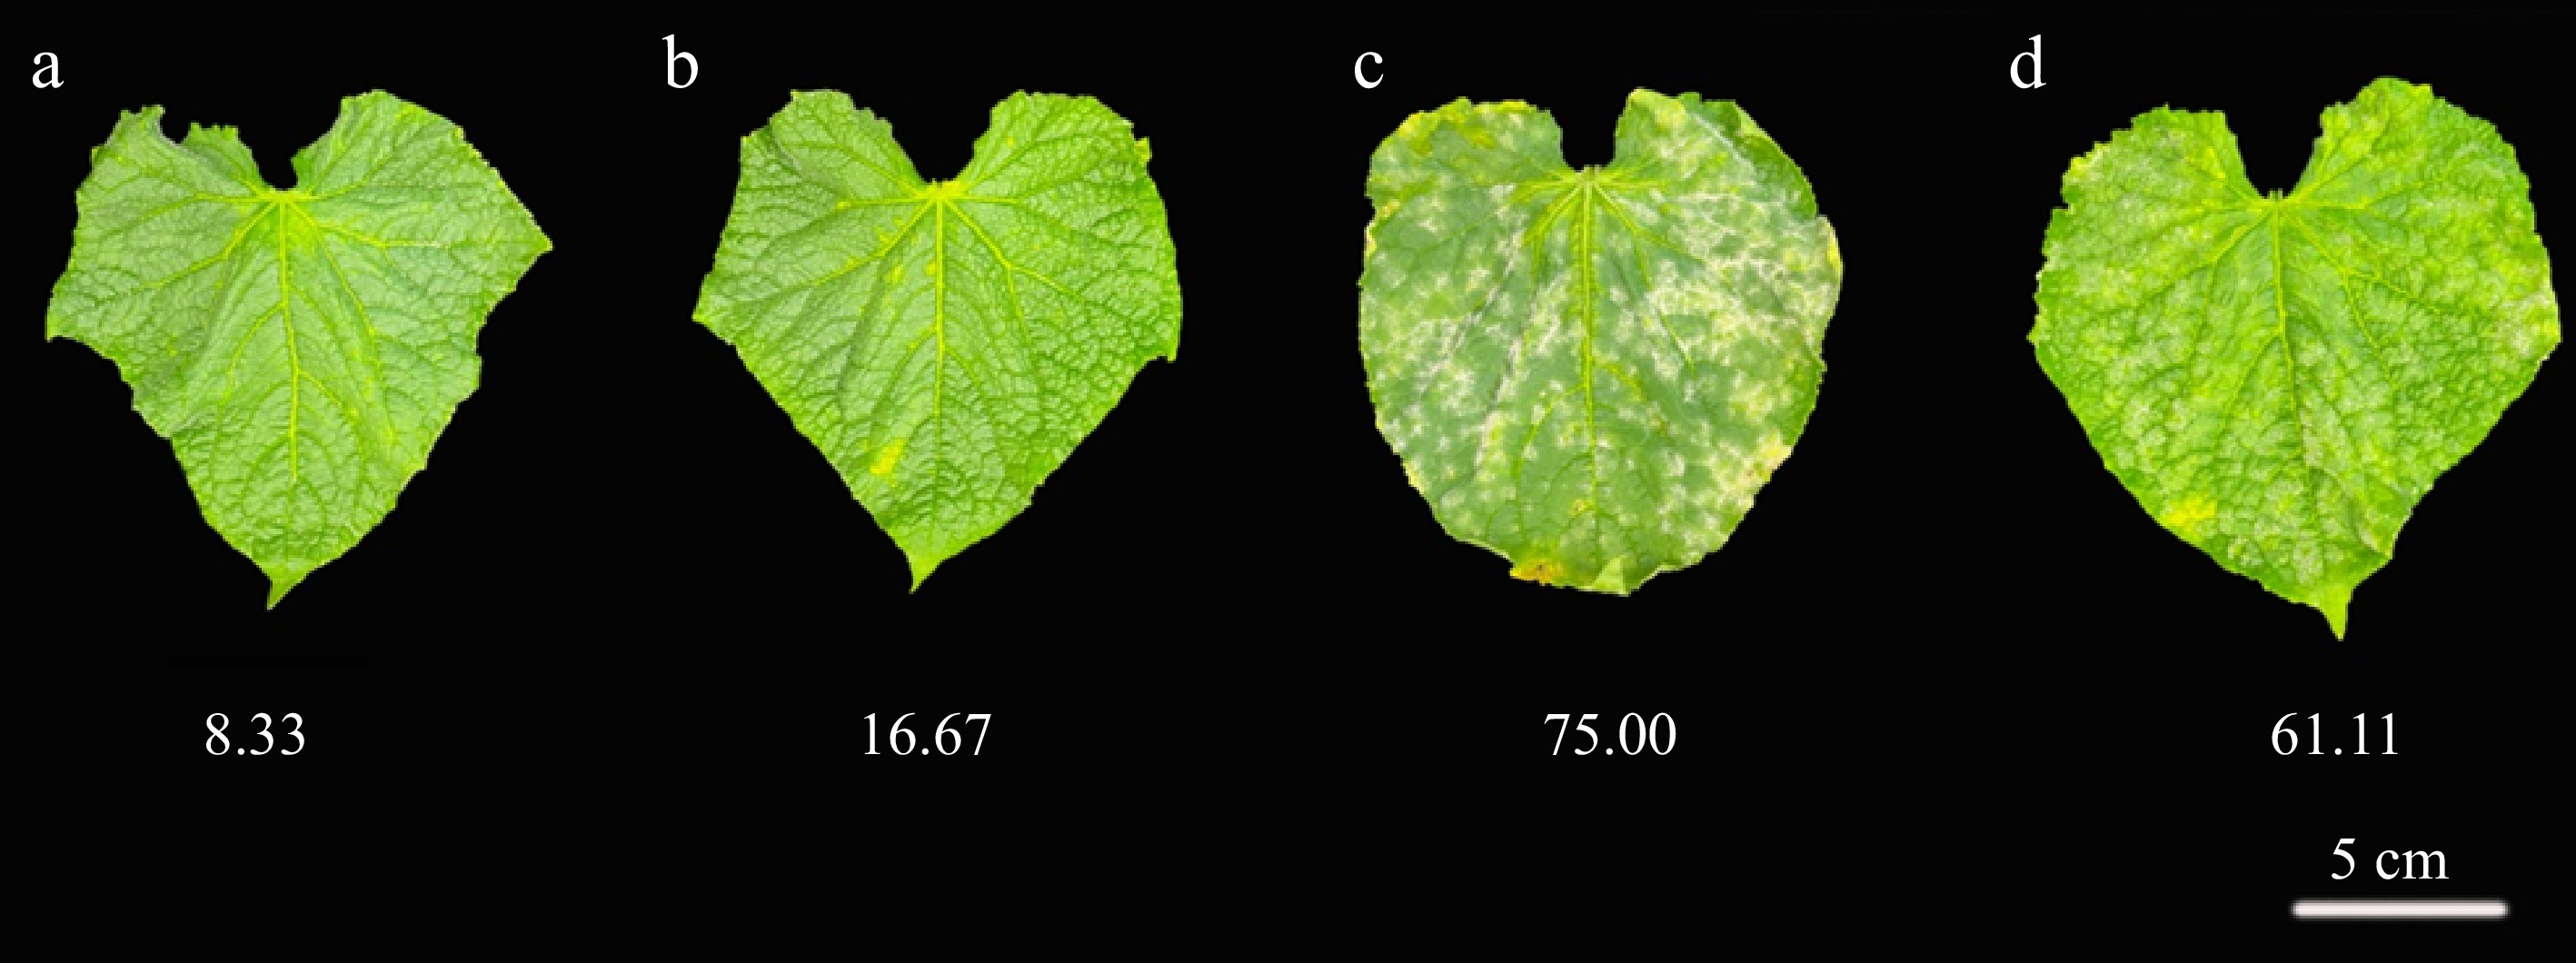
Figure 2.
Identification of disease resistance in different cucumber germplasm. The onset of disease in (a) R1461, (b) BK2, (c) 9930, and (d) H136 after 15 d of inoculation with powdery mildew.
-

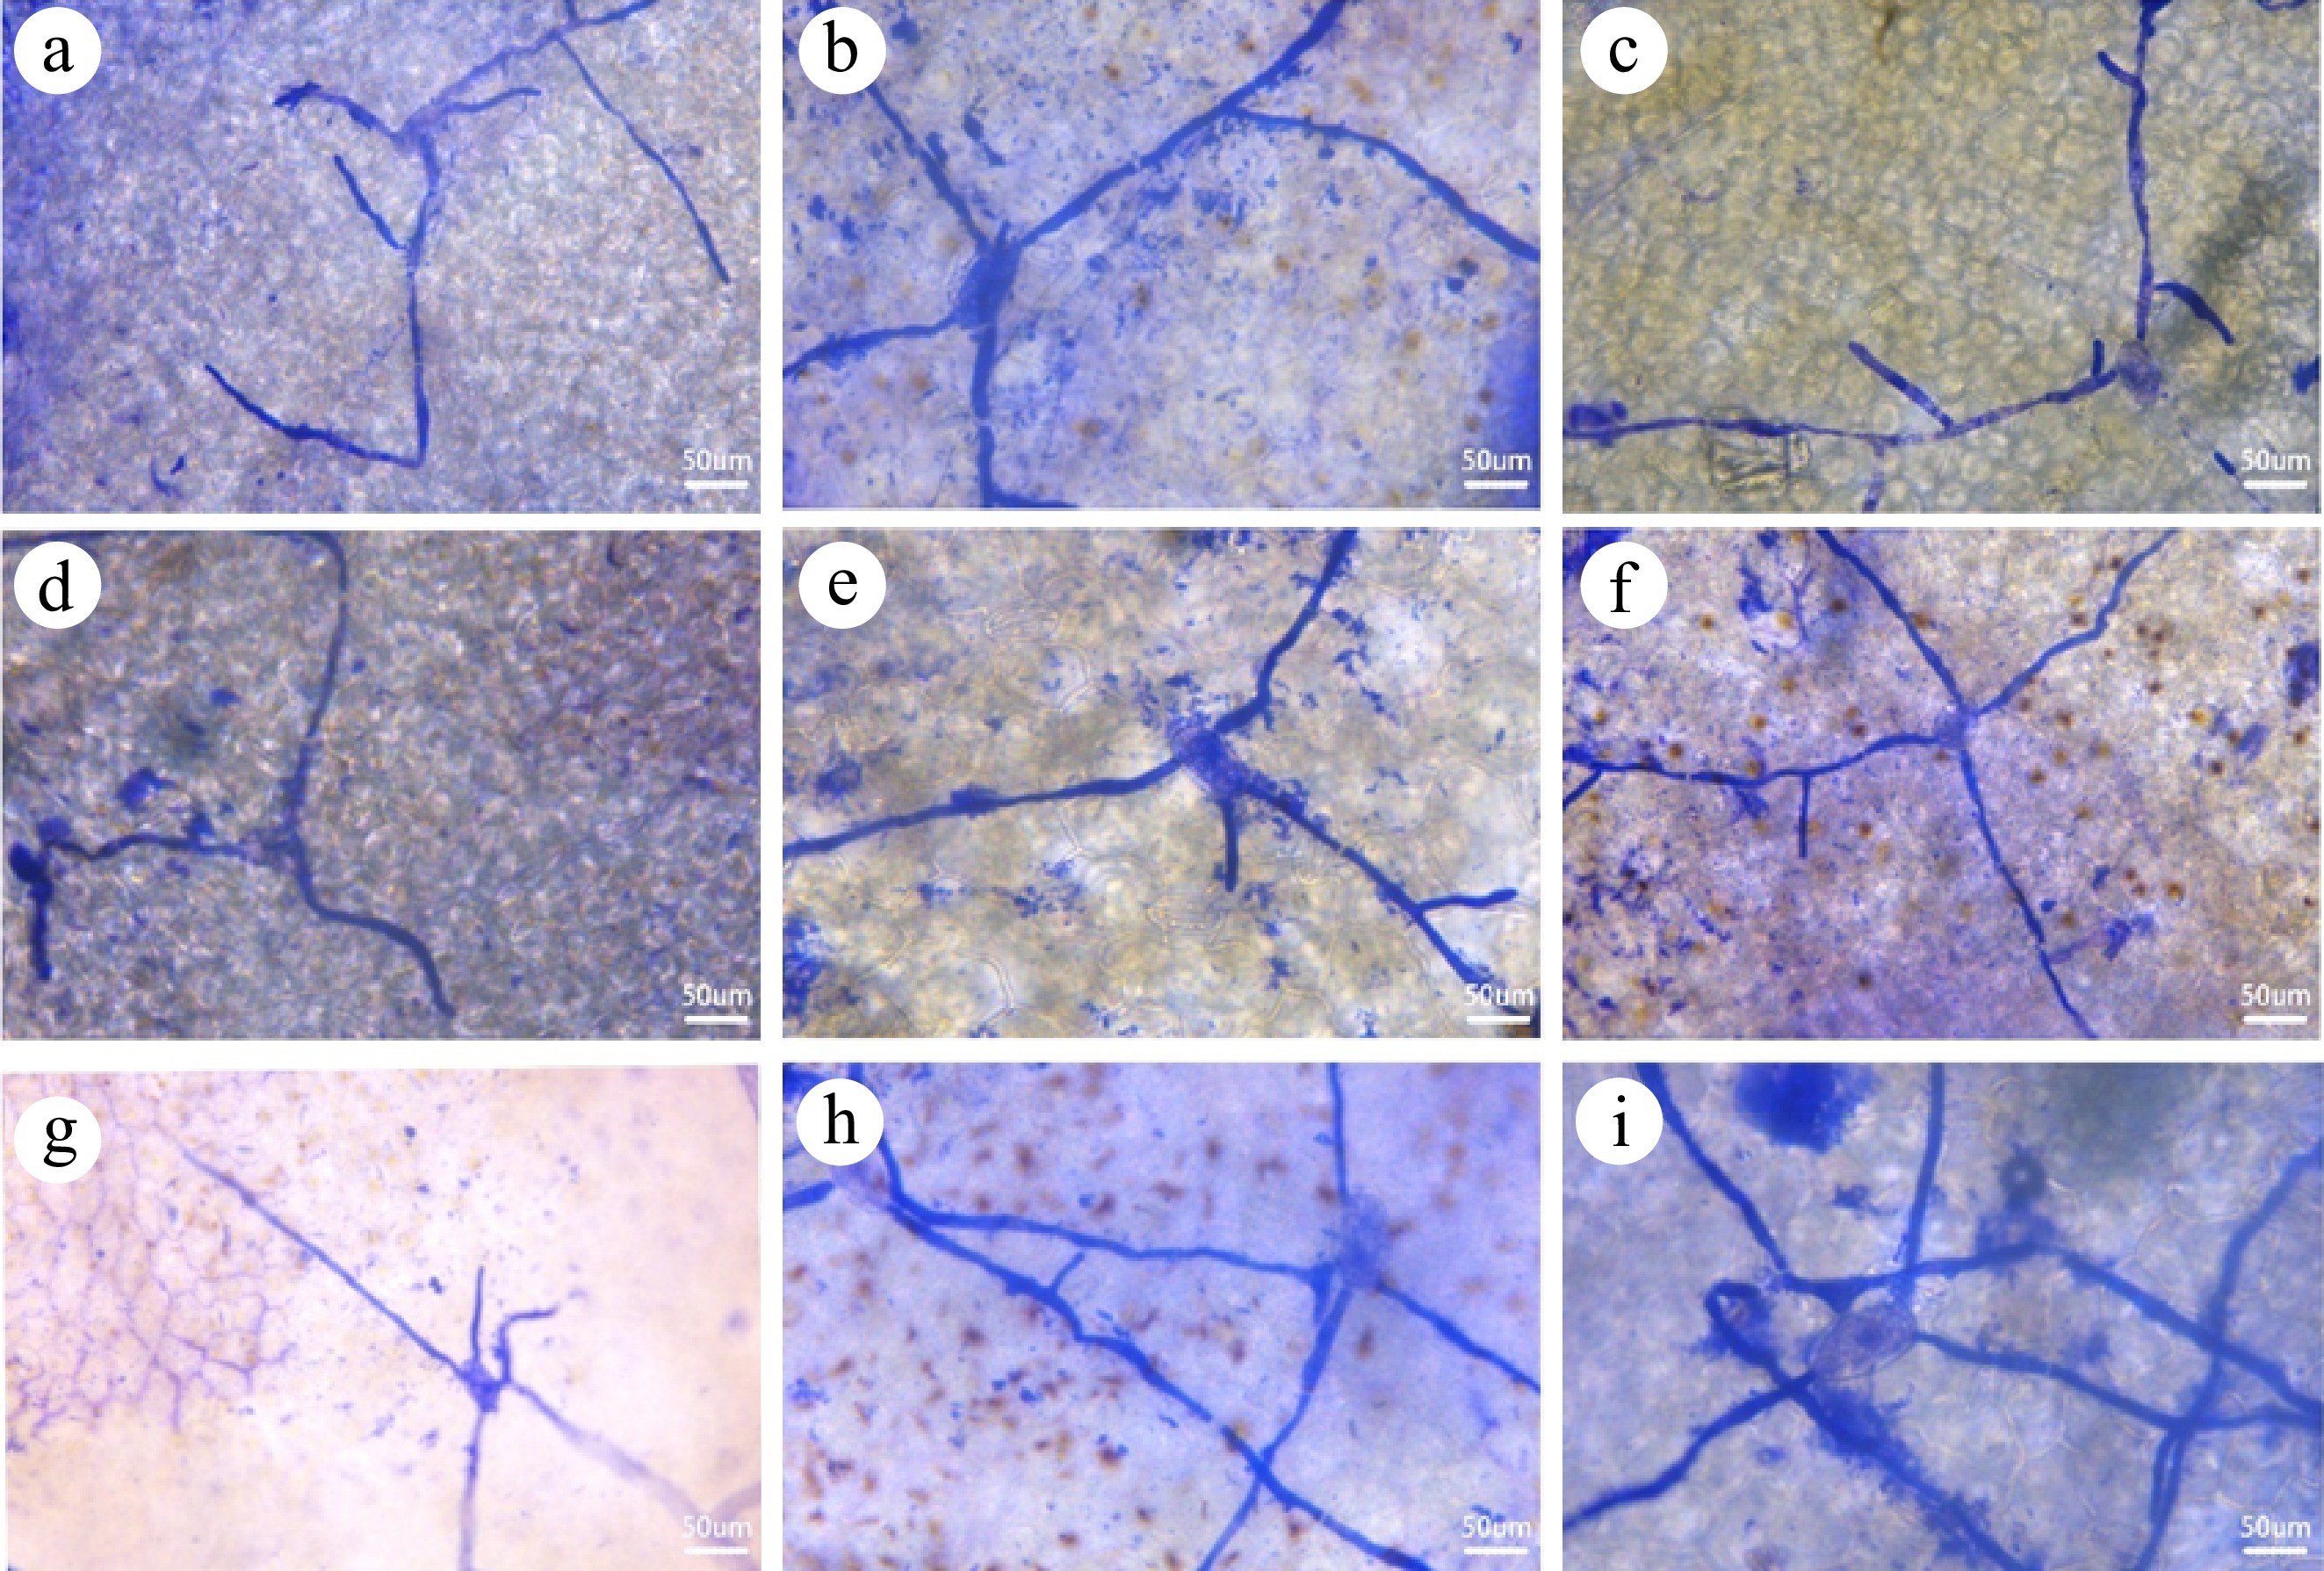
Figure 3.
Growth and development of powdery mildew fungus spores under different treatment combinations. (a)−(i) Correspond to the spore germination of treatment combinations T1−T9 after 72 h of inoculation.
-

Figure 4.
Effect of powdery mildew on dry and fresh weight of plants at different seedling ages. (a) The impact of inoculating powdery mildew at the one-true-leaf stage on the growth of cucumber seedlings. (b) The impact of inoculating powdery mildew at the two-true-leaf stage on the growth of cucumber seedlings. (c) The impact of inoculating powdery mildew at the three-true-leaf stage on the growth of cucumber seedlings. Values are means of minimum two replicates, with each containing five seedlings. Data are expressed as mean ± Standard error of mean, and significances were examined by one-way ANOVA, followed by Duncan's multiple comparisons test and different letters represent significant differences (p < 0.05).
-

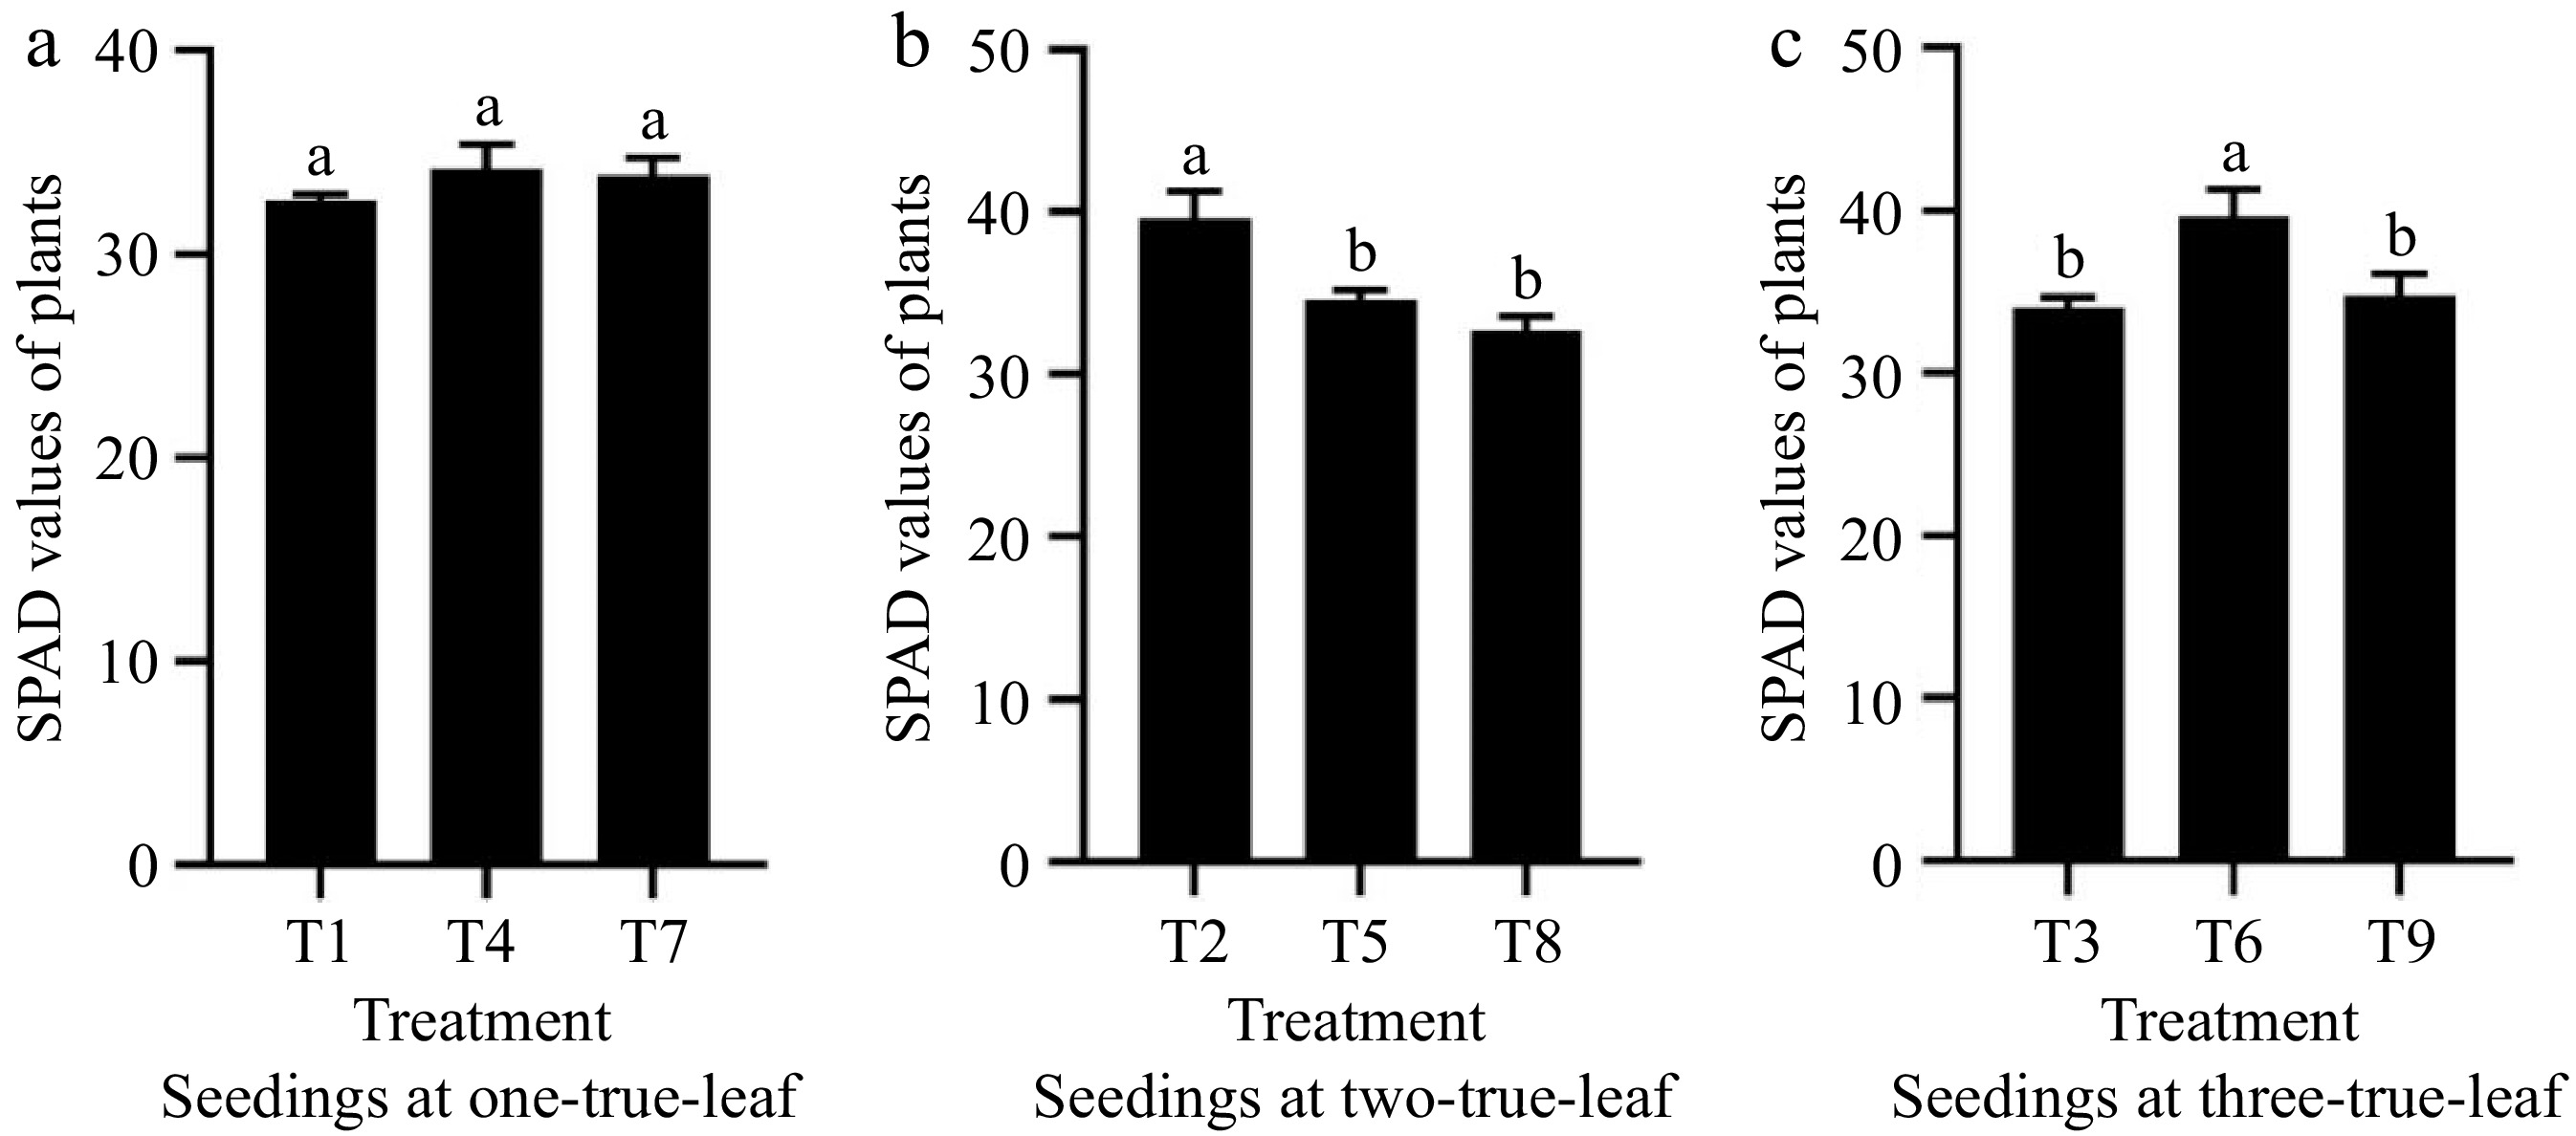
Figure 5.
Statistics of SPAD values of plants at different seedling ages under powdery mildew stress. (a) The effect of treatments T1, T4, and T7 on chlorophyll content in cucumber. (b) The effect of treatments T2, T5, and T8 on chlorophyll content in cucumber. (c) The effect of treatments T2, T5, and T8 on chlorophyll content in cucumber. Values are means of minimum two replicates, with each containing five seedlings. Data are expressed as mean ± Standard error of mean, and significances were examined by one-way ANOVA, followed by Duncan's multiple comparisons test and different letters represent significant differences (p < 0.05).
-
Factor Level 1 Level 2 Level 3 a Seedling age one-true-leaf two-true-leaf three-true-leaf b Spore suspension concentration: spores/mL 104 105 106 c Inoculation method spraying rubbing leaf brushing d Moisturizing time 12 h 24 h 36 h Table 1.
Factors and levels of cucumber powdery mildew seedling resistance identification test.
-
Test
no.Factor Scheme of orthogonal design a b c d T1 1 1 2 2 a1b1c2d2 one-true-leaf 104 rubbing 24 h T2 2 1 3 3 a2b2c3d3 two-true-leaf 104 leaf brushing 36 h T3 3 3 3 1 a3b3c1d1 three-true-leaf 106 leaf brushing 12 h T4 1 1 1 1 a1b1c1d3 one-true-leaf 104 spraying 12 h T5 2 2 2 1 a2b2c2d1 two-true-leaf 105 rubbing 12 h T6 3 2 1 3 a3b3c3d2 three-true-leaf 105 spraying 36 h T7 1 2 3 2 a1b1c3d1 one-true-leaf 105 leaf brushing 24 h T8 2 3 1 2 a2b2c1d2 two-true-leaf 106 spraying 24 h T9 3 3 2 3 a3b3c2d3 three-true-leaf 106 rubbing 36 h Table 2.
Cucumber powdery mildew seedling resistance identification implementation programme.
-
Grade Symptom 0 no symptom 1 < 5% of the surface area of the leaf 2 6%−25% of the leaf infected 3 26%−50% of the leaf infected 4 > 50% of the leaf infected Table 3.
Disease grading criteria for indoor seedling resistance identification.
-
Treatments Pn
(μmol/m2/s)Ci
(μmol/mol)E
(mmol/m2/s)Gs
(mol/m2/s)T1 3.29 bc 341.17 a 1.78 ab 0.13 ab T2 3.08 bc 325.84 a 1.41 b 0.09 b T3 2.42 de 229.12 b 0.49 cd 0.03 c T4 3.91 a 321.45 a 1.56 b 0.10 b T5 3.84 ab 343.73 a 2.18 a 0.15 a T6 3.71 ab 332.47 a 1.83 ab 0.12 ab T7 4.01 a 335.53 a 1.98 a 0.14 a T8 2.98 cd 220.68 b 0.81 c 0.05 c T9 1.92 e 208.43 b 0.29 d 0.02 c Different lowercase letters indicate significant differences between treatments (p < 0.05). Table 4.
Comparison of photosynthetic parameters of diseased plants in different treatments.
Figures
(5)
Tables
(4)