-

Figure 1.
Venn diagram of the homology search results against model plants databases, commercial fruits, and cactus. The number in the diagram corresponds to the number of transcripts from S. thurberi homologous to sequences from that plant species. (a) Homologous to sequences from Fragaria vesca (Fa), Persea americana (Pa), Prunus persica (Pp), Vitis vinifera (Vv), and Citrus sinensis (Cs). (b) Homologous to sequences from Opuntia streptacantha (Of), Selenicereus undatus (Su), Hylocereus polyrhizus (Hp), and Pachycereus pringlei (Pap). (c) Homologous to sequences from Solanum lycopersicum (Sl), Arabidopsis thaliana (At), from the commercial fruits (Fa, Pa, Pp, Vv, and Cs), or the cactus included in this study (Of, Su, Hp, and Pap). Homologous searching was carried out by BLAST alignment (E value < 1 × 10⁻⁵). The Venn diagrams were drawn by ggVennDiagram in R Studio.
-
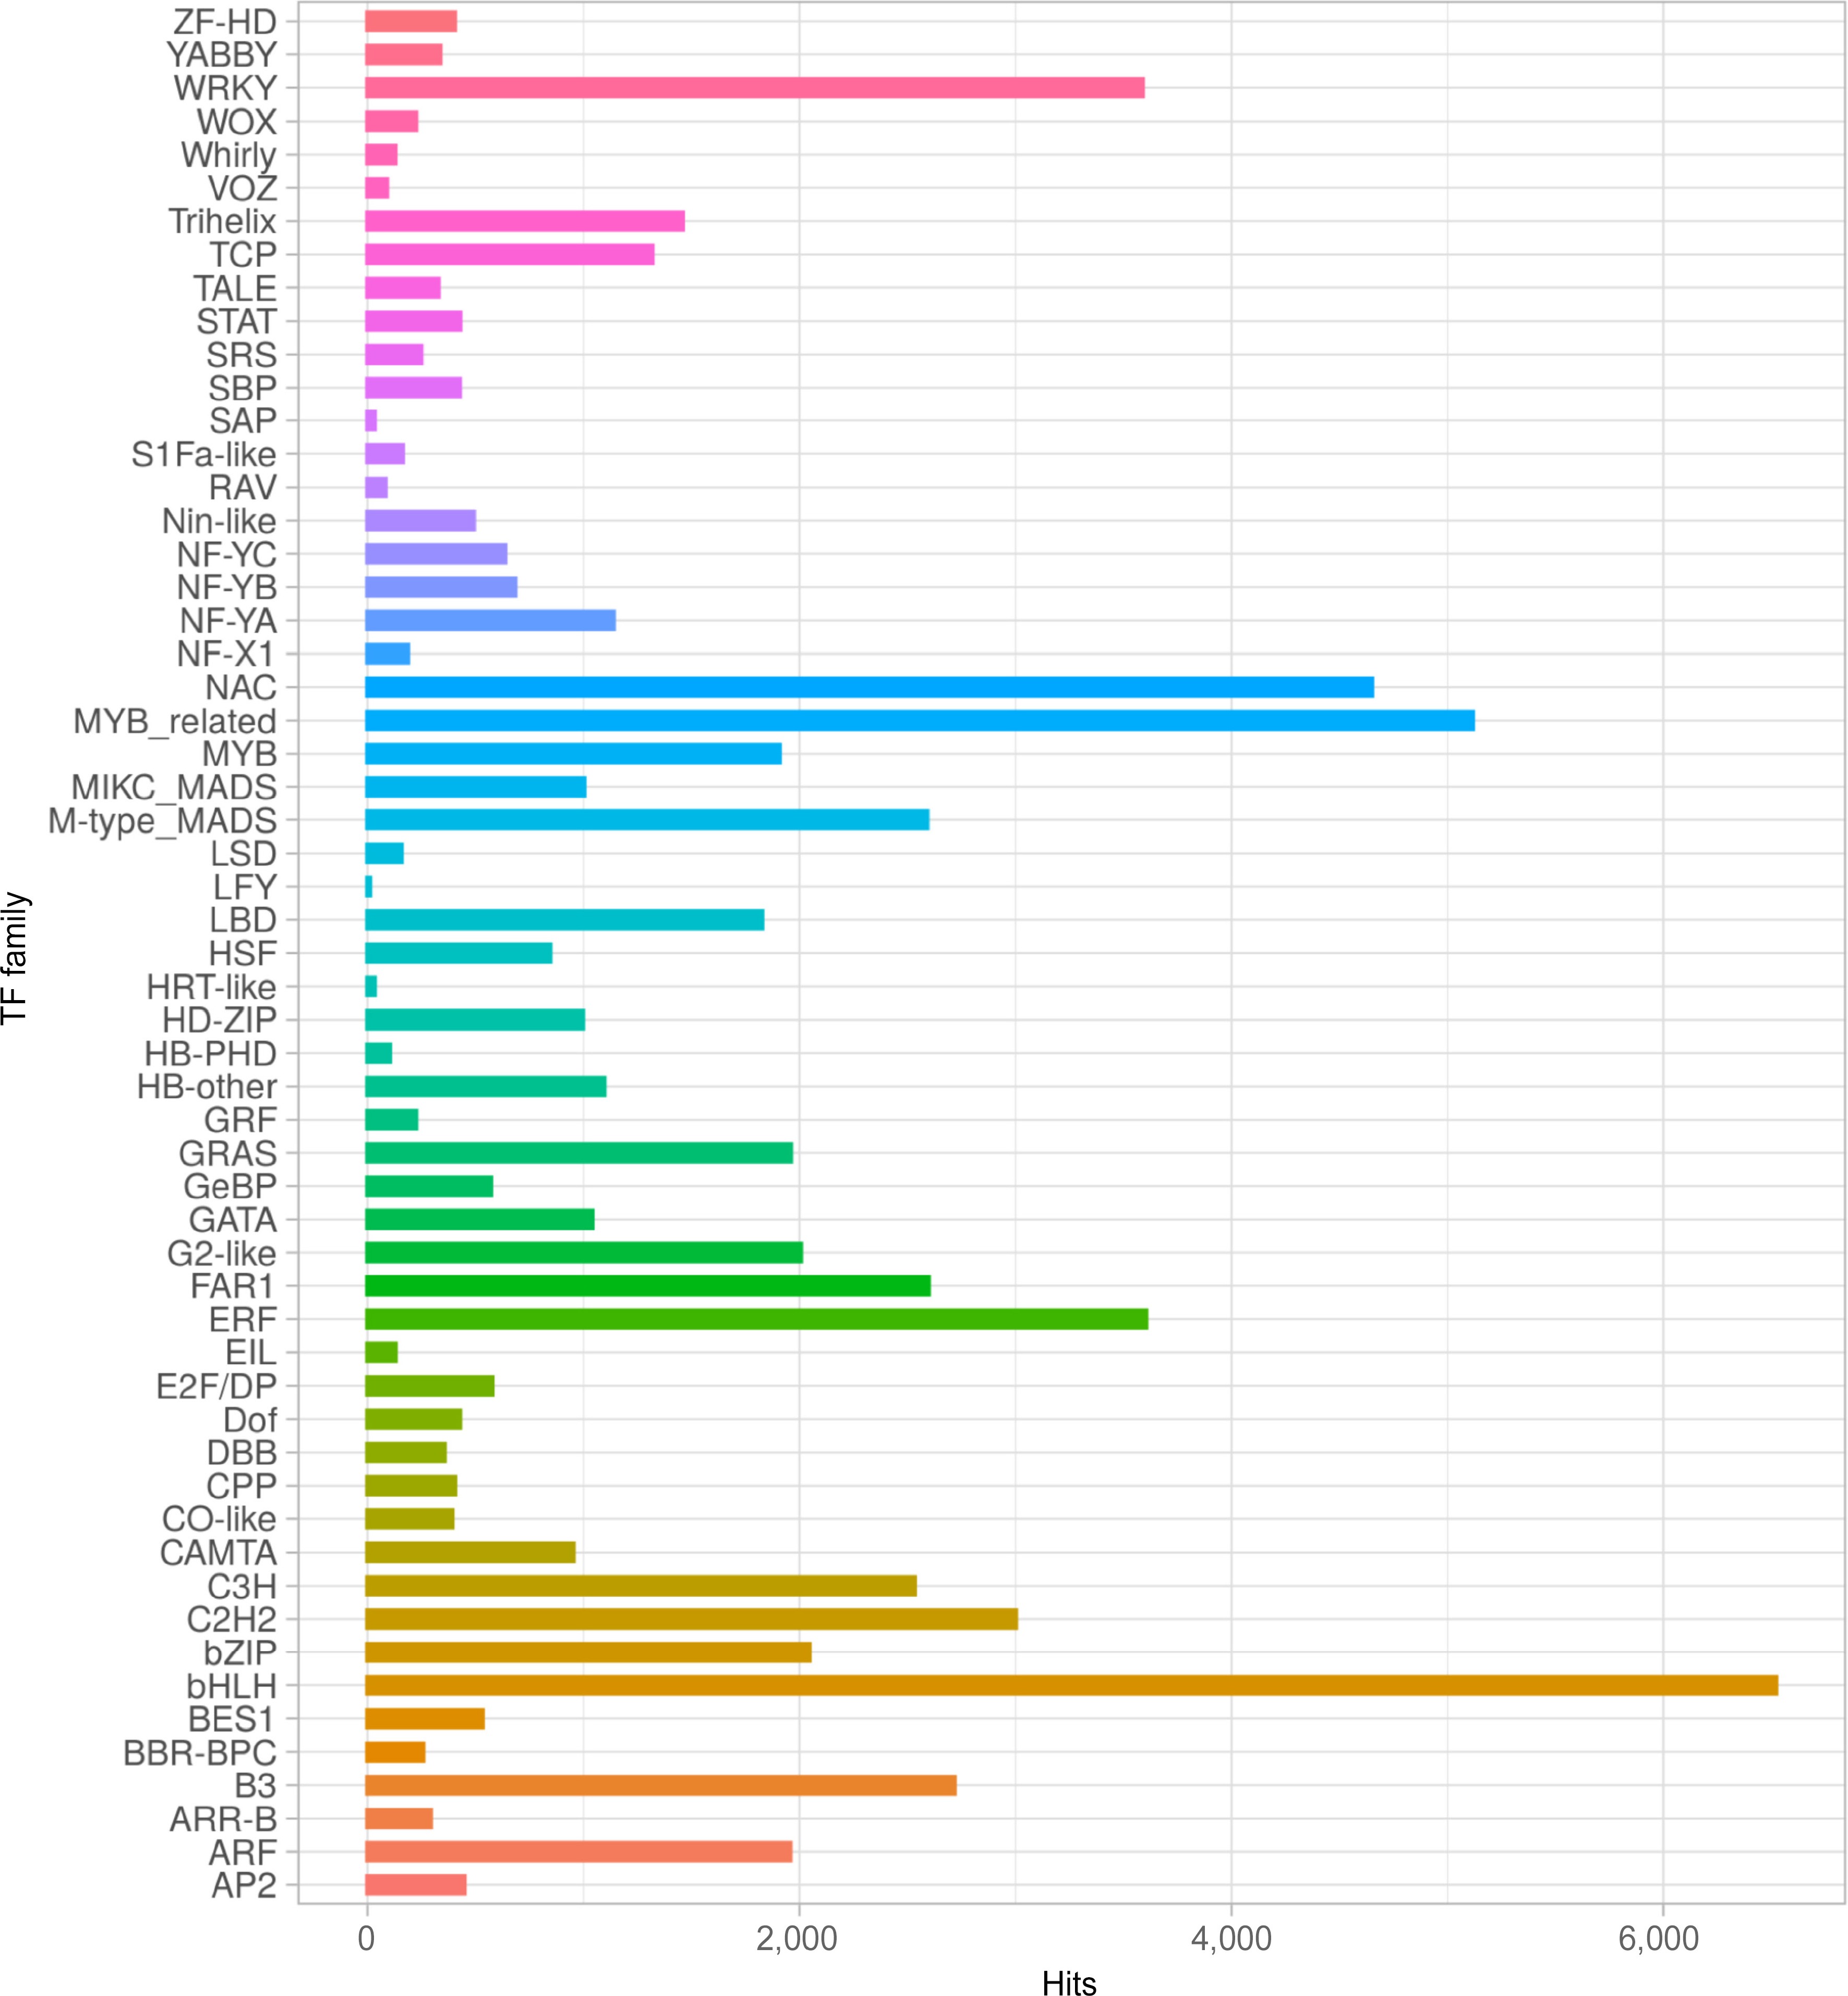
Figure 2.
Transcription factor (TF) families distribution of S. thurberi fruit peel transcriptome. The X-axis indicates the number of transcripts with hits to each TF family. Alignment to the PlantTFDB database by BLASTx was carried out with an E value threshold of 1 × 10⁻⁵. The bar graph was drawn by ggplot2 in R Studio.
-
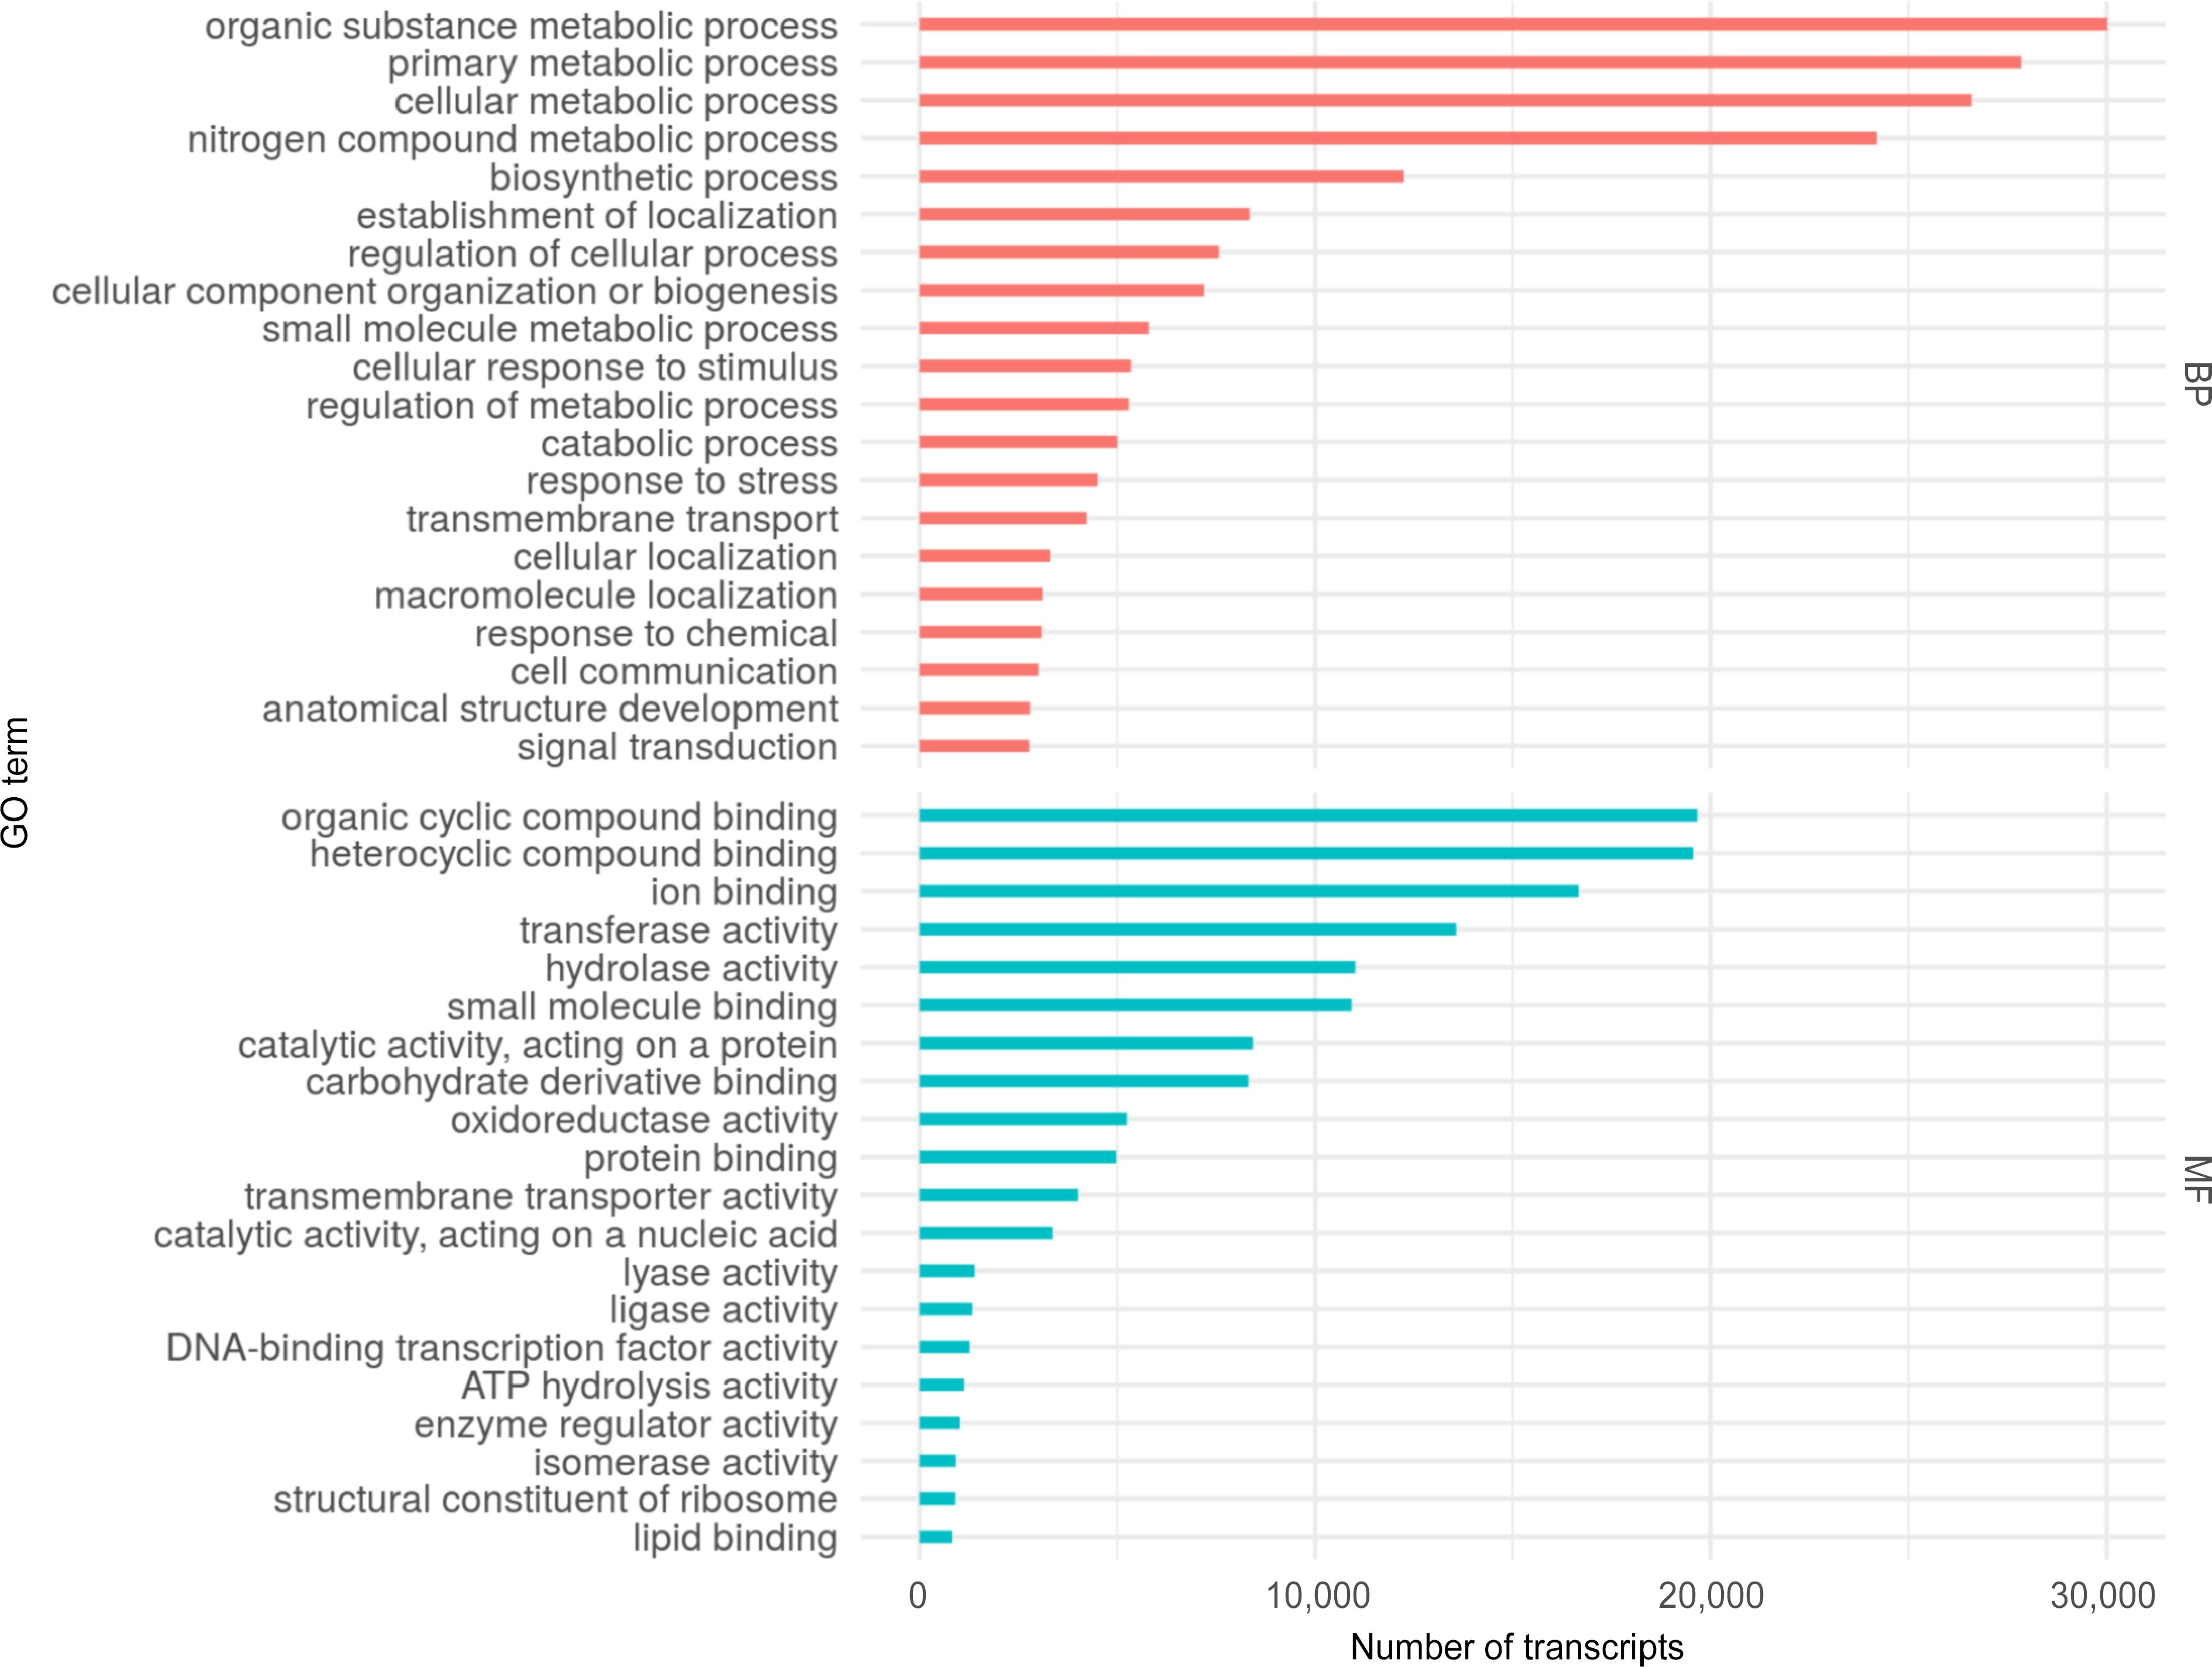
Figure 3.
Top 20 Gene Ontology (GO) terms assigned to the S. thurberi fruit peel transcriptome. Bars indicate the number of transcripts assigned to each GO term. Assignment of GO terms was carried out by Blast2GO with default parameters. BP and MF mean Biological Processes and Molecular Functions GO categories, respectively. The graph was drawn by ggplot2 in R Studio.
-
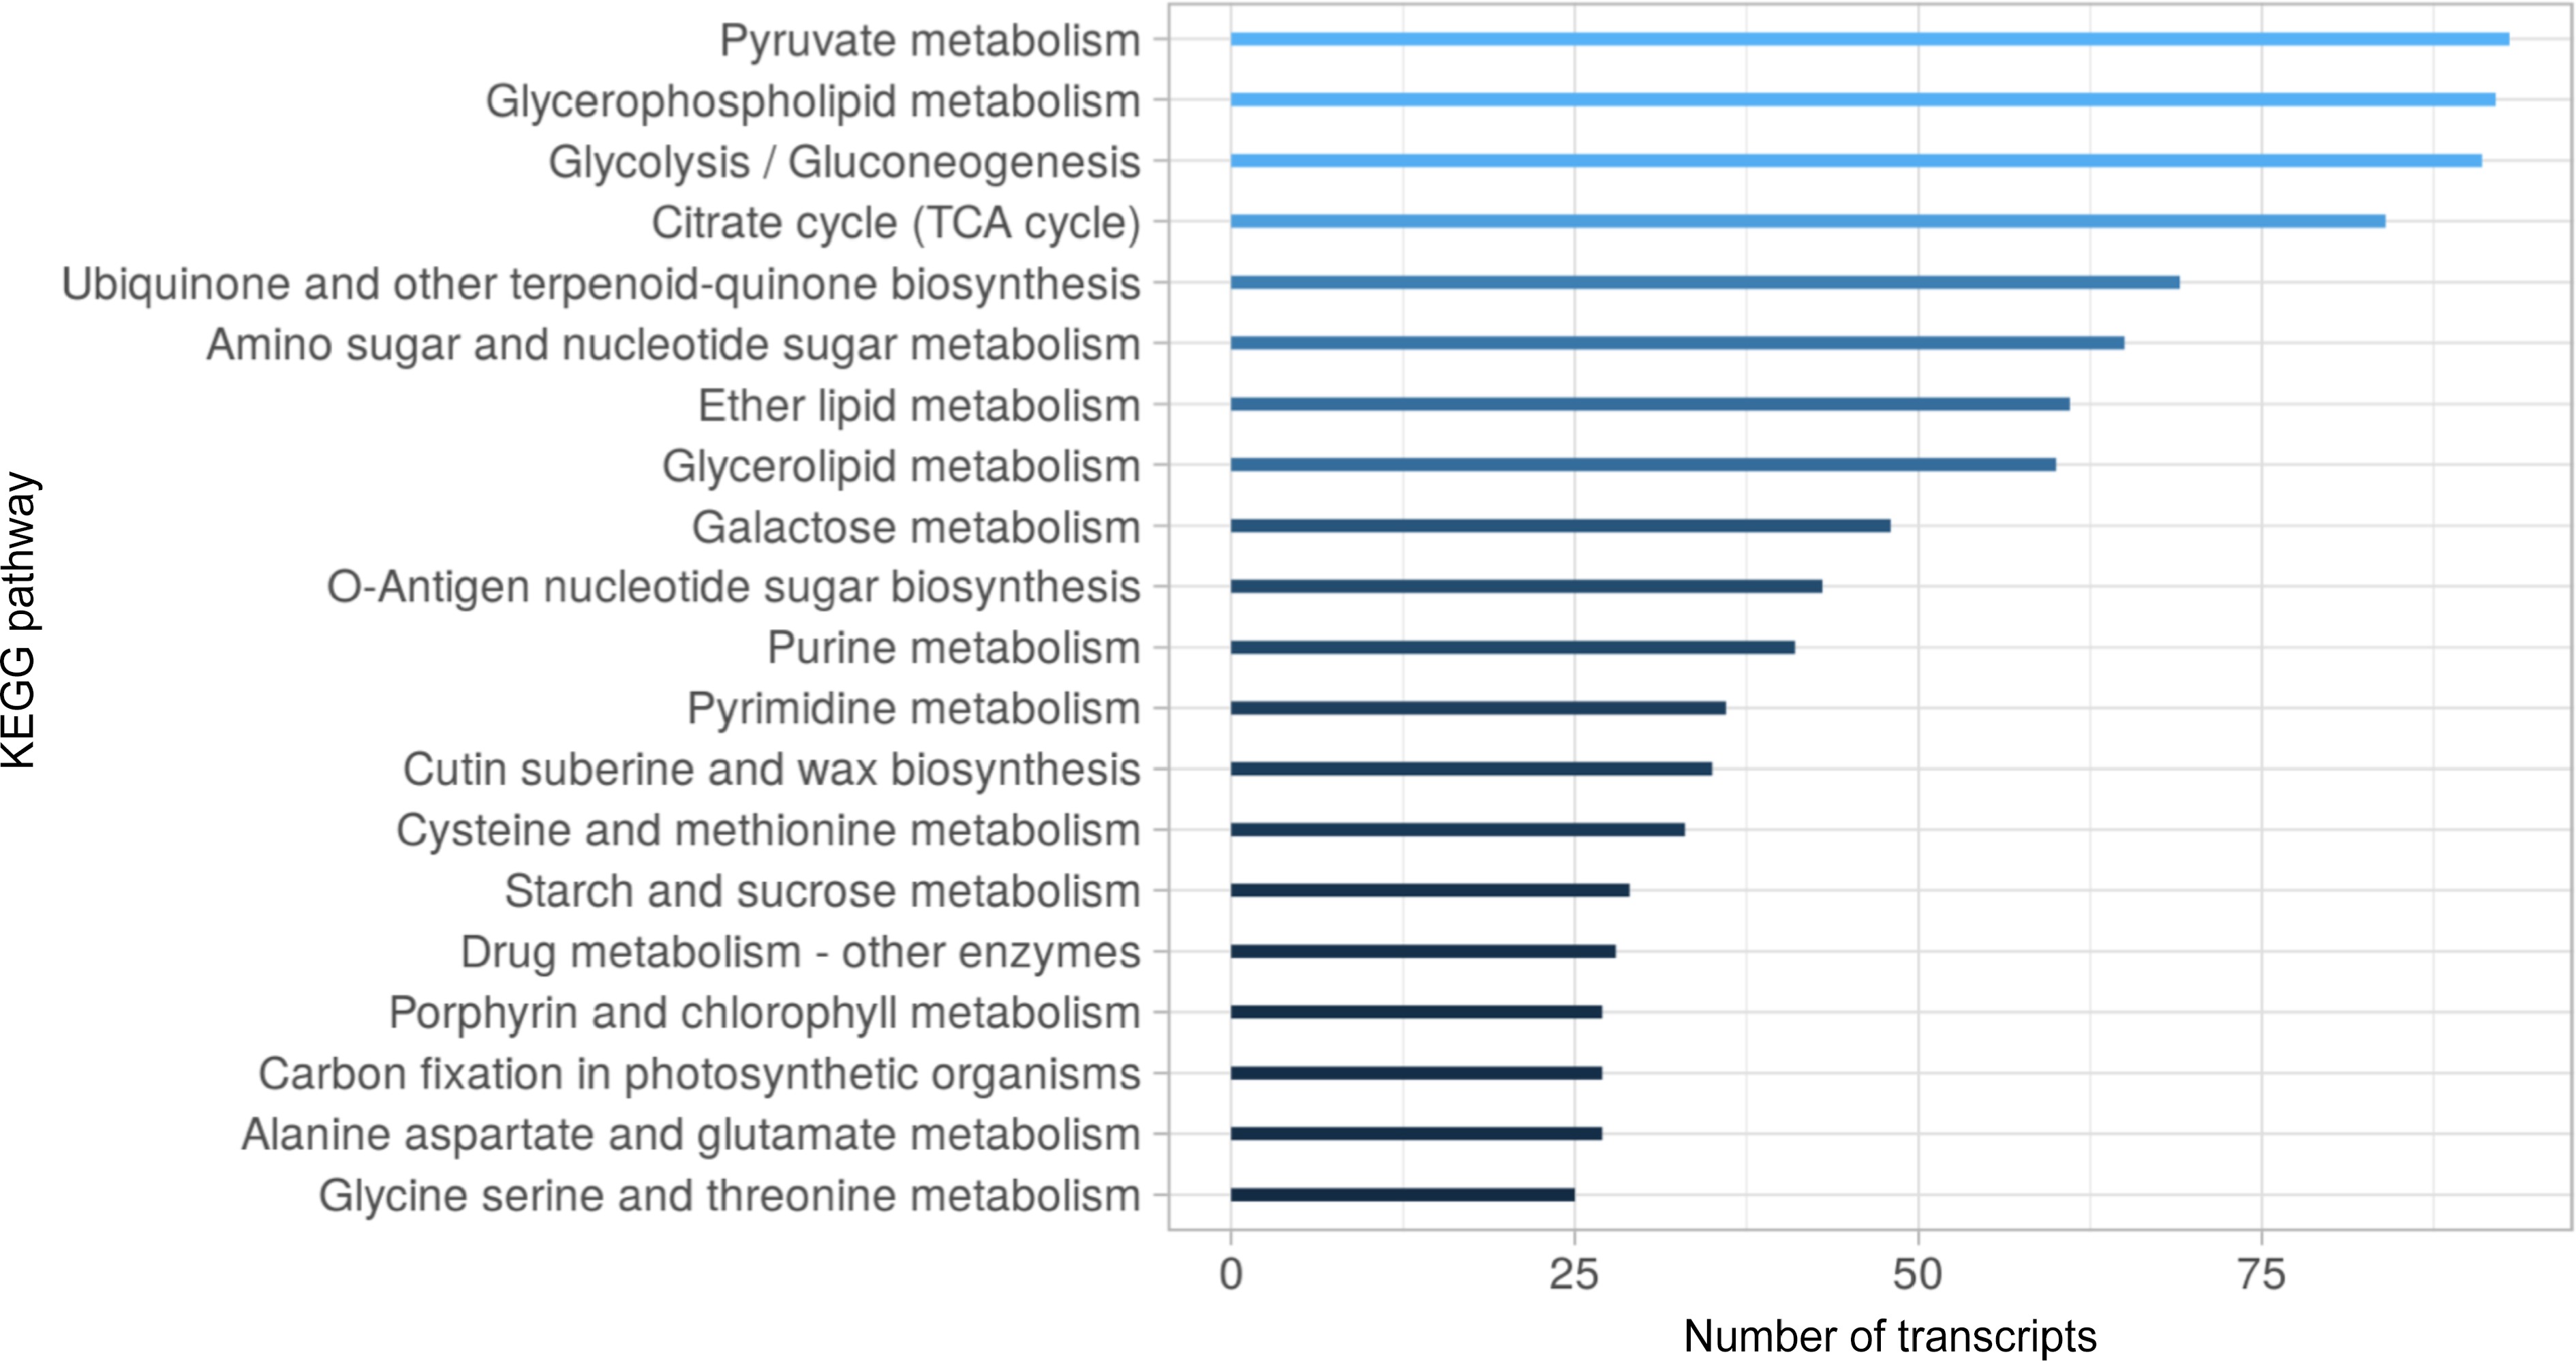
Figure 4.
Top 20 KEGG metabolic pathways distribution in the S. thurberi fruit peel transcriptome. Bars indicate the number of transcripts assigned to each KEGG pathway. Assignment of KEGG pathways was carried out in the Blast2GO suite. The bar graph was drawn by ggplot2 in R Studio.
-
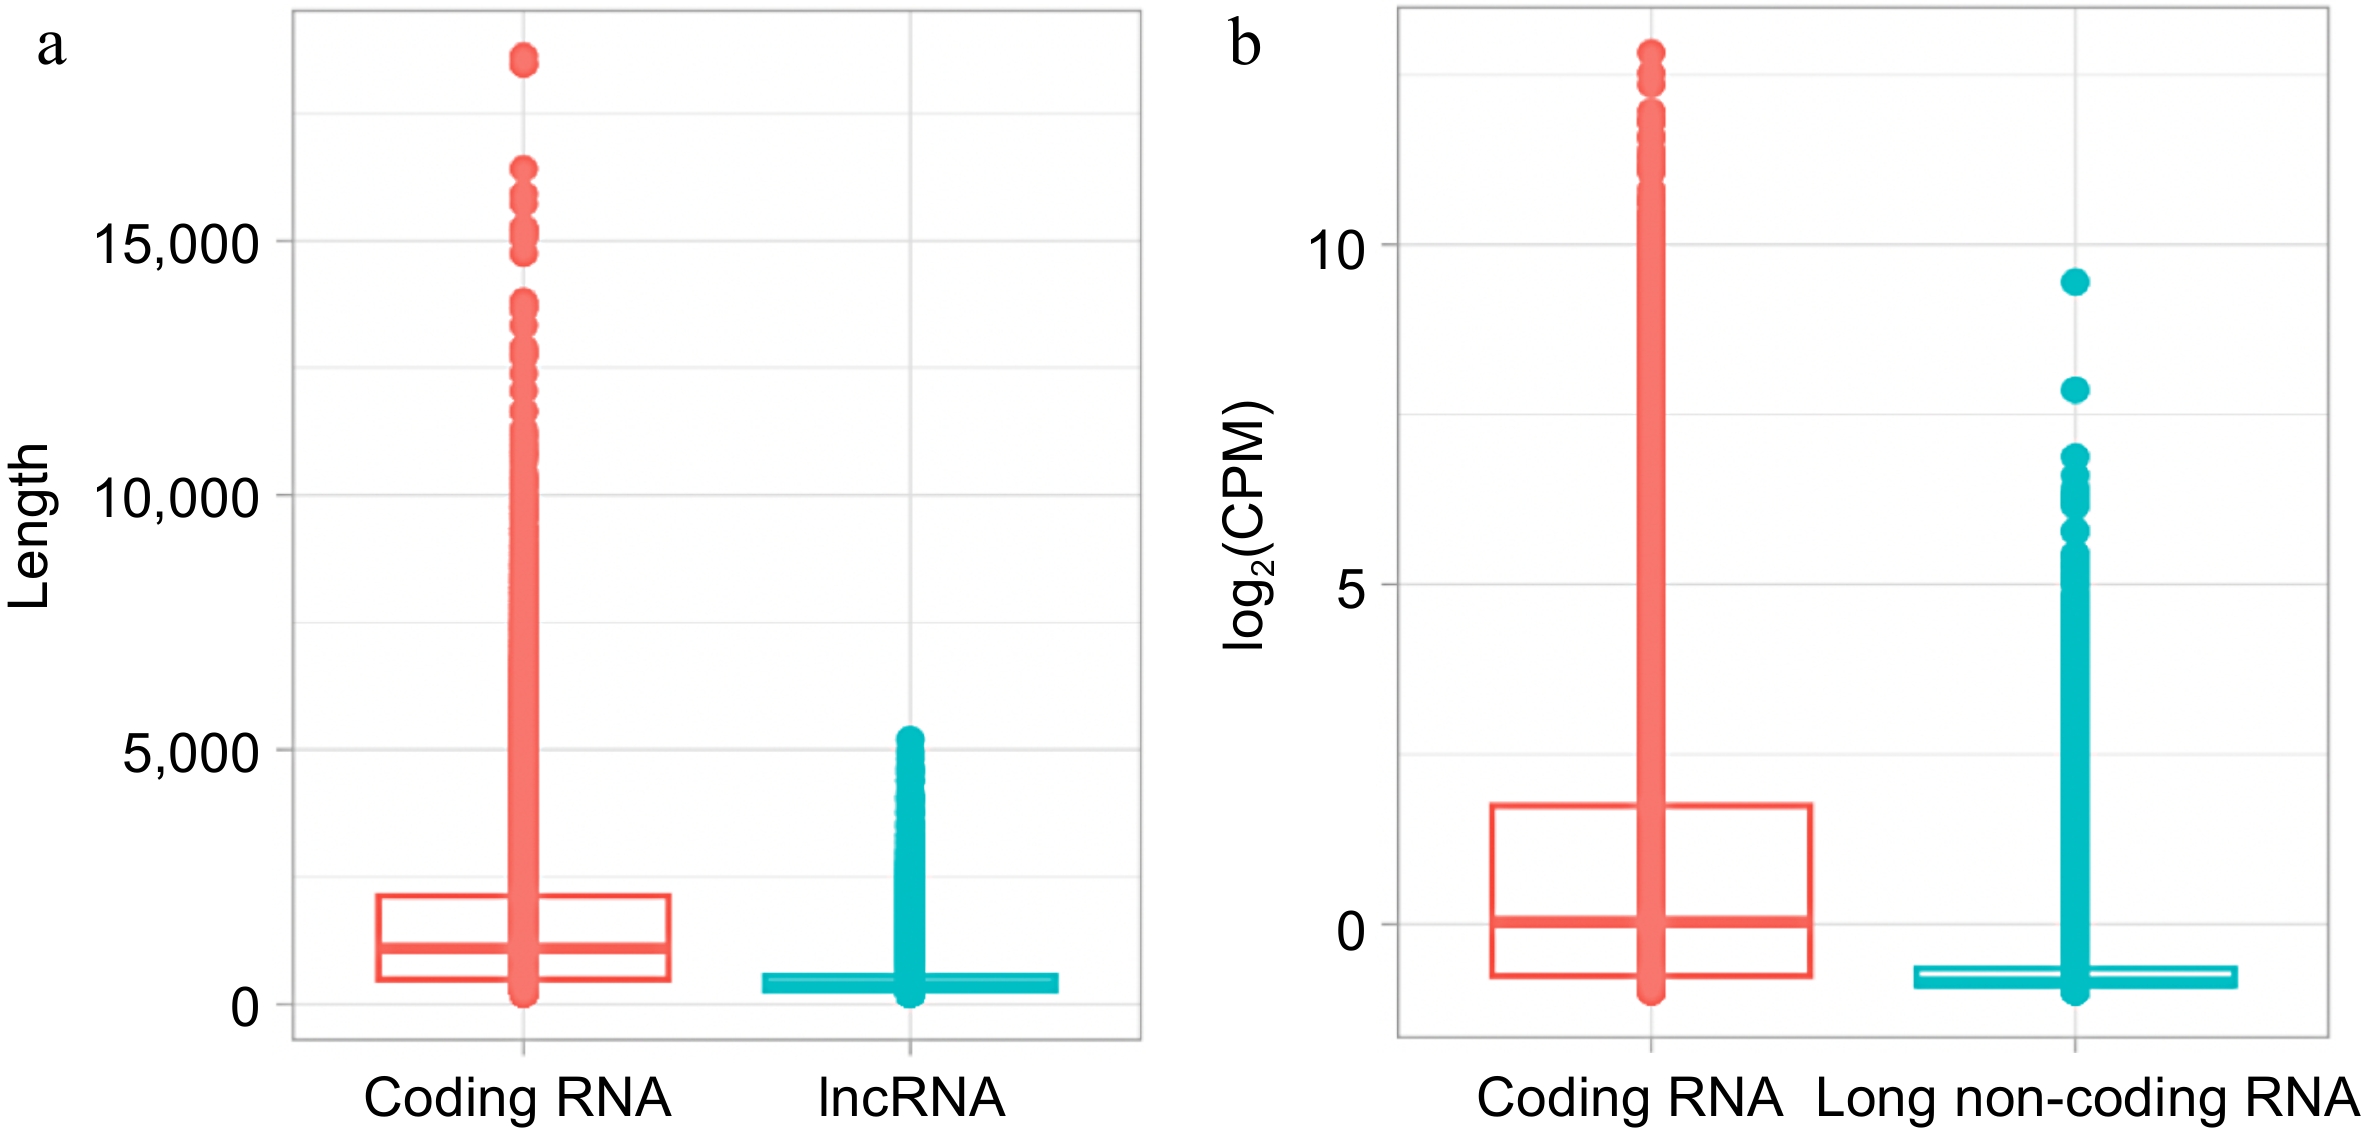
Figure 5.
Comparison of coding RNA and long non-coding RNA (lncRNA) from S. thurberi transcriptome. (a) Box plot of transcript length distribution. The Y-axis indicates the length of each transcript in base pairs. (b) Box plot of expression levels. The Y-axis indicates the log2 of the count per million of reads (log2(CPM)) recorded for each transcript. Expression levels were calculated by the edgeR package in R studio. (a), (b) The lines inside the boxes indicate the median. The higher and lower box limits represent the 75th and 25th percentiles, respectively. The box plots were drawn by ggplot2 in R Studio.
-
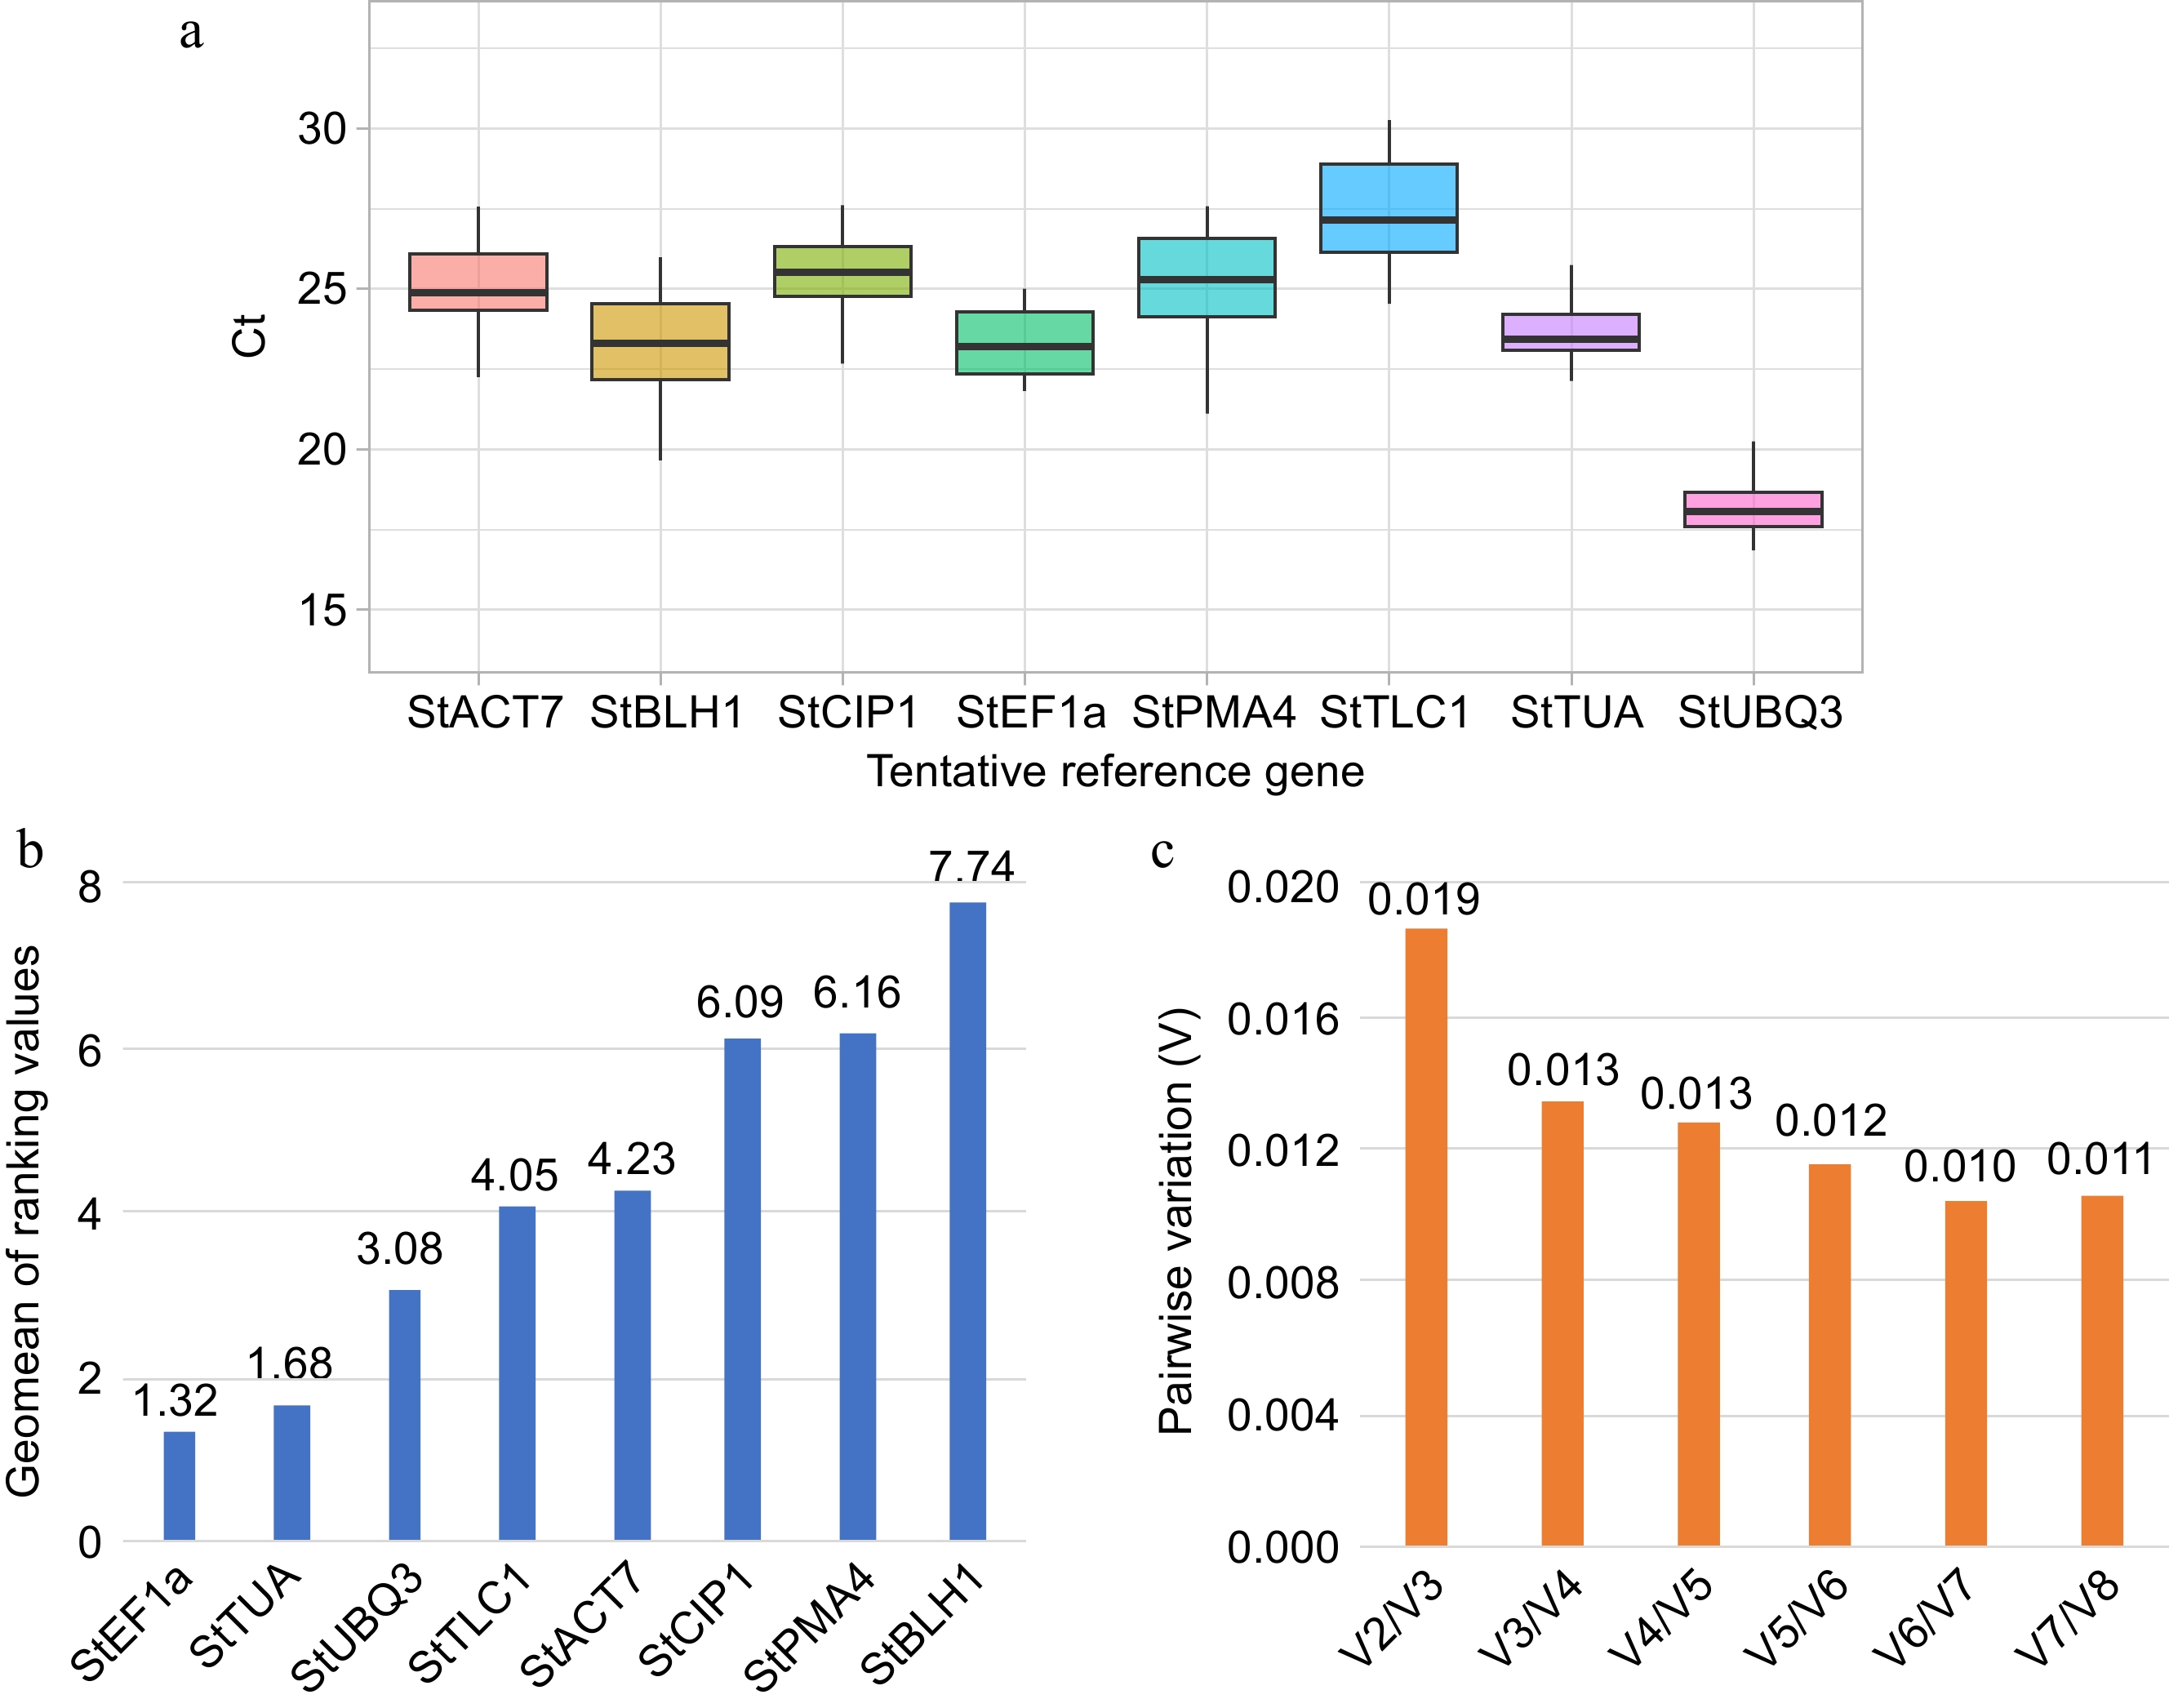
Figure 6.
Expression stability analysis of tentative reference genes. (a) Box plot of cycle threshold (Ct) distribution of candidate reference genes during sweet pitaya fruit development (10, 20, 30, 35, and 40 d after flowering). The black line inside the box indicates the median. The higher and lower box limits represent the 75th and 25th percentiles, respectively. (b) Bar chart of the geometric mean (geomean) of ranking values calculated by RefFinder for each tentative reference gene (X-axis). The lowest values indicate the best reference genes. (c) Bar chart of the pairwise variation analysis and determination of the optimal number of reference genes by the geNorm algorithm. A pairwise variation value lower than 0.15 indicates that the use of Vn/Vn + 1 reference genes is reliable for the accurate normalization of qRT-PCR data. The Ct data used in the analysis were calculated by qRT-PCR in a QIAquant 96 5 plex (QIAGEN) according to the manufacturer's protocol. The box plot and the bar graphs were drawn by ggplot2 and Excel programs, respectively. Abbreviations: Actin 7 (StACT7), alpha-tubulin (StTUA), elongation factor 1-alpha (StEF1a), COP1-interactive protein 1 (StCIP1), plasma membrane ATPase 4 (StPMA4), BEL1-like homeodomain protein 1 (StBLH1), polyubiquitin 3 (StUBQ3), and plastidic ATP/ADP-transporter (StTLC1).
-

Figure 7.
Expression analysis of cuticle biosynthesis-related transcripts StCYP77A, StGDSL1, and StABCG11 during sweet pitaya (Stenocereus thurberi) fruit development. Relative expression was calculated through the 2−ΔΔCᴛ method using elongation factor 1-alpha (StEF1a), alpha-tubulin (StTUA), polyubiquitin 3 (StUBQ3), or StEF1a + StTUA as normalizing genes at 10, 20, 30, 35, and 40 d after flowering (DAF). The Y-axis and error bars represent the mean of the relative expression ± standard error (n = 4−6) for each developmental stage in DAF. The Ct data for the analysis was recorded by qRT-PCR in a QIAquant 96 5 plex (QIAGEN) according to the manufacturer's protocol. The graph line was drawn by ggplot2 in R Studio. Abbreviations: cytochrome p450 family 77 subfamily A (StCYP77A), Gly-Asp-Ser-Leu motif lipase/esterase 1 (StGDSL1), and ATP binding cassette transporter subfamily G member 11 (StABCG11).
-
Metric Data Total transcripts 174,449 N50 2,110 Smallest transcript length (bp) 200 Largest transcript length (bp) 19,114 Mean transcript length (bp) 1,198.69 GC (%) 41.33 Total assembled bases 209,110,524 TransRate score 0.05 BUSCO score (%) C: 85.38 (S:48.22, D:37.16),
F: 10.69, M: 3.93.Values were calculated through the TrinityStats function of Trinity and TransRate software. Completeness analysis was carried out through BUSCO by aligning the transcriptome to the Embryophyte database through BLAST with an E value threshold of 1 × 10⁻³. Complete (C), single (S), duplicated (D), fragmented (F), missing (M). Table 1.
Quality metrics of the Stenocereus thurberi fruit peel transcriptome.
Figures
(7)
Tables
(1)