-
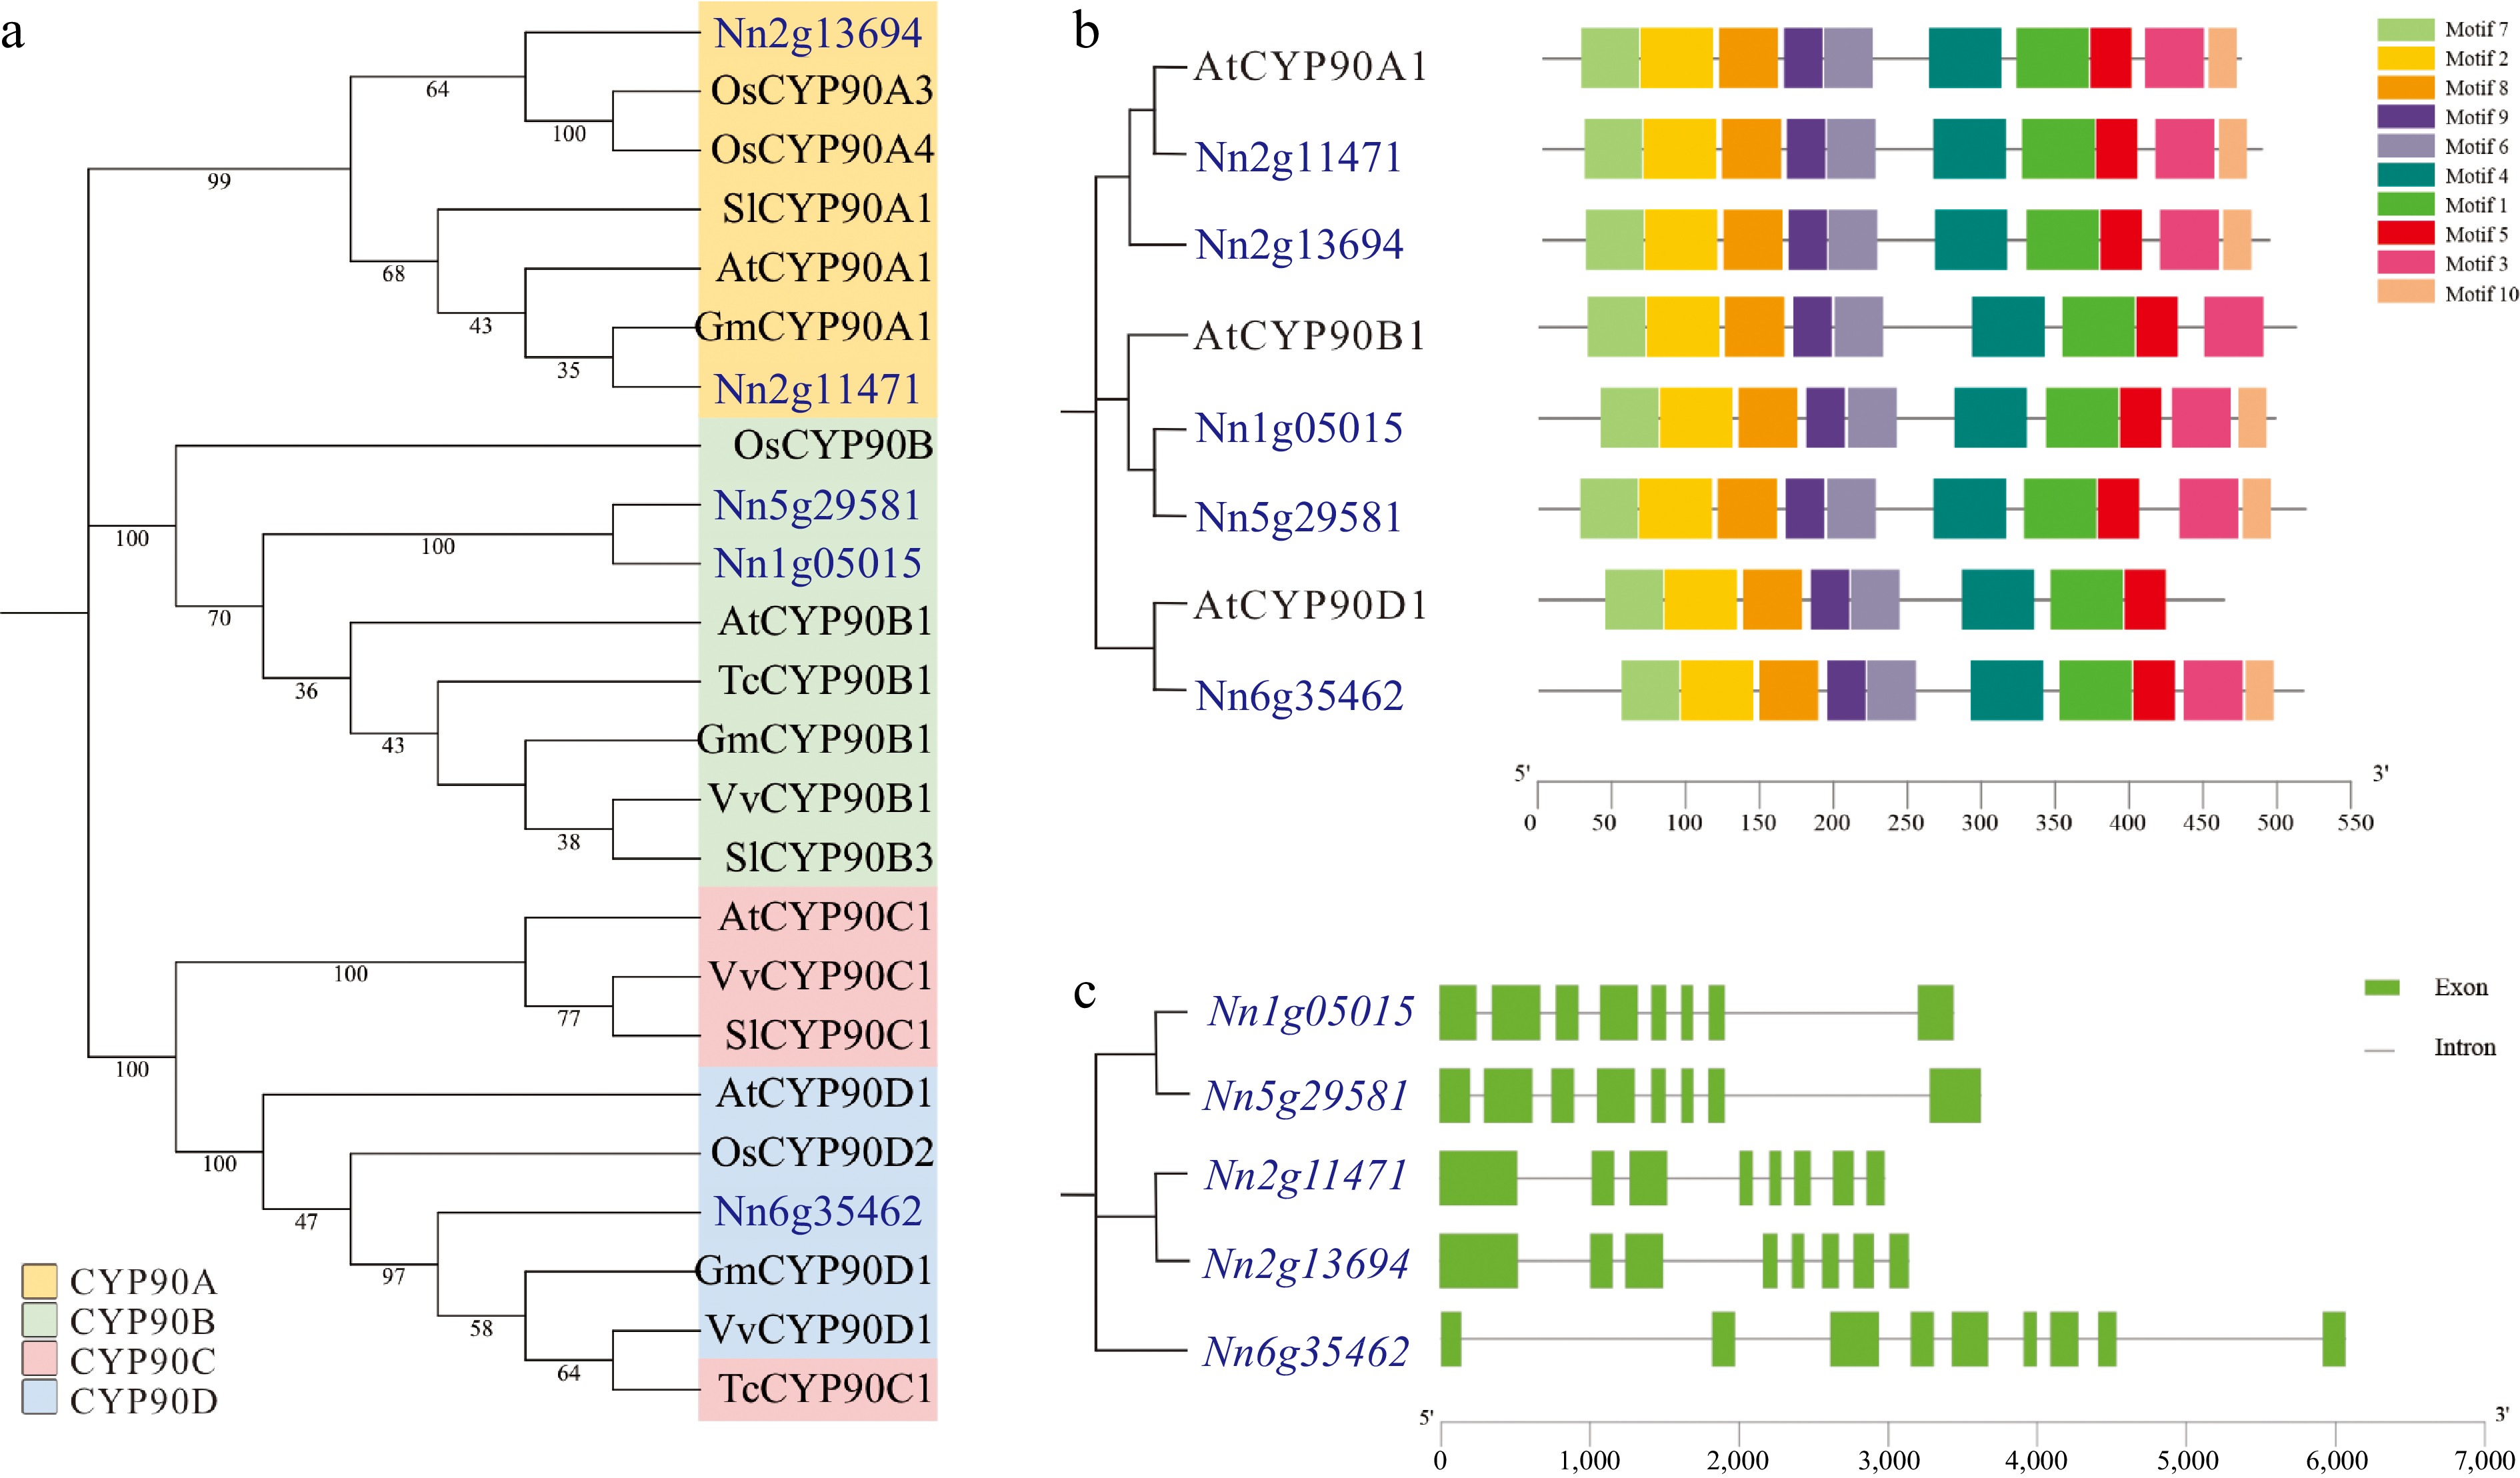
Figure 1.
Phylogenetic analysis, conserved protein domains, and gene structures of NnCYP90 family. (a) Phylogenetic tree of the CYP90 protein family from Nelumbo nucifera (Nn), Arabidopsis thaliana (At), Glycine max (Gm), Theobroma cacao (Tc), Solanum lycopersicum (Sl), Vitis vinifera (Vv) and Oryza sativa (Os). The CYP90A, B, C, and D subfamilies are represented by yellow, green, red, and blue area, respectively. (b) Conserved domains analysis of CYP90 members in lotus and Arabidopsis. (c) Gene structures of NnCYP90 members.
-
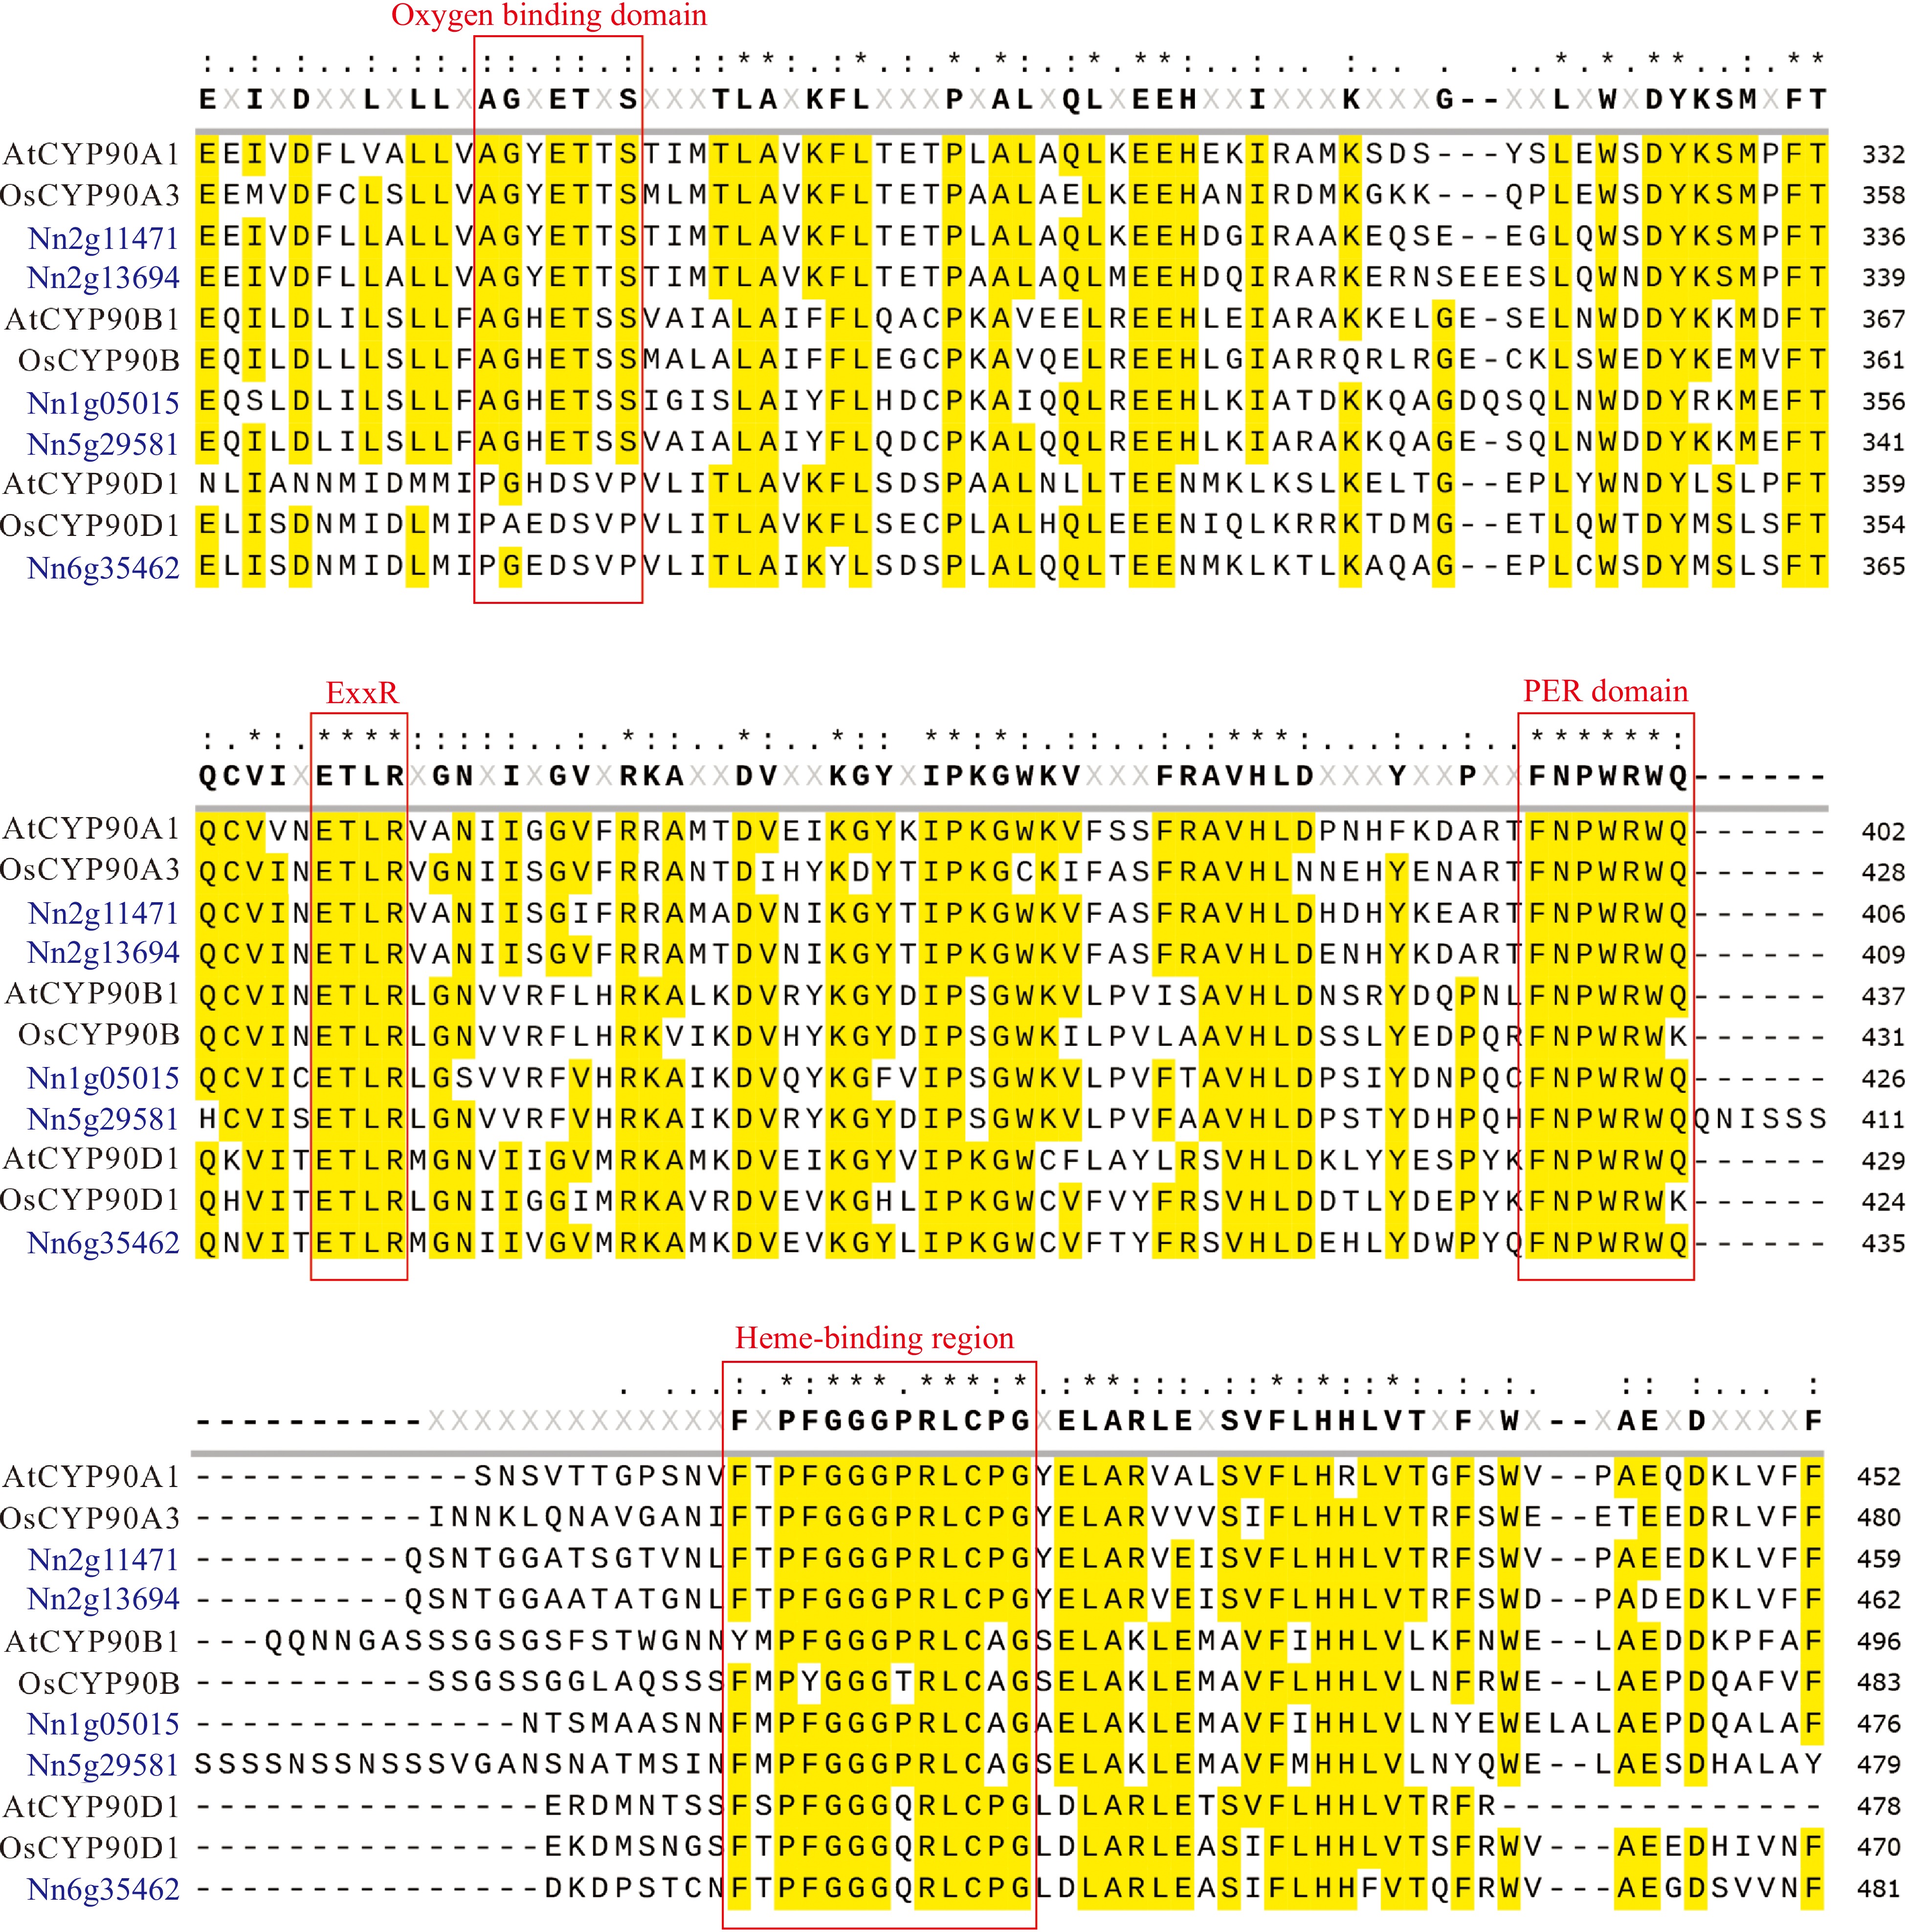
Figure 2.
Sequence alignment of five NnCYP90 proteins with Arabidopsis AtCYP90A1, AtCYP90B1, AtCYP90D1, and rice OsCYP90A3, OsCYP90B, and OsCYP90D2. Conserved amino acid domains are highlighted by the red box.
-
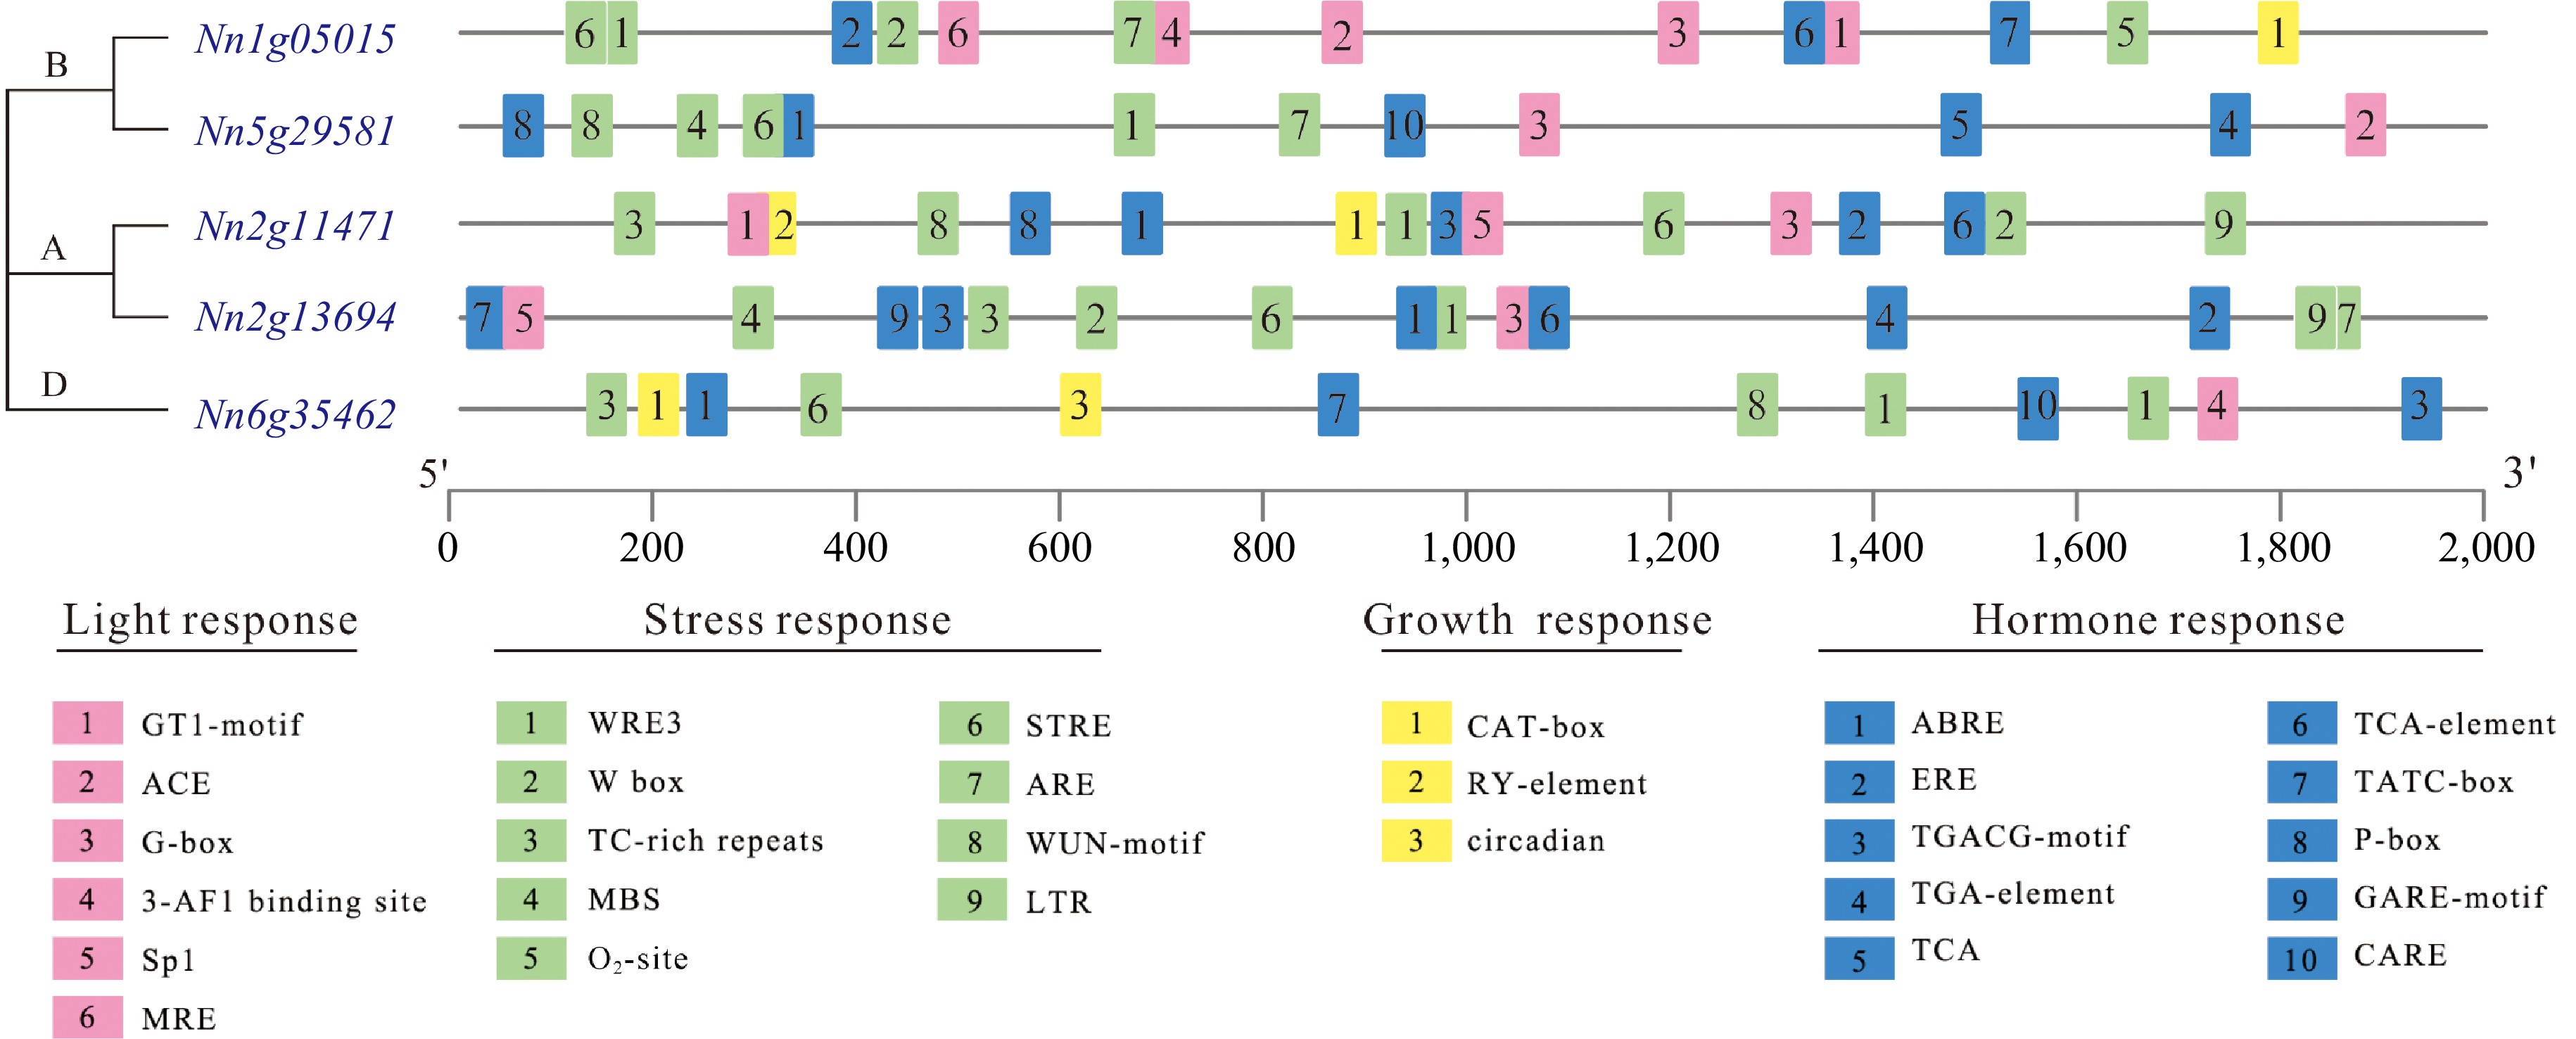
Figure 3.
The cis-acting elements identified in the promoters of NnCYP90 in lotus.
-
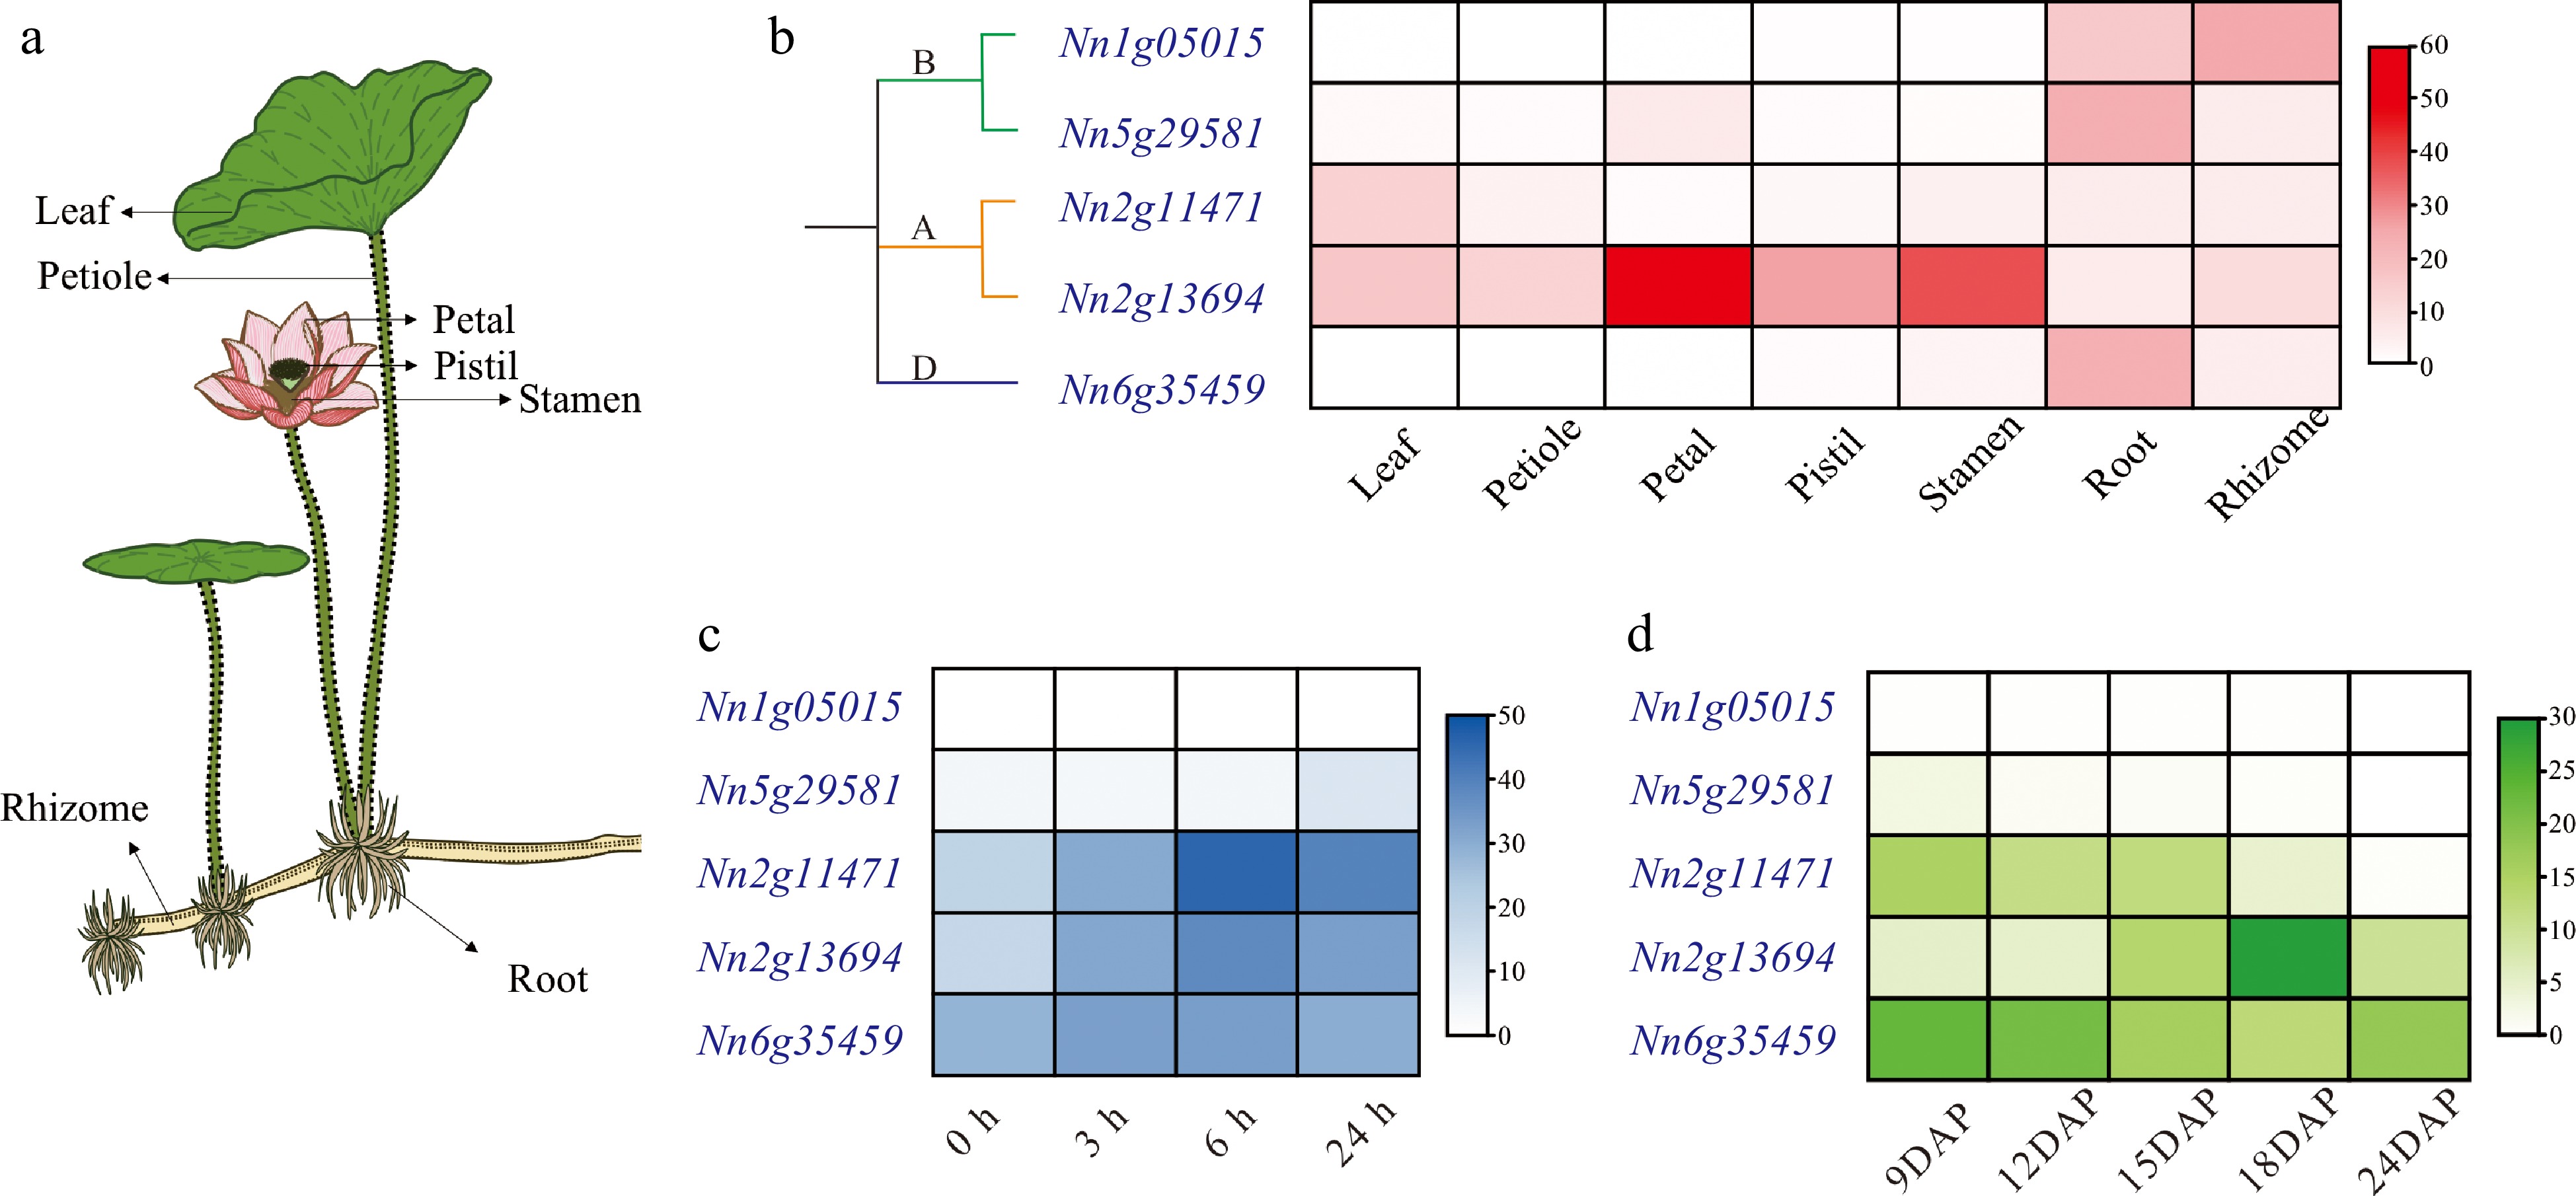
Figure 4.
Expression patterns of NnCYP90s. (a) Schematic depiction of seven tissues from lotus. (b) Spatial expression profiles of NnCYP90 in seven tissues. (c) Temporal expression profiles of NnCYP90 in leaves treated with 100 µM MeJA over a time course (0, 3, 6, 24 h). (d) Temporal expression profiles of NnCYP90 in embryos at different development DAP.
-
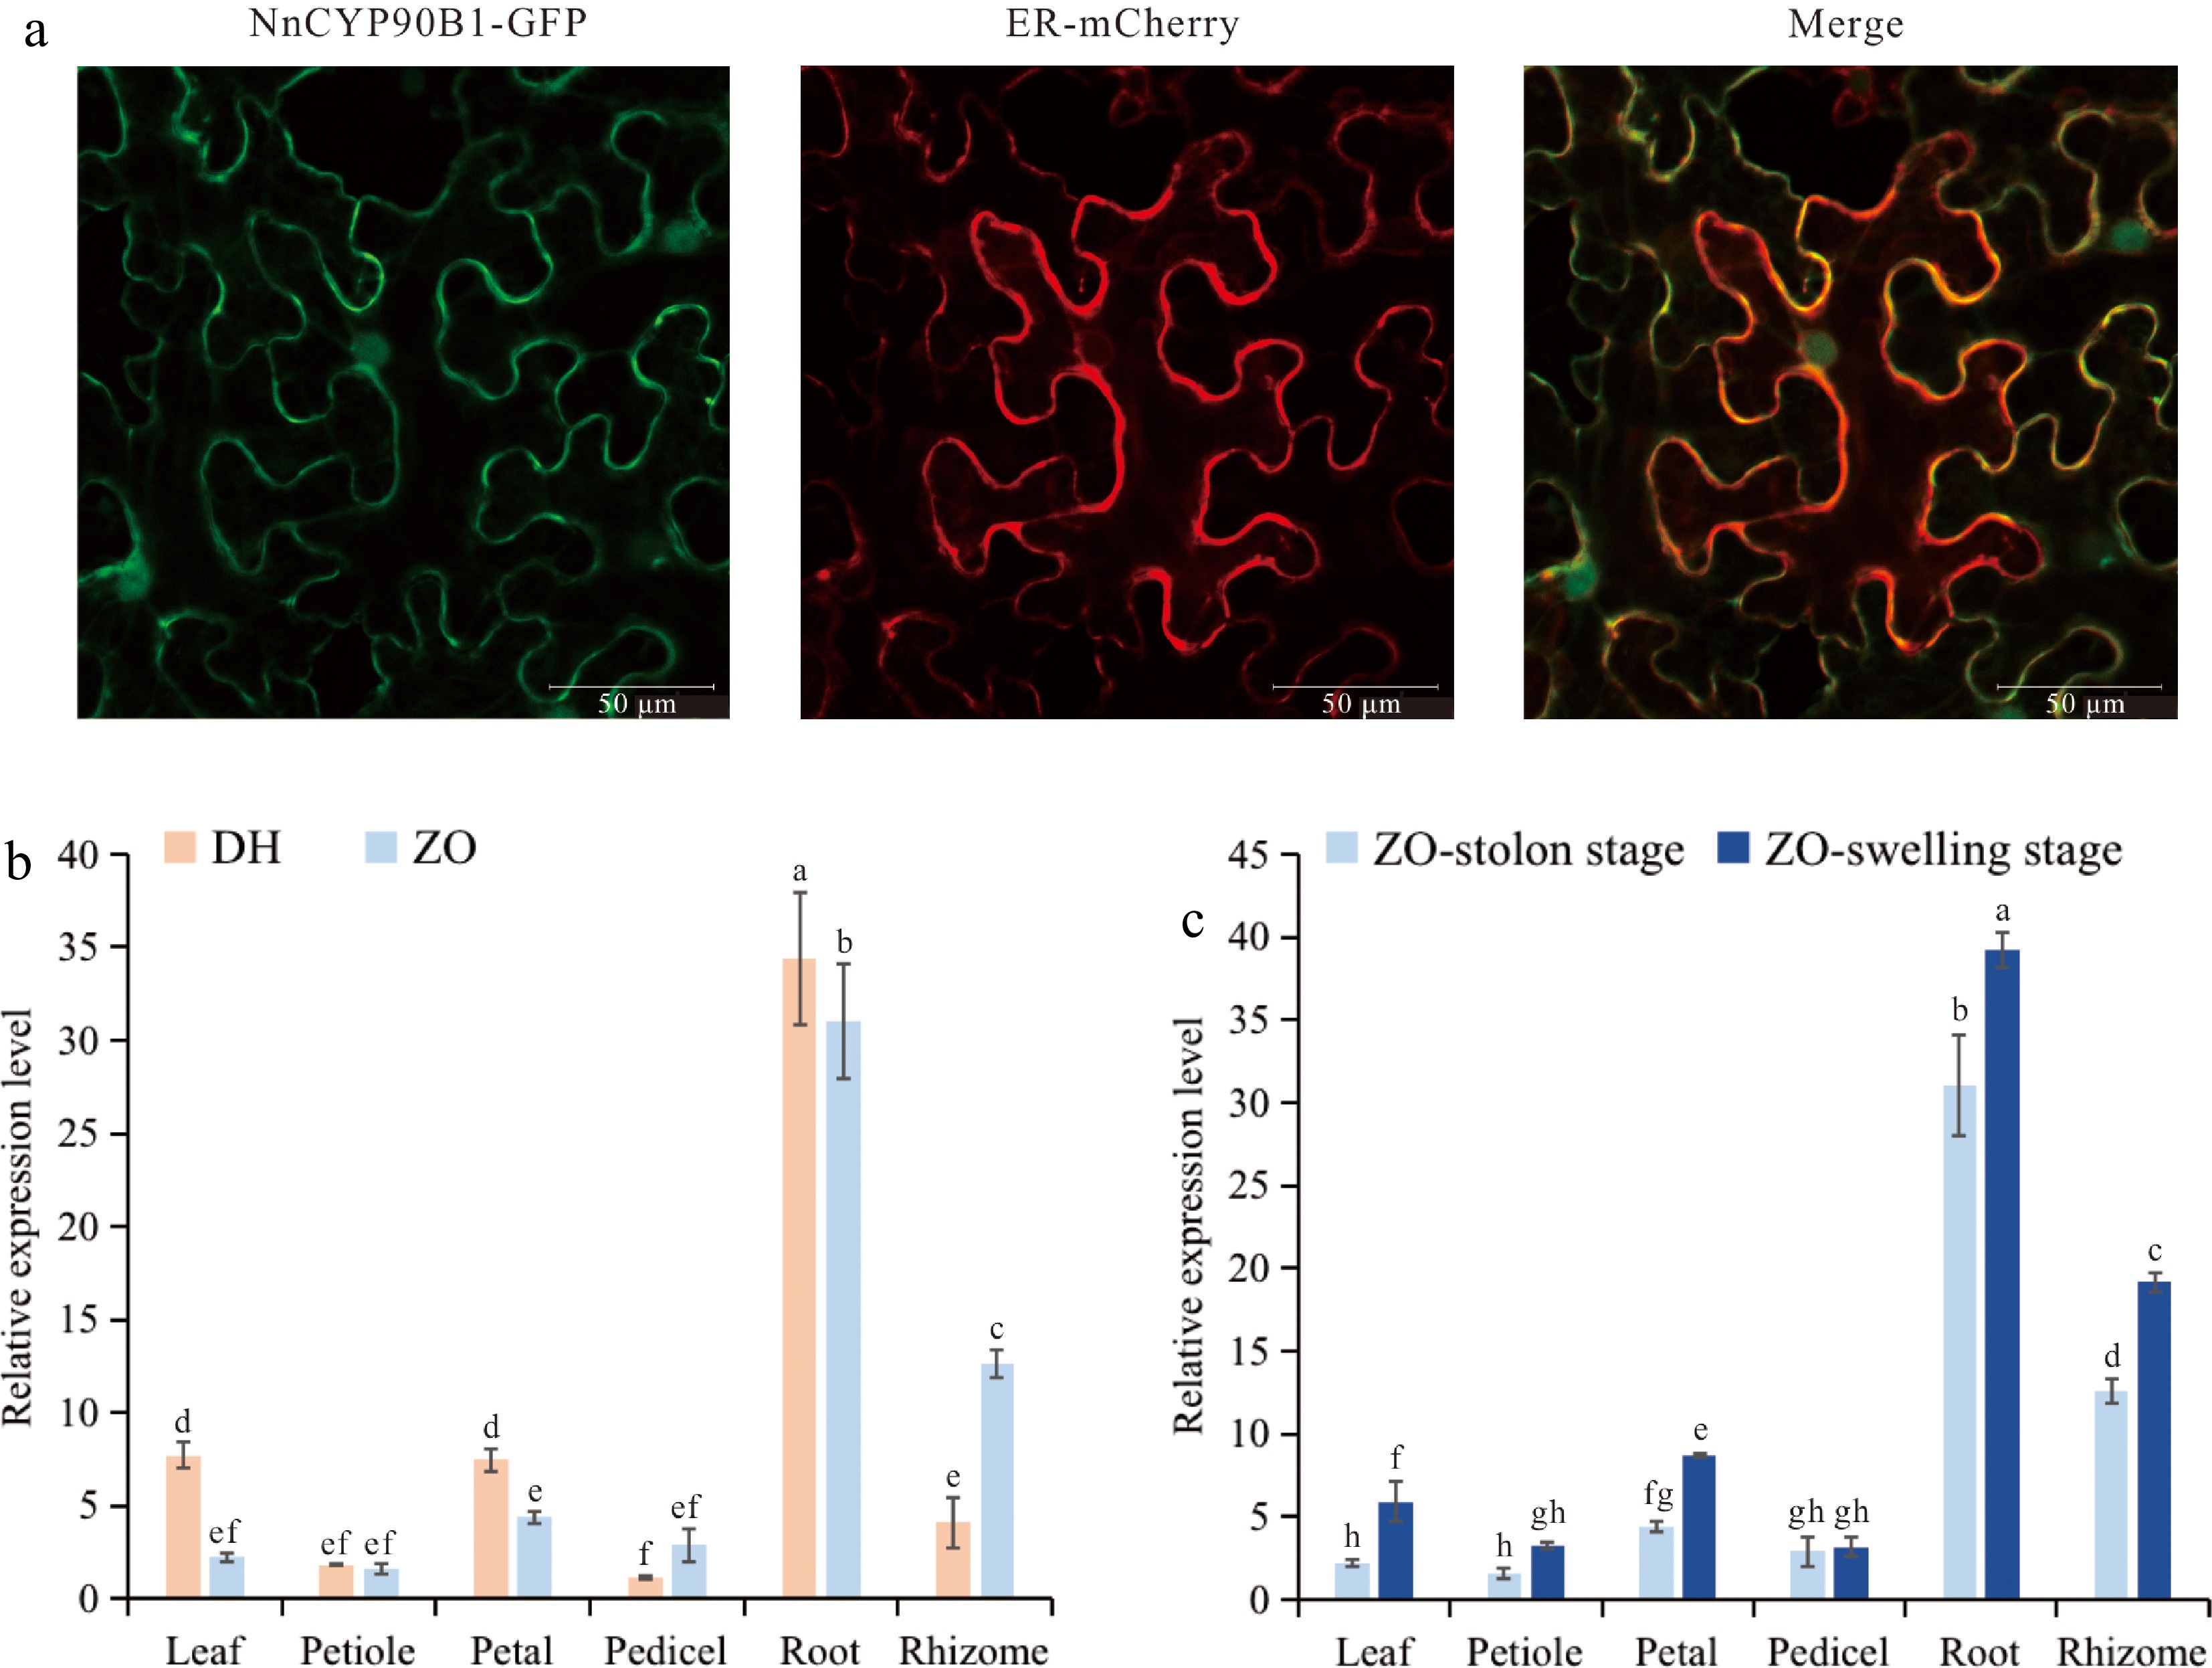
Figure 5.
Expression patterns of NnCYP90B1. (a) Subcellular localization of NnCYP90B1 in Nicotiana benthamiana. Bar = 50 μm. (b) Relative expression levels of NnCYP90B1 measured by RT-qPCR in various tissues of temperate lotus 'ZO' and tropical lotus 'DH'. (c) Relative expression levels of NnCYP90B1 in 'ZO' different tissues before and after rhizome enlargement. Values are presented as means ± SD from three biological replicates. Letters above each column represent significant differences based on one-way analysis of variance (ANOVA) followed by Tukey's test (p < 0.05).
-
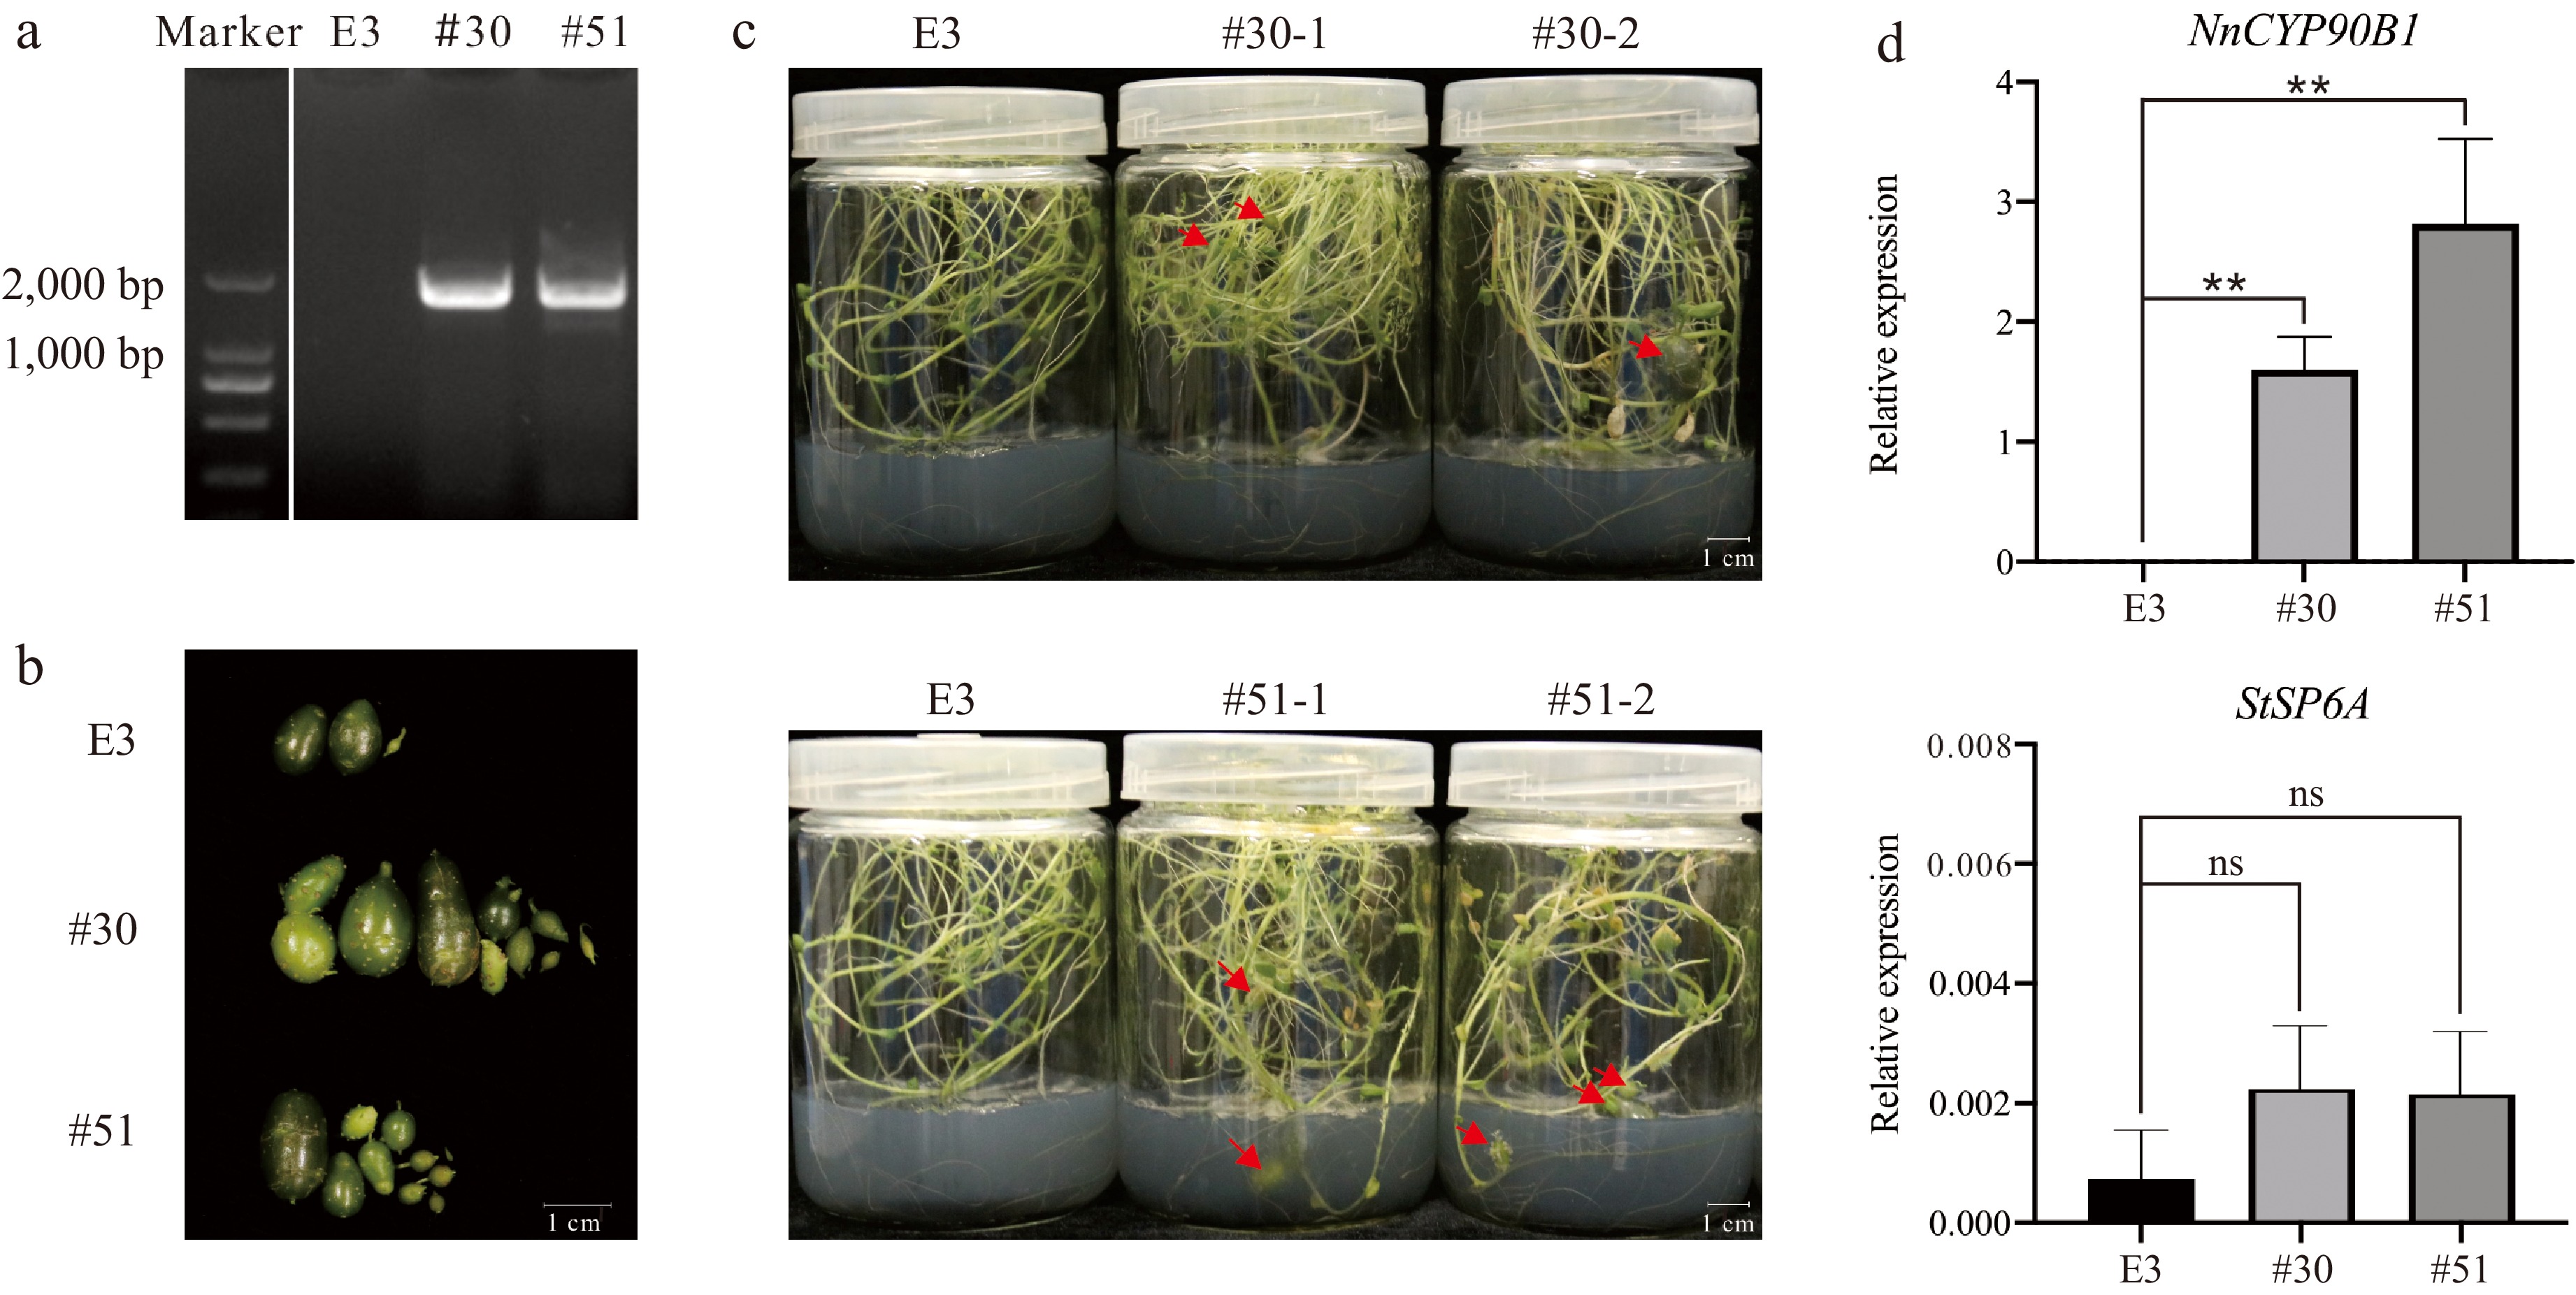
Figure 6.
Functional validation of heterologous transformation of NnCYP90B1 in potato. (a) PCR analysis of NnCYP90B1 in E3 and transgenic lines #30 and #51. (b), (c) Tubers of control line E3 and transgenic plants #30 and #51 cultured in medium for 3 months. Scale bar = 1 cm. (d) RT-qPCR analysis of NnCYP90B1 and StSP6A in E3 and transgenic lines #30 and #51. Values are presented as means ± SD from three biological replicates. Asterisks indicate signifificant differences between transgenic lines and E3 by Tukey's test (**, p < 0.01). ns, not signifificant.
-
Gene name Forward primer (5′–3′) Reverse primer (5′–3′) qRT-NnActin CTCCGTGTTGCCCCTGAAG CCAGCAAGGTCCAACCGAAG qRT-NnCYP90B1 TCTCCTCGGGTGGGTATTGA CTTGTTTCTTGGCTCGGGCA qRT-StActin GGAAAAGCTTGCCTATGTGG CTGCTCCTGGCAGTTTCAA qRT-StSP6A GACGATCTTCGCAACTTTTACA CCTCAAGTTAGGGTCGCTTG qRT-StSP5G CTTTGGCAATGAAGTCGTGGG GCAGCCCAATTGTCGATACAAC NnCYP90B1 ATGGCTGCTGAAATAGAGCTT ACATGGGAGGCTGAGAGAGTTG Table 1.
Primer sequences.
-
Gene ID Start and end position (bp) CDS (bp) ORF (aa) pI Instability
coefficientGravy Subcellular localization N. lutea
homologous geneNn1g05015 103,609,705−103,613,149 1,500 499 8.04 43.69 −0.098 Endoplasmic reticulum Al02631 Nn2g11471 18,697,198−18,700,178 1,461 486 9.48 44.04 −0.093 Endoplasmic reticulum Al19495 Nn2g13694 54,396,989−54,400,435 1,476 491 8.60 45.26 −0.185 Endoplasmic reticulum Al32099 Nn5g29581 63,421,205−63,424,831 1,560 519 8.97 53.05 −0.215 Endoplasmic reticulum Al02631 Nn6g35462 64,896,537−64,902,600 1,554 517 9.39 56.69 −0.326 Endoplasmic reticulum Al25018 Table 2.
Information of NnCYP90 family genes in the Nelumbo nucifera genome.
-
Line Tuberization times
(days after planting)Total numbers
(/plant)Total weight
(g/plant)E3 94 1.5 0.125 #30 81 5.0 0.570 #51 77 3.0 1.105 Table 3.
Phenotypic statistics of over-expressed NnCYP90B potato lines.
Figures
(6)
Tables
(3)