-
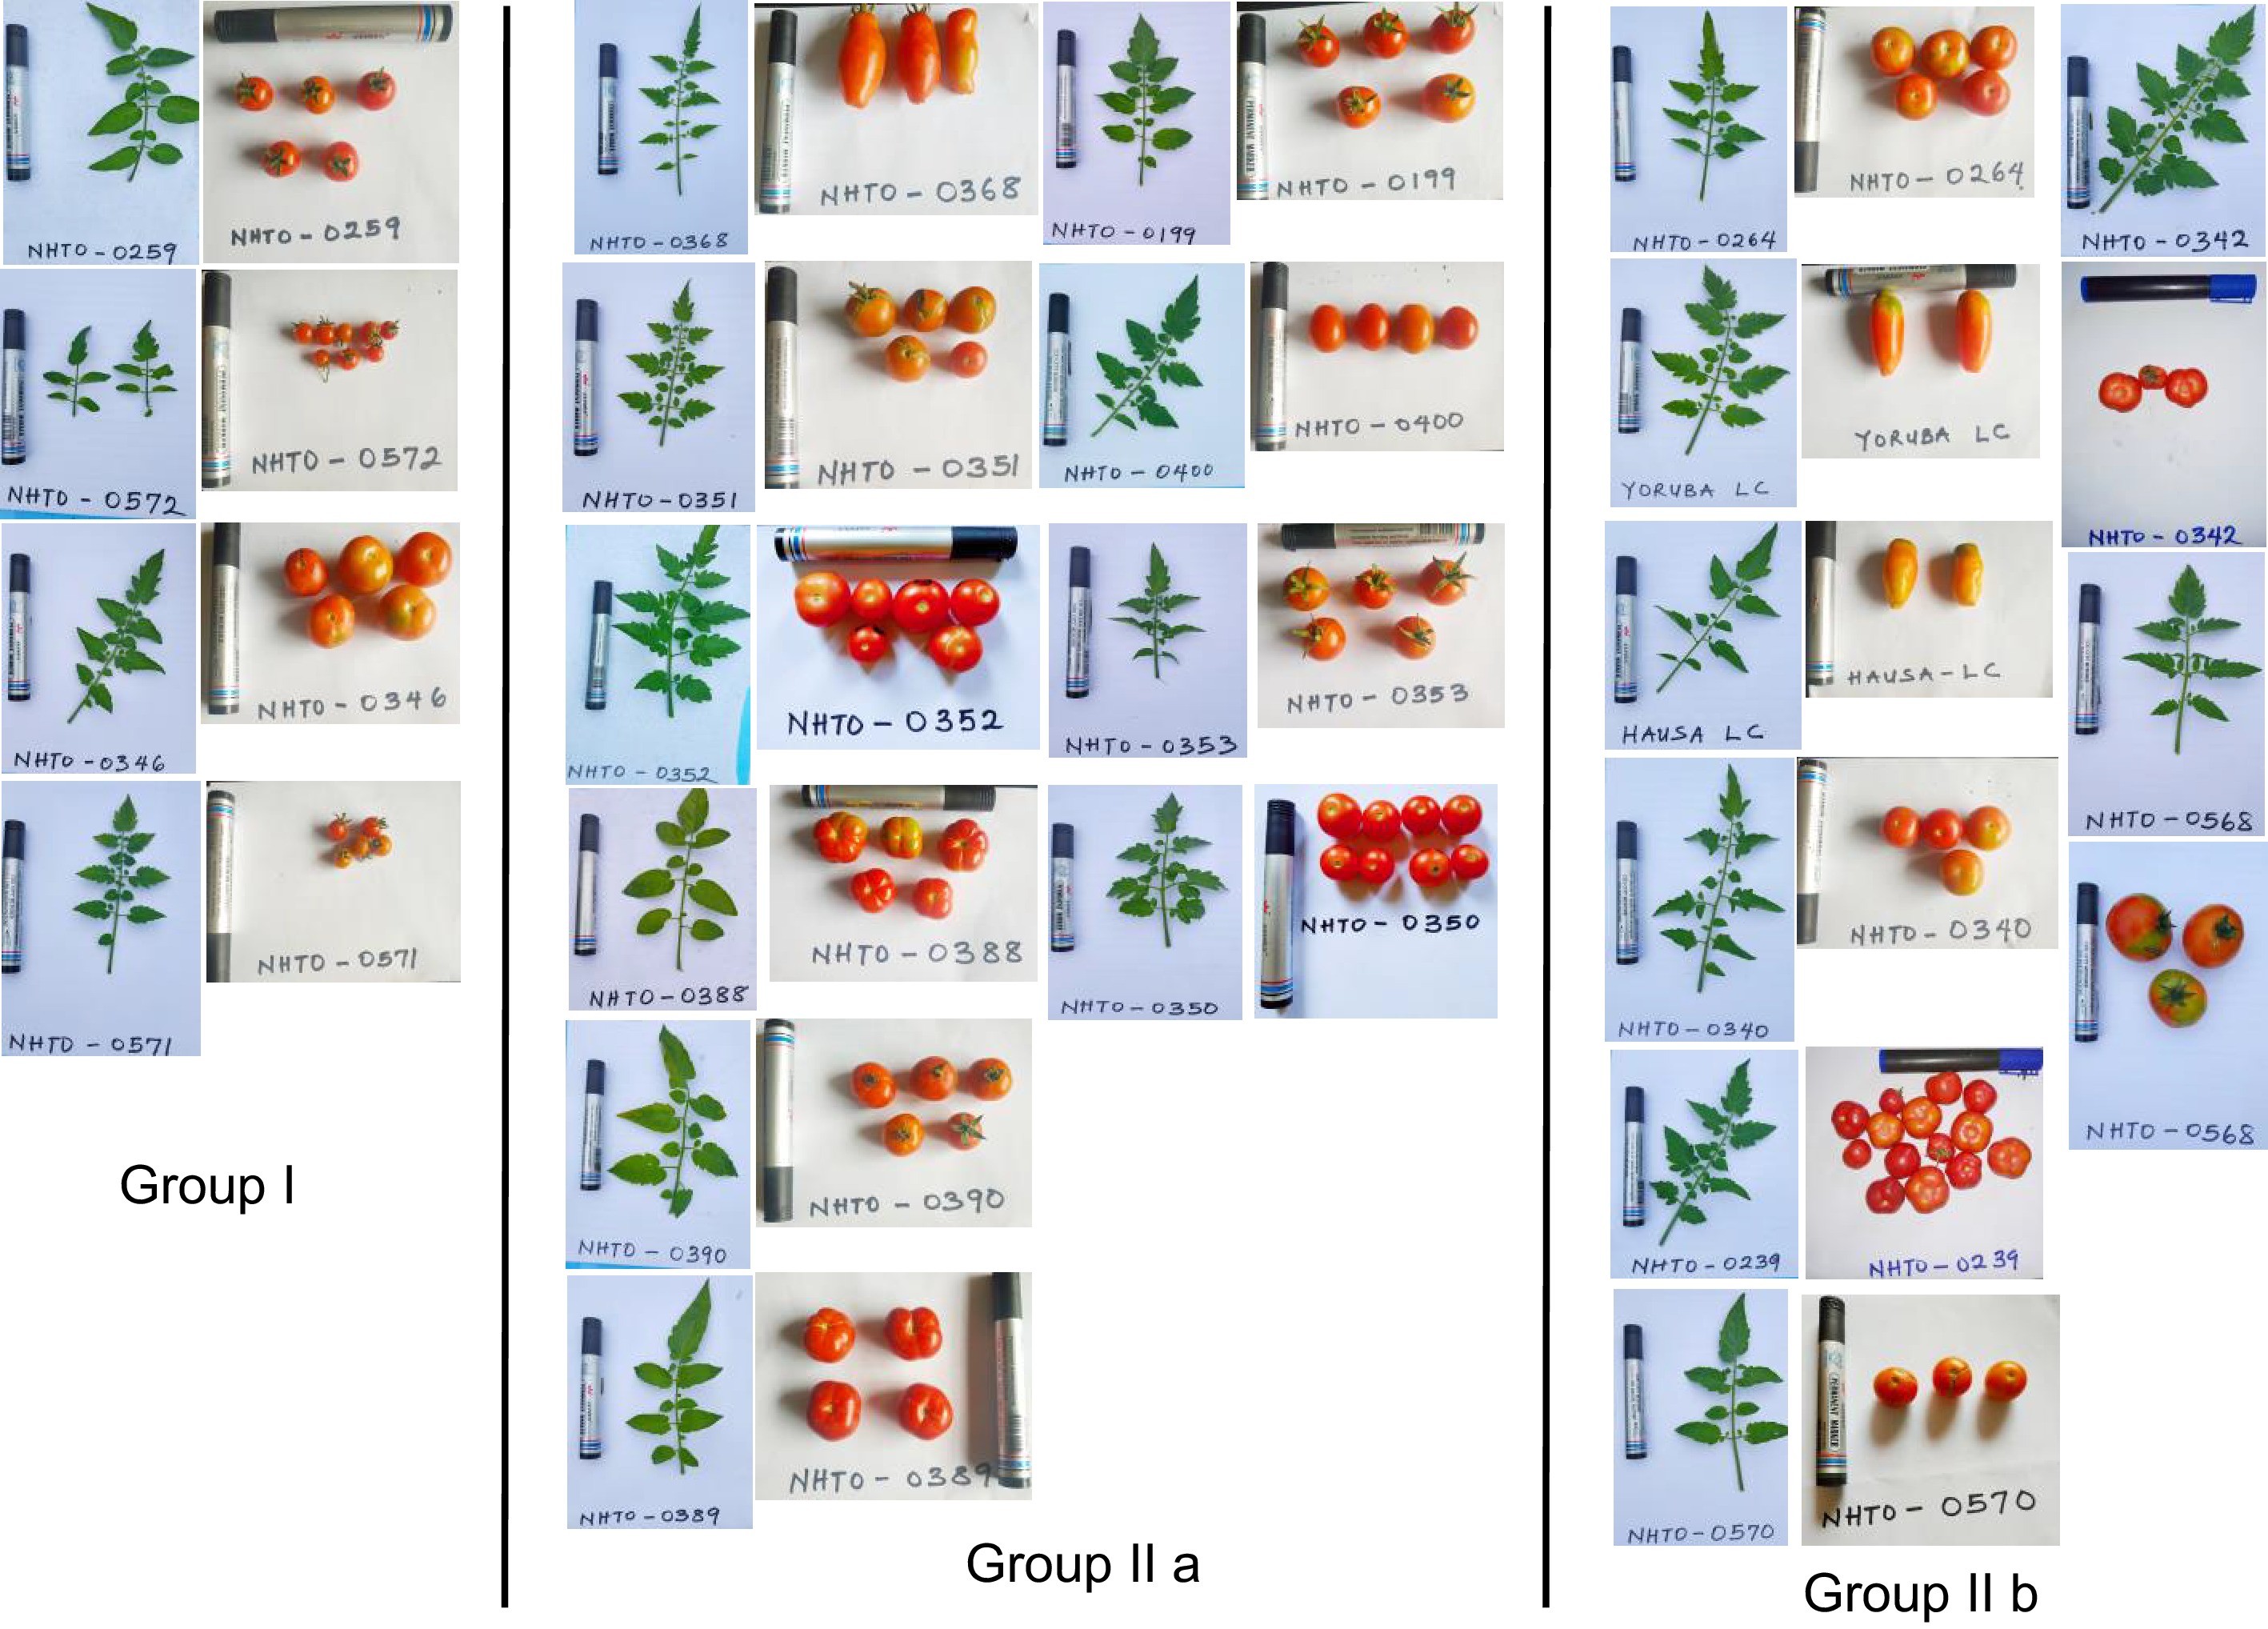
Figure 1.
Tomato accession diversity of leaf and fruit morphology within each distinct cluster. Each accession's leaf and fruit are accompanied by the accession name.
-
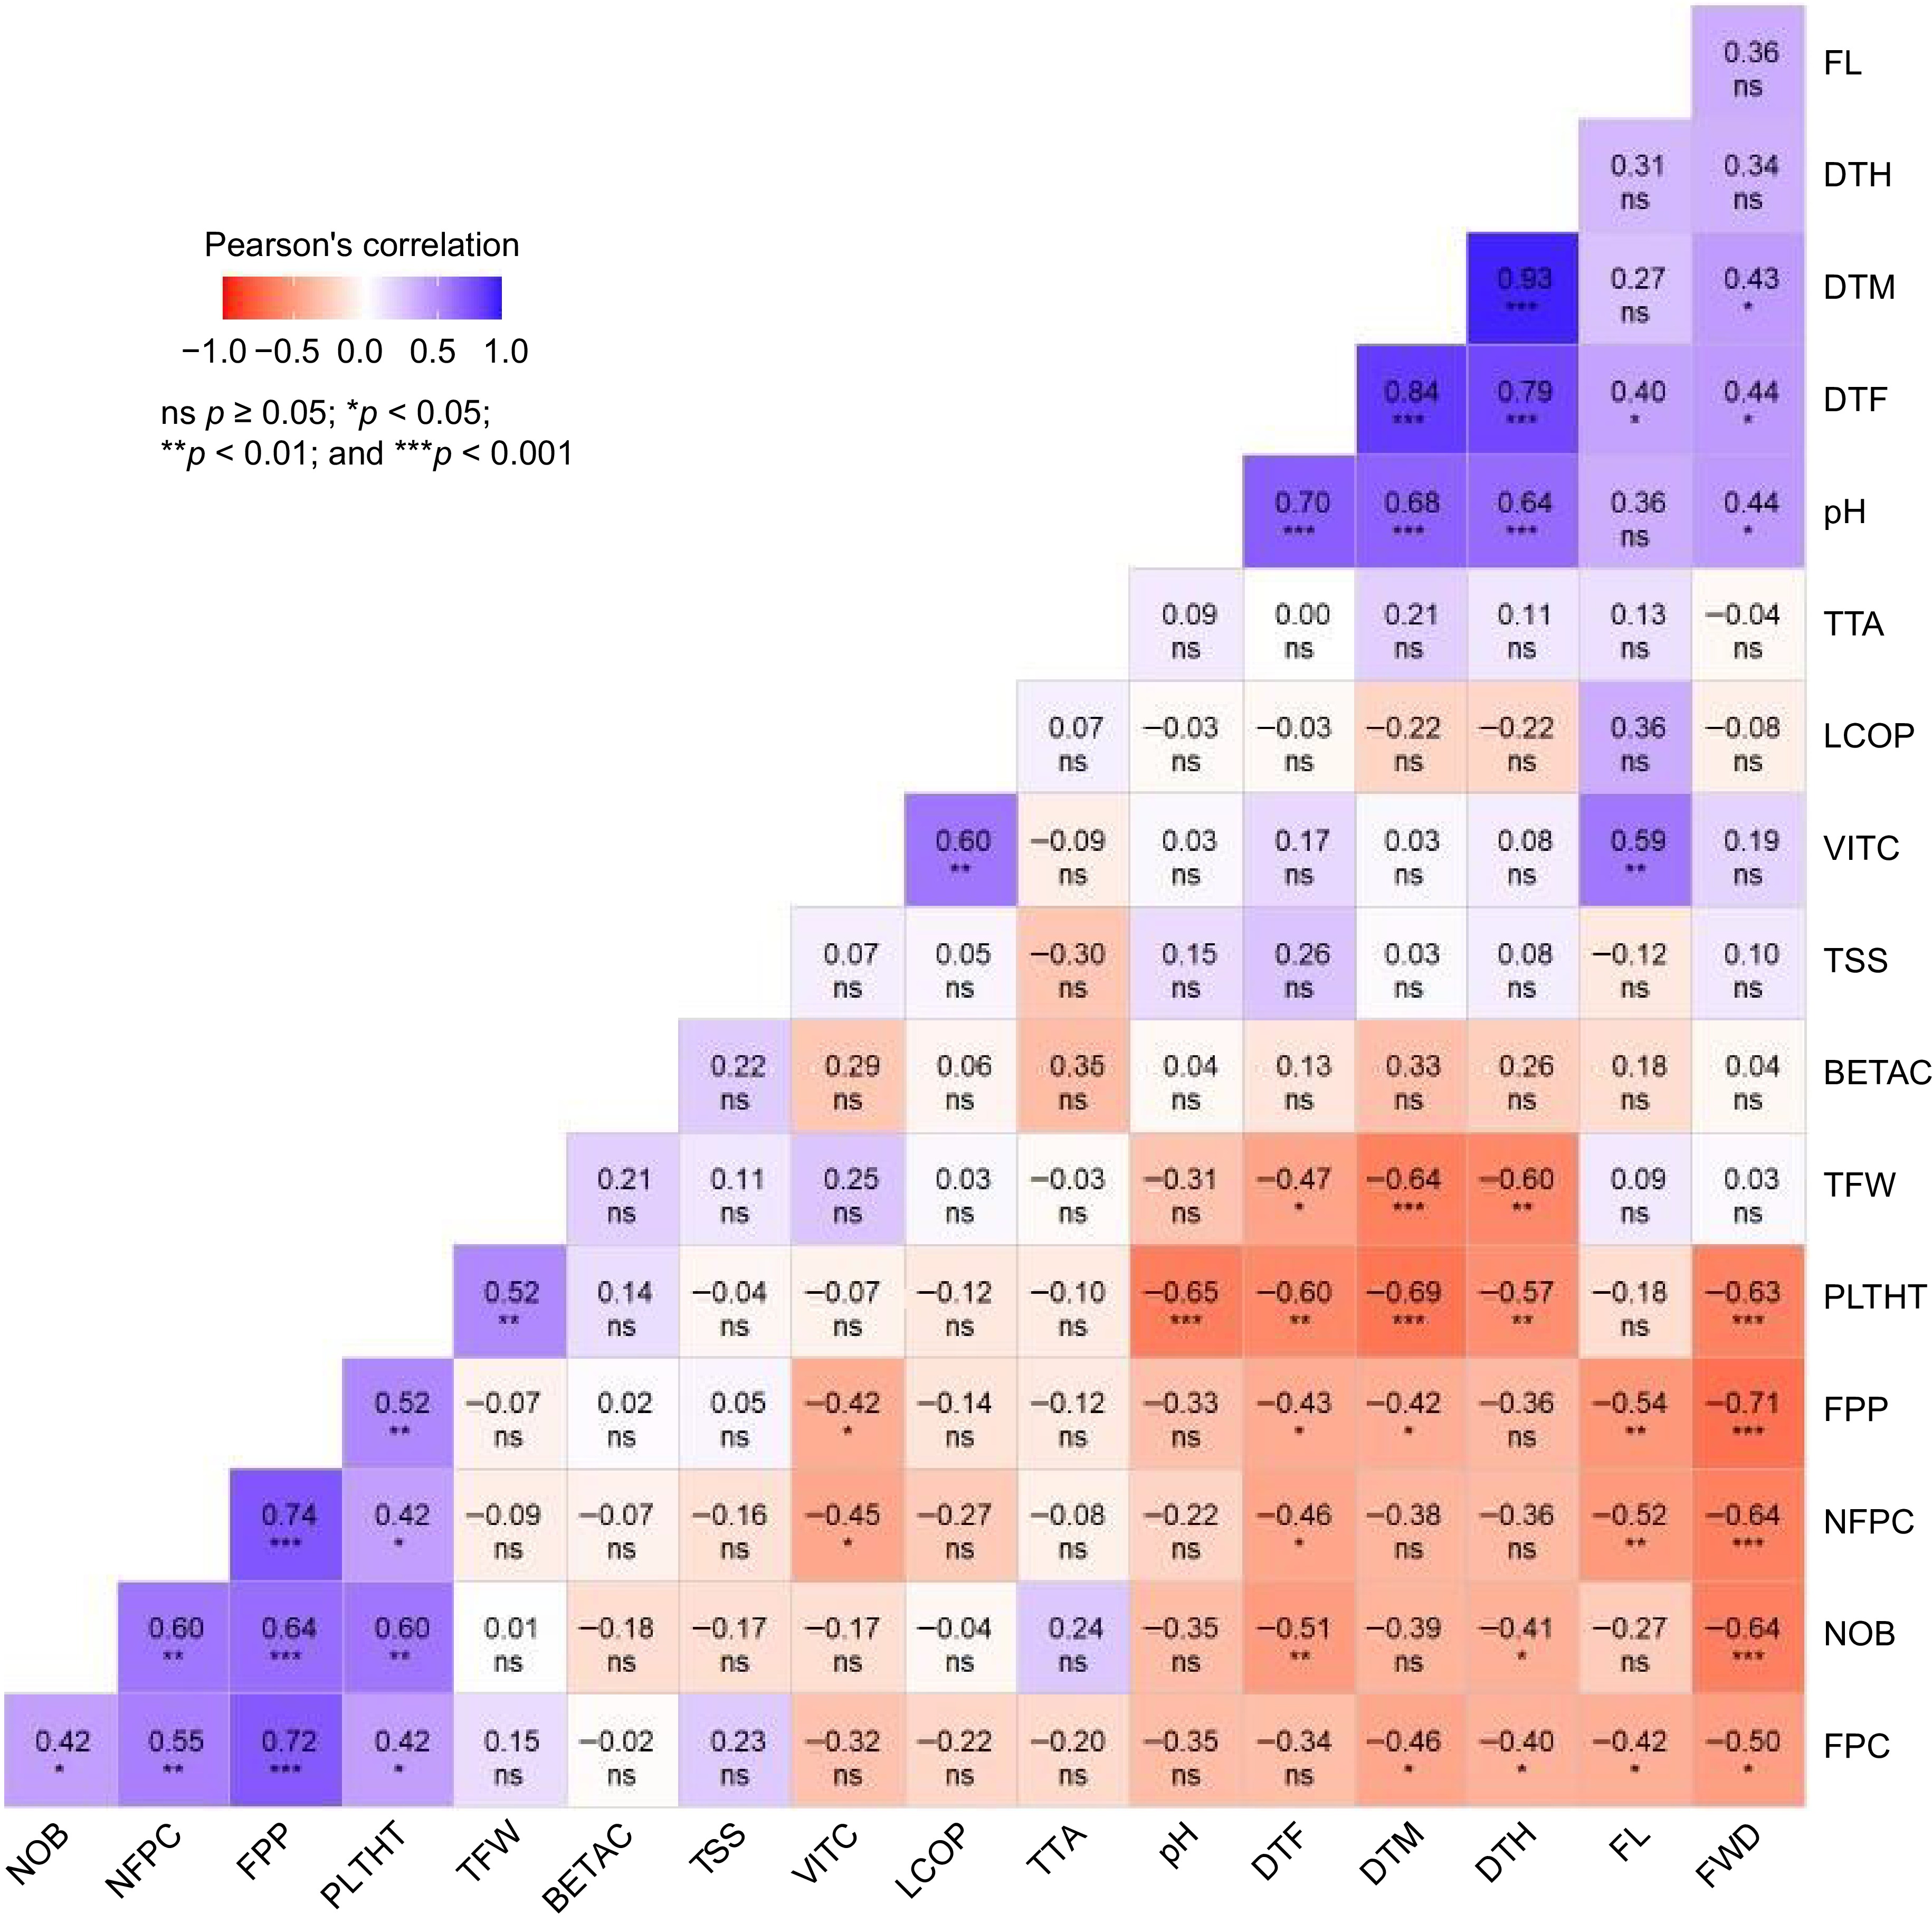
Figure 2.
Correlogram showing the relationship between average values of agronomic and physico-chemical traits of tomato accessions. Dark blue denotes a high negative correlation, whereas dark red represents a high positive correlation. The cell value denotes correlation coefficient (r) values. NOB = number of branches, DTF = number of days to flowering (d), DTM = number of days to maturity (d), FL = fruit length (cm), FWD = fruit width (cm), FPC = number of fruits per cluster, NFPC = number of flowers per cluster, PLTHT = plant height (cm), TFW = total fruit weight per plot (kg), DTH = number of days to first harvest (d), FPP = number of fruits per plot, VITC = vitamin C (mg 100 g−1), BETAC = β-carotene (mg 100 g−1), LCOP = lycopene (mg 100 g−1), TTA = titratable acidity (%), TSS = total soluble solid (°Brix), pH = fruit juice pH. *,**,*** significant at 0.05, 0.01 and 0.001 probability levels, respectively. ns = nonsignificant.
-
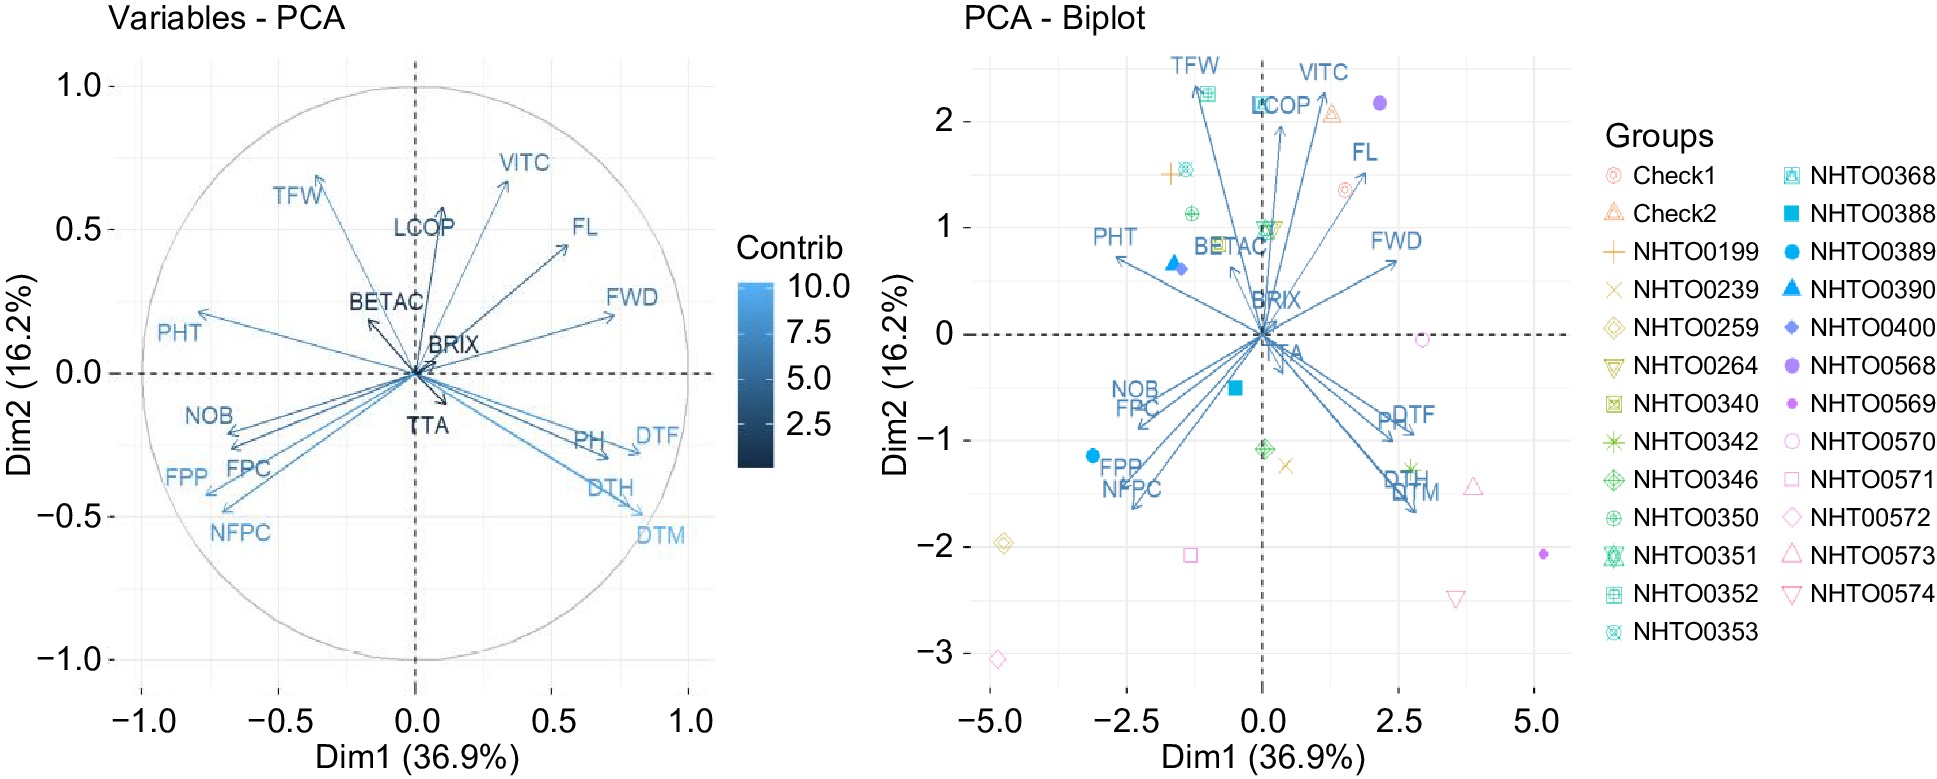
Figure 3.
A two-dimensional principal component analysis (PCA) showing the relationships among the 17 agronomic and physico-chemical traits and the 25 tomato accessions and checks evaluated. The first two components, PC1 (37%) and PC2 (16%) explaining the highest variance were plotted on the x-axis and y-axis, respectively. The arrows indicate traits contributing to the respective PCs and the correlation between traits can be determined by the close arrow proximity. NOB = number of branches, DTF = number of days to flowering (d), DTM = number of days to maturity (d), FL = fruit length (cm), FWD = fruit width (cm), FPC = number of fruits per cluster, NFPC = number of flowers per cluster, PHT = plant height (cm), TFW = total fruit weight per plot (kg), DTH = number of days to first harvest (d), FPP = number of fruits per plot, VITC = vitamin C (mg 100 g−1), BETAC = β-carotene (mg 100 g−1), LCOP = lycopene (mg 100 g−1), TTA = titratable acidity (%), TSS = total soluble solid (°Brix), PH = fruit juice pH.
-
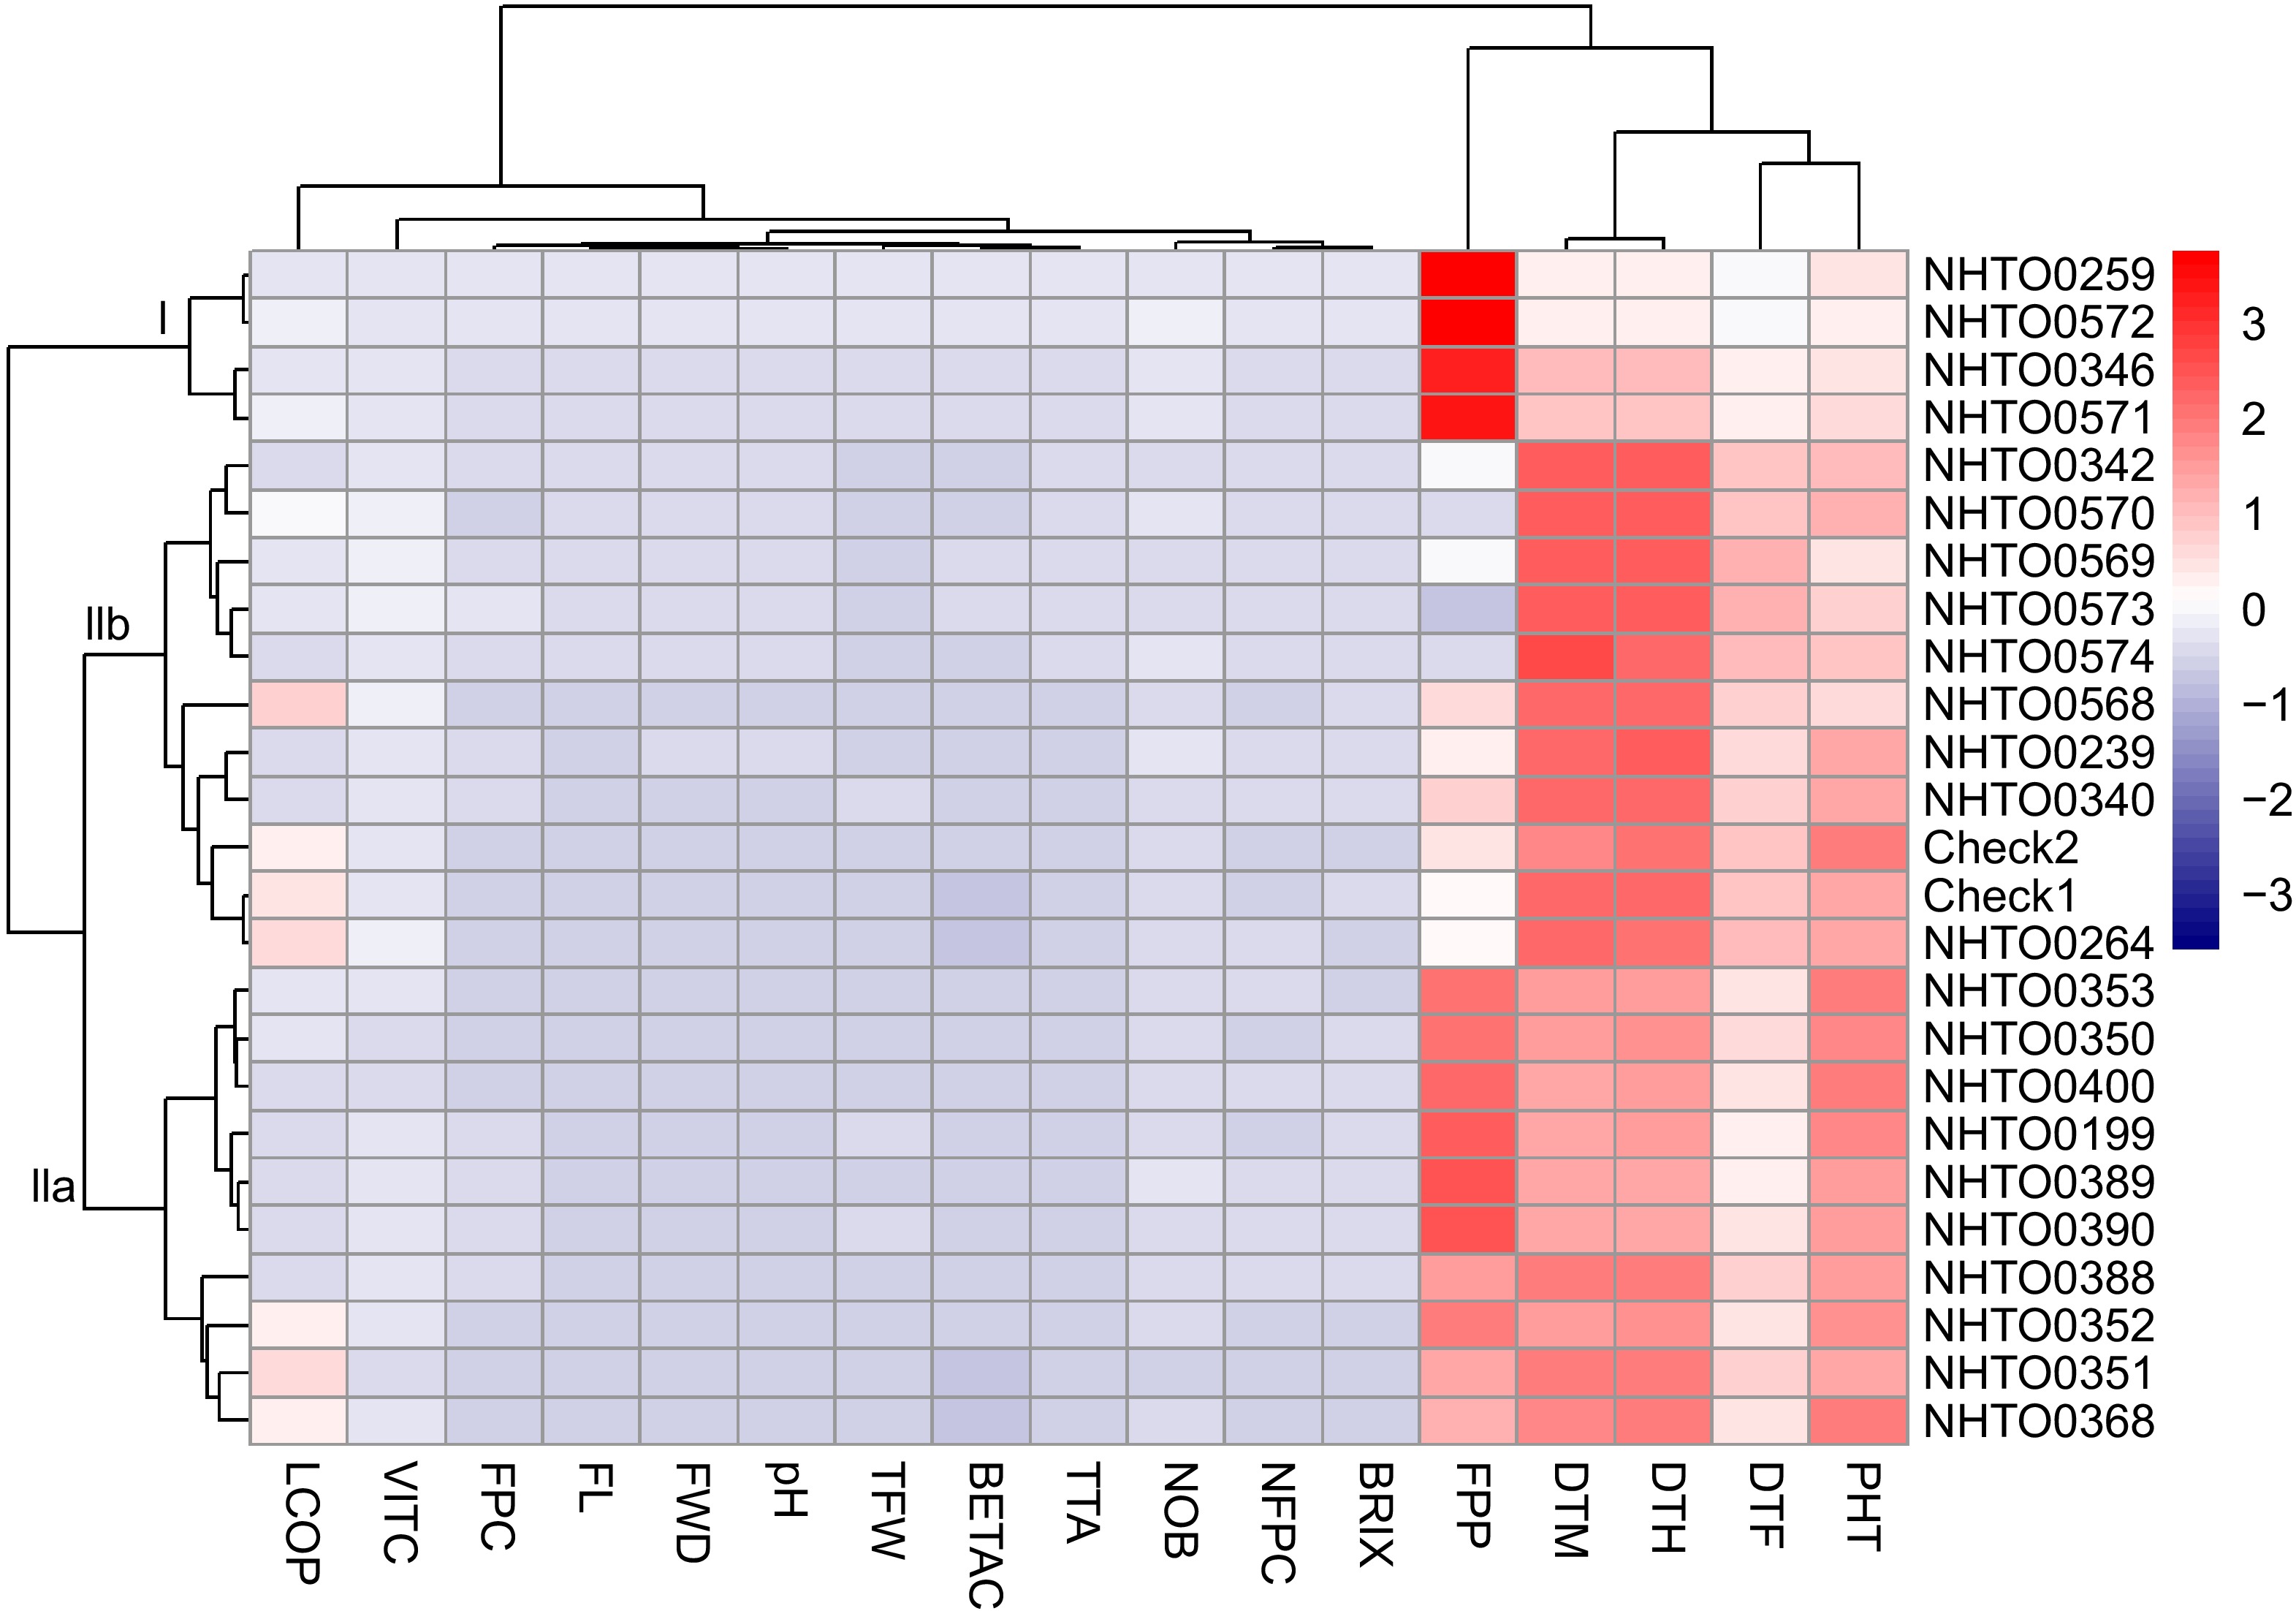
Figure 4.
Hierarchical clustering and heatmap of tomato accessions and checks based on the scaled values of the measured traits. Each row represents an accessions, and each column indicates a measured trait. Accessions are clustered based on their measured traits, and the traits groups are clustered based on their correlation. The traits that are clustered together have a high positive correlation. Cells with red and blue colours have high and low relative appearances, respectively. NOB = number of branches, DTF = number of days to flowering (d), DTM = number of days to maturity (d), FL = fruit length (cm), FWD = fruit width (cm), FPC = number of fruits per cluster, NFPC = number of flowers per cluster, PHT = plant height (cm), TFW = total fruit weight per plot (kg), DTH = number of days to first harvest (d), FPP = number of fruits per plot, VITC = vitamin C (mg 100 g−1), BETAC = β-carotene (mg 100 g−1), LCOP = lycopene (mg 100 g−1), TTA = titratable acidity (%), TSS = total soluble solid (°Brix), pH = fruit juice pH.
-
S/N Accession Local name Collection source Growth habit 1 NHTO-0199 Dan Biu Maiduguri, Borno state Semi-determinate 2 NHTO-0239 UC Funtua, Katsina state Indeterminate 3 NHTO-0259 Tomato Babura, Jigawa state Indeterminate 4 NHTO-0264 Tomato Babura, Jigawa state Indeterminate 5 NHTO-0340 Tima Kano state Indeterminate 6 NHTO-0342 Tomato Babura, Jigawa state Semi-determinate 7 NHTO-0346 Ex-Babura Babura, Jigawa state Indeterminate 8 NHTO-0350 Tomato Makarfi, Kaduna state Indeterminate 9 NHTO-0351 Dan Batanas Makarfi, Kaduna state Determinate 10 NHTO-0352 Dan India Makarfi, Kaduna state Indeterminate 11 NHTO-0353 Tomato Bauchi State Semi-determinate 12 NHTO-0368 Dan Gombe Dadin kowa, Gombe state Semi-determinate 13 NHTO-0388 Heinz 2274 Kano state Semi-determinate 14 NHTO-0389 Tomato Maiduguri, Borno state Indeterminate 15 NHTO-0390 Girafto Babura, Jigawa state Semi-determinate 16 NHTO-0400 Bakin iri Bomo, Zaria state Indeterminate 17 NHTO-0568 Dan Gombe Dadin kowa, Gombe state Determinate 18 NHTO-0569 Dan Baga Maiduguri, Borno state Indeterminate 19 NHTO-0570 Tomato Makarfi, Kaduna state Determinate 20 NHTO-0571 Tomato Makarfi, Kaduna state Semi-determinate 21 NHTO-0572 Dan Syria Maiduguri, Borno state Semi-determinate 22 NHTO-0573 Dallaji Bauchi state Indeterminate 23 NHTO-0574 Tomato Maiduguri, Borno state Determinate 24 LC CHK-Y Tomato Yoruba Ogbomoso, Oyo State Semi-determinate 25 LC CHK-H Timo Hausa Ogbomoso, Oyo State Semi-determinate NHTO = NIHORT Tomato; LC CHK-H = Local check-Hausa; LC CHK-Y = Local check-Yoruba. Table 1.
Tomato accessions and local checks evaluated in the study.
-
Source df No. of branches No. of
days to
flowering (d)No. of
days to
maturity (d)Fruit length (cm) Fruit
width
(cm)No. of
flowers
per
clusterNo. of
fruits
per clusterPlant height (cm) No. of days
to first
harvest (d)No. of
fruits
per plotFruit weight
per plot (kg)Vitamin C (mg
100 g−1)β-carotene (mg 100 g−1) Lycopene (mg
100 g−1)Titratable acidity (%) Fruit juice pH Total soluble solids (°Brix) Replication (Rep) 2 39.52** 24.16 86.44 0.82 0.67* 0.65 2.28 116.76 10.33 9,268.93 1.42 0.44 0.02** 2.22*** 0.03 0.01*** 0.00 Block (Rep) 12 10.66 38.87 47.36 0.10 0.09 1.57 1.96 353.90* 28.50 4,766.78 3.65 0.32 0.01 0.18 0.02 0.00 0.03*** Accession 24 12.42* 106.19*** 223.06** 3.55*** 1.11*** 3.72*** 3.58*** 651.85*** 154.51*** 36,185.35*** 8.73*** 13.67*** 1.10*** 297.40*** 0.36*** 0.22*** 0.06*** Error 36 6.01 28.29 73.73 0.30 0.17 1.33 1.40 166.38 46.2 5,525.12 1.80 0.31 0.01 0.23 0.02 0.00 0.01 CV (%) 31.27 13.49 11.44 18.42 14.53 28.64 21.95 21.05 9.03 80.10 54.04 5.33 4.06 3.09 6.25 0.59 1.53 R2 (%) 75 78 73 91 85 73 70 78 76 84 79 97 99 99 94 99 95 Repeatability 0.66 0.51 0.55 0.39 0.44 0.57 0.59 0.50 0.53 0.44 0.47 − − − − − − *, **, *** significant at 0.05, 0.01 and 0.001 probability levels, respectively. CV = coefficient of variation, R2 = coefficient of determination. Table 2.
Mean squares of agronomic and physico-chemical traits of the tomato accessions evaluated.
-
Accession Fruit weight per plot (kg) Number of fruits per plot β-carotene (mg
100 g−1)Lycopene (mg
100 g−1)Rank Summation Index Top 5 NHTO-0352 4.2 80.5 2.8 30.3 20 NHTO-0350 3.3 65.7 3.4 9.2 32 NHTO-0199 6.5 92.0 1.5 8.6 35 NHTO-0351 2.3 71.1 1.8 34.7 35 NHTO-0346 2.8 159.8 2.2 8.4 37 Mean of Top 5 3.8 93.8 2.3 18.2 Grand mean 2.5 92.8 1.8 15.4 Selection differential (%) 53.3 1.1 31.5 18.2 Bottom 5 NHTO-0342 1.8 38.2 1.6 5.5 69 NHTO-0389 0.7 91.3 1.3 4.9 74 NHTO-0569 0.3 14.8 1.6 9.4 74 NHTO-0573 0.5 11.9 1.6 6.6 77 NHTO-0574 0.3 15.0 0.9 5.3 93 Mean of bottom 5 0.7 34.3 1.4 6.3 Grand mean 2.5 92.8 1.8 15.4 Selection differential (%) −71.8 −63.1 −21.8 −58.9 Table 3.
Fruit yield and quality of top and bottom five tomato accessions based on Rank Summation Index.
Figures
(4)
Tables
(3)