-
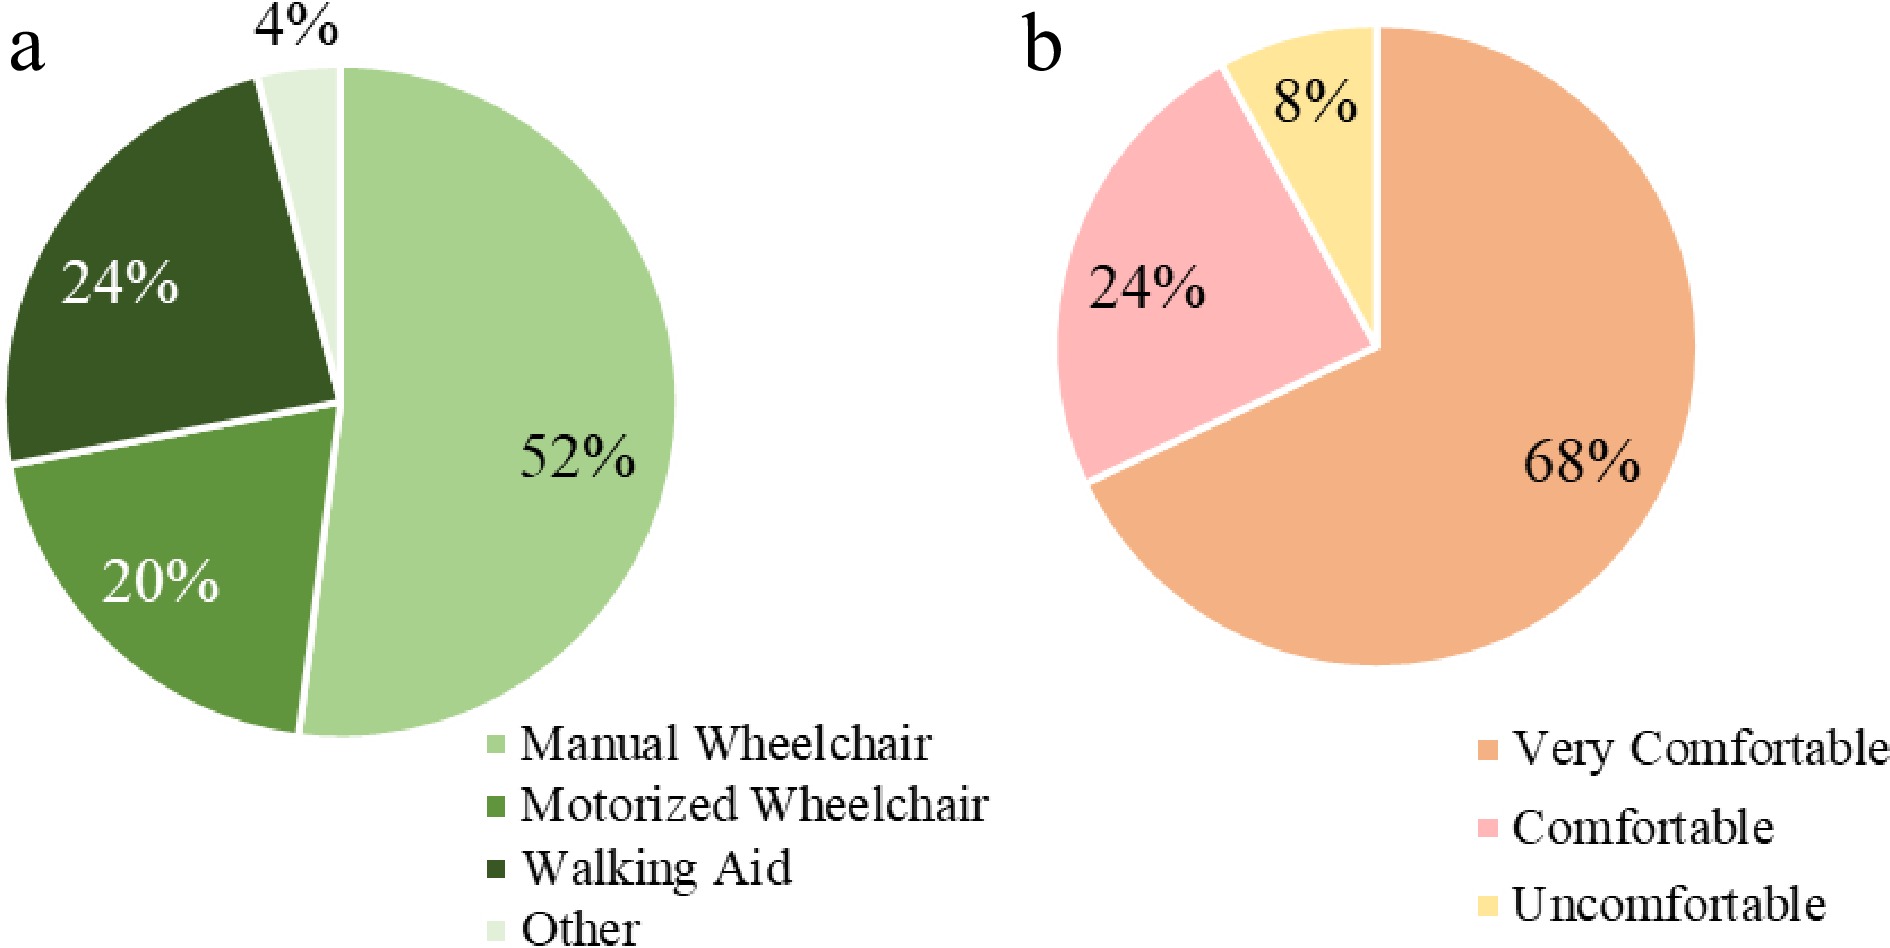
Figure 1.
(a) Percent of mobility devices most prevalently utilized by 24 participants (one participant had a visual disability and did not utilize an assistive device). (b) Comfort level of participants traveling alone in their everyday lives.
-
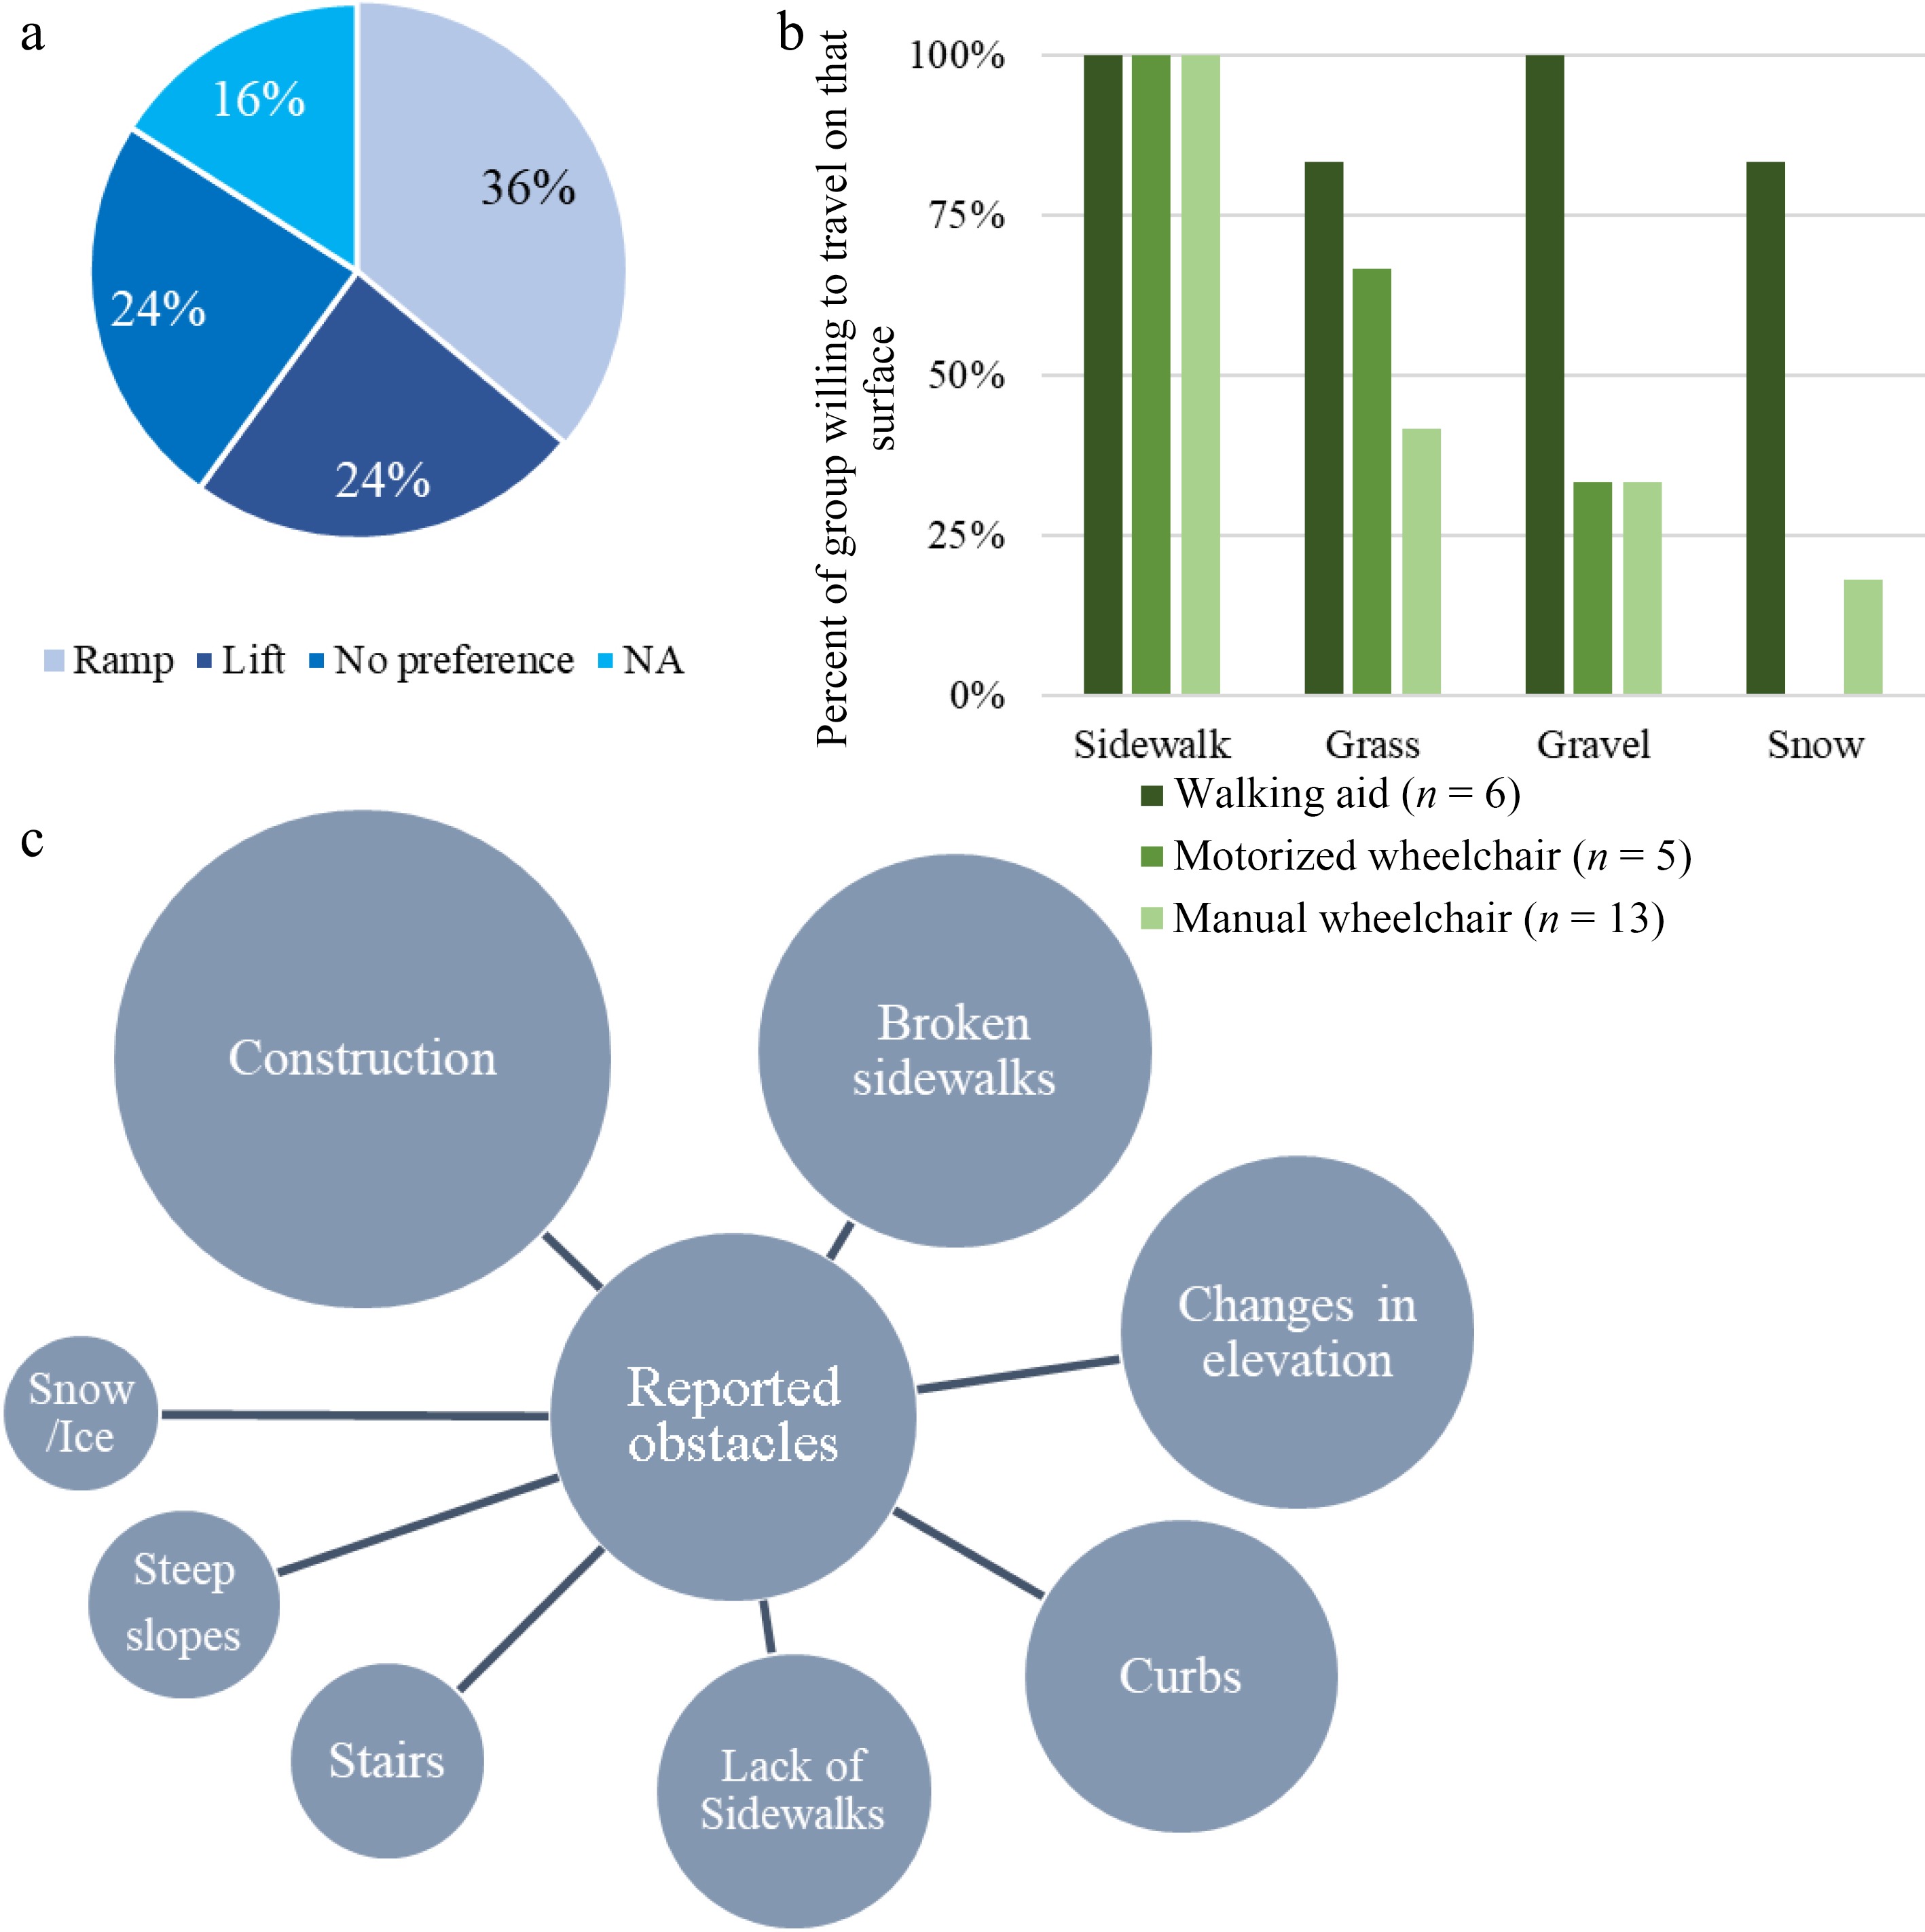
Figure 2.
(a) Participant preference for a ramp or a lift. NA accounts for PwD who did not rely on a ramp or a lift. (b) Percent of participants, based on mobility device used, and willingness to travel on four different surfaces. (c) Obstacles reported by participants sorted by the most commonly reported that would limit access to a PUDO zone. (The larger the circle, the more reports associated with this challenge).
-
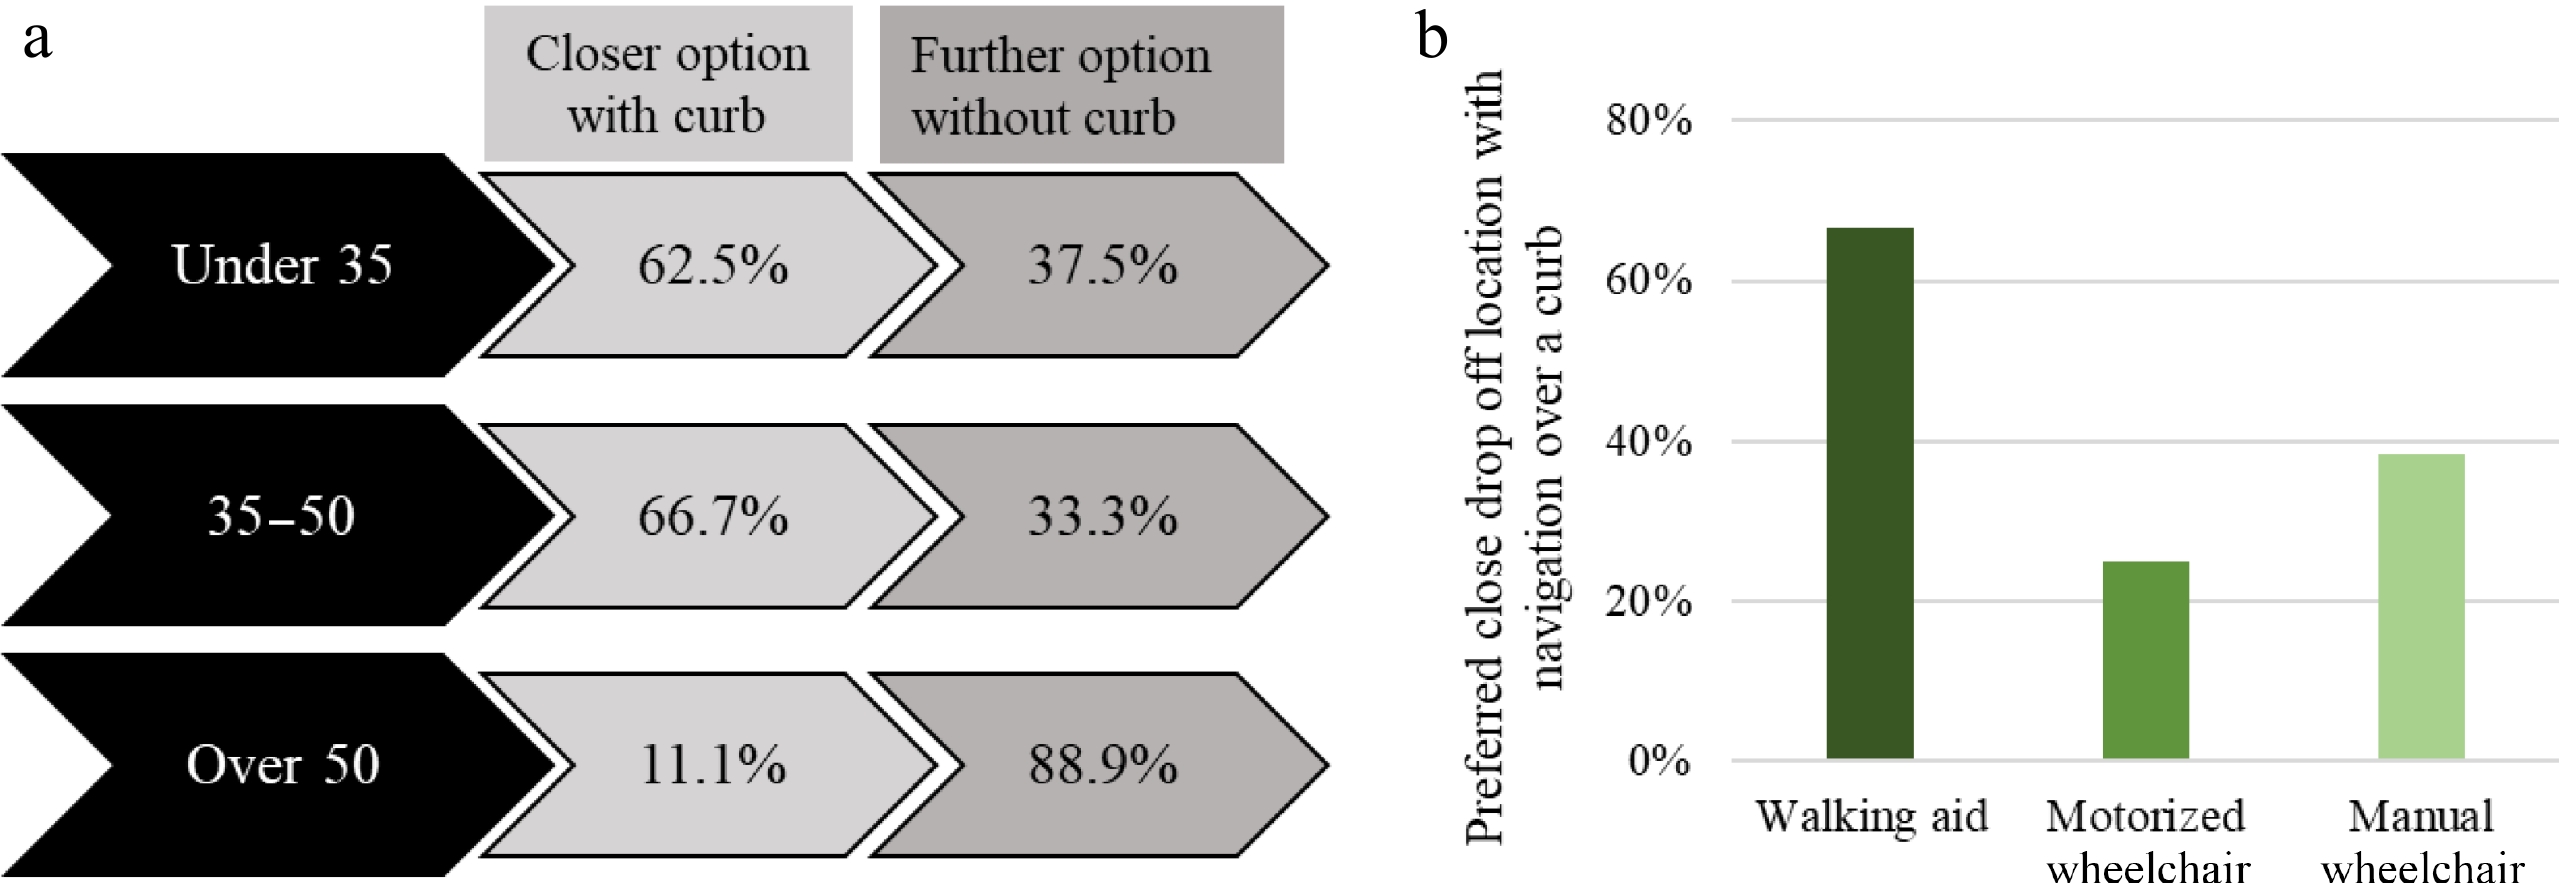
Figure 3.
(a) Distribution of drop off location preference broken up based on age. The close drop off location would require the participant to navigate over a curb from a stop near their final destination, and the alley drop off location would not have the curb but would be farther from the final destination. (b) Percentage of participants, based on their main assistive device used, who preferred the closer option when asked: 'Would you rather be picked up/dropped off close to a door where you may have to go over a curb or in a nearby alley that is further away but you would not have to navigate over a curb'?
-
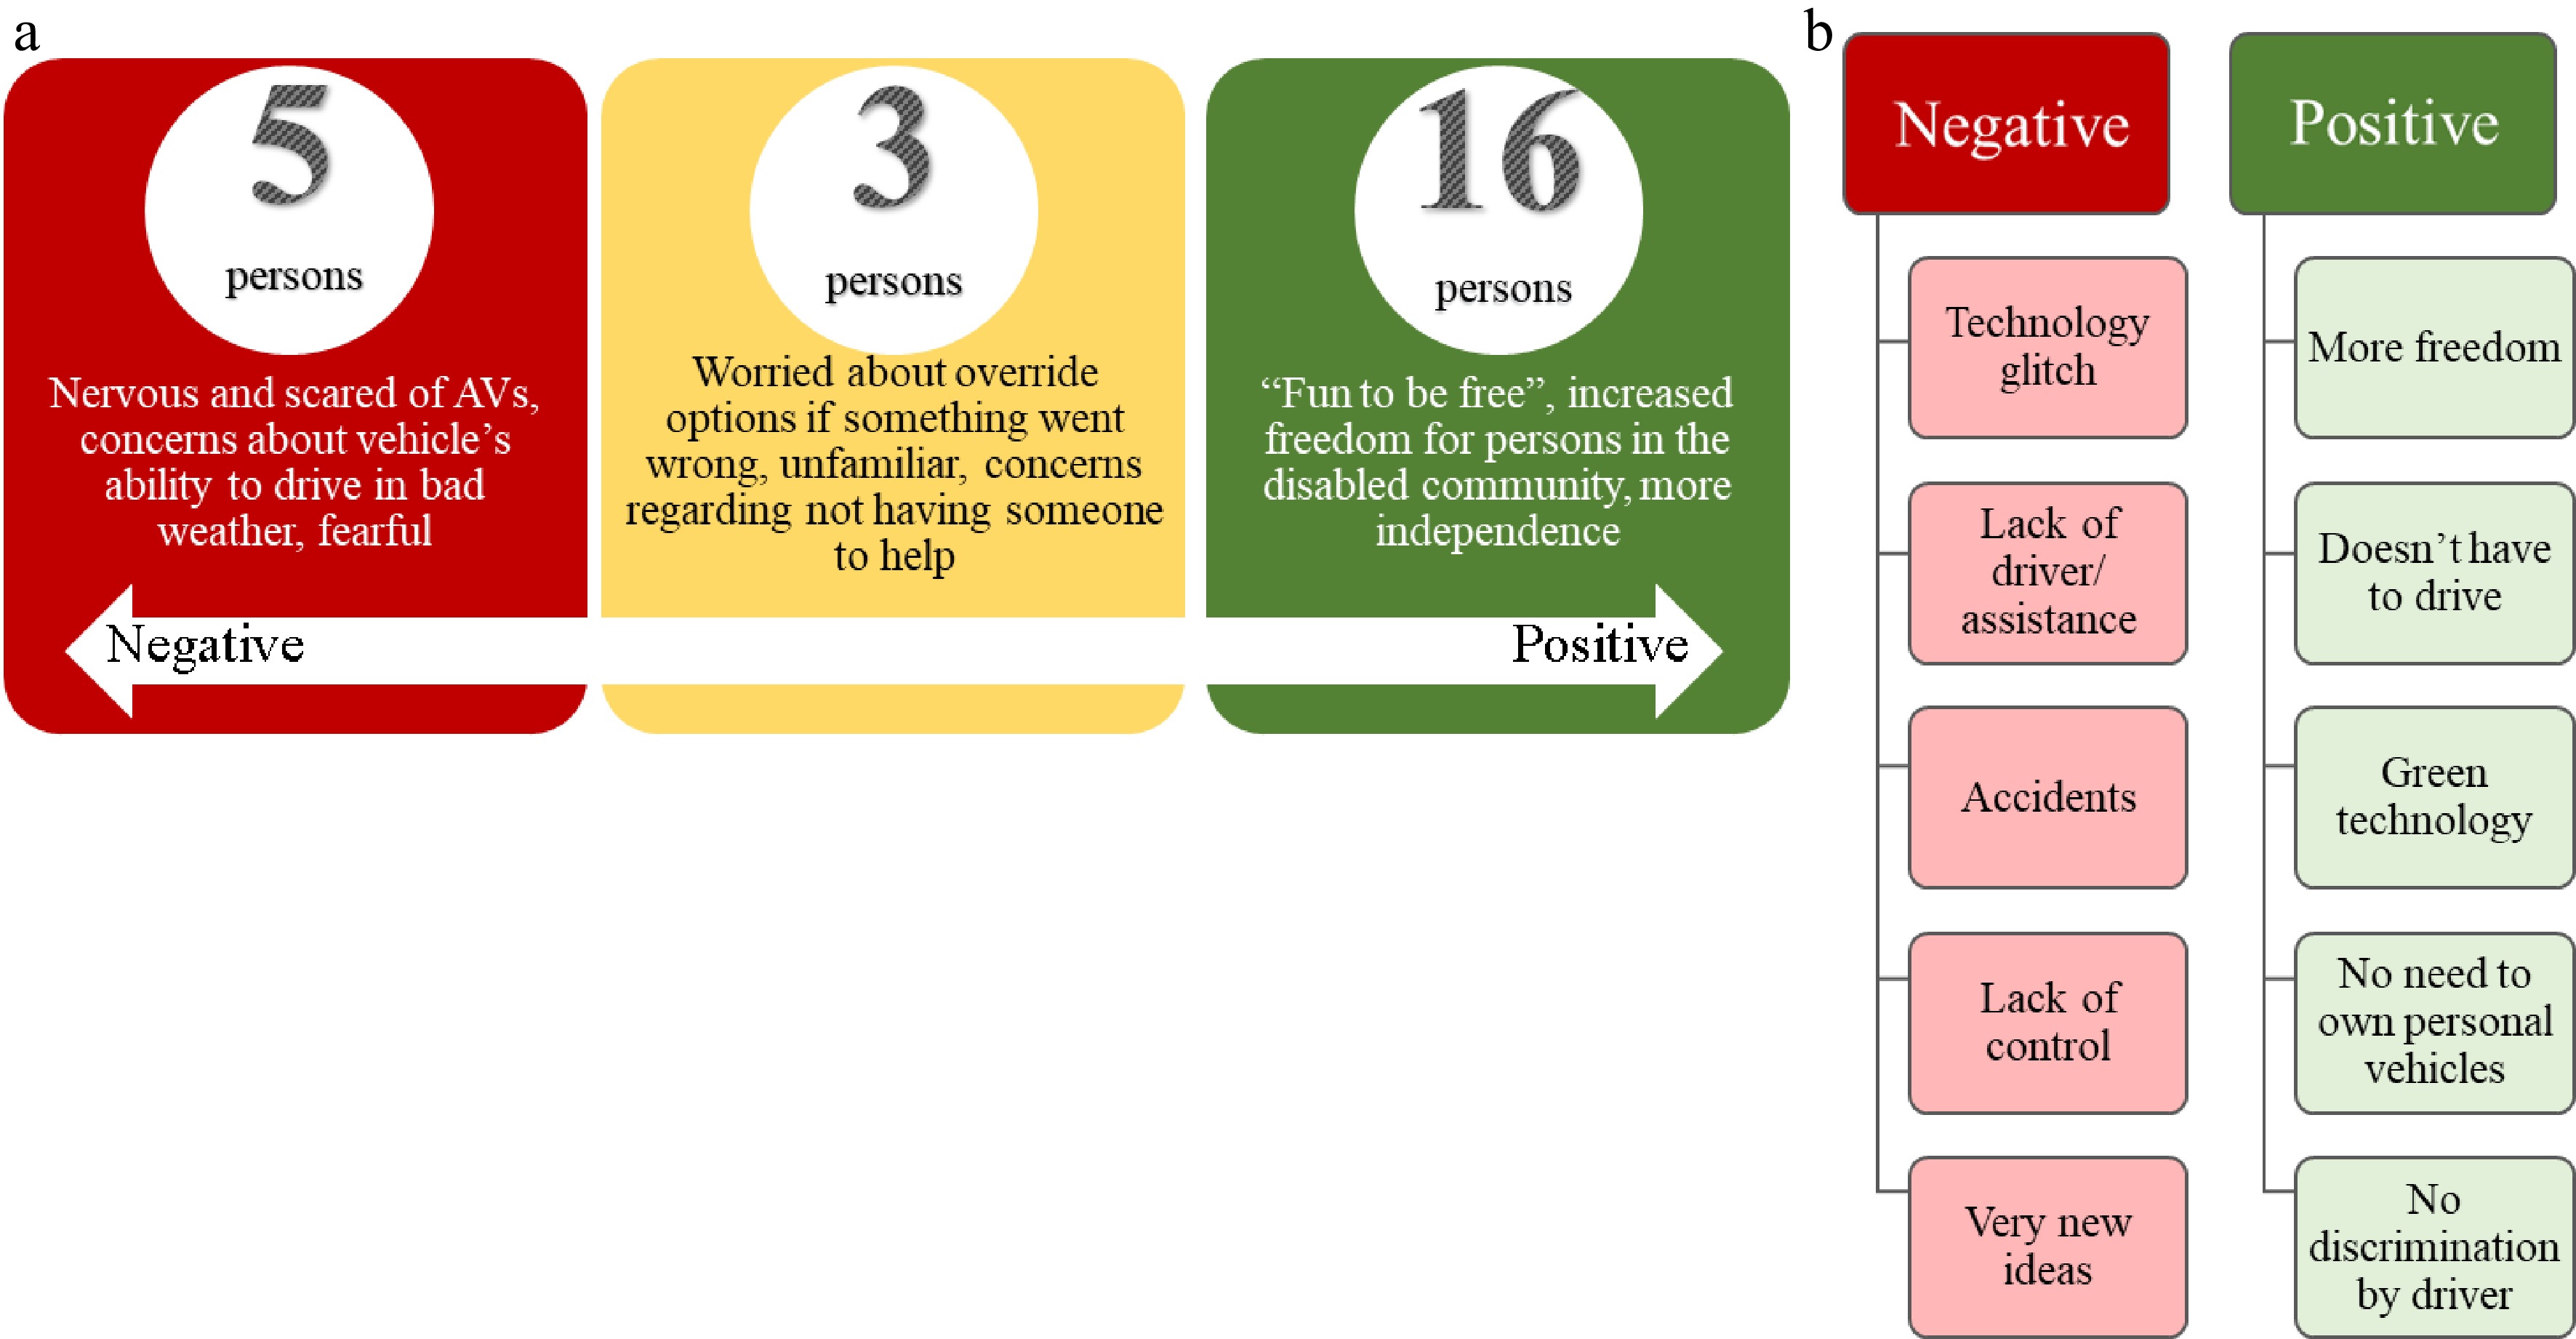
Figure 4.
(a) Participant feelings towards AVs. (b) Reasons for positive and negative views on AVs.
-
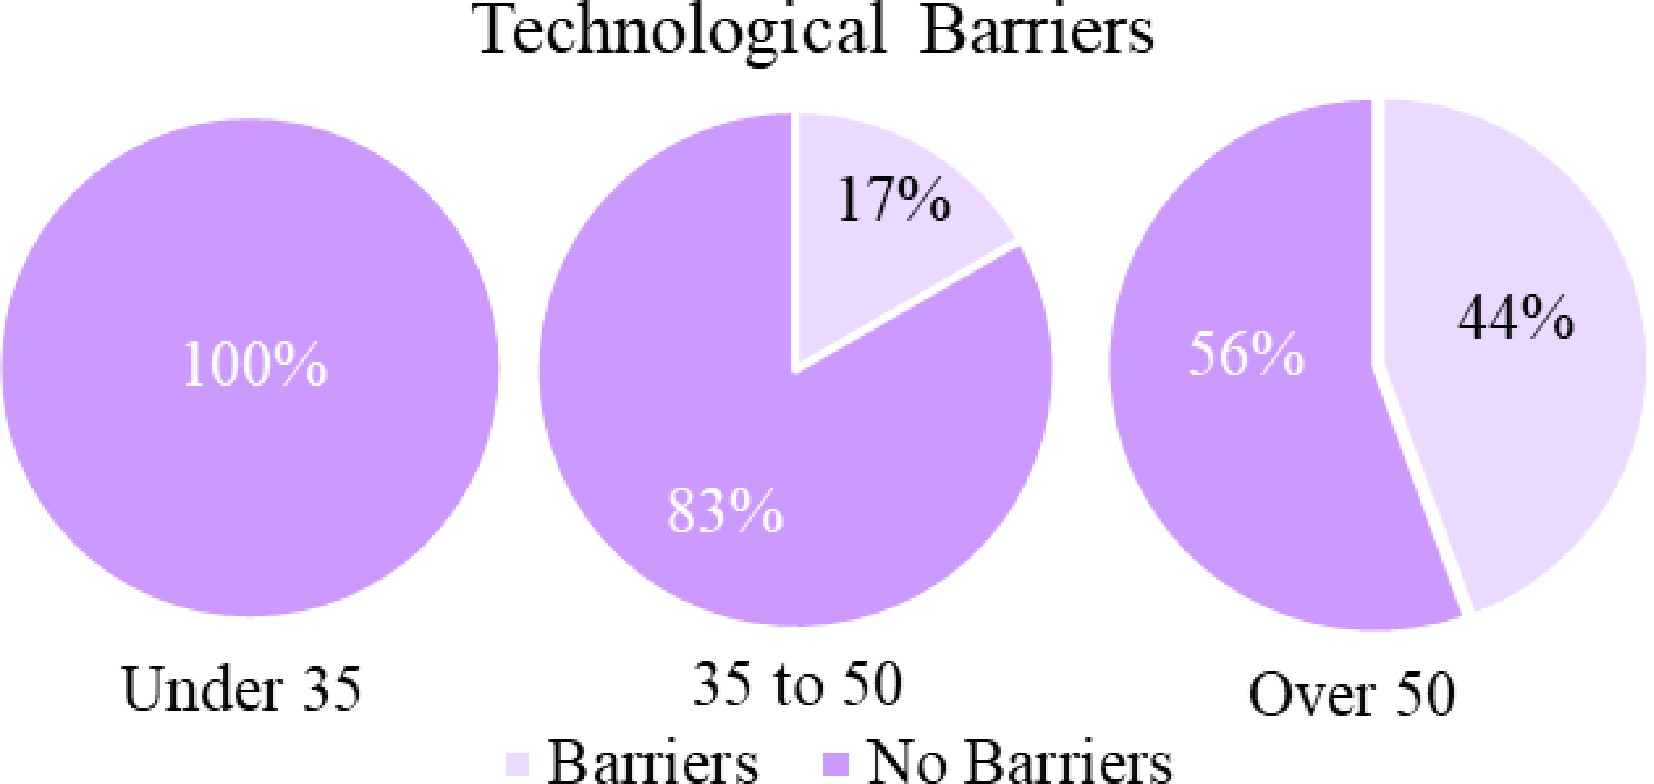
Figure 5.
Distribution of technological barriers (such as cell phone and app usage or sending and receiving text messages broken up based on age).
Figures
(5)
Tables
(0)