-

Figure 1.
Examples of different types of two-axle trucks. (a) Micro truck. (b) Light truck. (c) Medium truck. (d) Heavy truck.
-
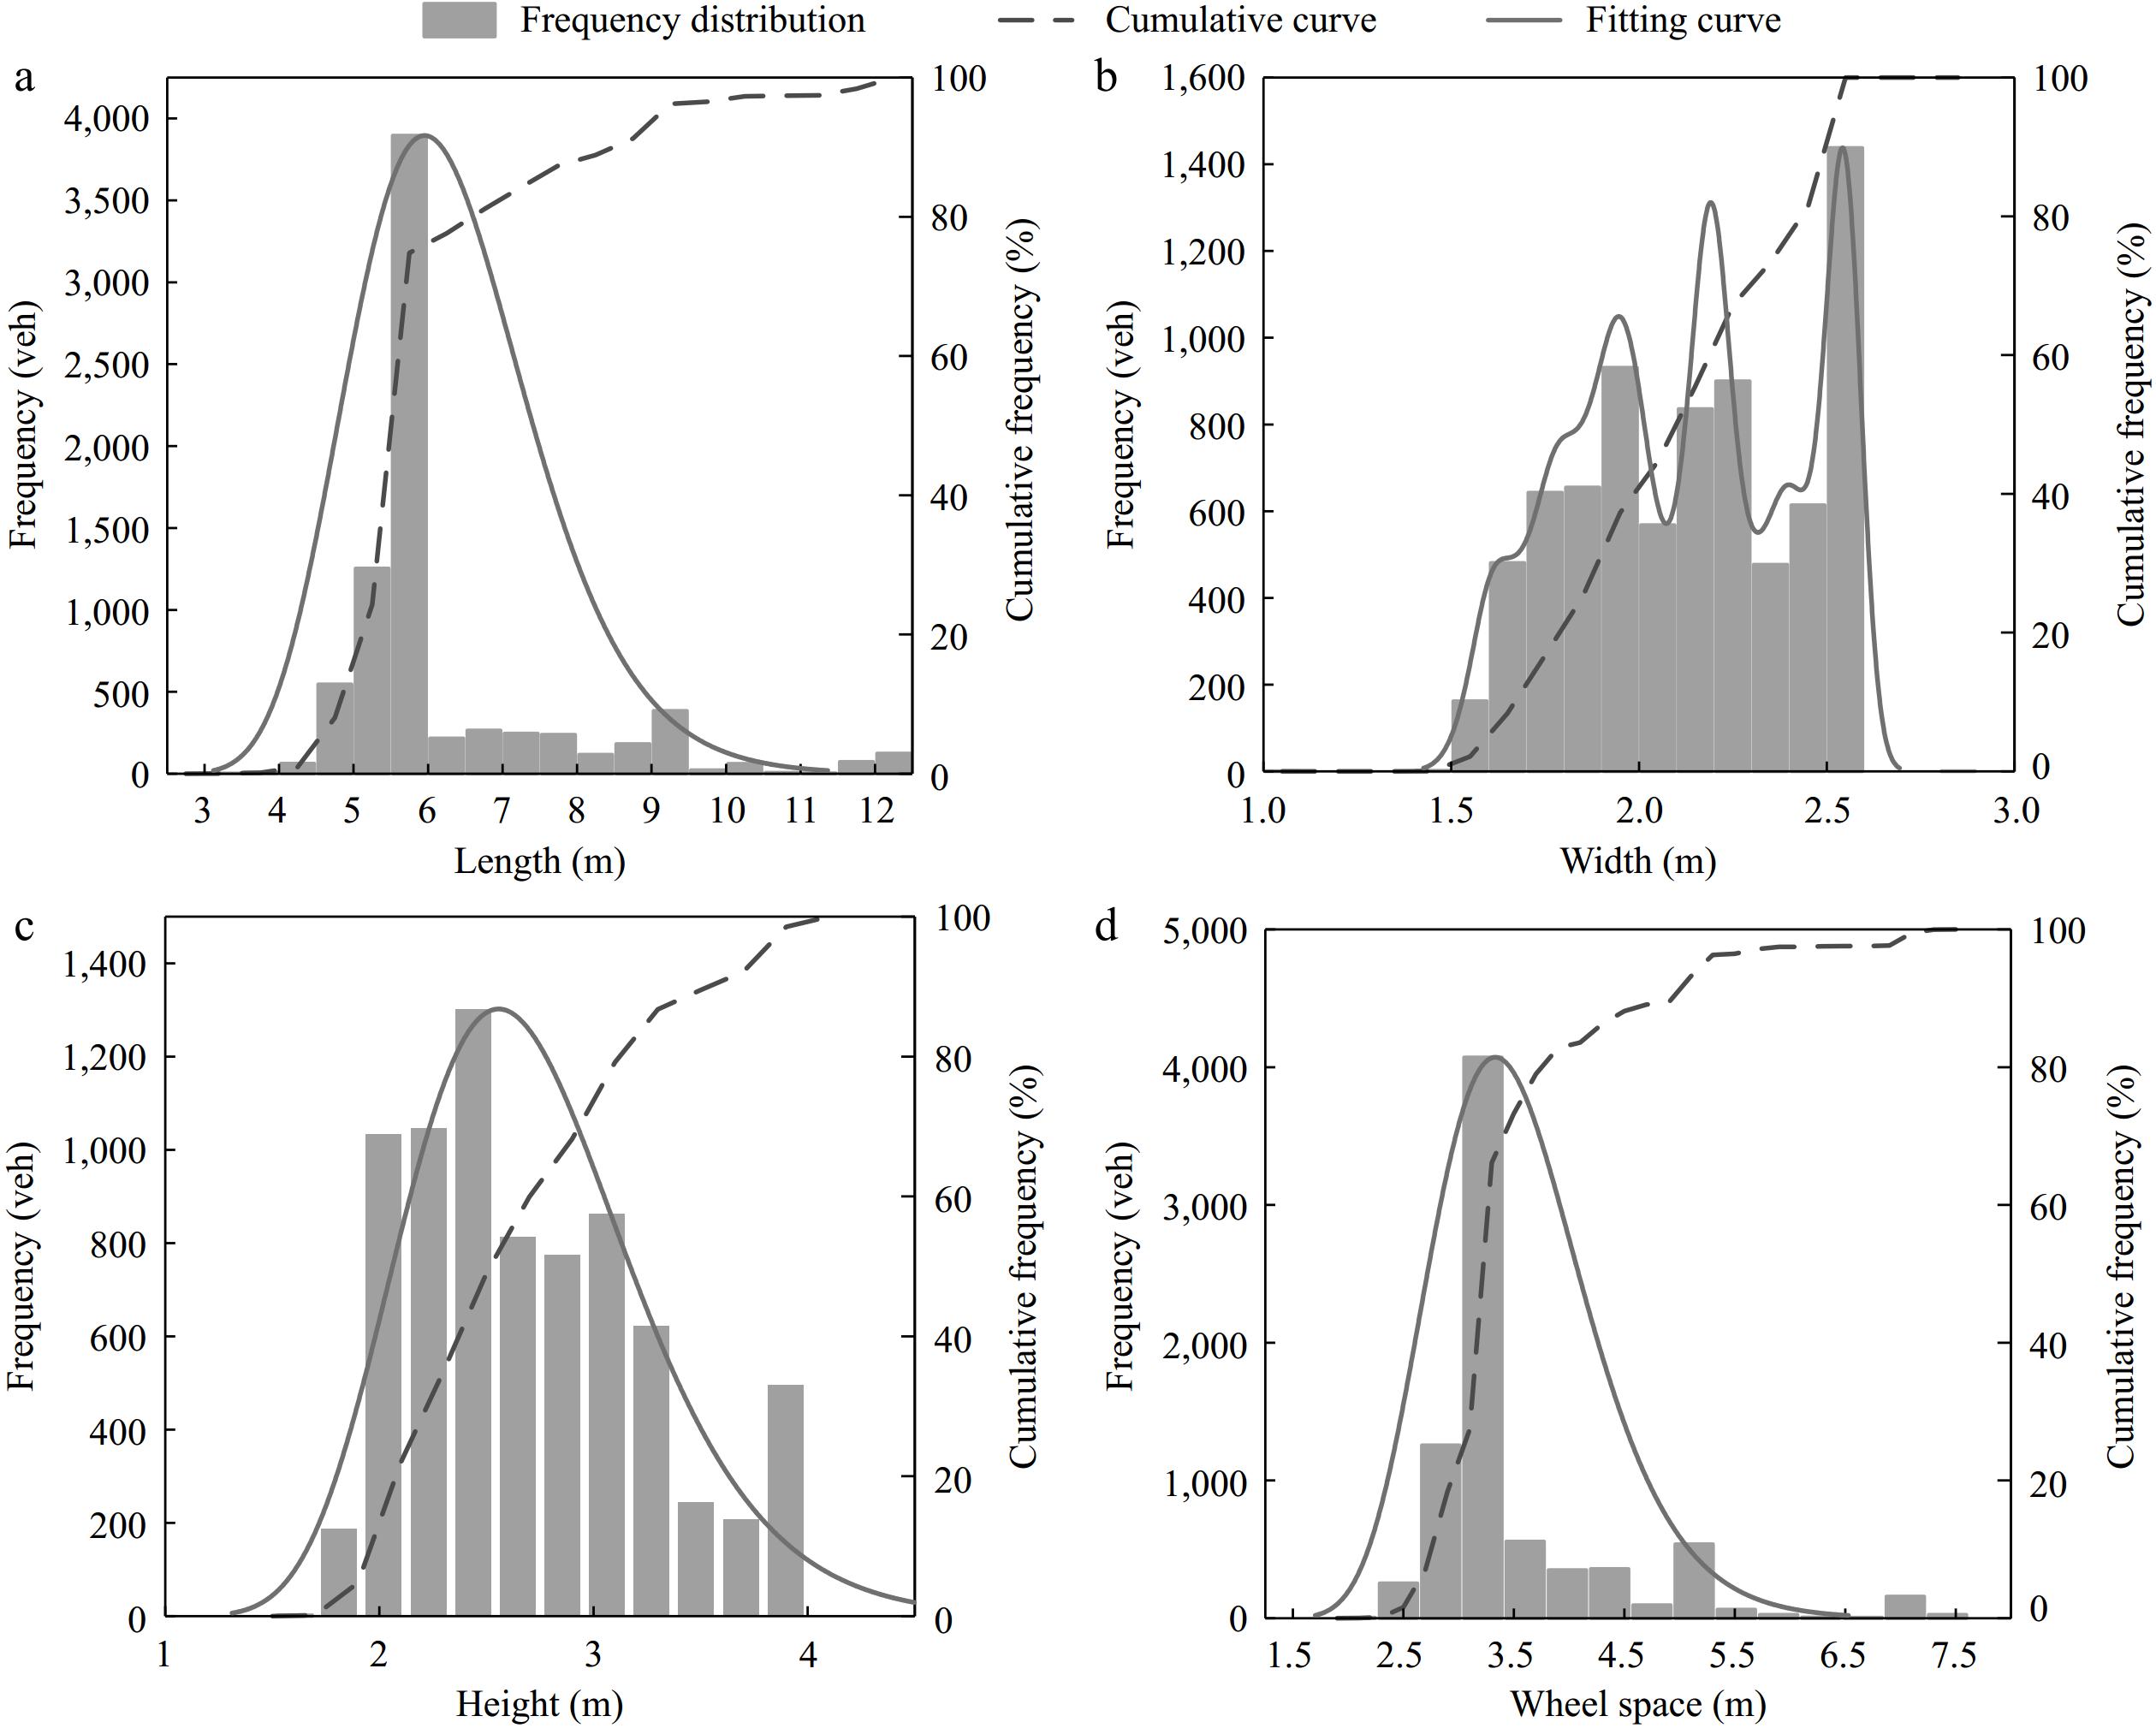
Figure 2.
Overall distribution of outline dimensions. (a) Bodywork length. (b) Vehicle body width. (c) Vehicle body height. (d) Wheel space.
-
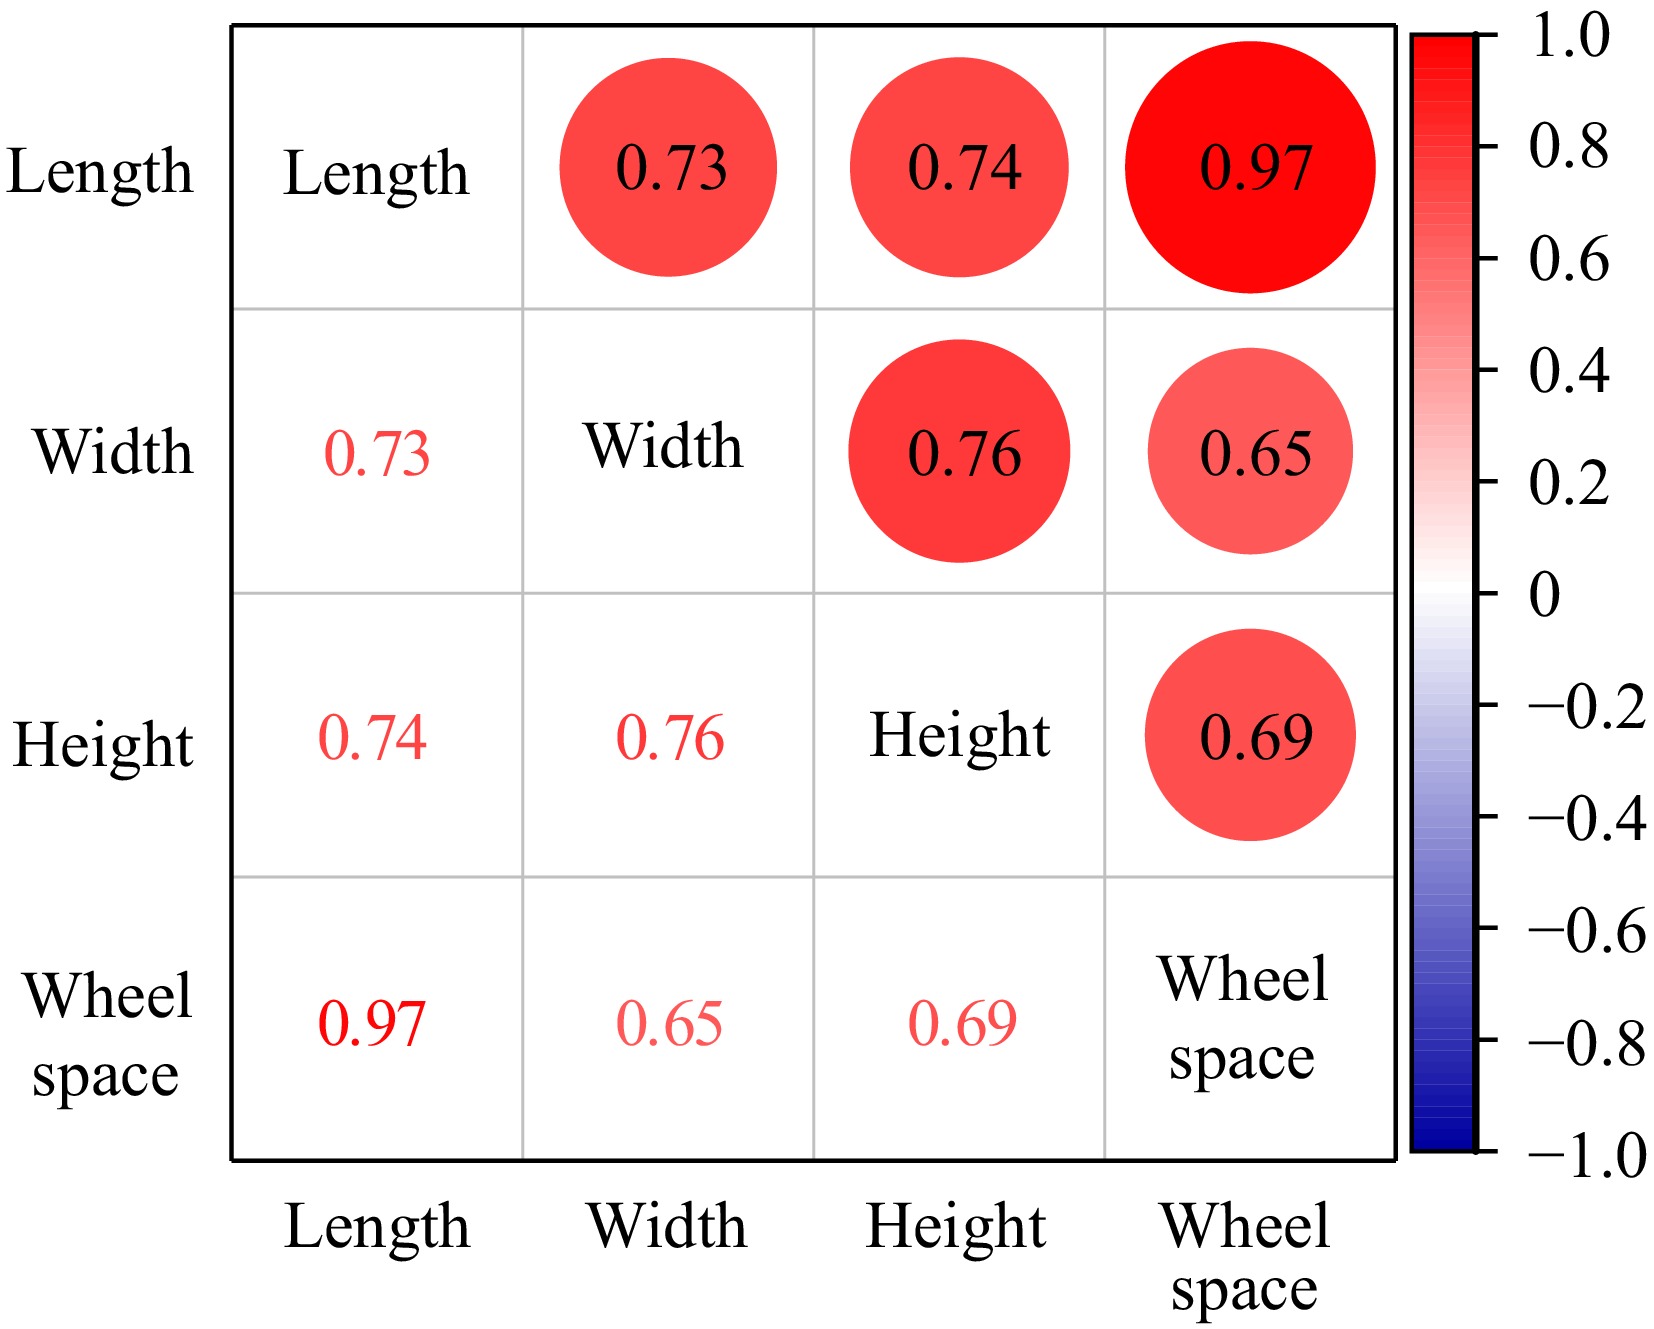
Figure 3.
Correlation matrix.
-
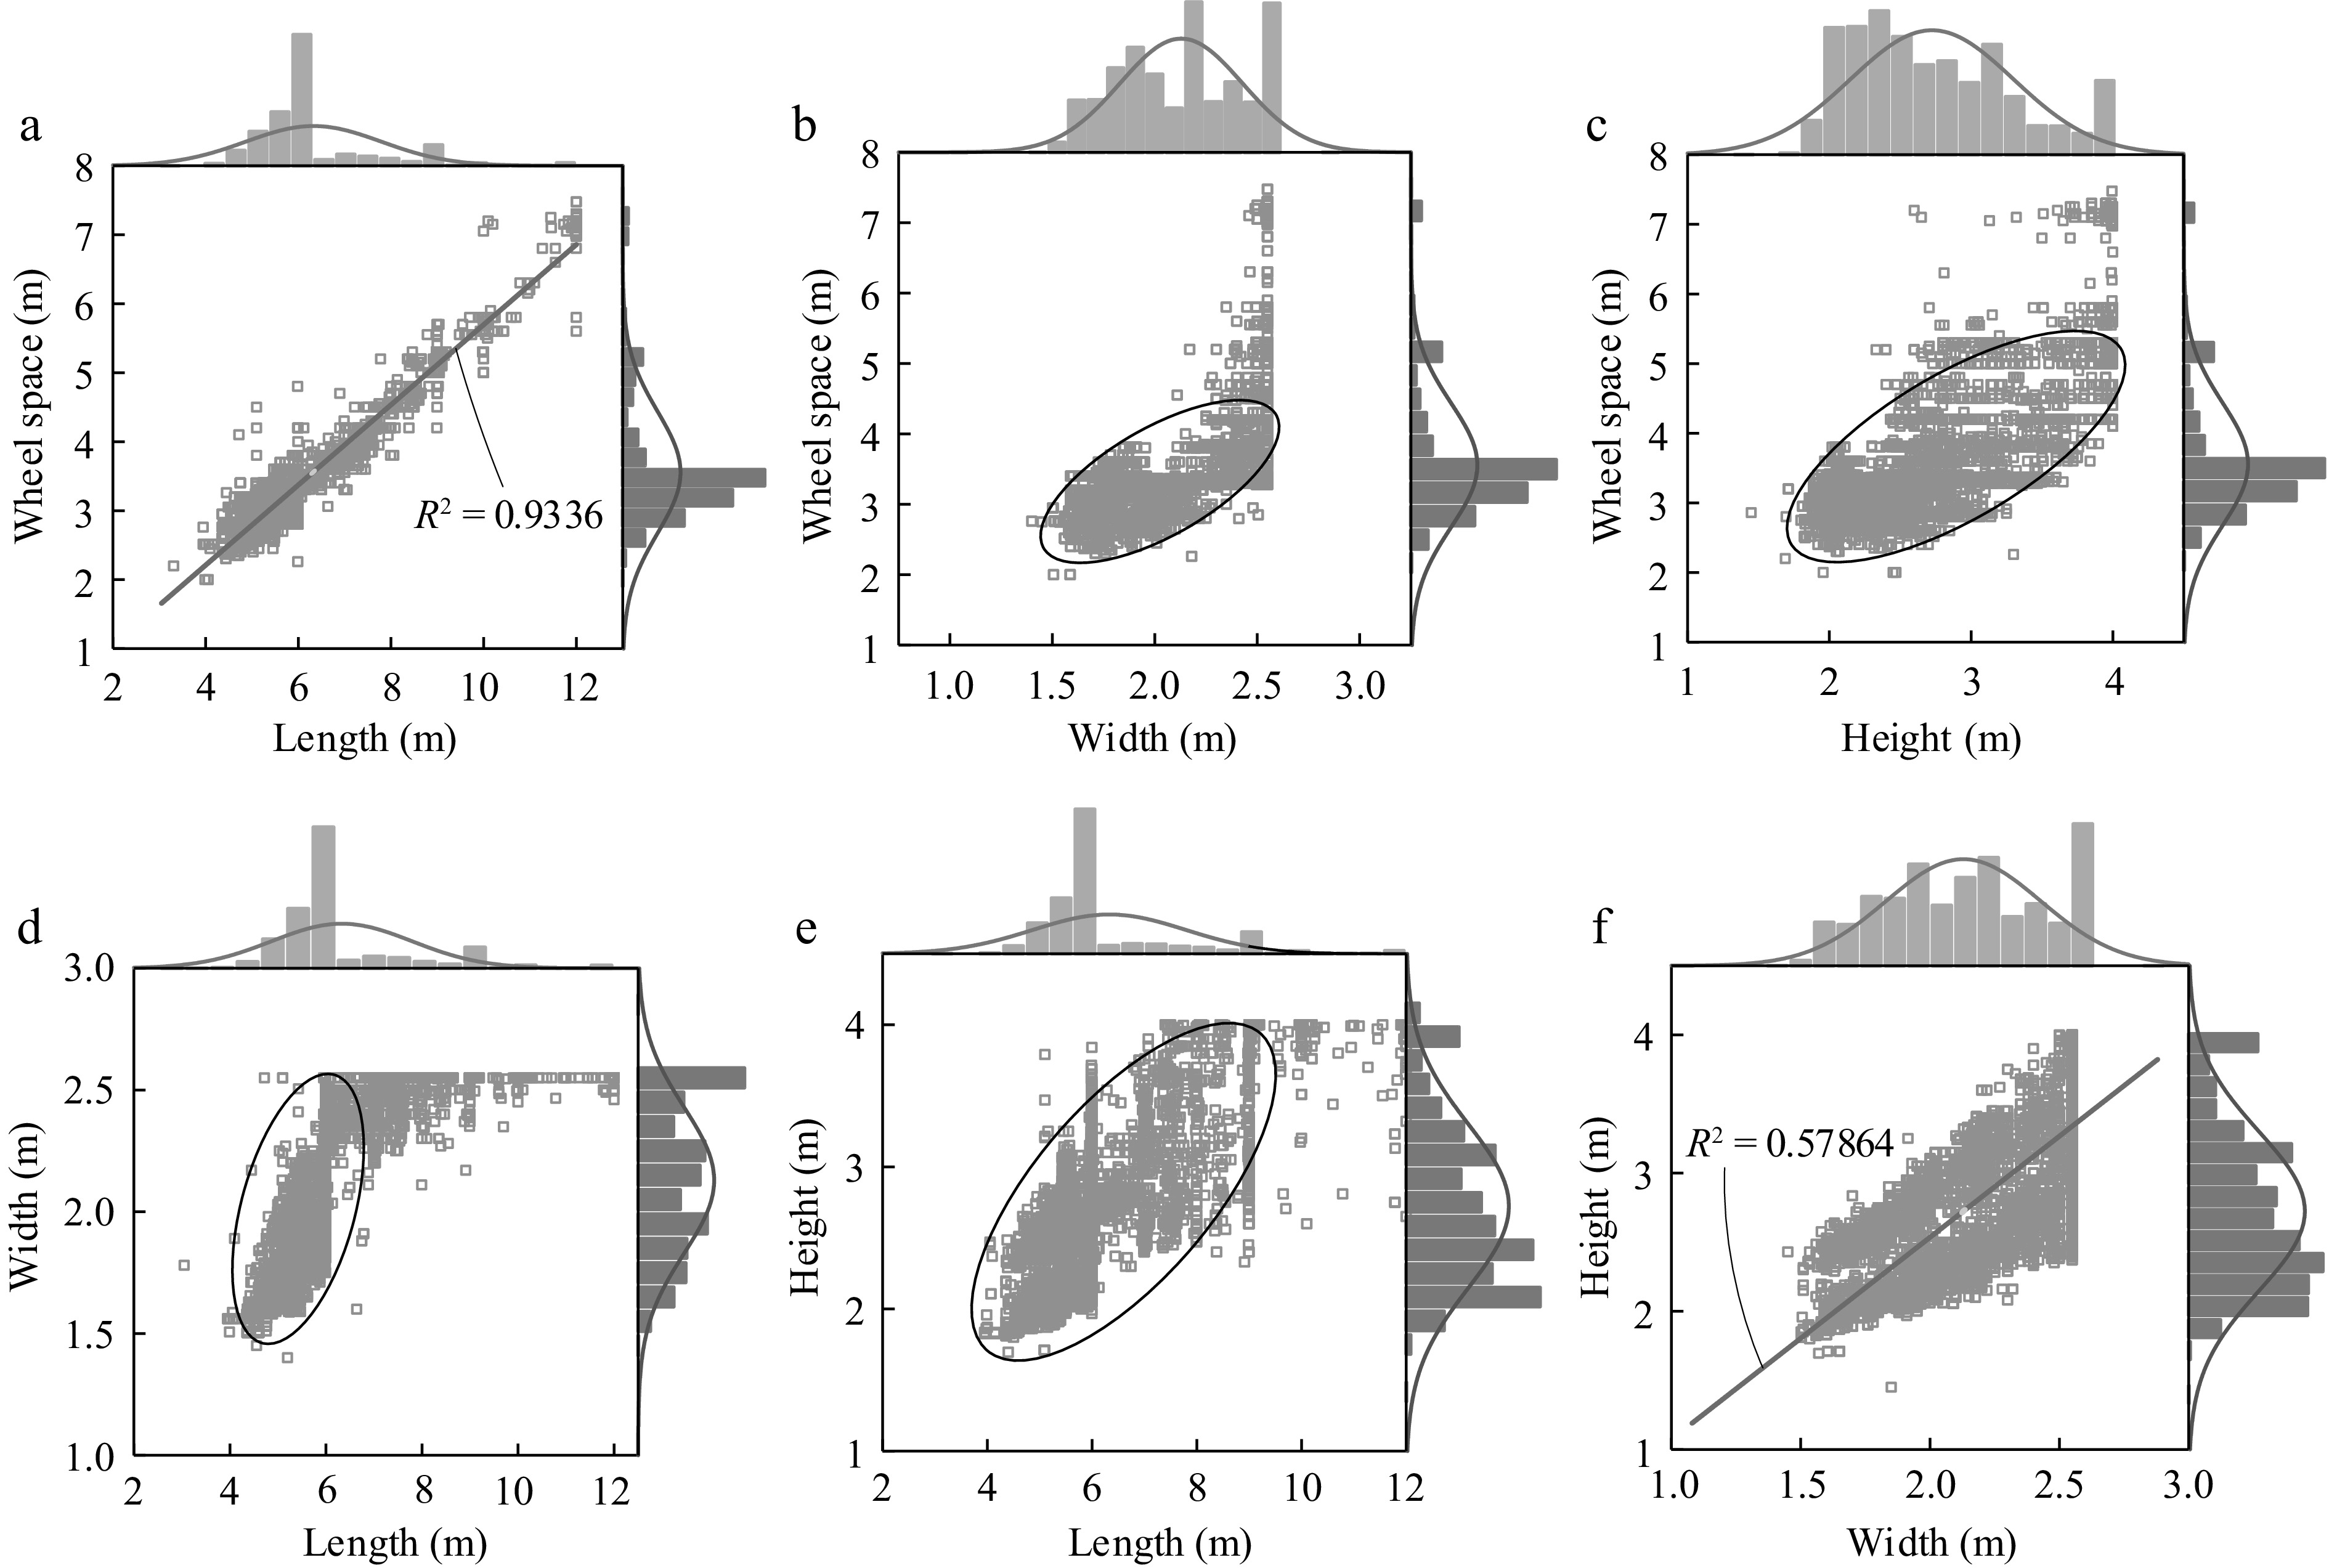
Figure 4.
Regression relationships between pairs of dimensional parameters. (a) Length—wheel space. (b) Width—wheel space. (c) Height—wheel space. (d) Length—width. (e) Length—height. (f) Width—height.
-
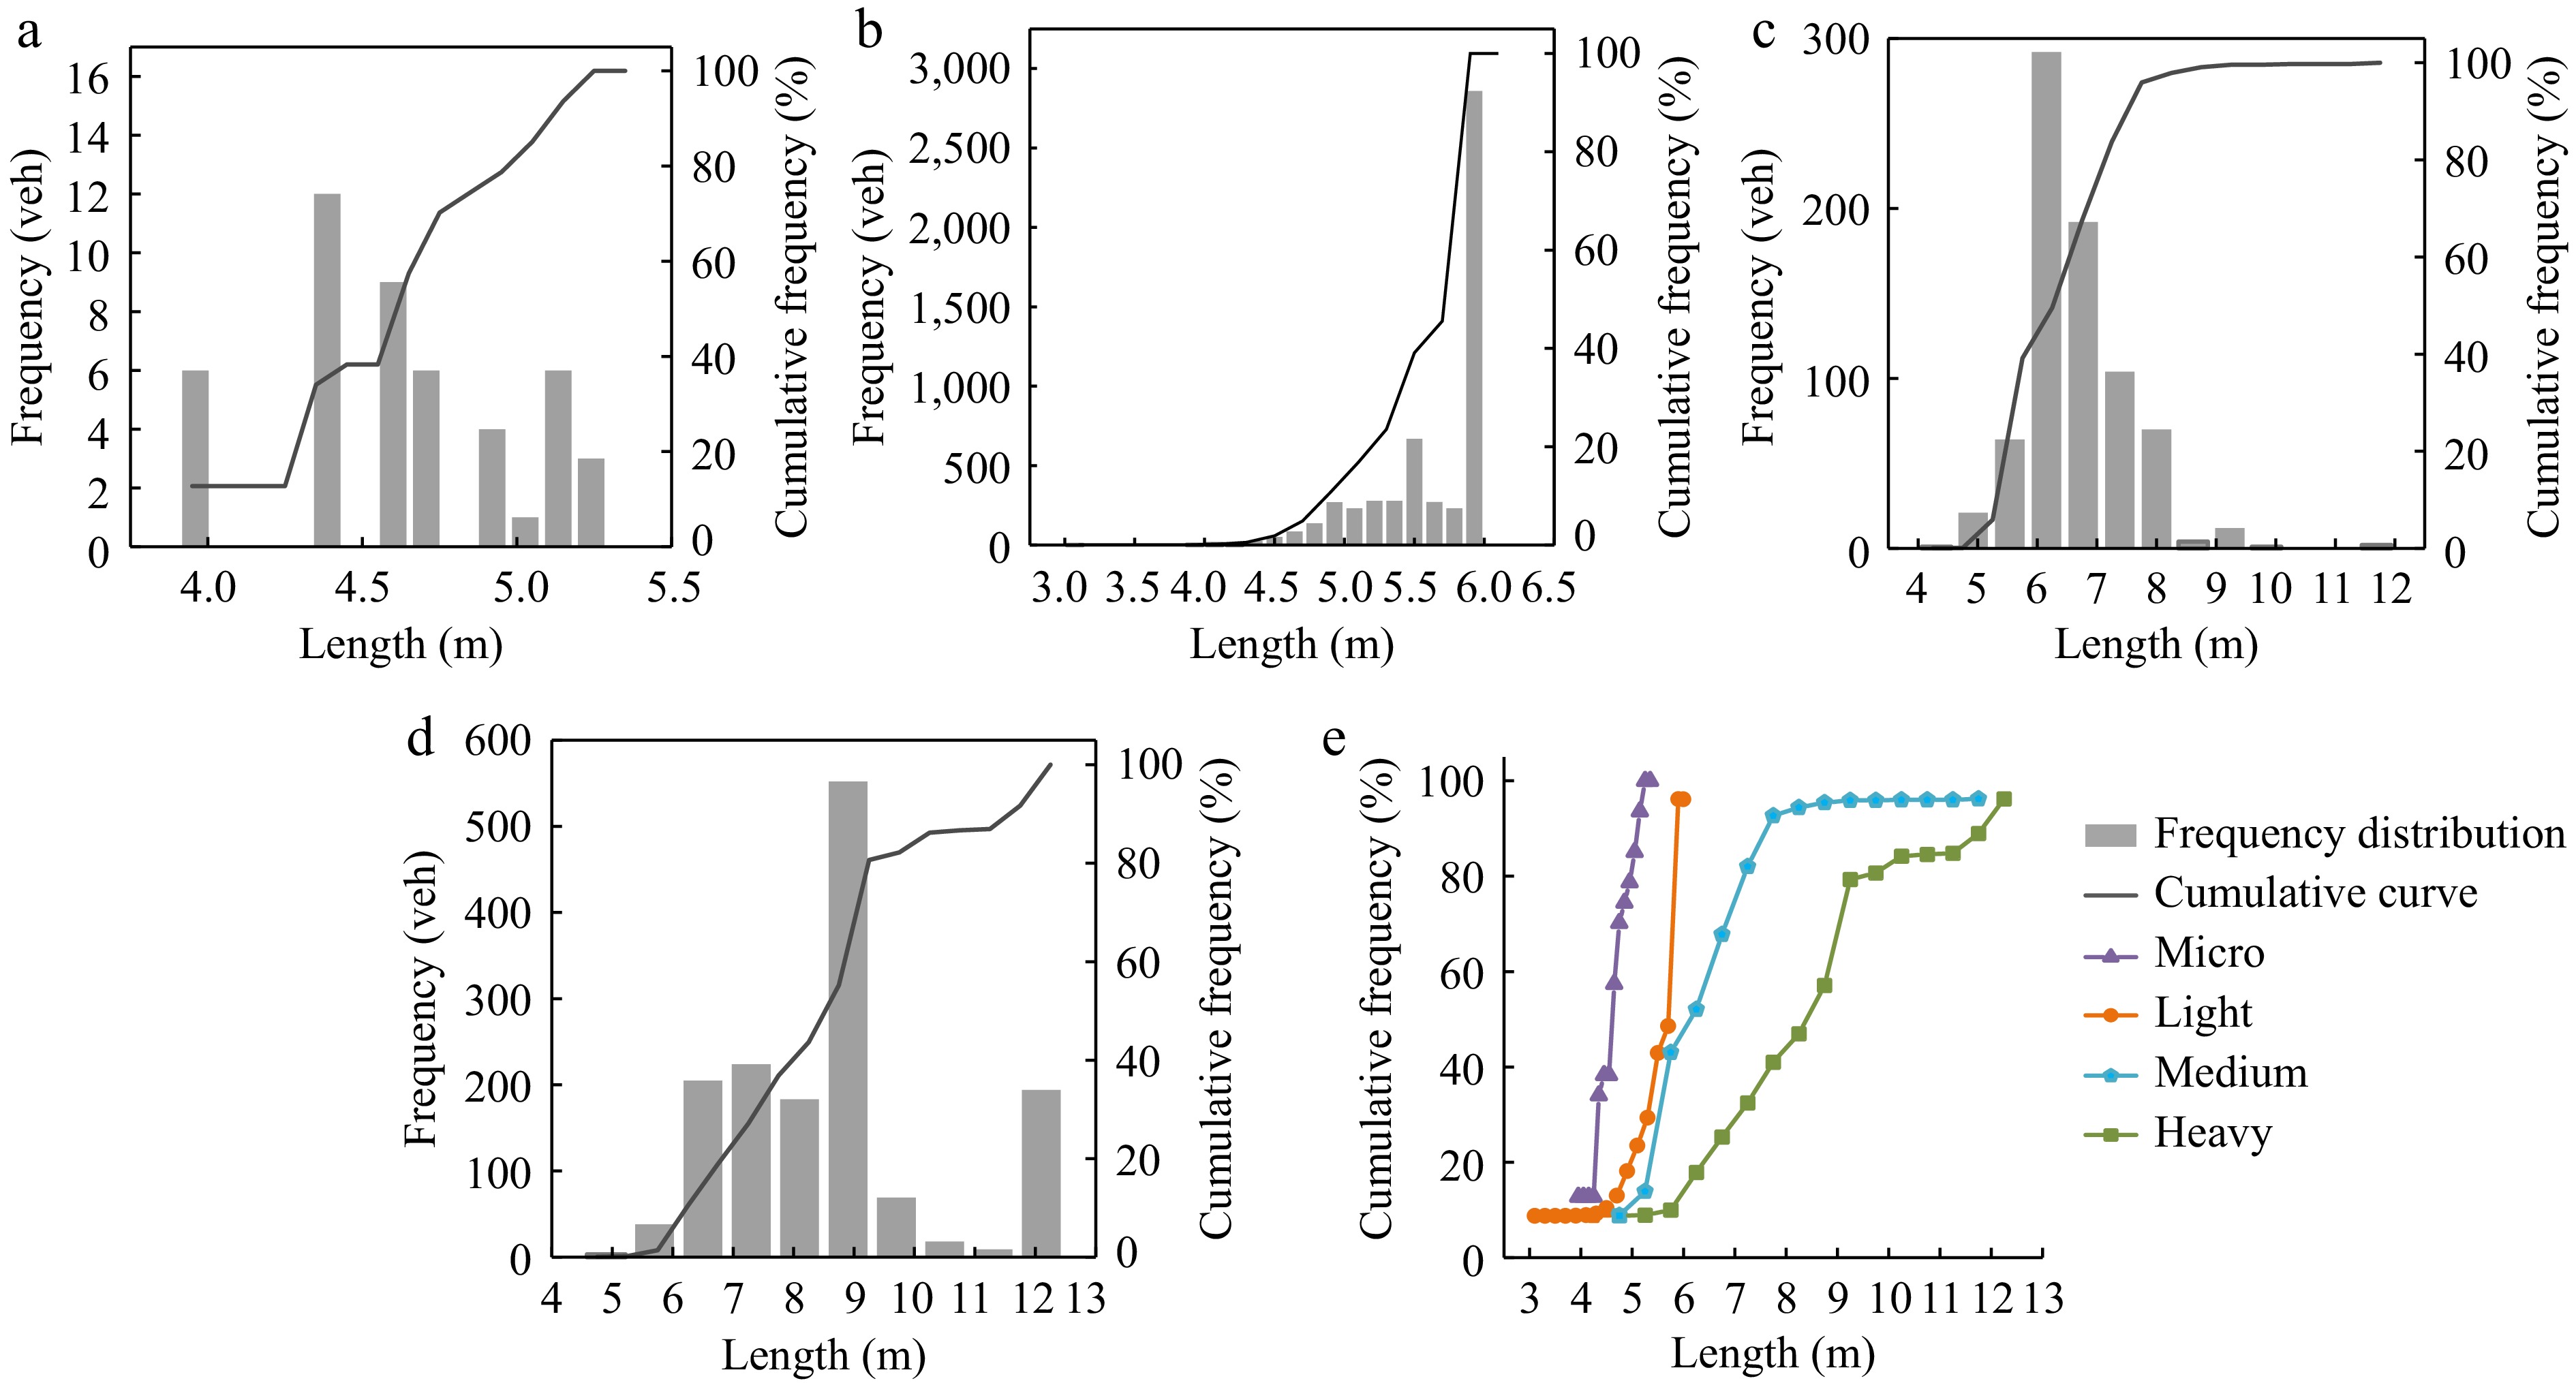
Figure 5.
Body length distribution of different goods vehicles. (a) Micro. (b) Light. (c) Medium. (d) Heavy. (e) Cumulative frequency curve.
-
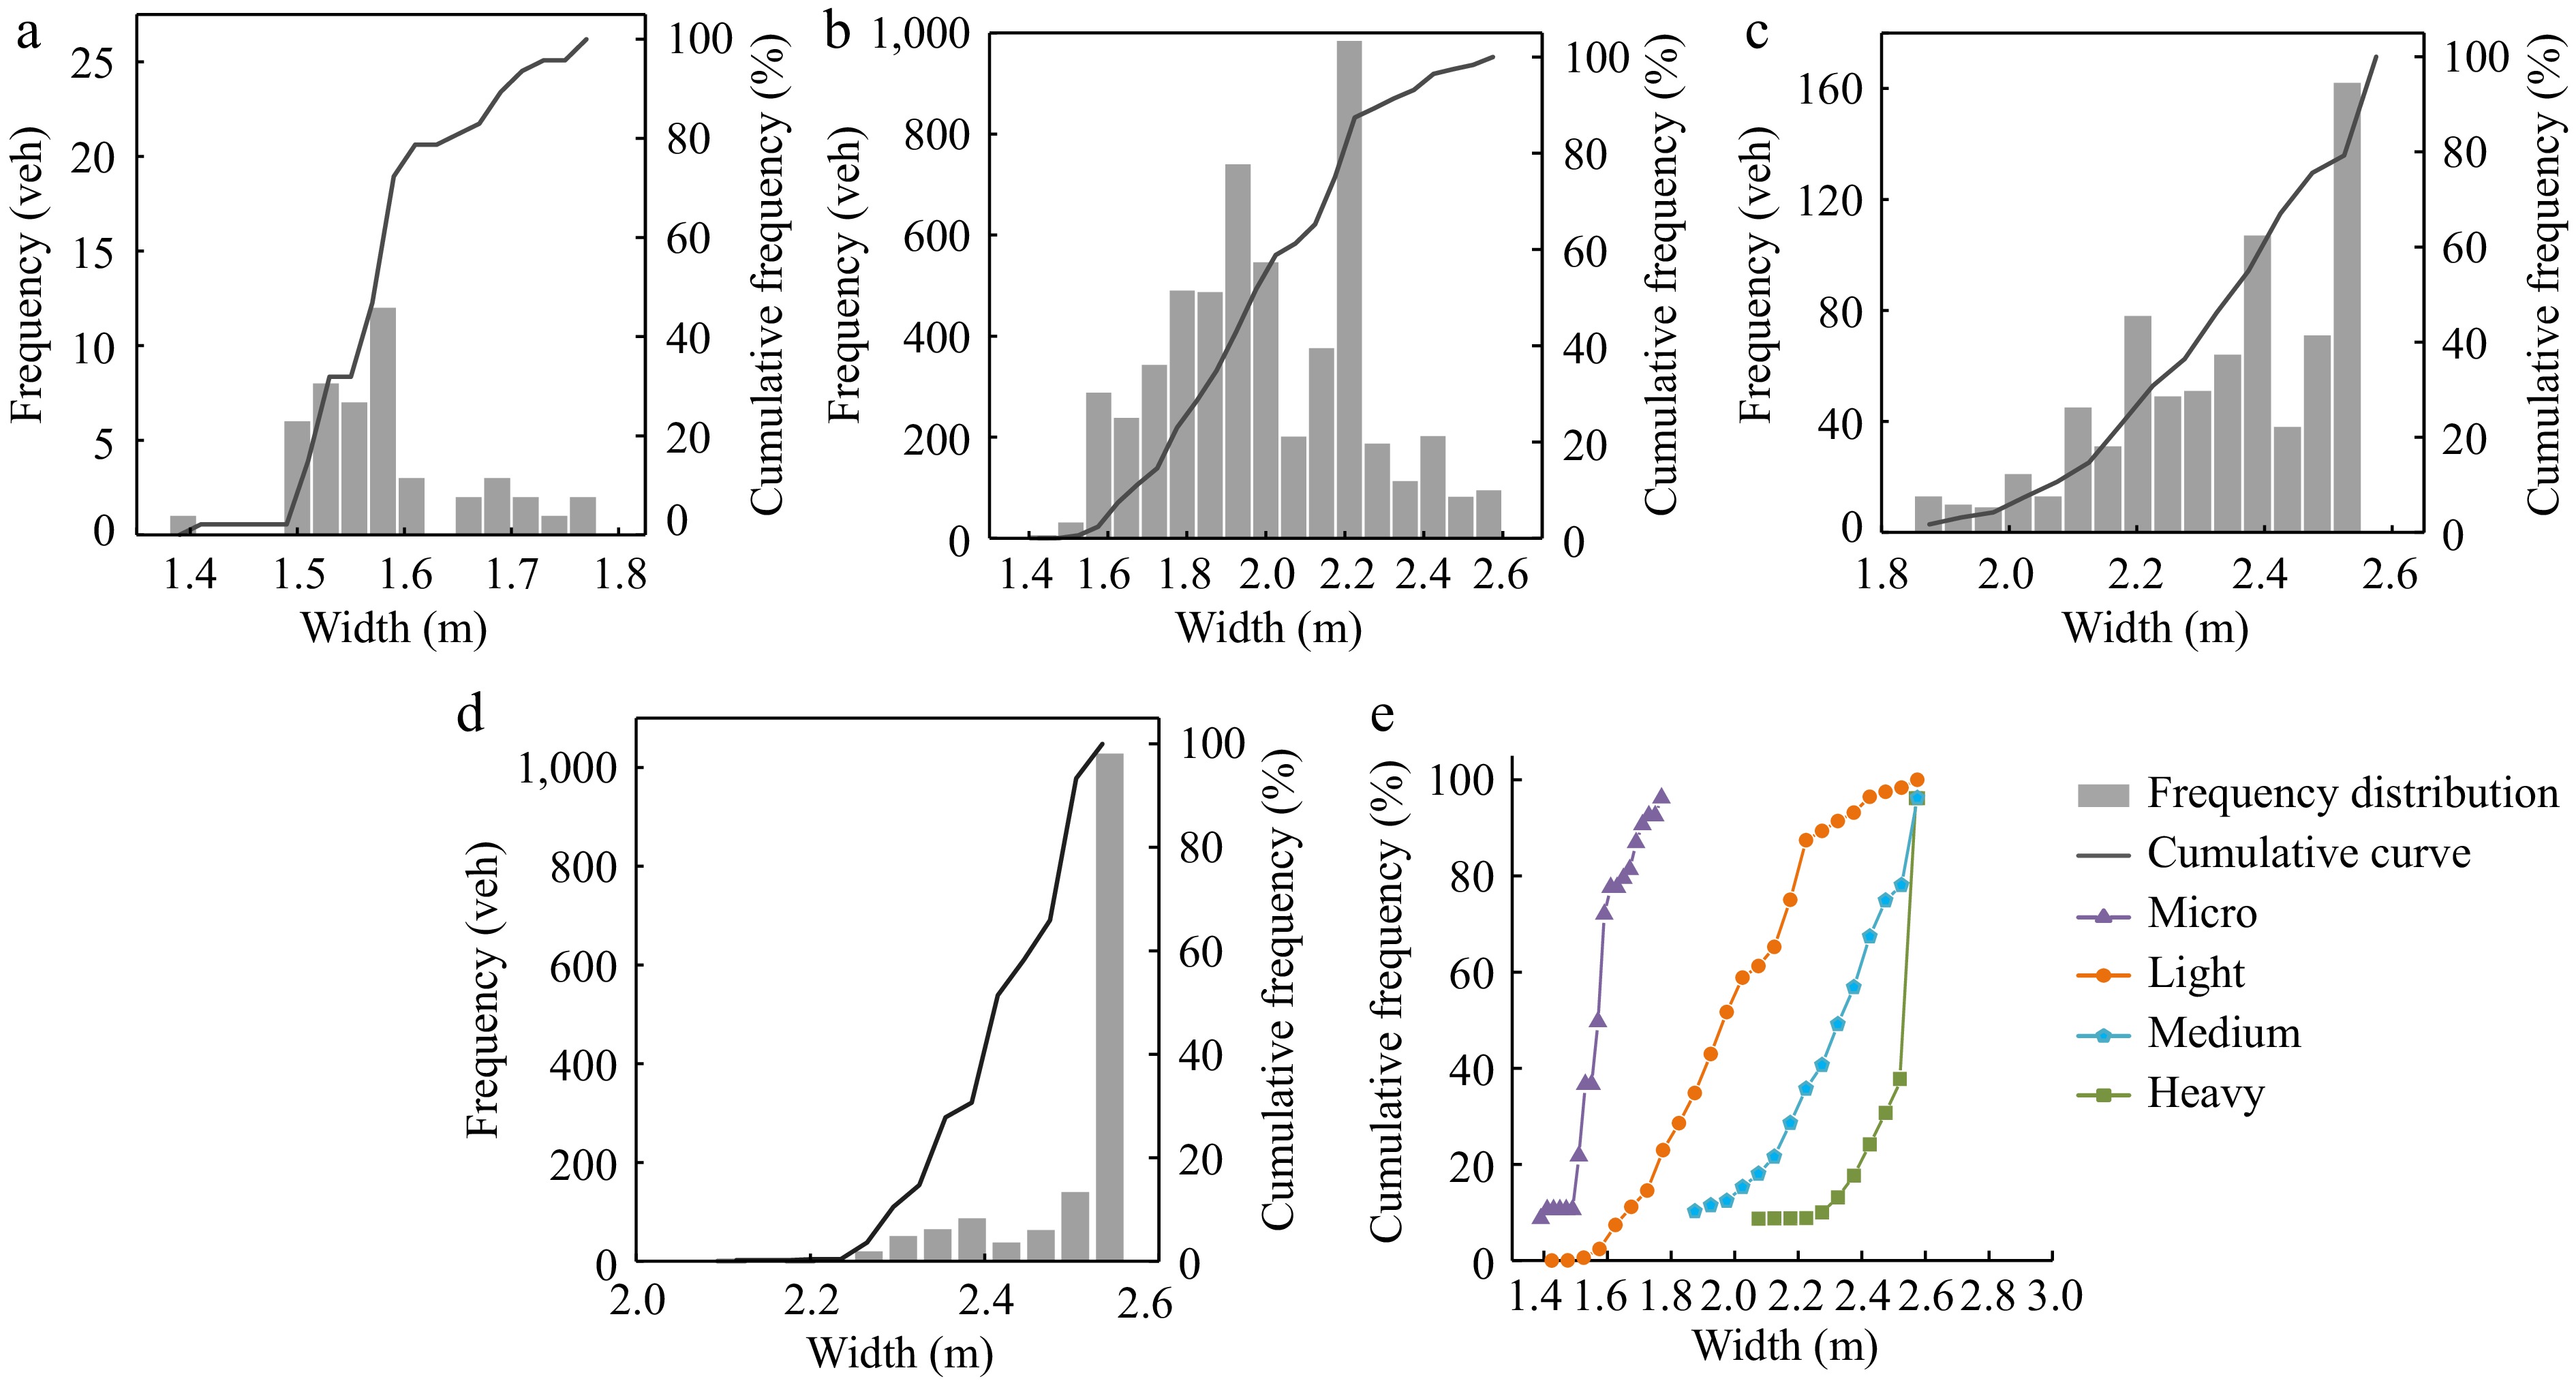
Figure 6.
Body width distribution of different goods vehicles. (a) Micro. (b) Light. (c) Medium. (d) Heavy. (e) Cumulative frequency curve.
-
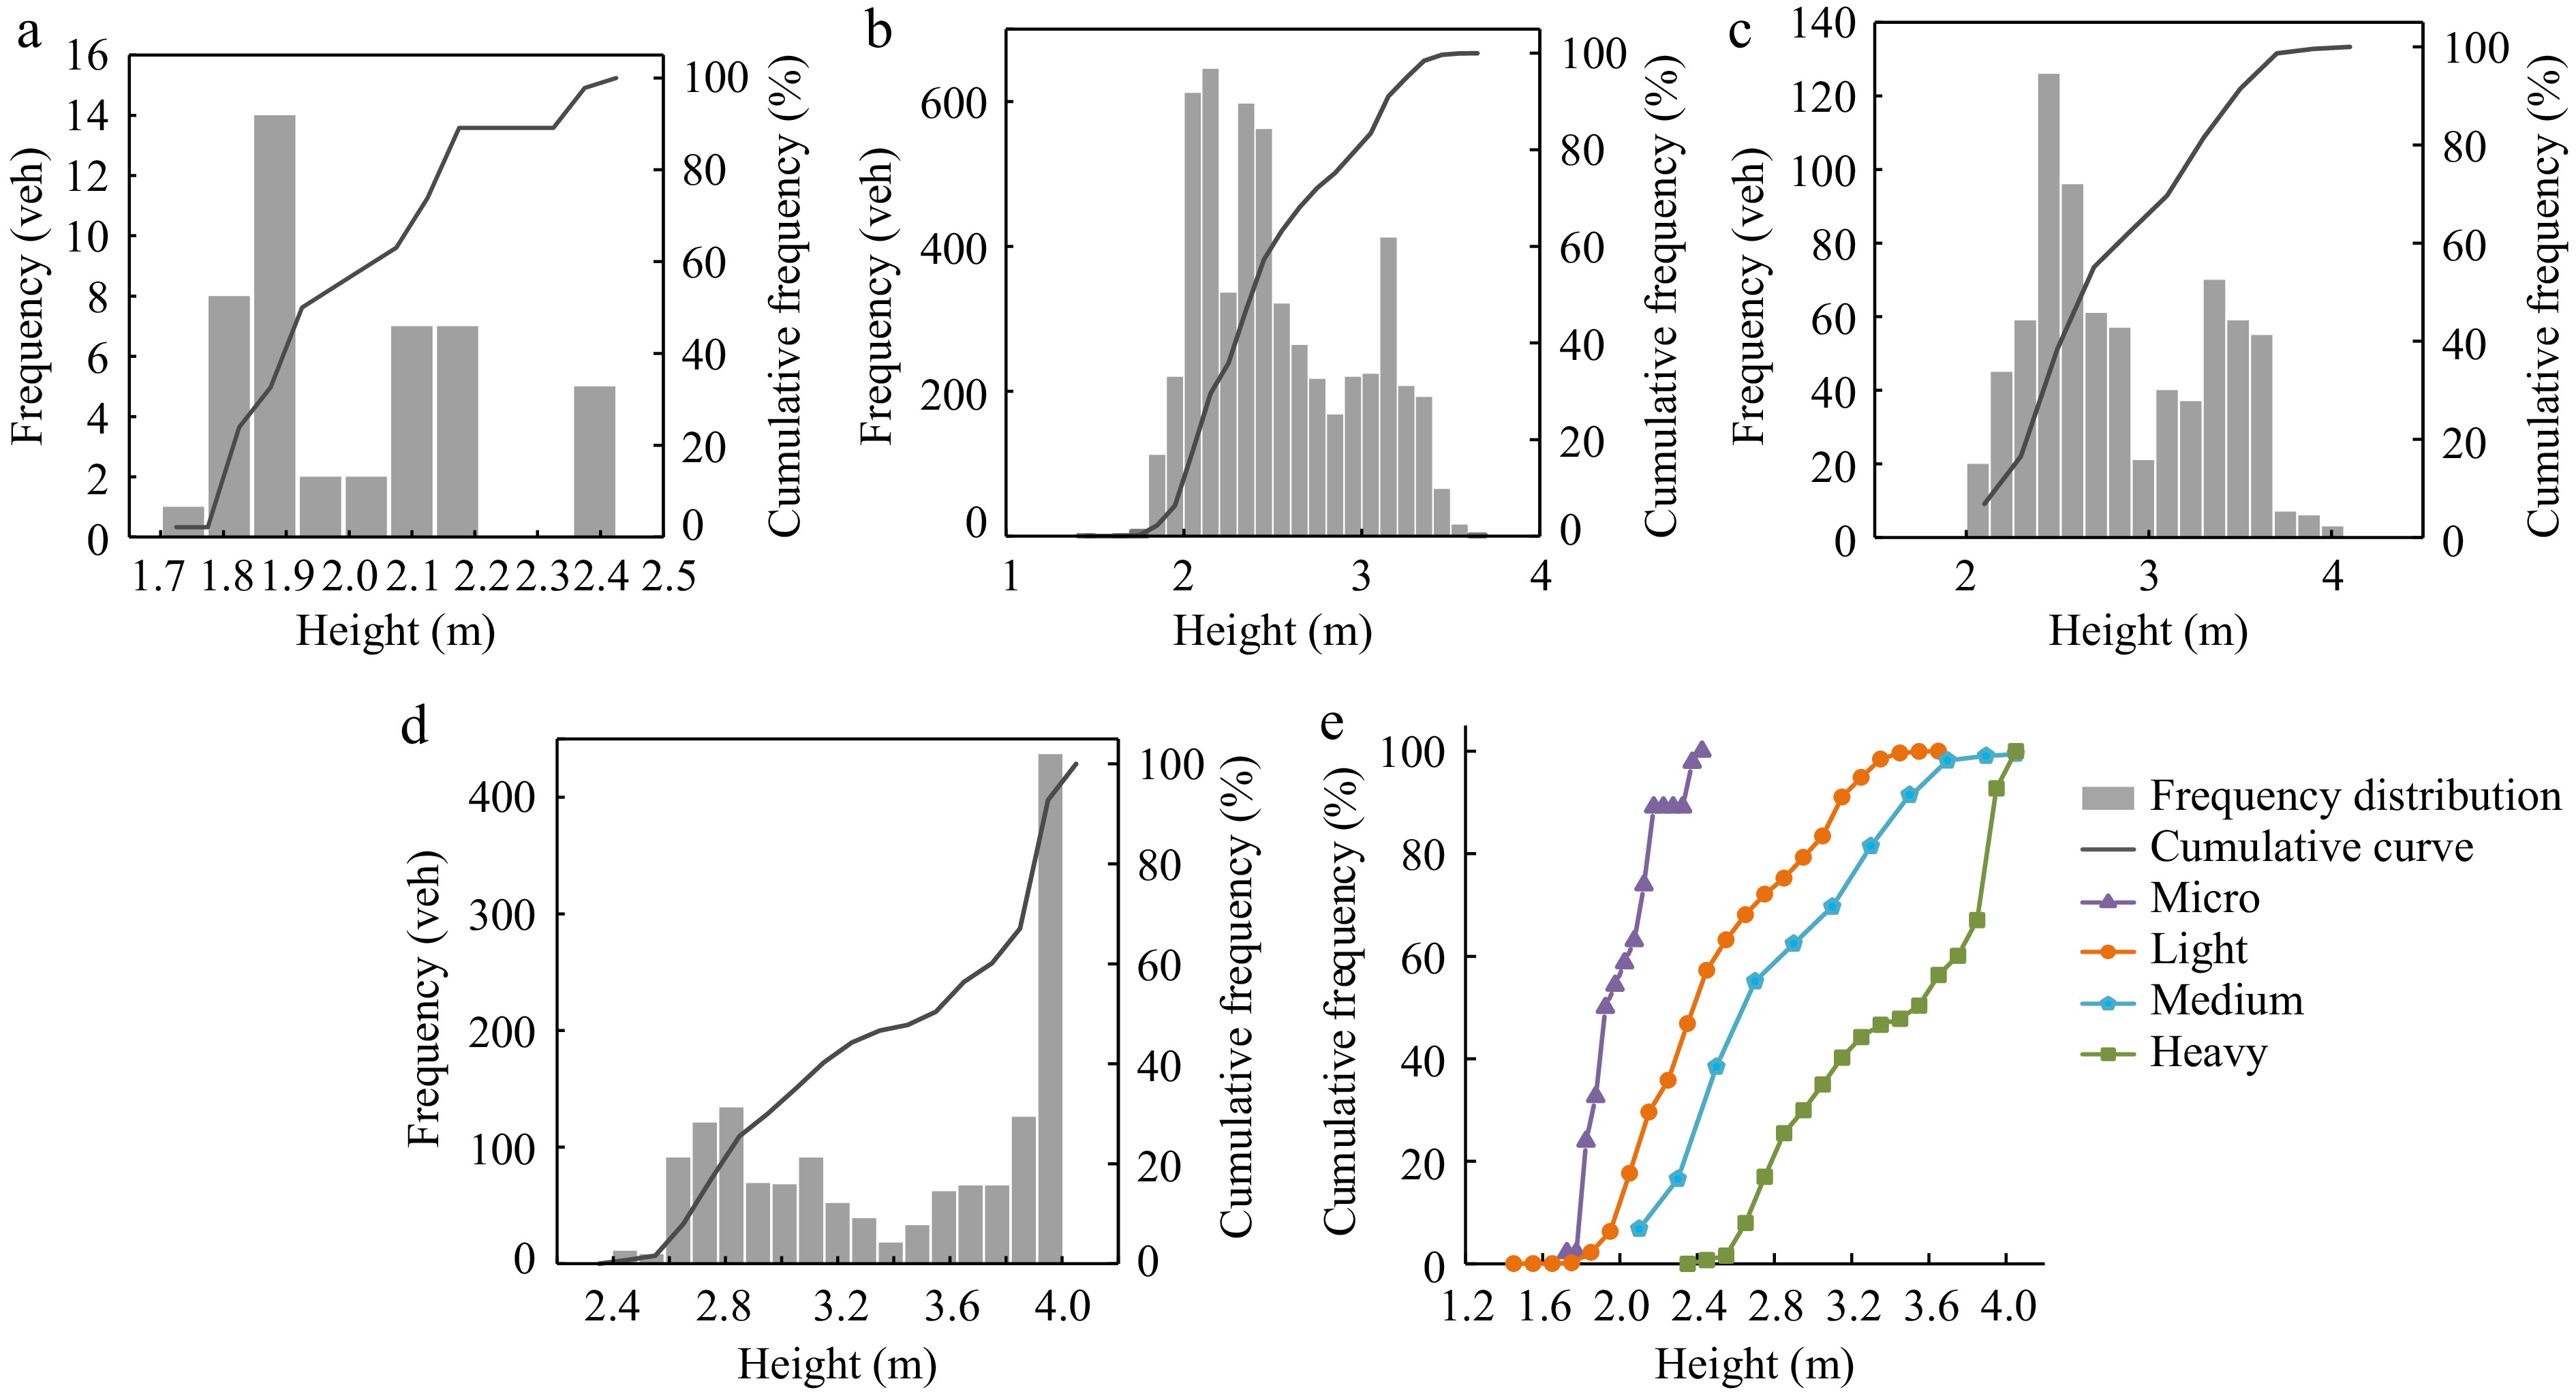
Figure 7.
Height distribution of different goods vehicle bodies. (a) Micro. (b) Light. (c) Medium. (d) Heavy. (e) Cumulative frequency curve.
-
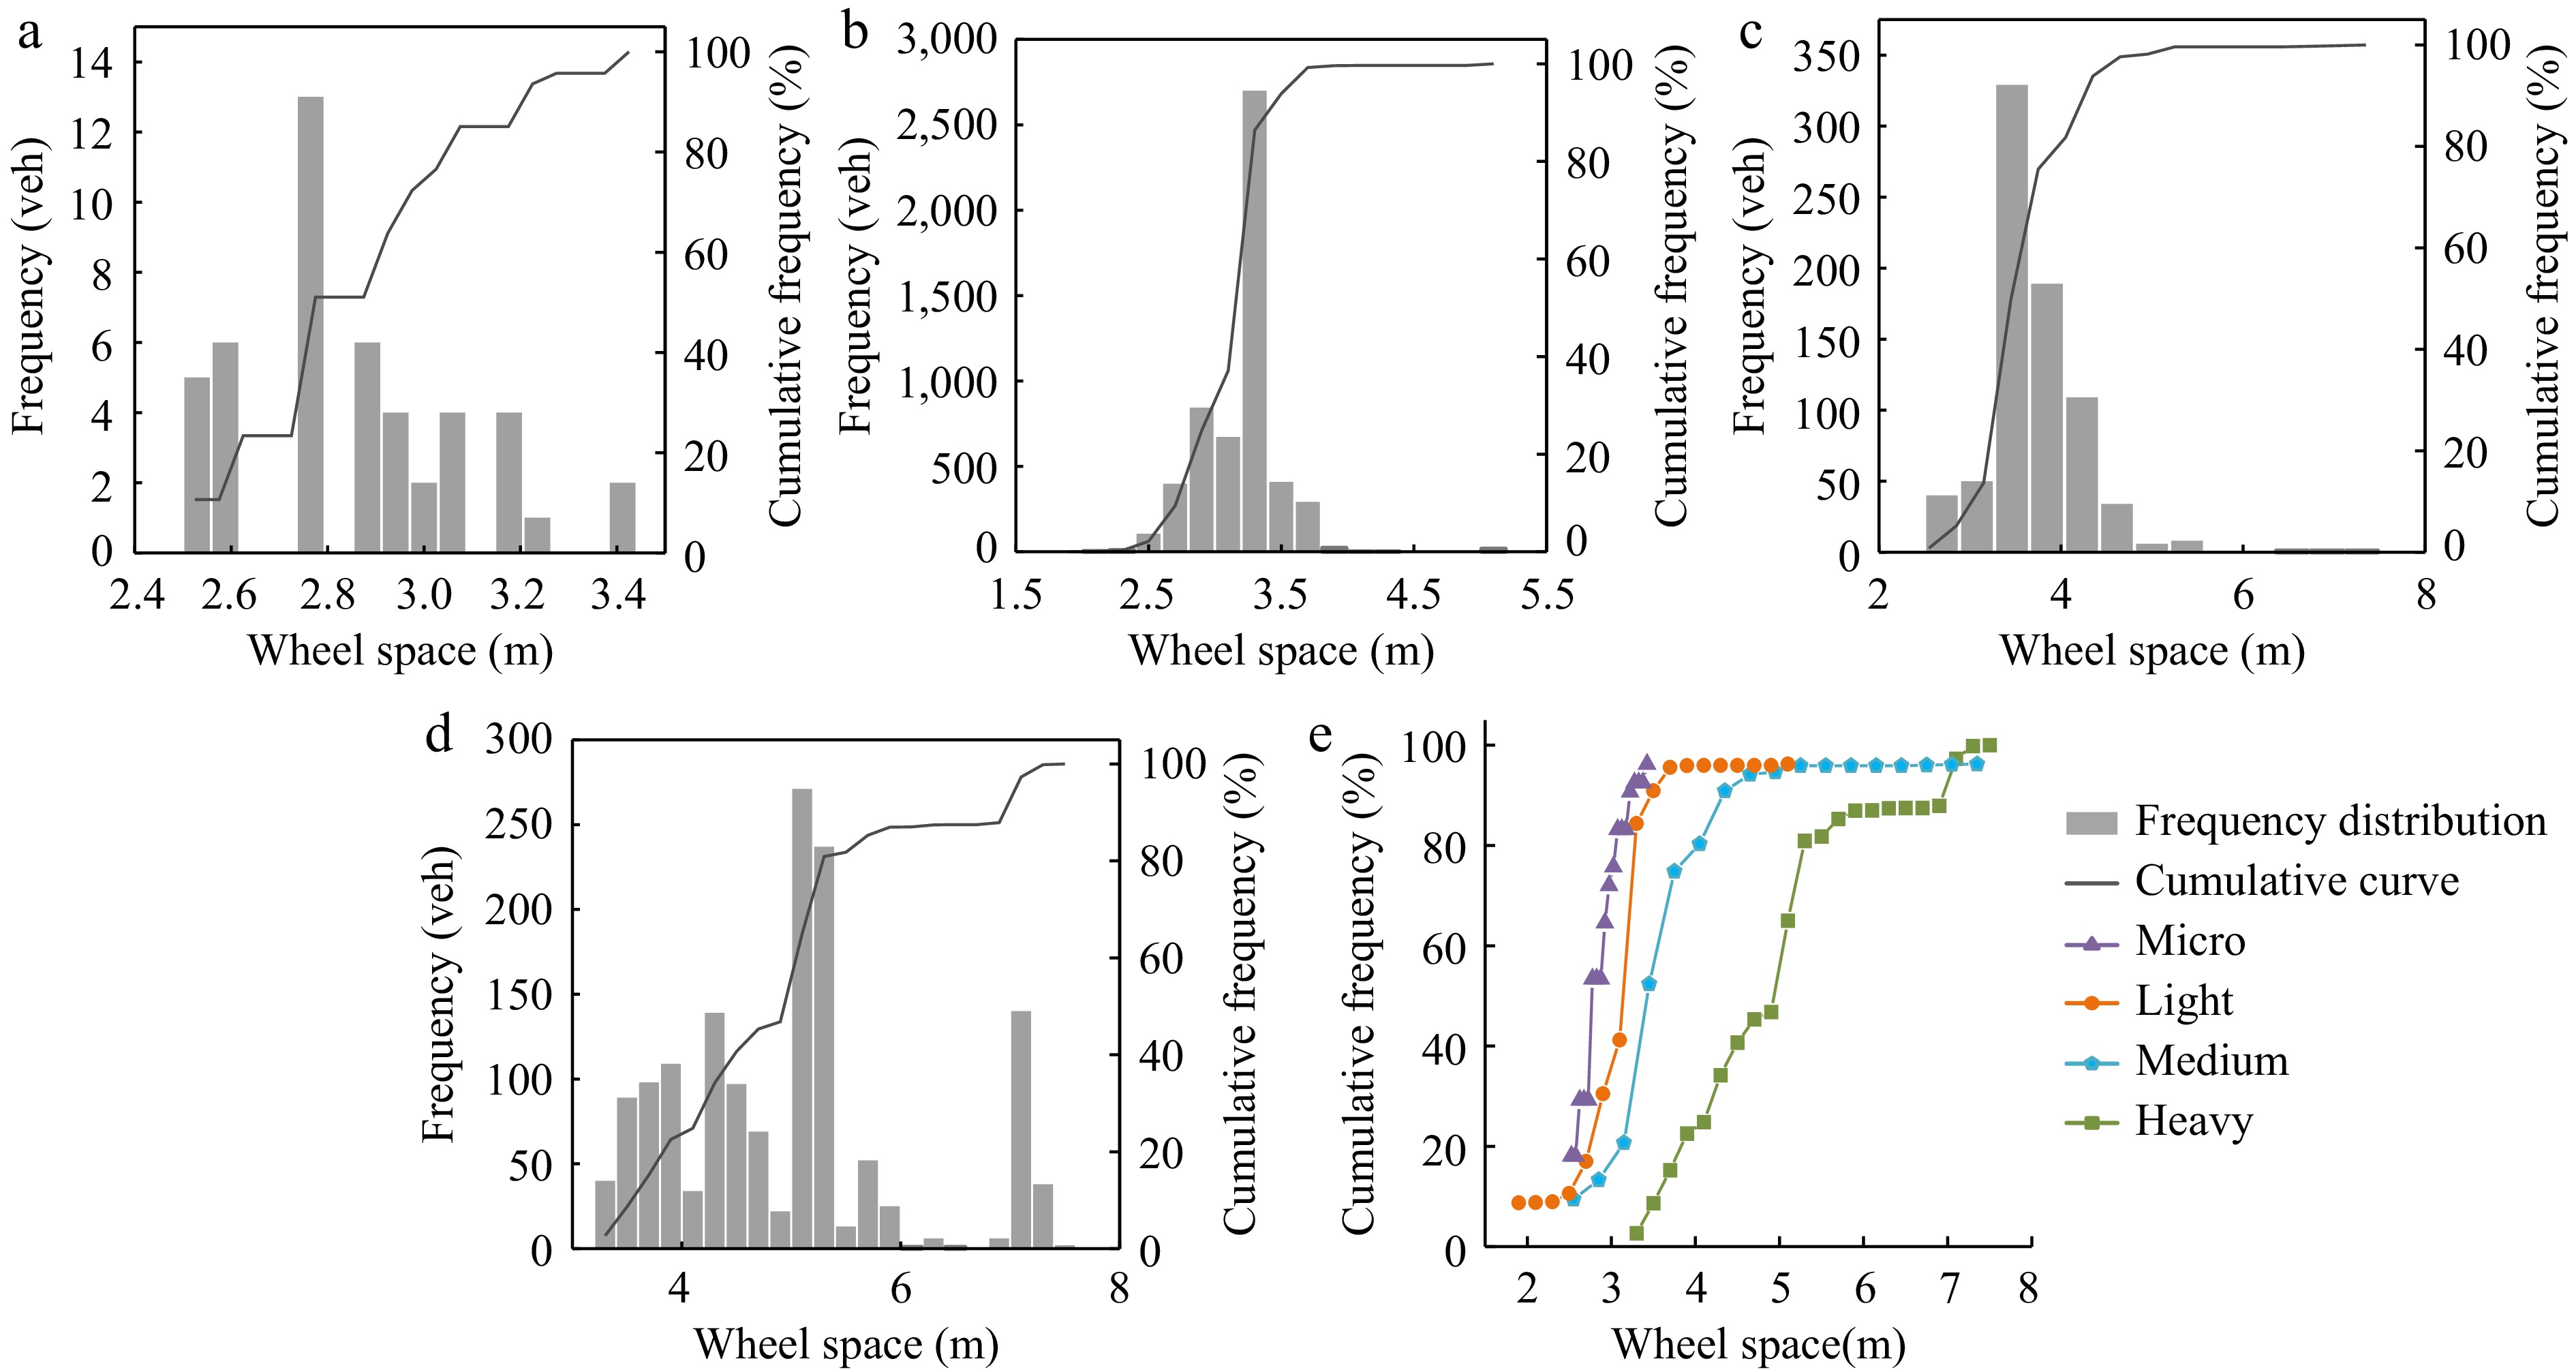
Figure 8.
Wheel space distribution of different vehicle bodies. (a) Micro. (b) Light. (c) Medium. (d) Heavy. (e) Cumulative frequency curve.
-
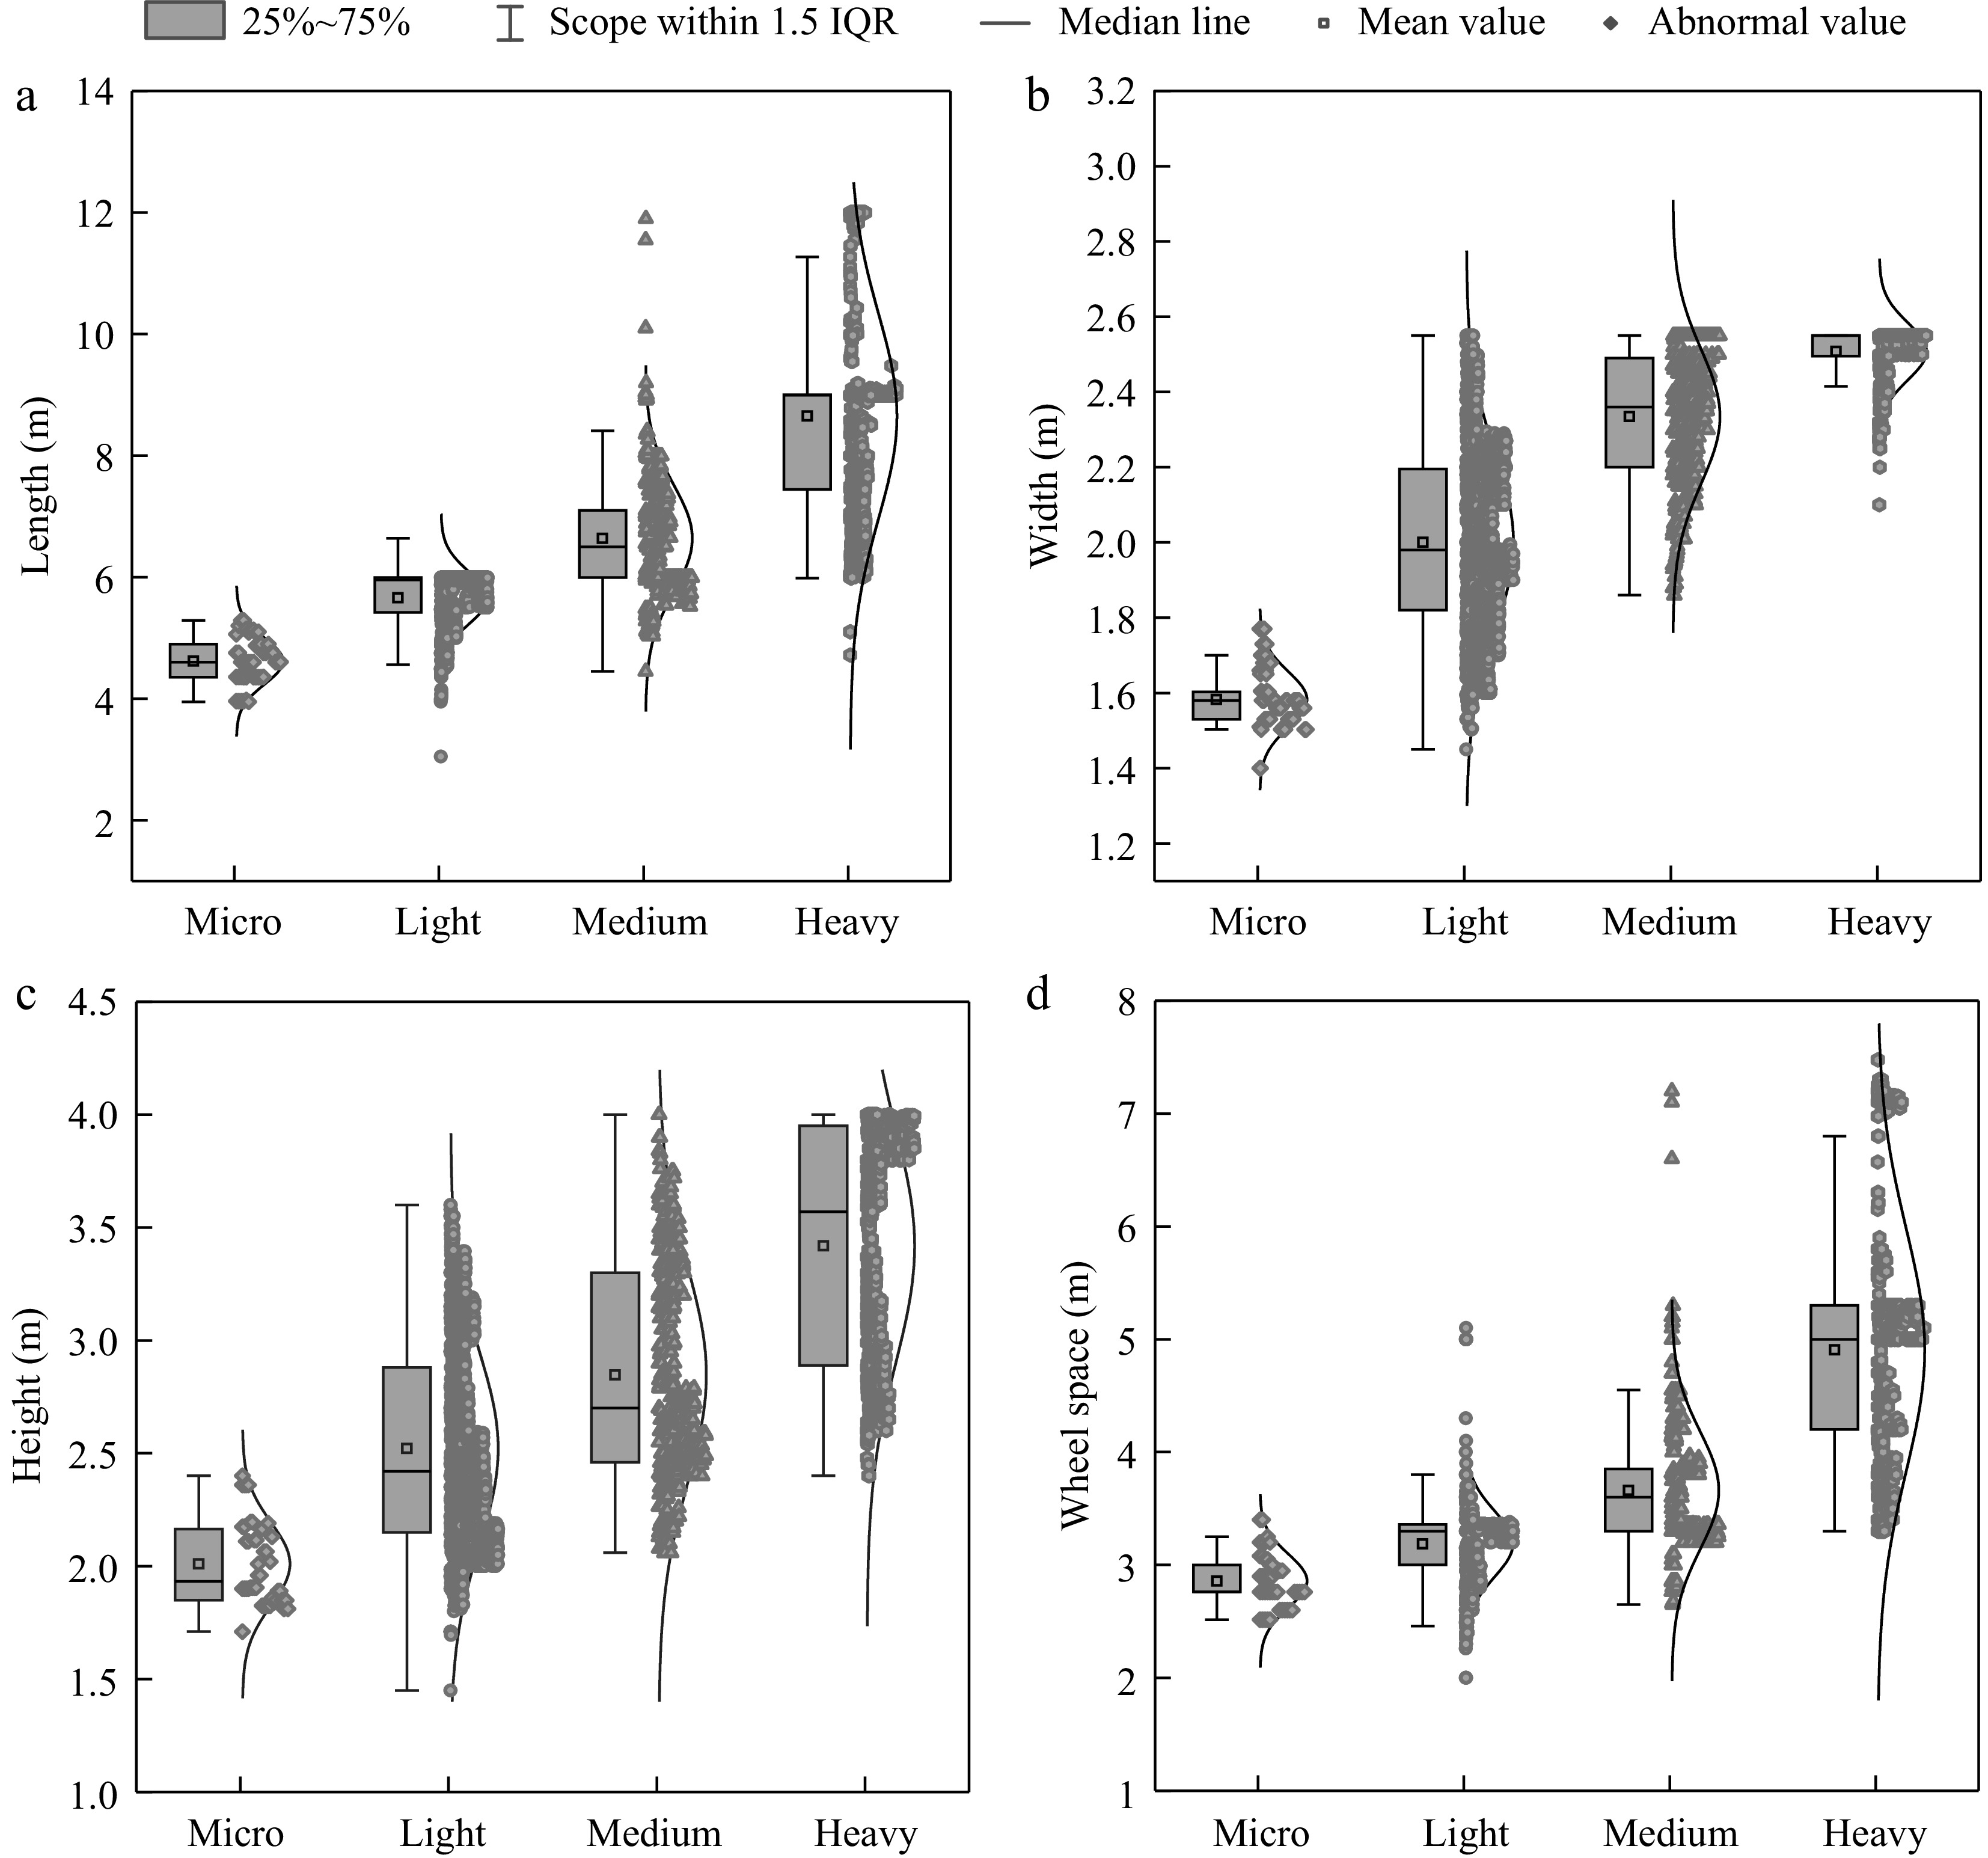
Figure 9.
Comparison of body dimensions of different vehicle types. (a) Length of different vehicle types. (b) Body width of different vehicle types. (c) Body height of different vehicle types. (d) Wheel space of different vehicle types.
-

Figure 10.
Schematic diagram of representative models of two-axle trucks. (a) Type-I. (b) Type-II.
-
Classification criteria Vehicle type Sample capacity Sampling quantity Data accuracy rate Bodywork length (m) Gross mass (t) − − > 12 Heavy truck 1507 151 100% ≥ 6 Or 4.5~12 Medium truck 770 77 100% 3.5~6 And 1.8~4.5 Light truck 5507 551 100% ≤ 3.5 And ≤ 1.8 Micro truck 47 5 100% Table 1.
Accuracy verification of random sampling data.
-
External dimensions 5th 15th 25th 50th 75th 85th 95th Mode Mean value Standard deviation Length (m) 4.873 5.285 5.52 5.995 6.0325 7.6 9 5.995 6.3296 1.4630 Width (m) 1.63 1.78 1.89 2.16 2.4 2.55 2.55 2.55 2.1291 0.2993 Height (m) 2 2.12 2.26 2.6 3.14 3.34 3.95 3.15 2.7242 0.5751 Wheel space (m) 2.7 2.86 3.12 3.36 3.6 4.2 5.3 3.36 3.5605 0.8702 Table 2.
Overall eigenvalue of size parameter.
-
Correlation
coefficient rangeCorrelation degree Correlation direction 0.8 < r < 1 Extremely strong Positive 0.6 < r < 0.8 Strong Positive 0.4 < r < 0.6 Moderate Positive 0.2 < r < 0.4 Weak Positive 0 < r < 0.2 Extremely weak or irrelevant Positive 0 Irrelevant None −0.2 < r < 0 Extremely weak or irrelevant Negative −0.4 < r < −0.2 Weak Negative −0.6 < r < −0.4 Moderate Negative −0.8 < r < −0.6 Strong Negative −1.0 < r < −0.8 Extremely strong Negative Table 3.
Correlation degree and direction of Pearson coefficient.
-
External dimensions Vehicle types 50th 85th 95th 99th Mode Mean value Standard deviation Max value Length Micro 4.6 5.09 5.2 5.288 4.6 4.620 0.3812 5.288 Light 5.995 5.995 5.995 5.995 5.95 5.659 0.4248 5.999 (6) Medium 6.5 7.55 7.995 8.999 6.5 6.636 0.8734 11.9 Heavy 8.995 10.04 12 12 8.995 8.650 1.6858 12 Width Micro 1.58 1.68 1.73 1.77 1.58 1.583 0.0744 1.77 Light 1.98 2.22 2.4 2.55 1.98 2.000 0.2381 2.55 Medium 2.36 2.55 2.55 2.55 2.36 2.334 0.1783 2.55 Heavy 2.55 2.55 2.55 2.55 2.55 2.508 0.0752 2.55 Height Micro 1.9325 2.195 2.36 2.4 1.9325 2.010 0.1828 2.4 Light 2.42 3.1 3.3 3.4 2.42 2.521 0.4292 3.6 Medium 2.7 3.45 3.65 3.84 2.7 2.847 0.4779 4 Heavy 3.57 3.99 4 4 3.57 3.418 0.5173 4 Wheel space Micro 2.76 3.08 3.25 3.4 2.76 2.859 0.2368 3.4 Light 3.3 3.365 3.6 3.7 3.3 3.187 0.2940 5.1 Medium 3.55 4.2 4.5 5.2 3.55 3.659 0.5188 7.2 Heavy 5 5.7 7.15 7.3 5 4.905 1.0746 7.475 The values in brackets ( ) are recommended values after rounding. Table 4.
Characteristic values of external dimensions of two-axle freight vehicles of different types.
-
Type Name Design standard Original specification value Technical Standards of Highway Engineering 12 m × 2.5 m × 4 m Design Specification for Highway Alignment Recommended values for representative models Type-I 6 m × 2.55 m × 3.6 m Type-II 12 m × 2.55 m × 4 m Table 5.
Comparison table of standard values and recommended values.
-
Category Vehicle types Clustering center 95th value Recommended value of design vehicle type Length Width Height Length Width Height Length Width Height 1 Micro 5.375 1.831 2.233 5.995 2.095 2.7 6 2.1 2.7 2 Type-I 6.191 2.253 2.866 7.4 2.55 3.45 7.5 2.55 3.5 3 Type-II 9.425 2.538 3.613 12 2.55 4 12 2.55 4 Table 6.
Body dimension clustering results and eigenvalue.
Figures
(10)
Tables
(6)