-
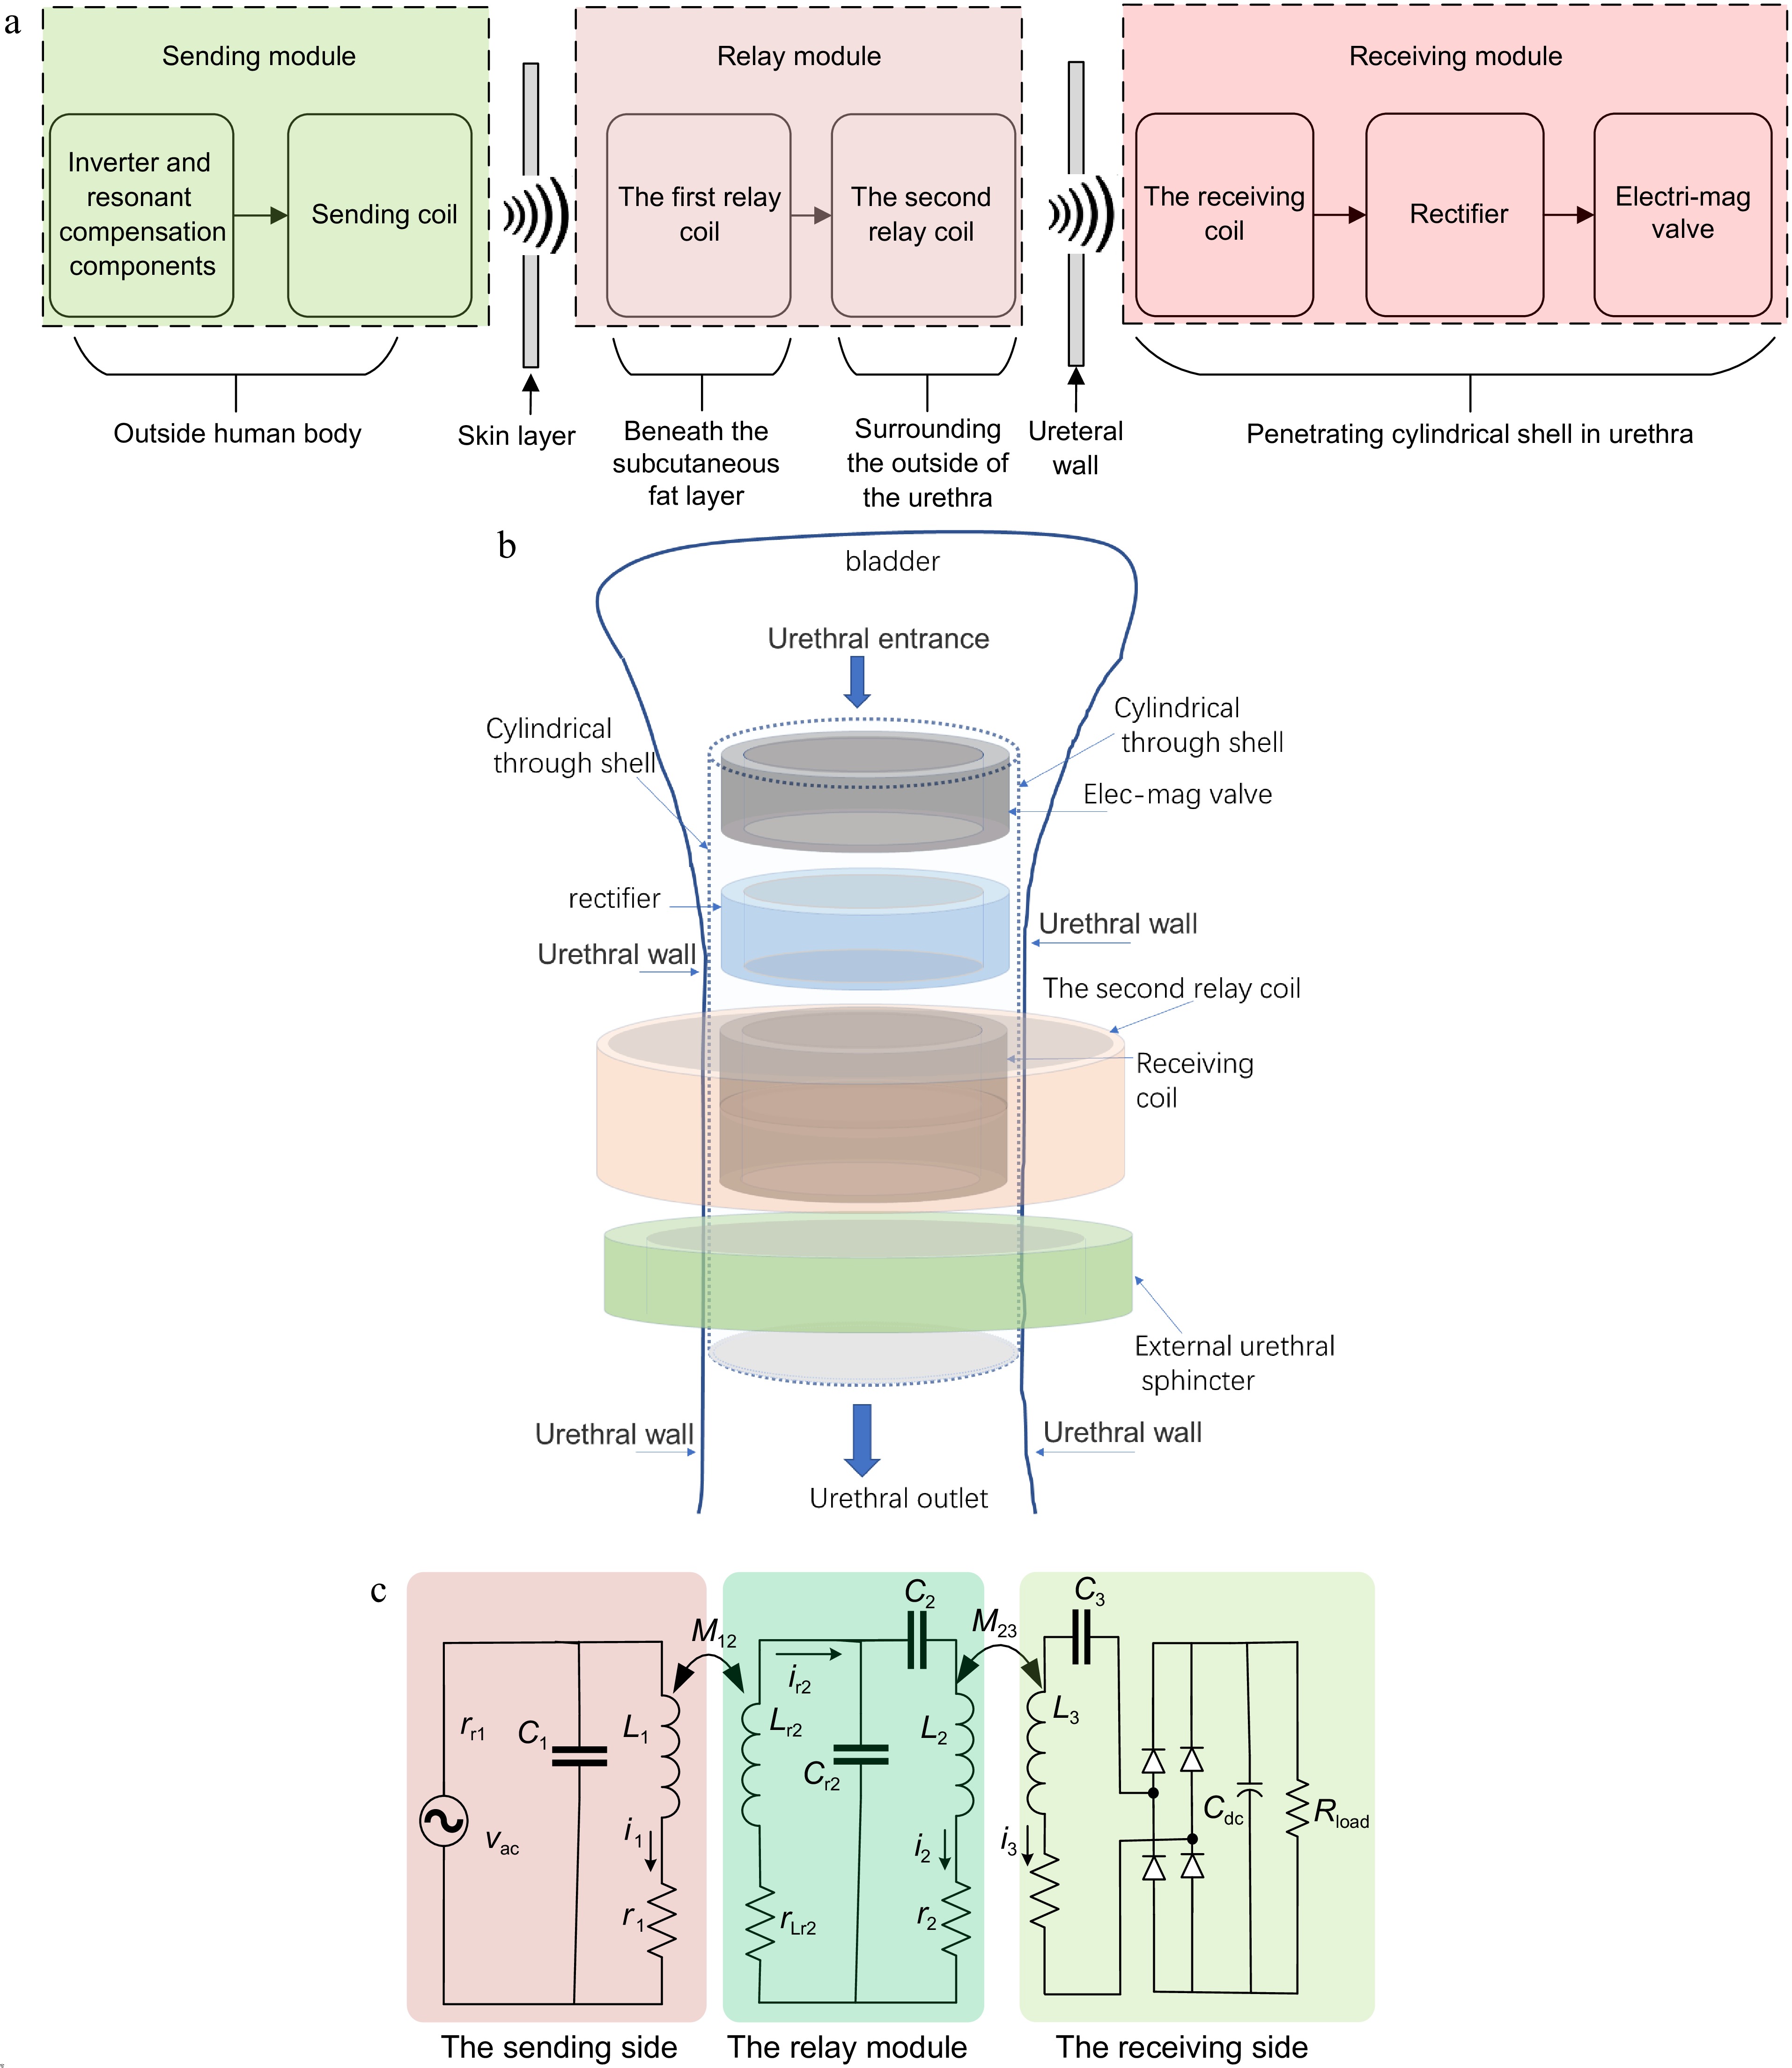
Figure 1.
Schematic diagram of the proposed system based on P-LCC-S topologic WPT. (a) Installation schematic of the whole system. (b) Installation schematic of the receiving module. (c) Circuit topology.
-
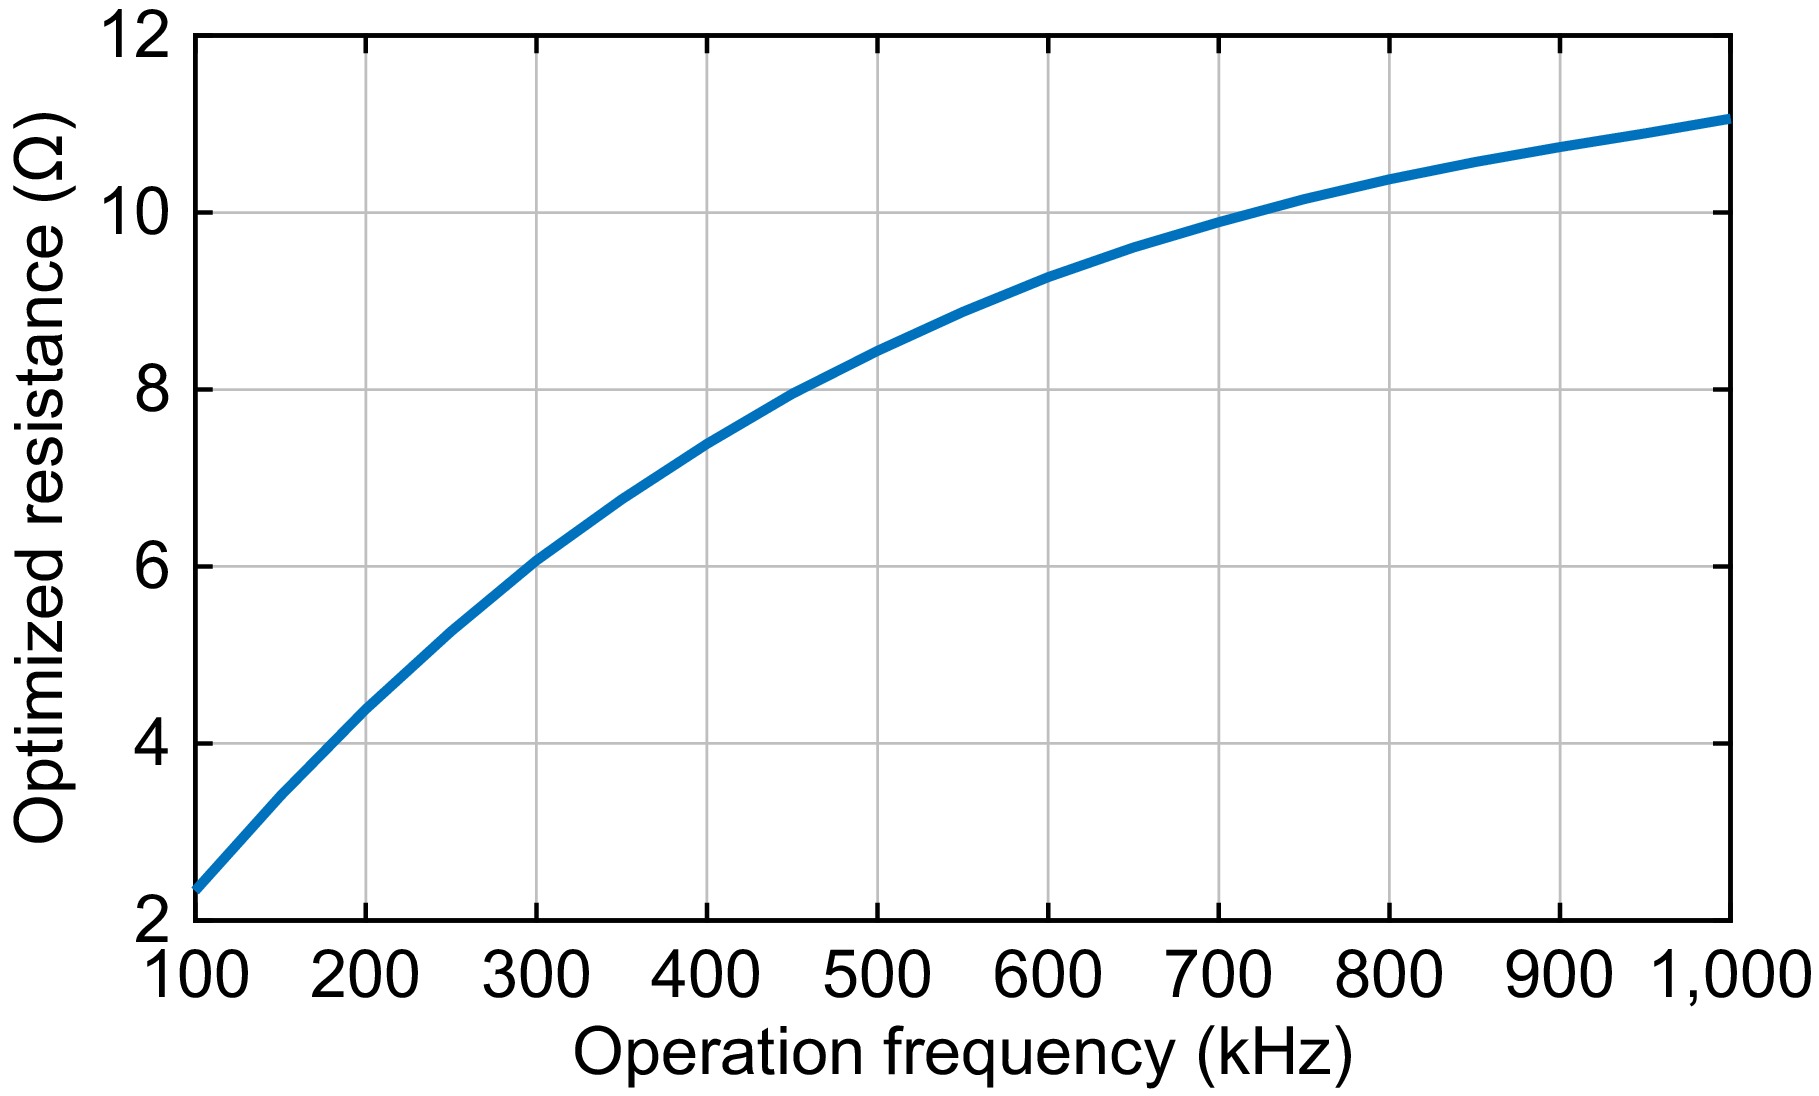
Figure 2.
Optimized rectifier input resistance vs. operation frequency without considering the rectifier loss.
-
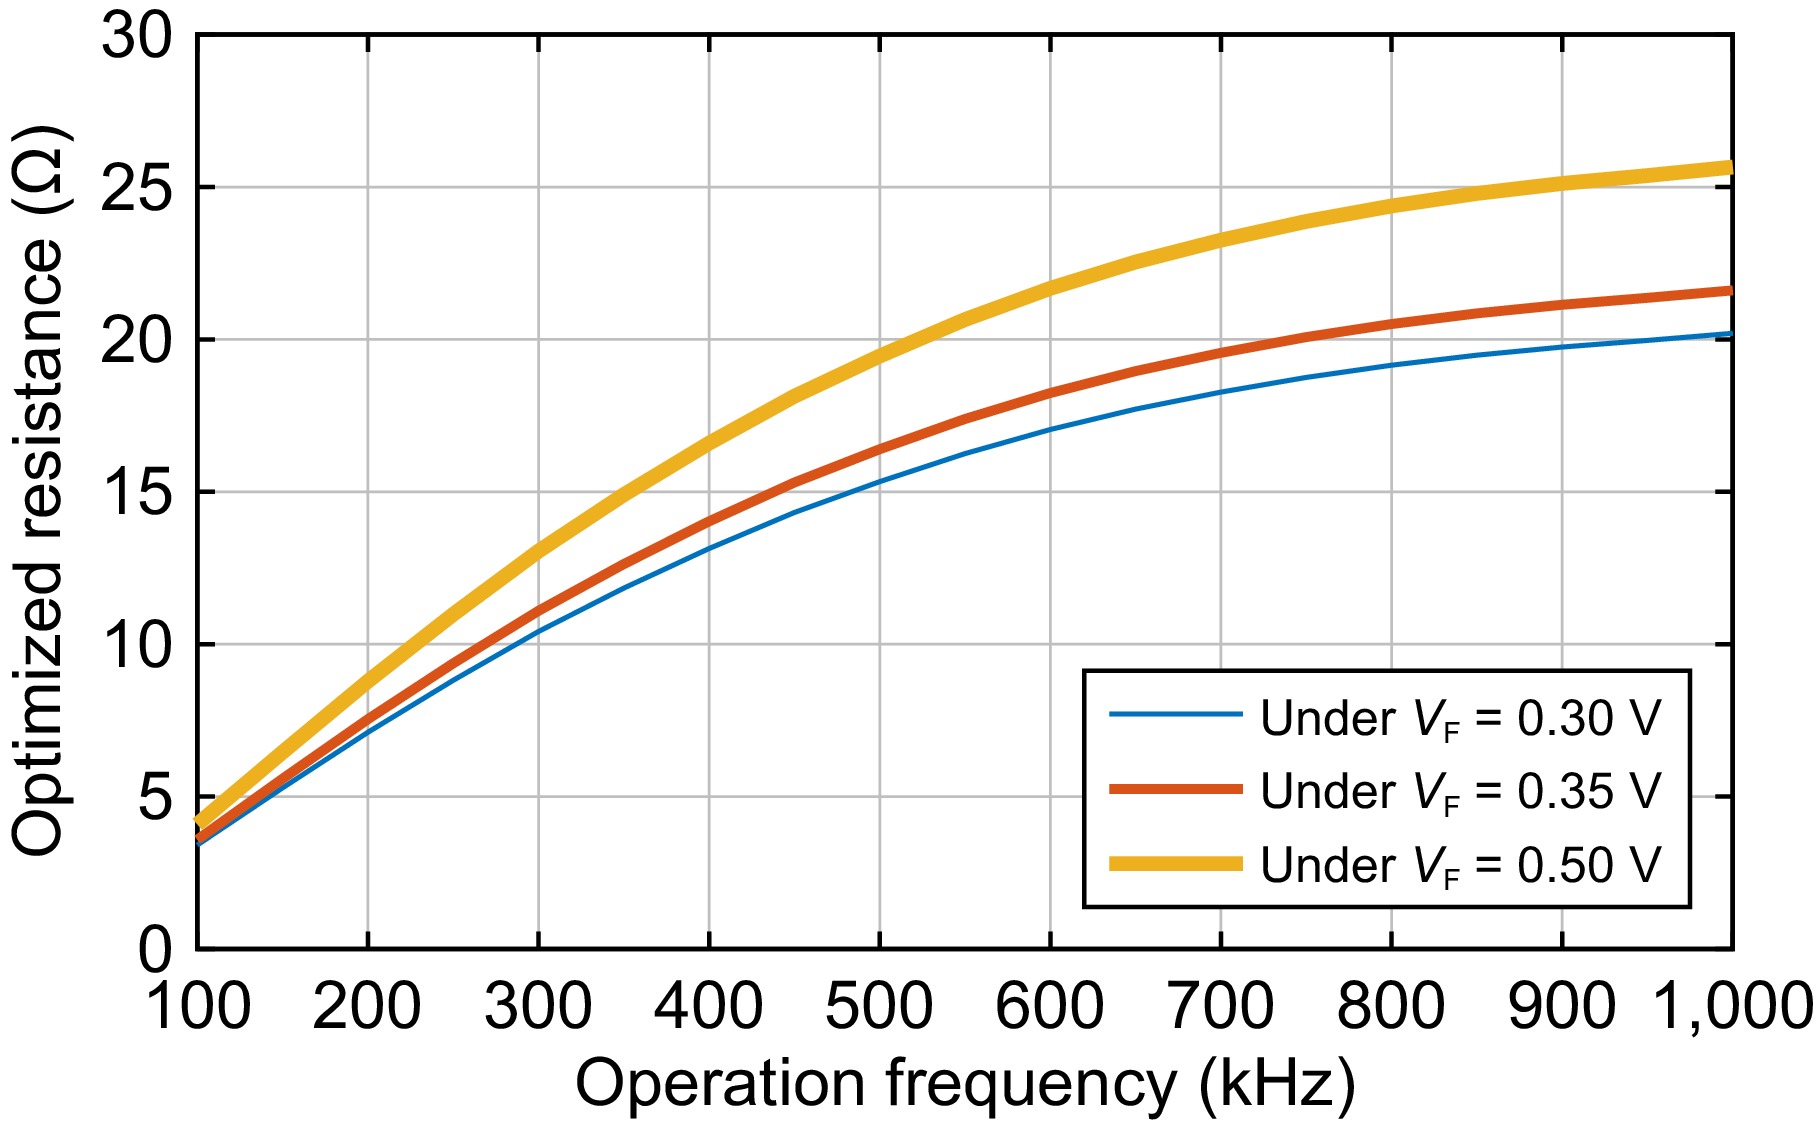
Figure 3.
Optimized rectifier resistance vs. operation frequency considering the rectifier loss.
-
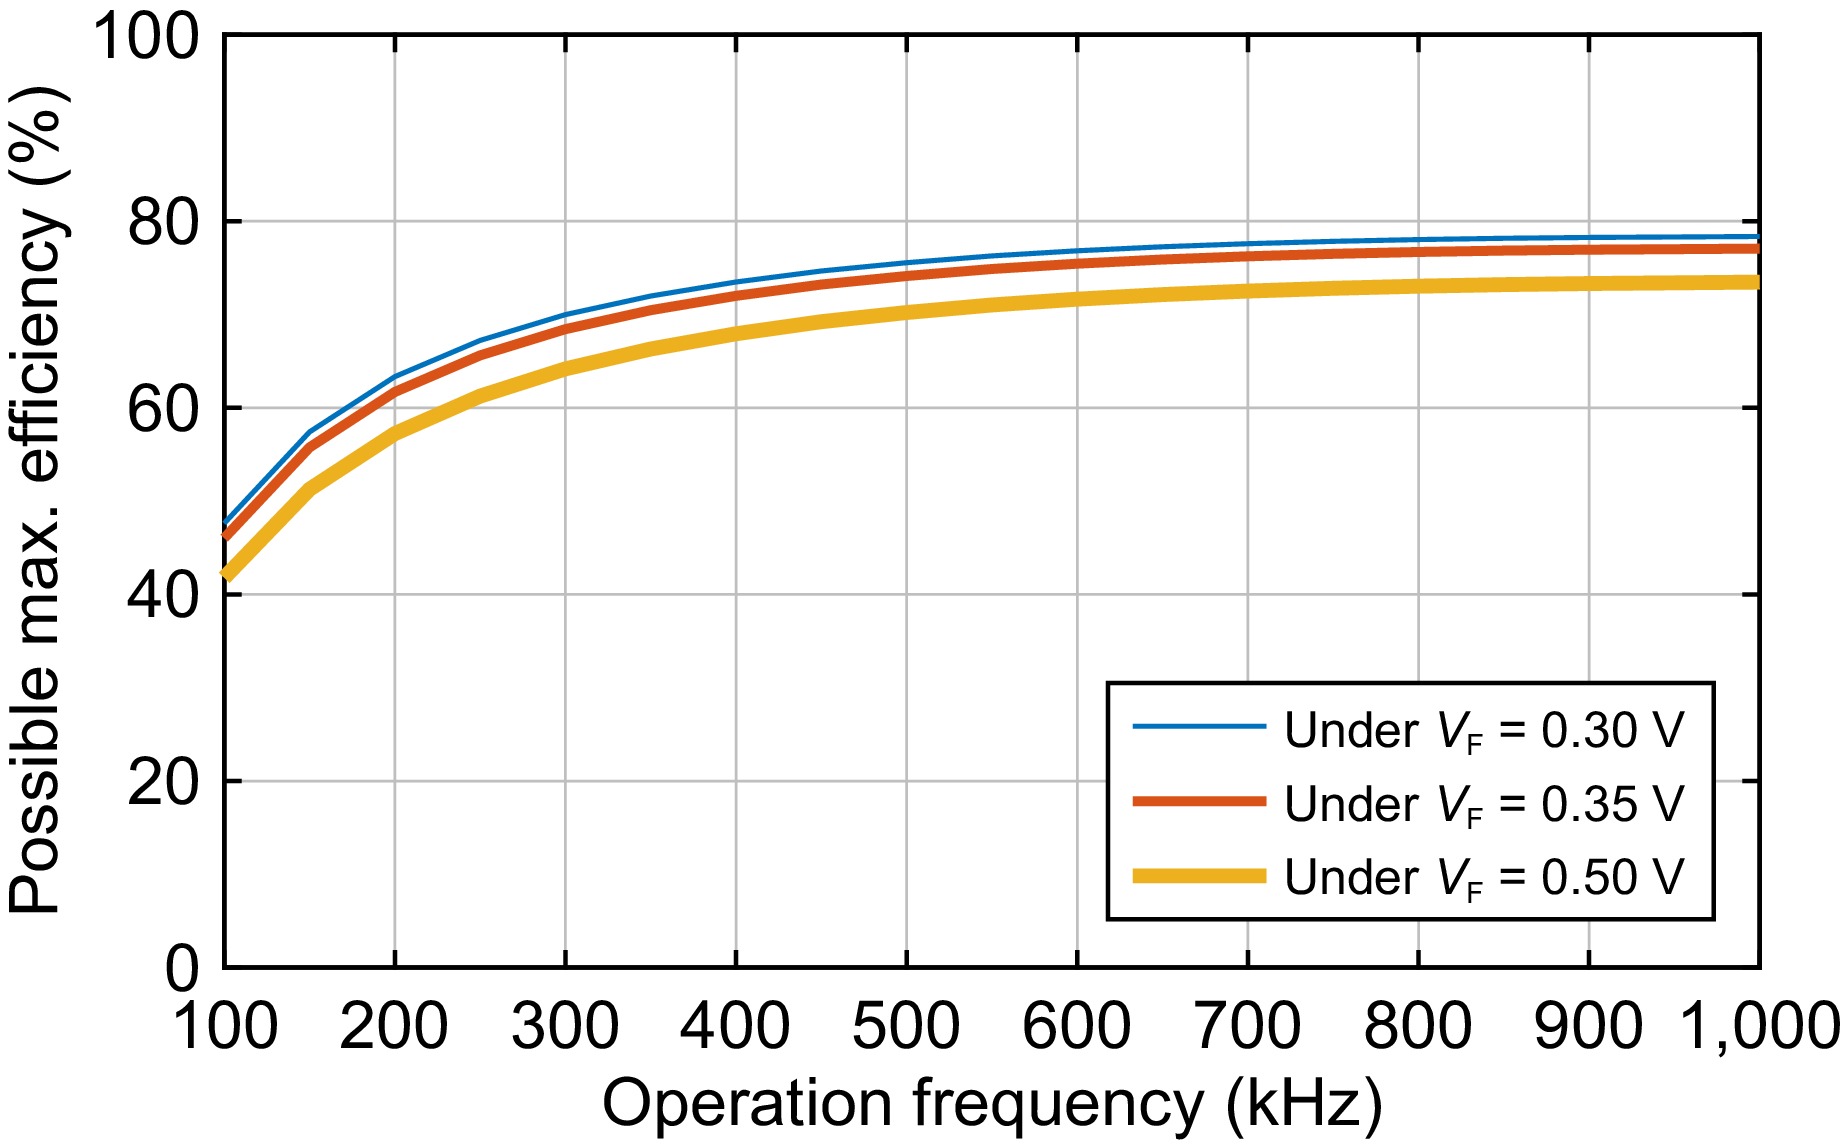
Figure 4.
Possible maximum efficiency vs. operation frequency.
-
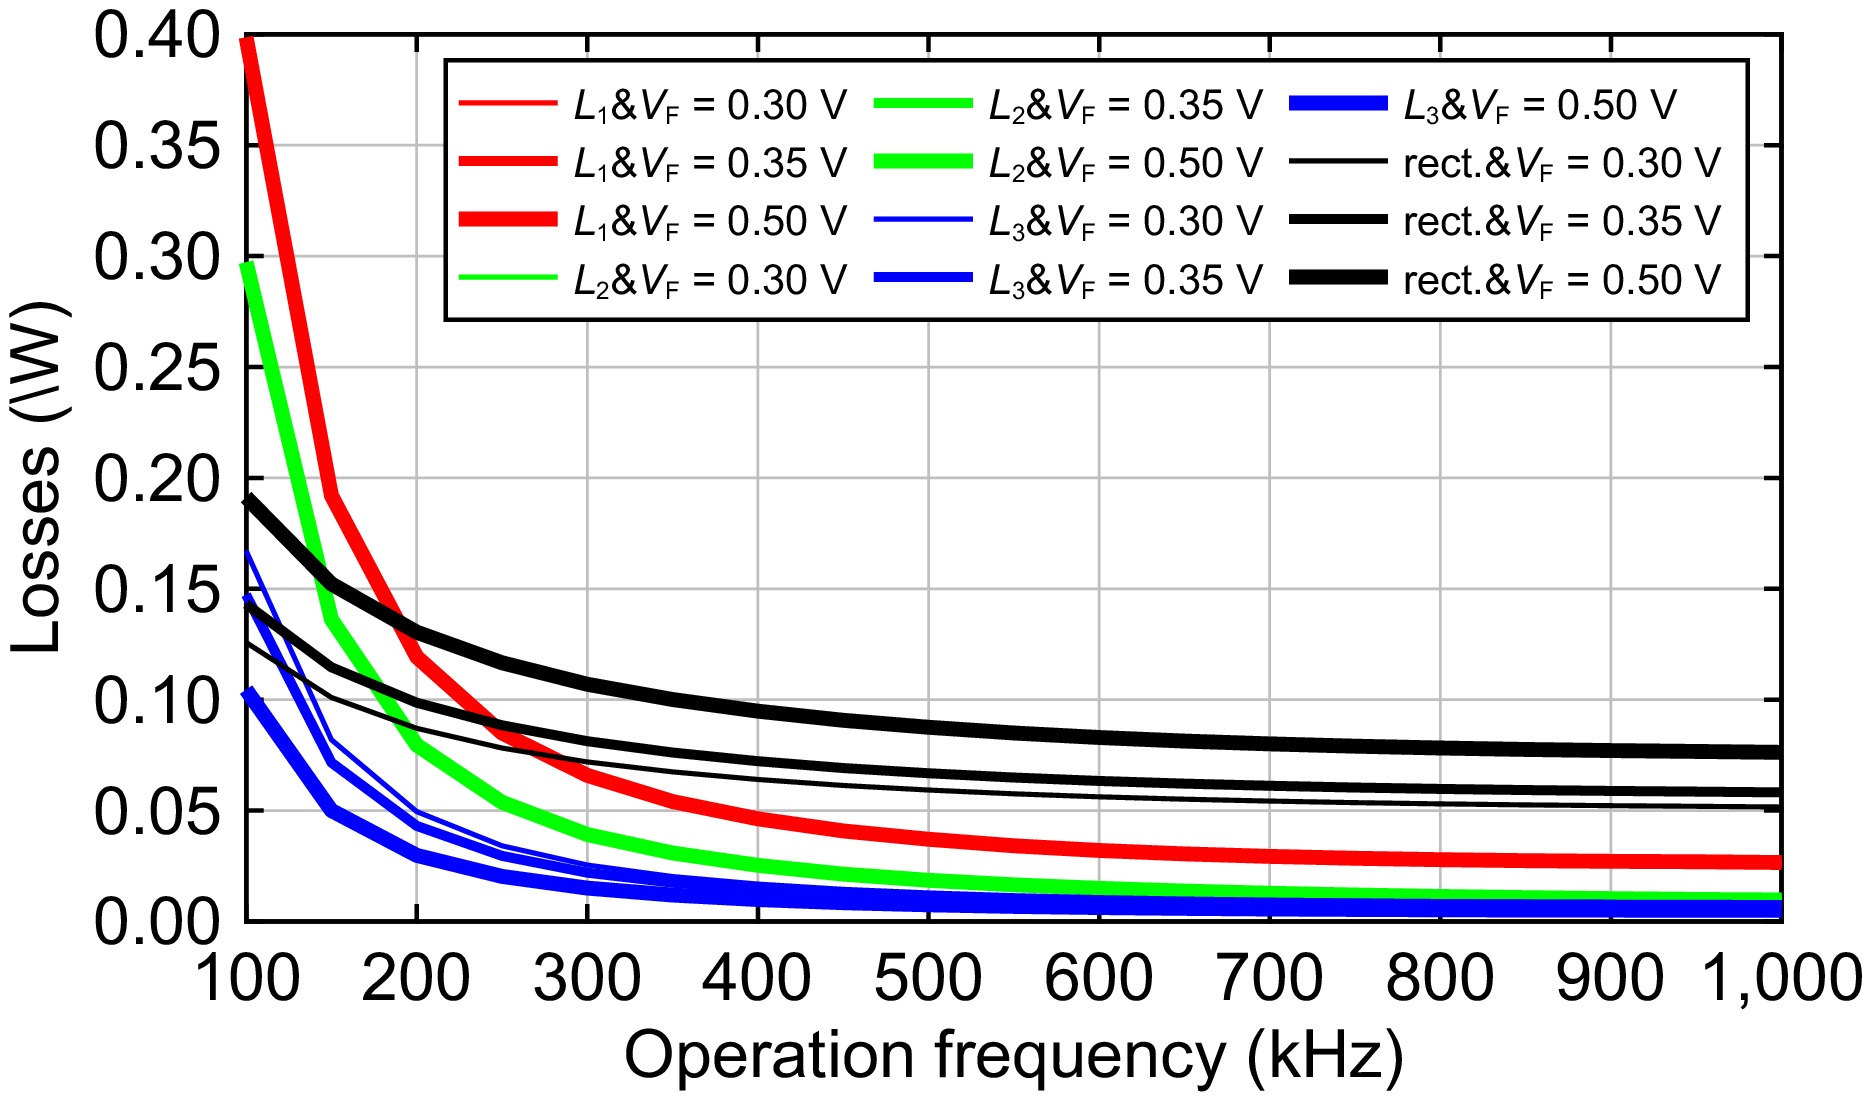
Figure 5.
Losses in main passive components vs. operation frequency.
-
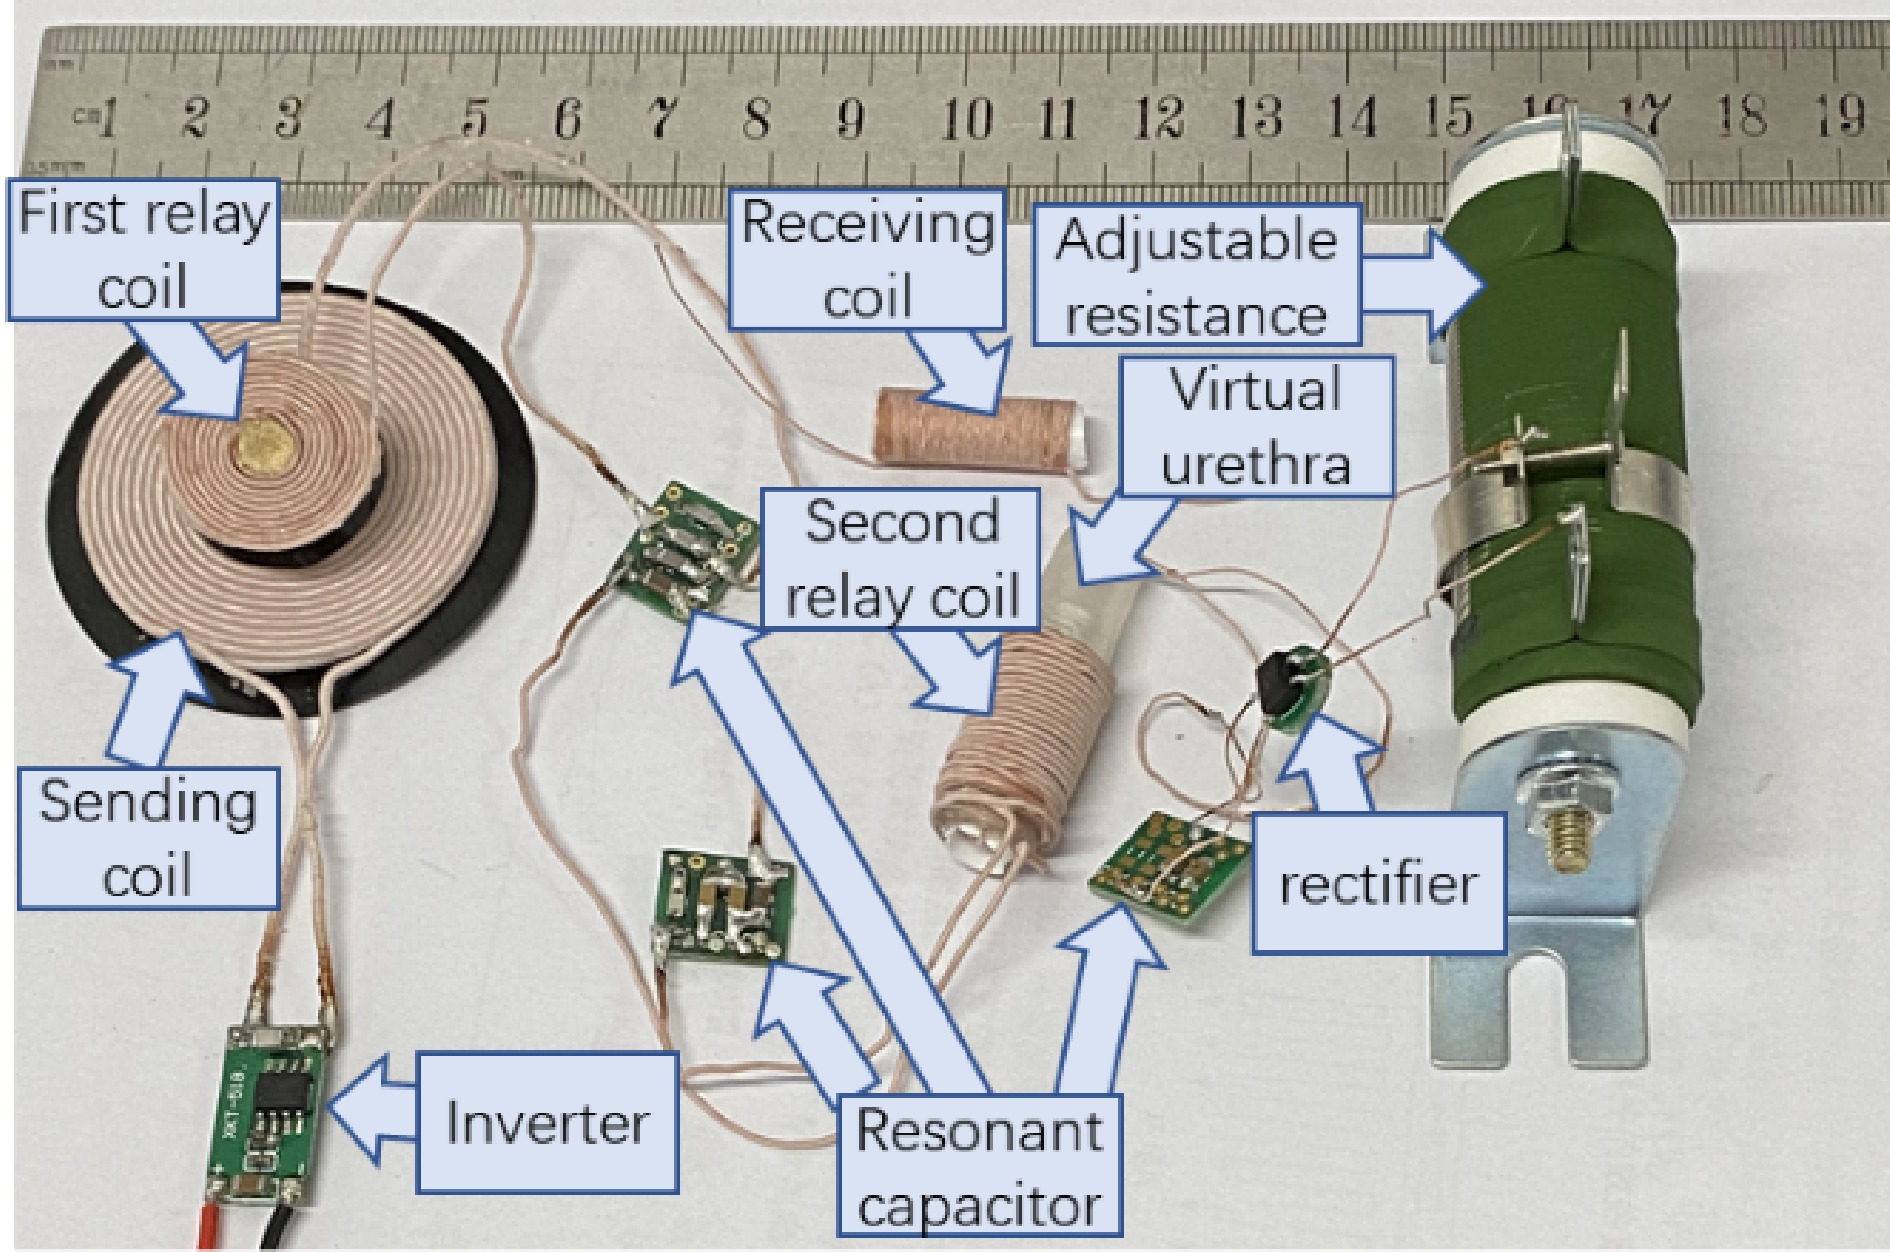
Figure 6.
WPT prototype for optimization experiments.
-

Figure 7.
Experimental waveforms under 600 kHz operation frequency and 27 Ω load resistance. (a) Experimental waveforms, (b) measured output voltage, current, and power.
-
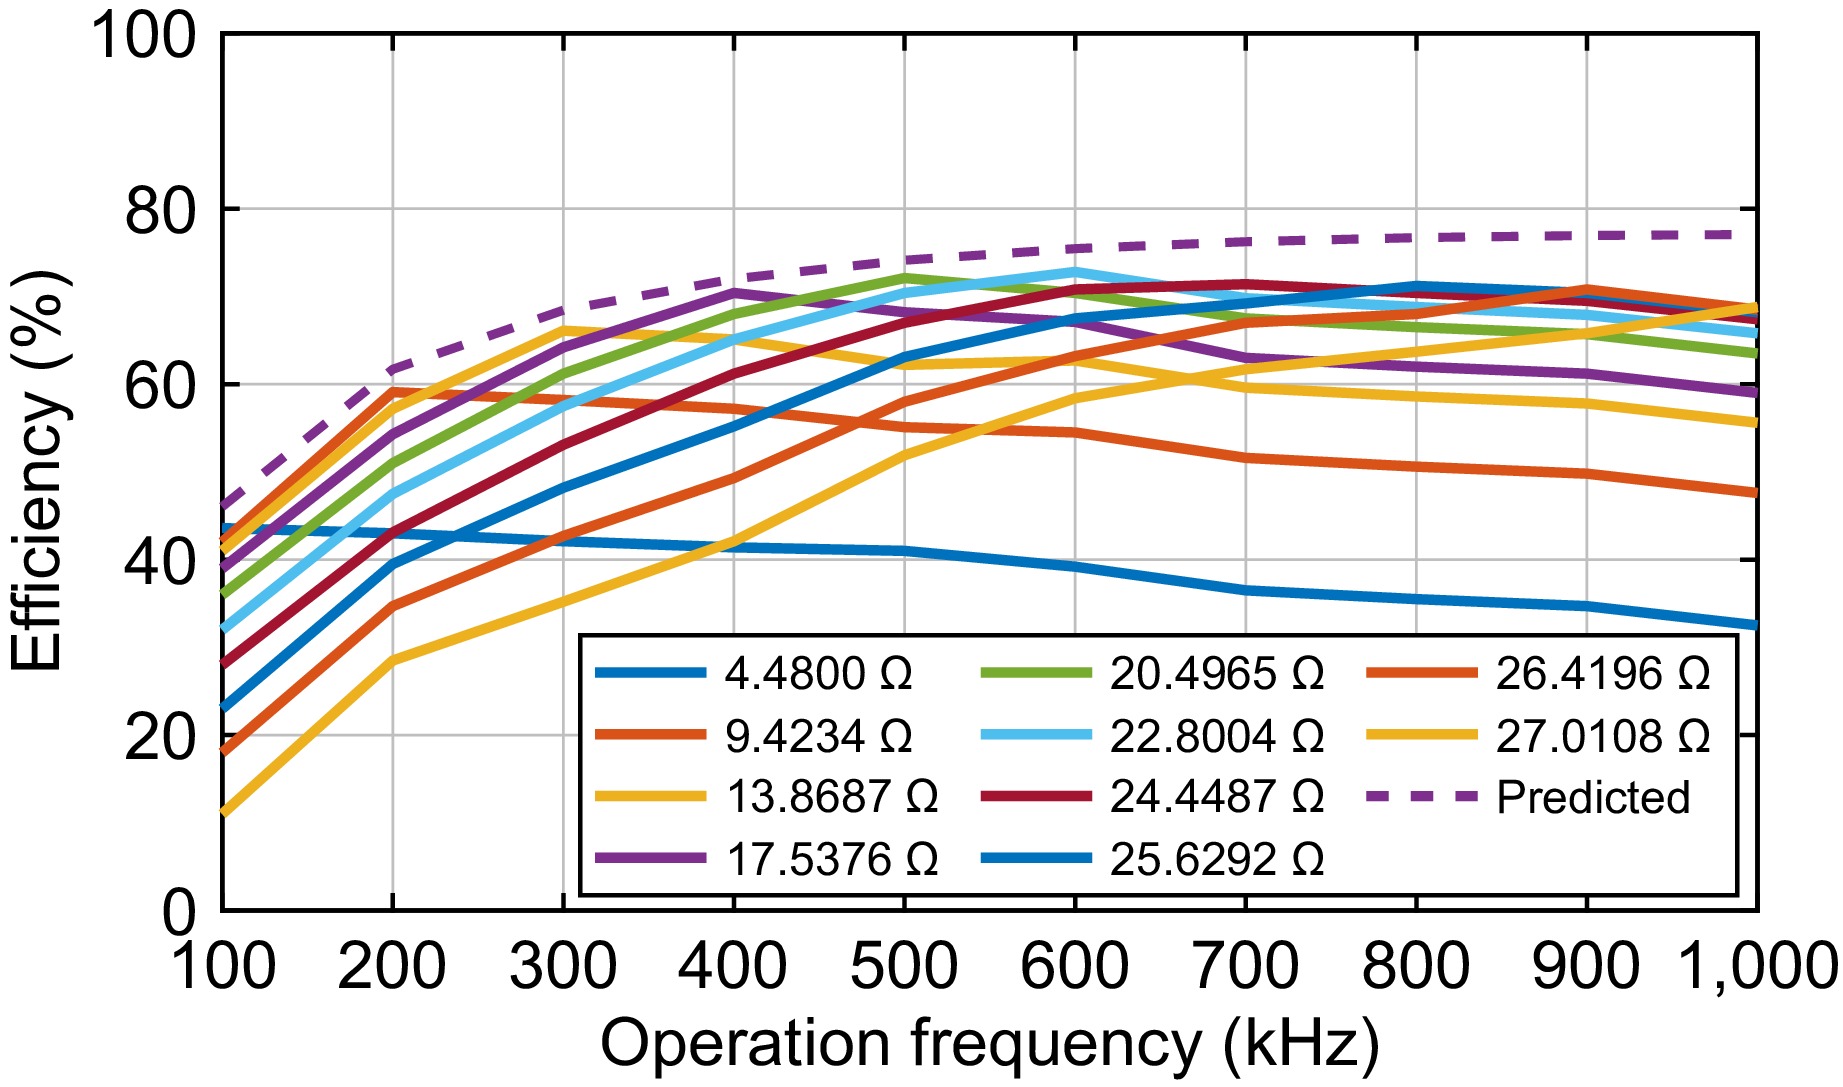
Figure 8.
Measured efficiency vs. operation frequency.
-
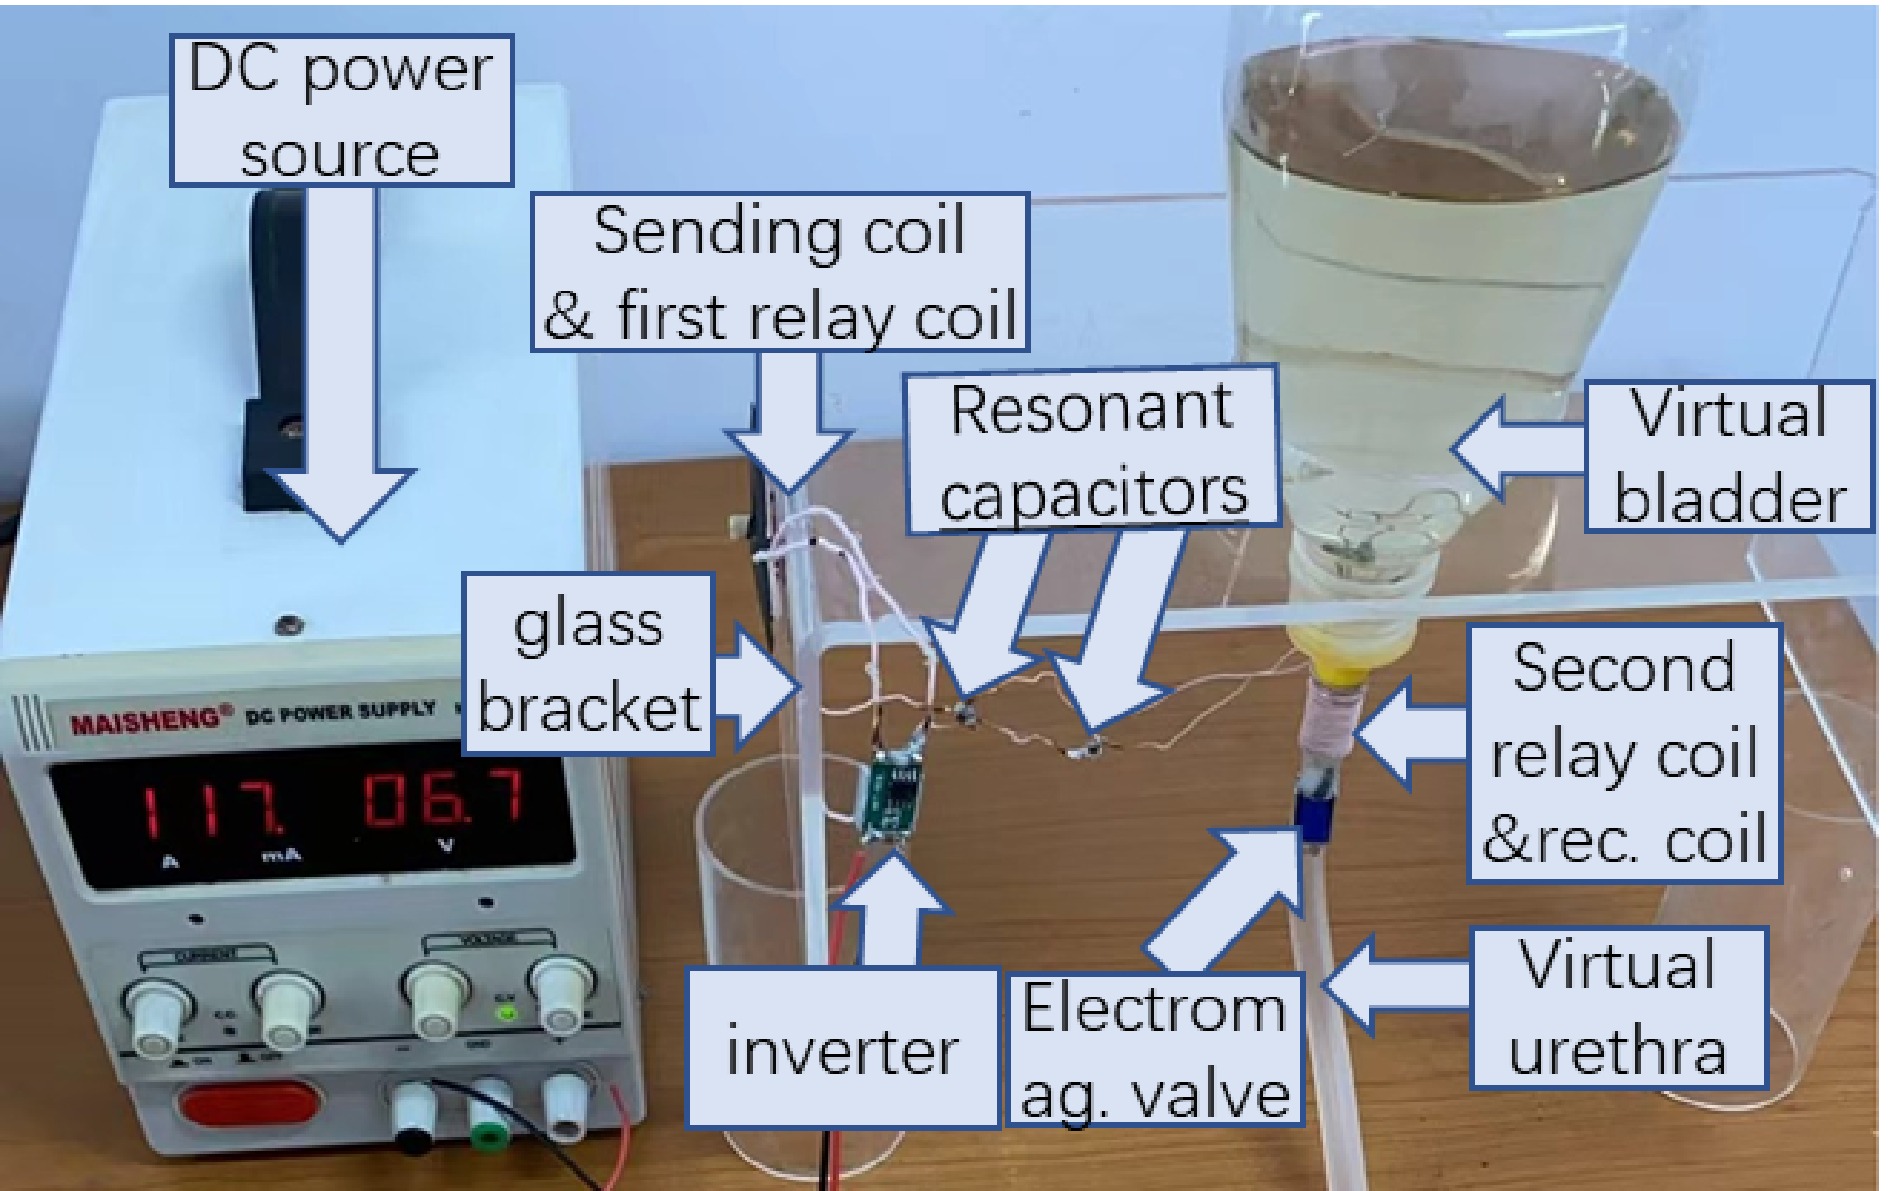
Figure 9.
WPT prototype for artificial catheterization.
-
Freq. (kHz) rLr1 (mΩ) r1 (mΩ) rLr2 (mΩ) r2 (mΩ) r3 (mΩ) r3_plus (mΩ) 100 32.8 60 95.0 169.9 600.1 1.6934 150 38.6 70.7 98.5 177.3 602.1 2.1351 200 45.2 85.3 102.6 187.0 604.4 2.4960 250 52.8 102.8 107.8 201.8 607.6 2.7947 300 61.1 122.9 113.8 216.0 611.1 3.0505 350 70.4 145.6 121.0 237.4 613.3 3.2623 400 80.8 171.1 129.1 260.0 617.8 3.4444 450 92.4 199.3 135.9 283.2 622.5 3.6024 500 103.4 232.1 145.3 310.2 627.8 3.7322 550 119.3 266.6 156.7 340.2 633.1 3.8463 600 136.9 306.1 167.9 372.6 640.9 3.9411 650 157.3 350.4 180.2 407.6 648.1 4.0193 700 180.2 399.9 193.4 445.9 655.5 4.0830 750 208.1 454.2 207.8 486.4 664.3 4.1365 800 239.4 513.8 222.8 530.1 673.1 4.1801 850 273.4 579.2 238.2 576.9 682.2 4.2150 900 311.3 650.7 255.2 627.2 691.9 4.2424 950 351.5 728.8 273.0 680.4 702.9 4.2637 1 M 394.5 804.5 291.4 745.0 714.6 4.2866 Table 1.
Parasitic resistance of inductance under various frequencies.
Figures
(9)
Tables
(1)