-
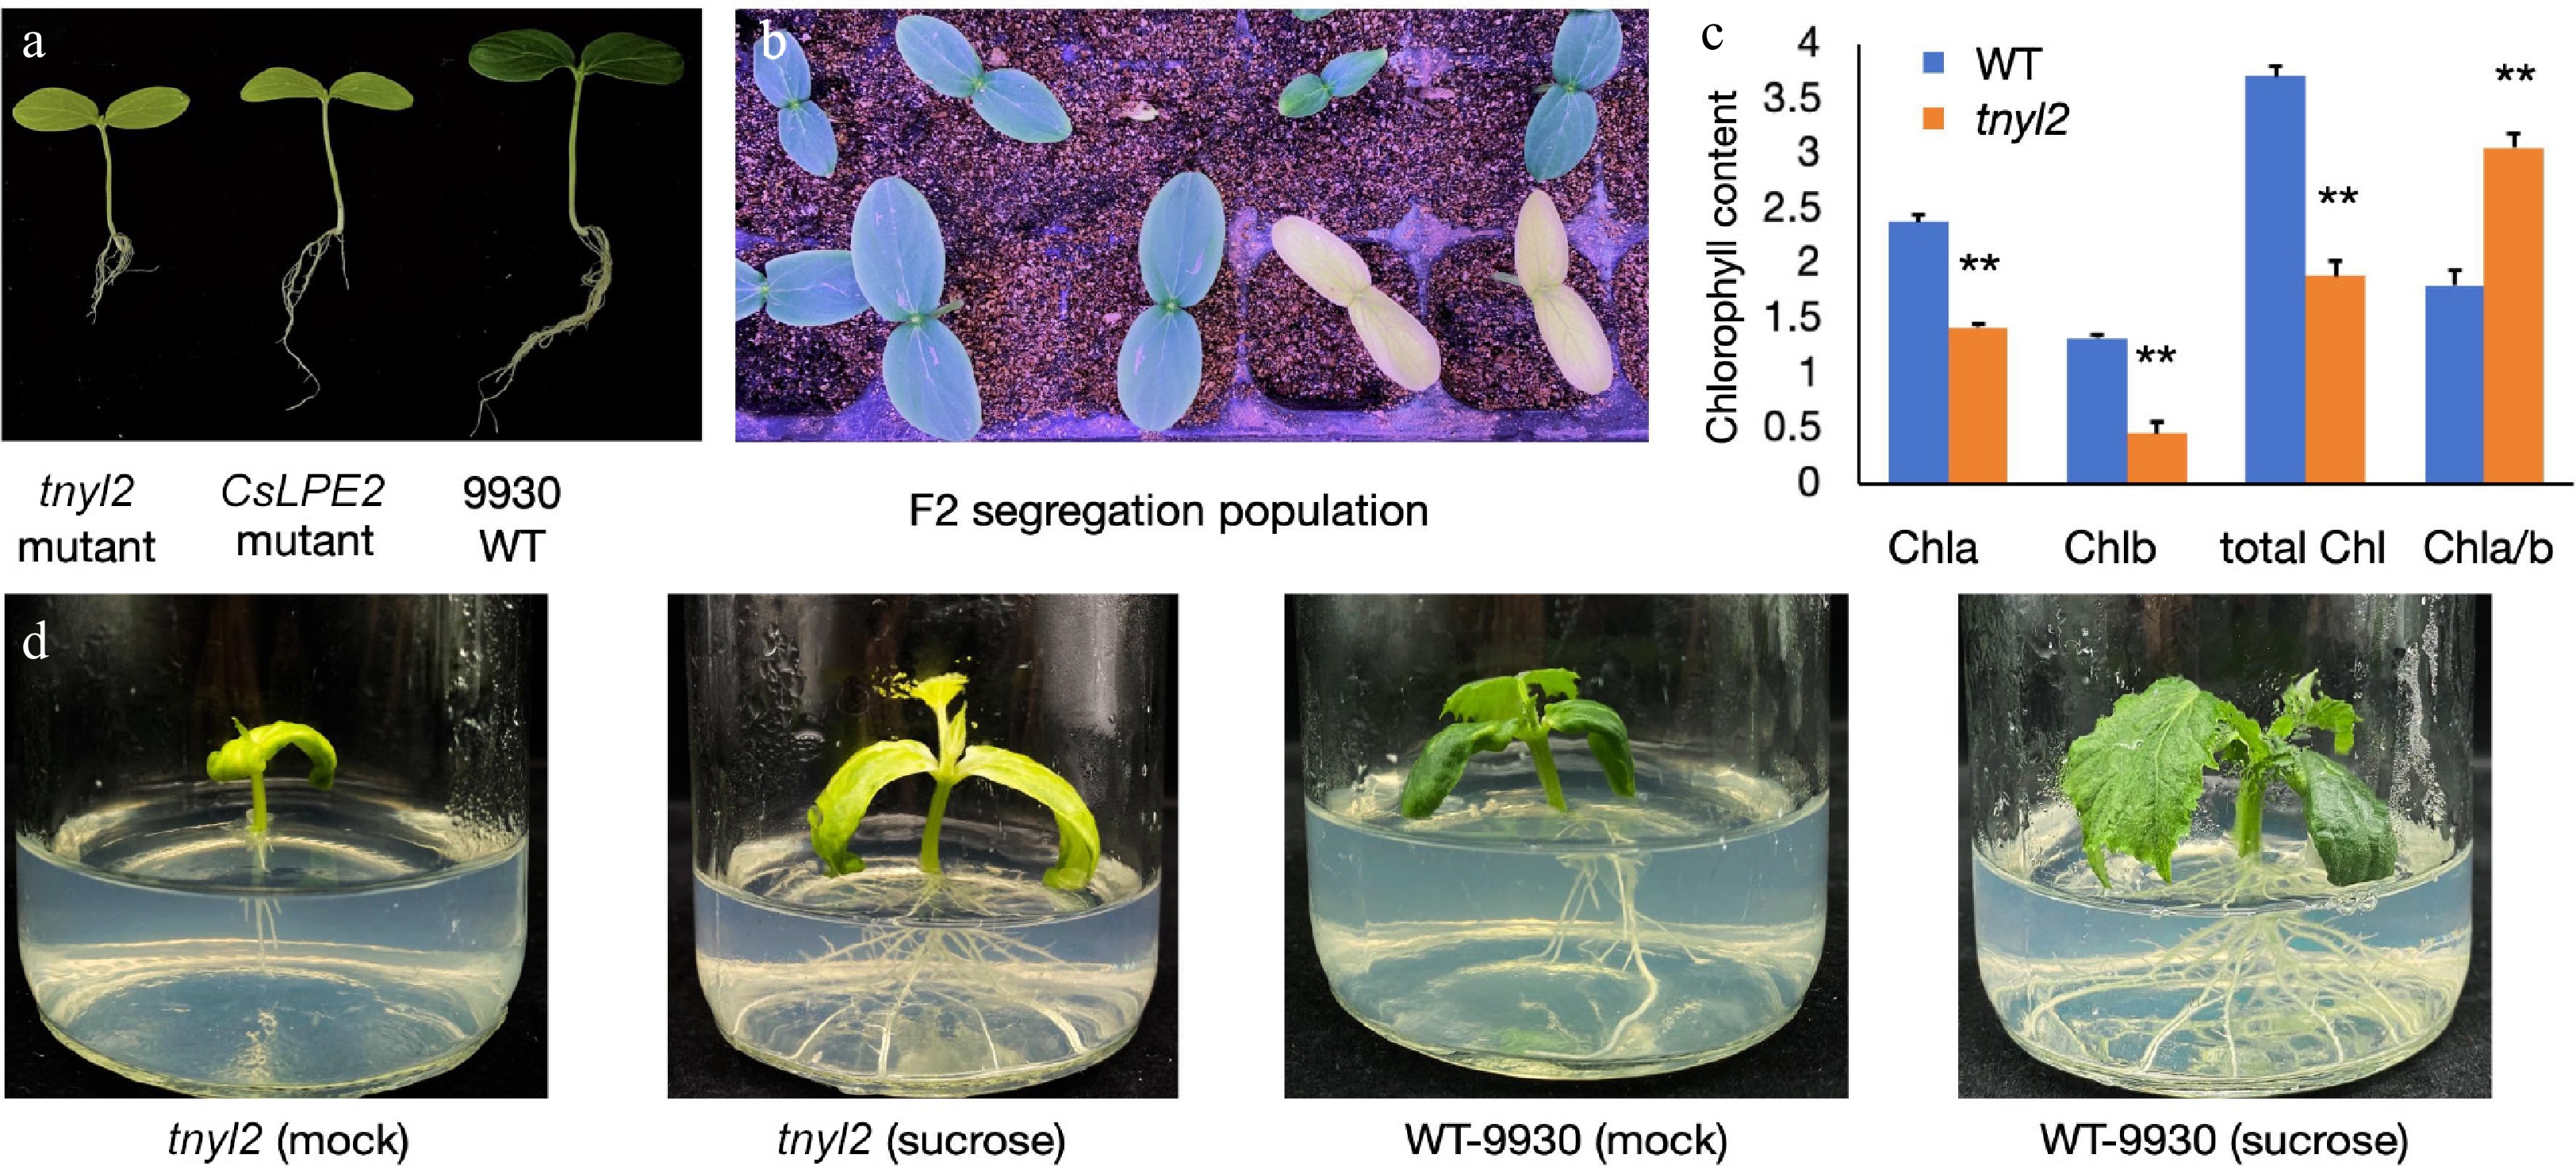
Figure 1.
Phenotypical characterization of cucumber mutant tnyl2 and wild type (WT) 9930. (a) Cotyledon color of the tnyl2 and WT. (b) Phenotypic identification of the tnyl2 mutant in the segregating population. (c) Chlorophyll contents in the WT and tnyl2 mutant leaves. Error bars represent mean ± SD (n = 5), mg/g. Student's t-test was performed, and statistically significant differences were indicated by **p < 0.01. (d) Phenotypes of the tnyl2 mutant and WT grown in MS medium with and without sucrose, respectively.
-
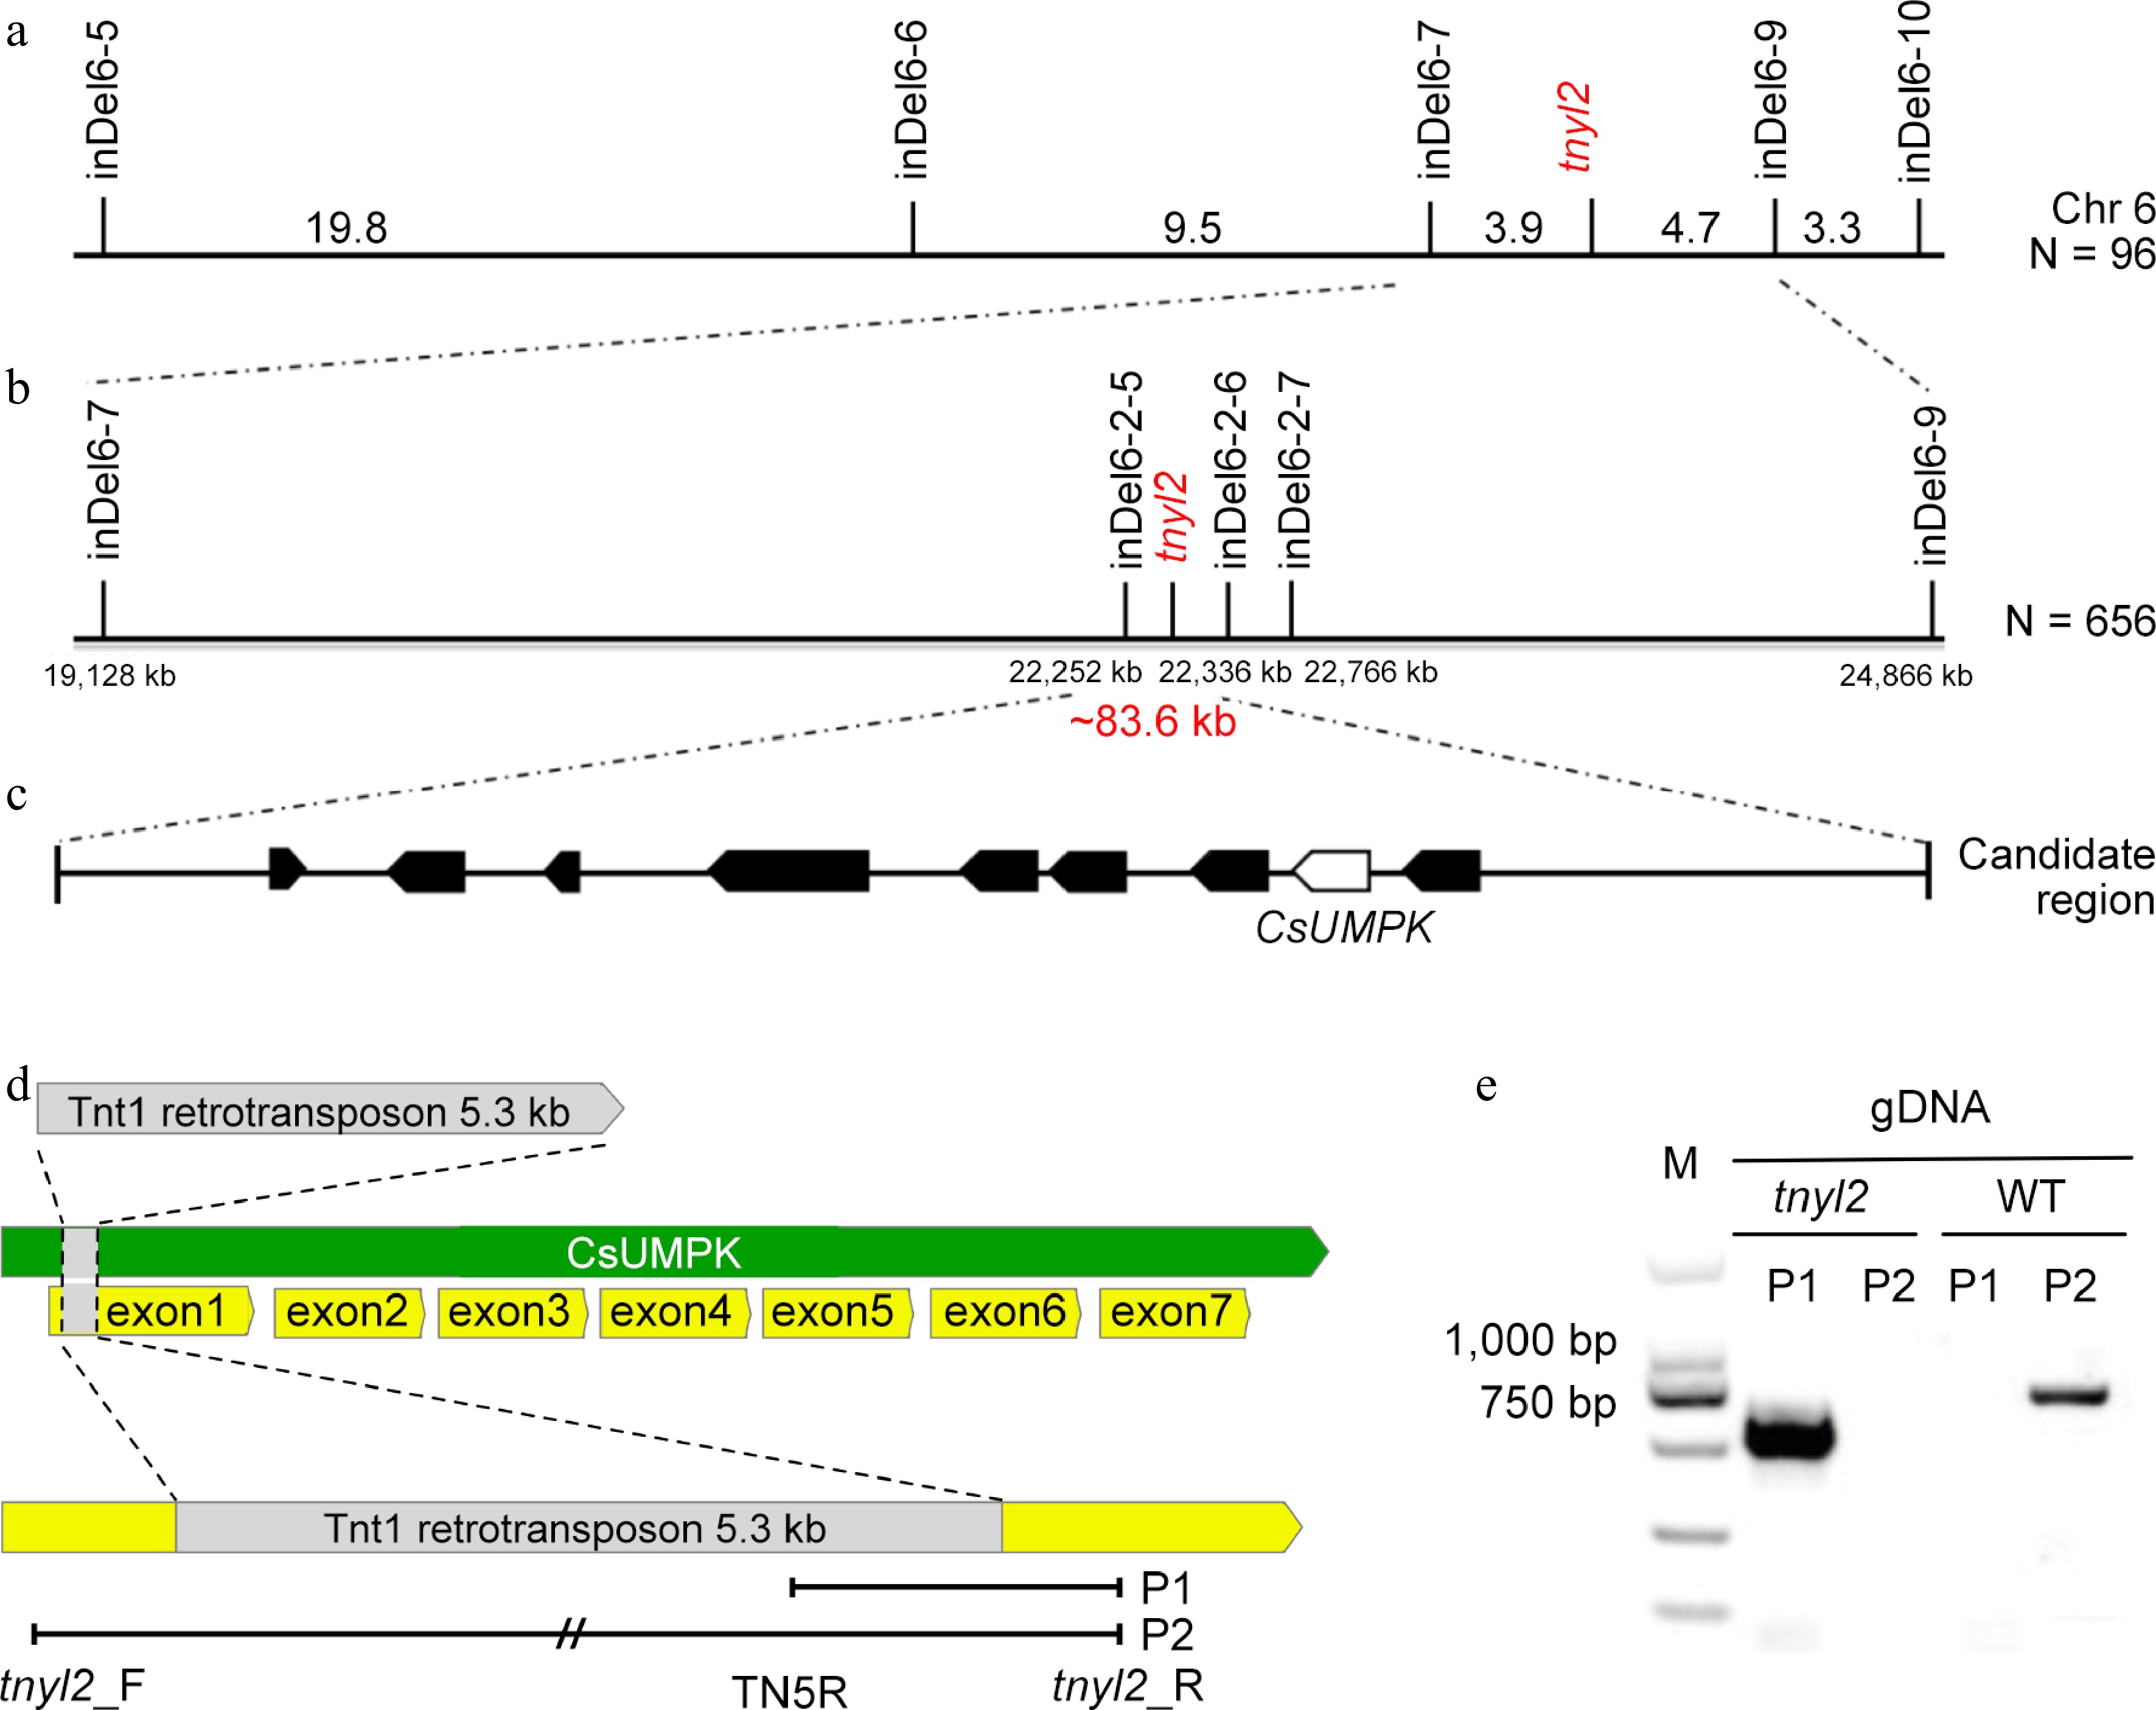
Figure 2.
Map-based cloning of genes for the tnyl2 locus of cucumber. (a) Primary mapping with 96 F2 plants placed the tnyl2 locus between InDel6-7 and InDel6-9 on chromosome 6. (b) Fine mapping with 656 F2 plants narrowed down the tnyl2 locus to an 83.6 kb region. (c) Nine genes were predicted in the candidate region. (d) Structural variation of the candidate gene, CsUMPK, with a 5.3 kb Tnt1 retrotransposon inserted. (e) Detection of the insertion mutation using CsUMPK specific molecular markers.
-
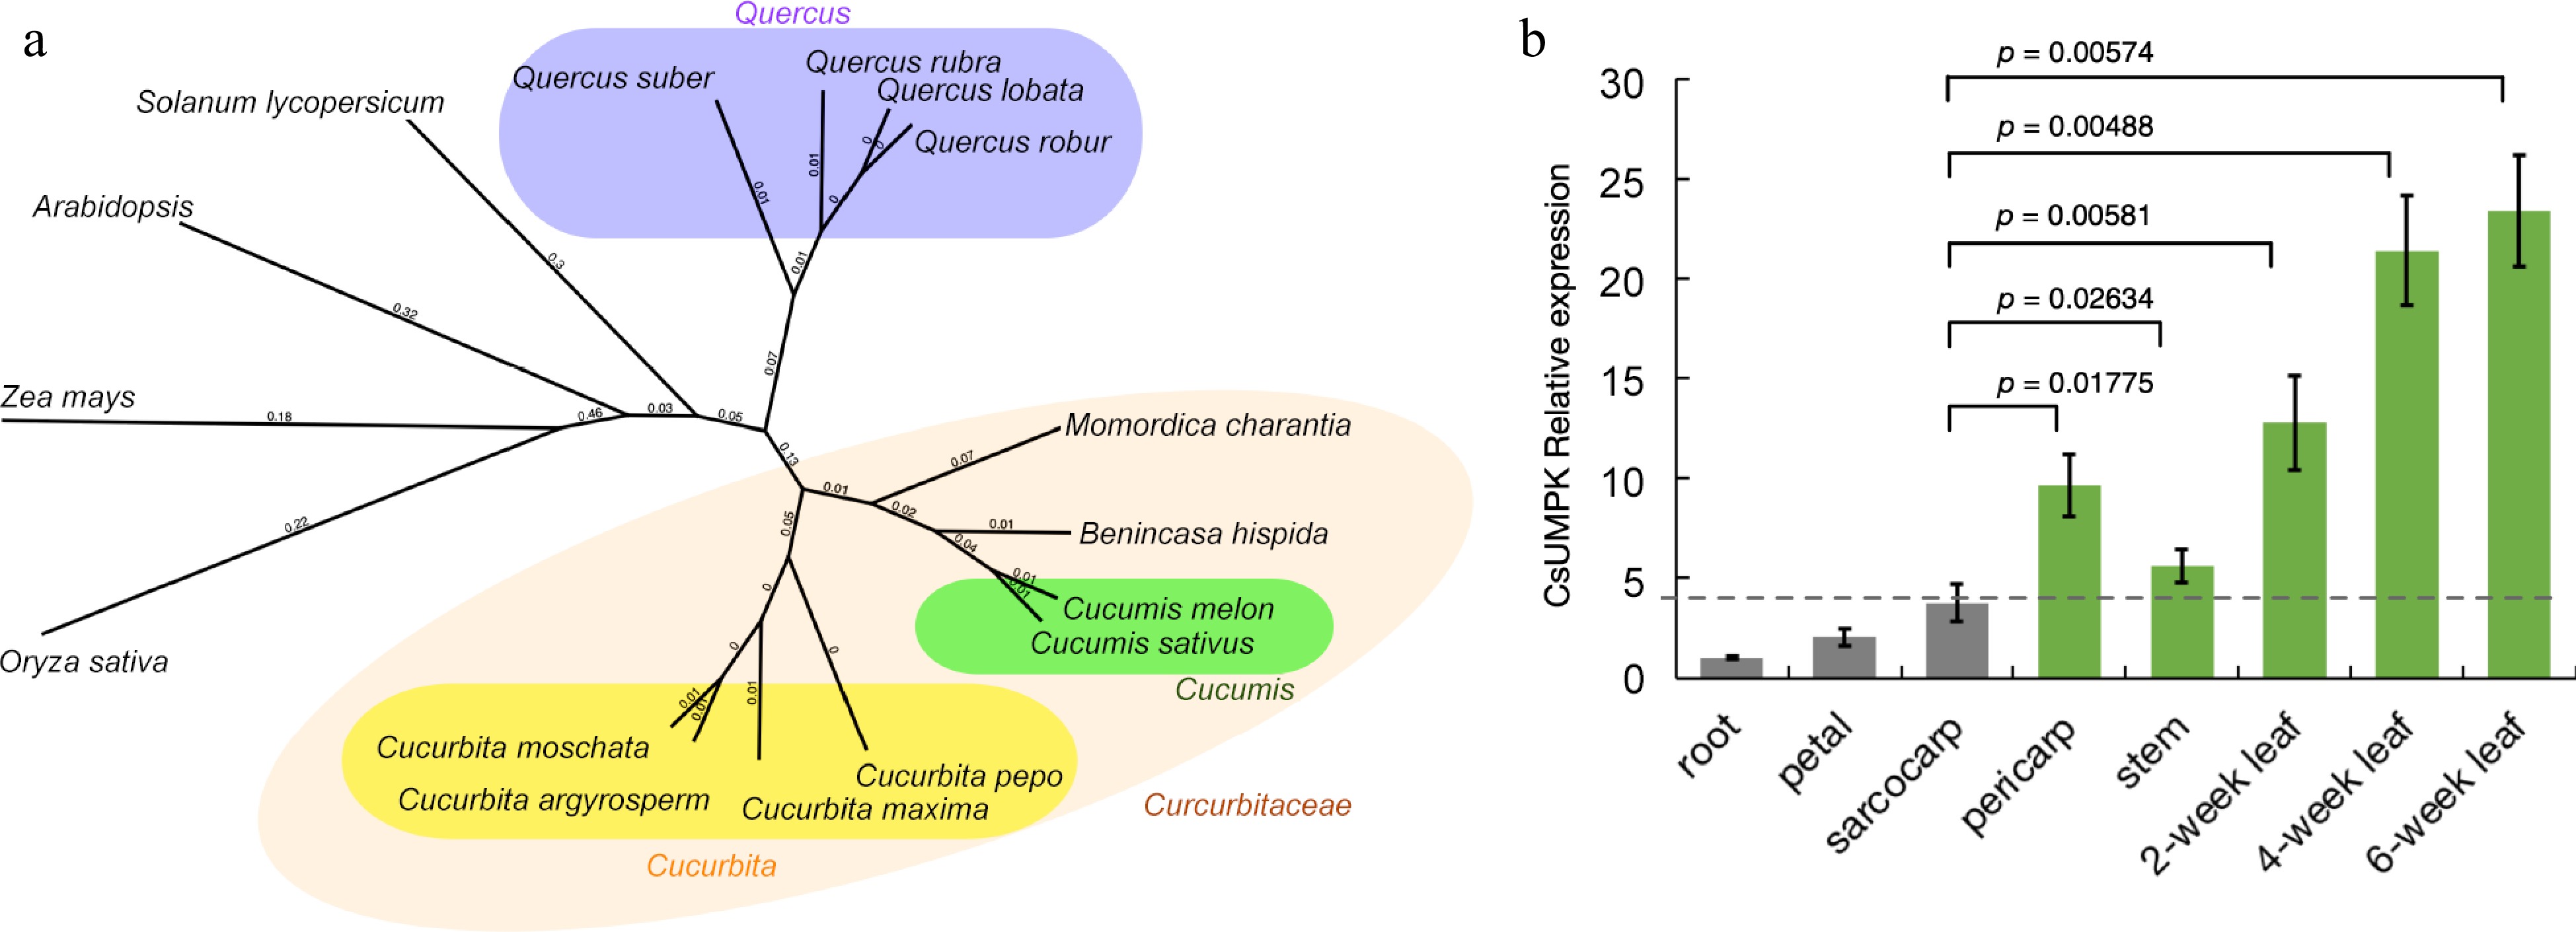
Figure 3.
Analysis of the evolutionary and expression characteristics of CsUMPK in cucumber. (a) Phylogenetic tree of CsUMPK protein in cucumber and its orthologs in other species. The phylogenetic tree was constructed by the Neighbor-Joining method with 1,000 bootstrap sampling. The numbers represent genetic distances. The protein sequences used in phylogenetic tree construction were from following species: Cucumis sativus (accession No. XP_004148645), Cucumis melo (XP_008441028), Benincasa hispida (XP_038880866), Cucurbita pepo (XP_023517300), Cucurbita moschata (XP_022962708), Momordica charantia (XP_022132364), Cucurbita argyrosperma (KAG7027137), Cucurbita maxima (XP_023003069), Quercus suber (XP_023896406), Quercus robur (XP_050292523), Quercus rubra (KAK4585494), Quercus lobata (XP_030975424), Solanum lycopersicum (XP_004235078), Oryza sativa (XP_015638950), Zea mays (XP_008654512), Arabidopsis thaliana (AT3G18680). (b) Relative expression of the CsUMPK gene. Relative expression of the CsUMPK gene in wt-9930 was measured by qRT-PCR in the root, petal, sarcocarp, pericarp, stems, and different stages of the leaf. For each sample, three independent biological replications were performed. Data are means ± SD (n = 3). Transcript levels of CsUMPK were normalized with CsActin and expression was shown relative to the root of wt-9930, the values of which were set as 1. The p-values were calculated using the Student's t-test.
-
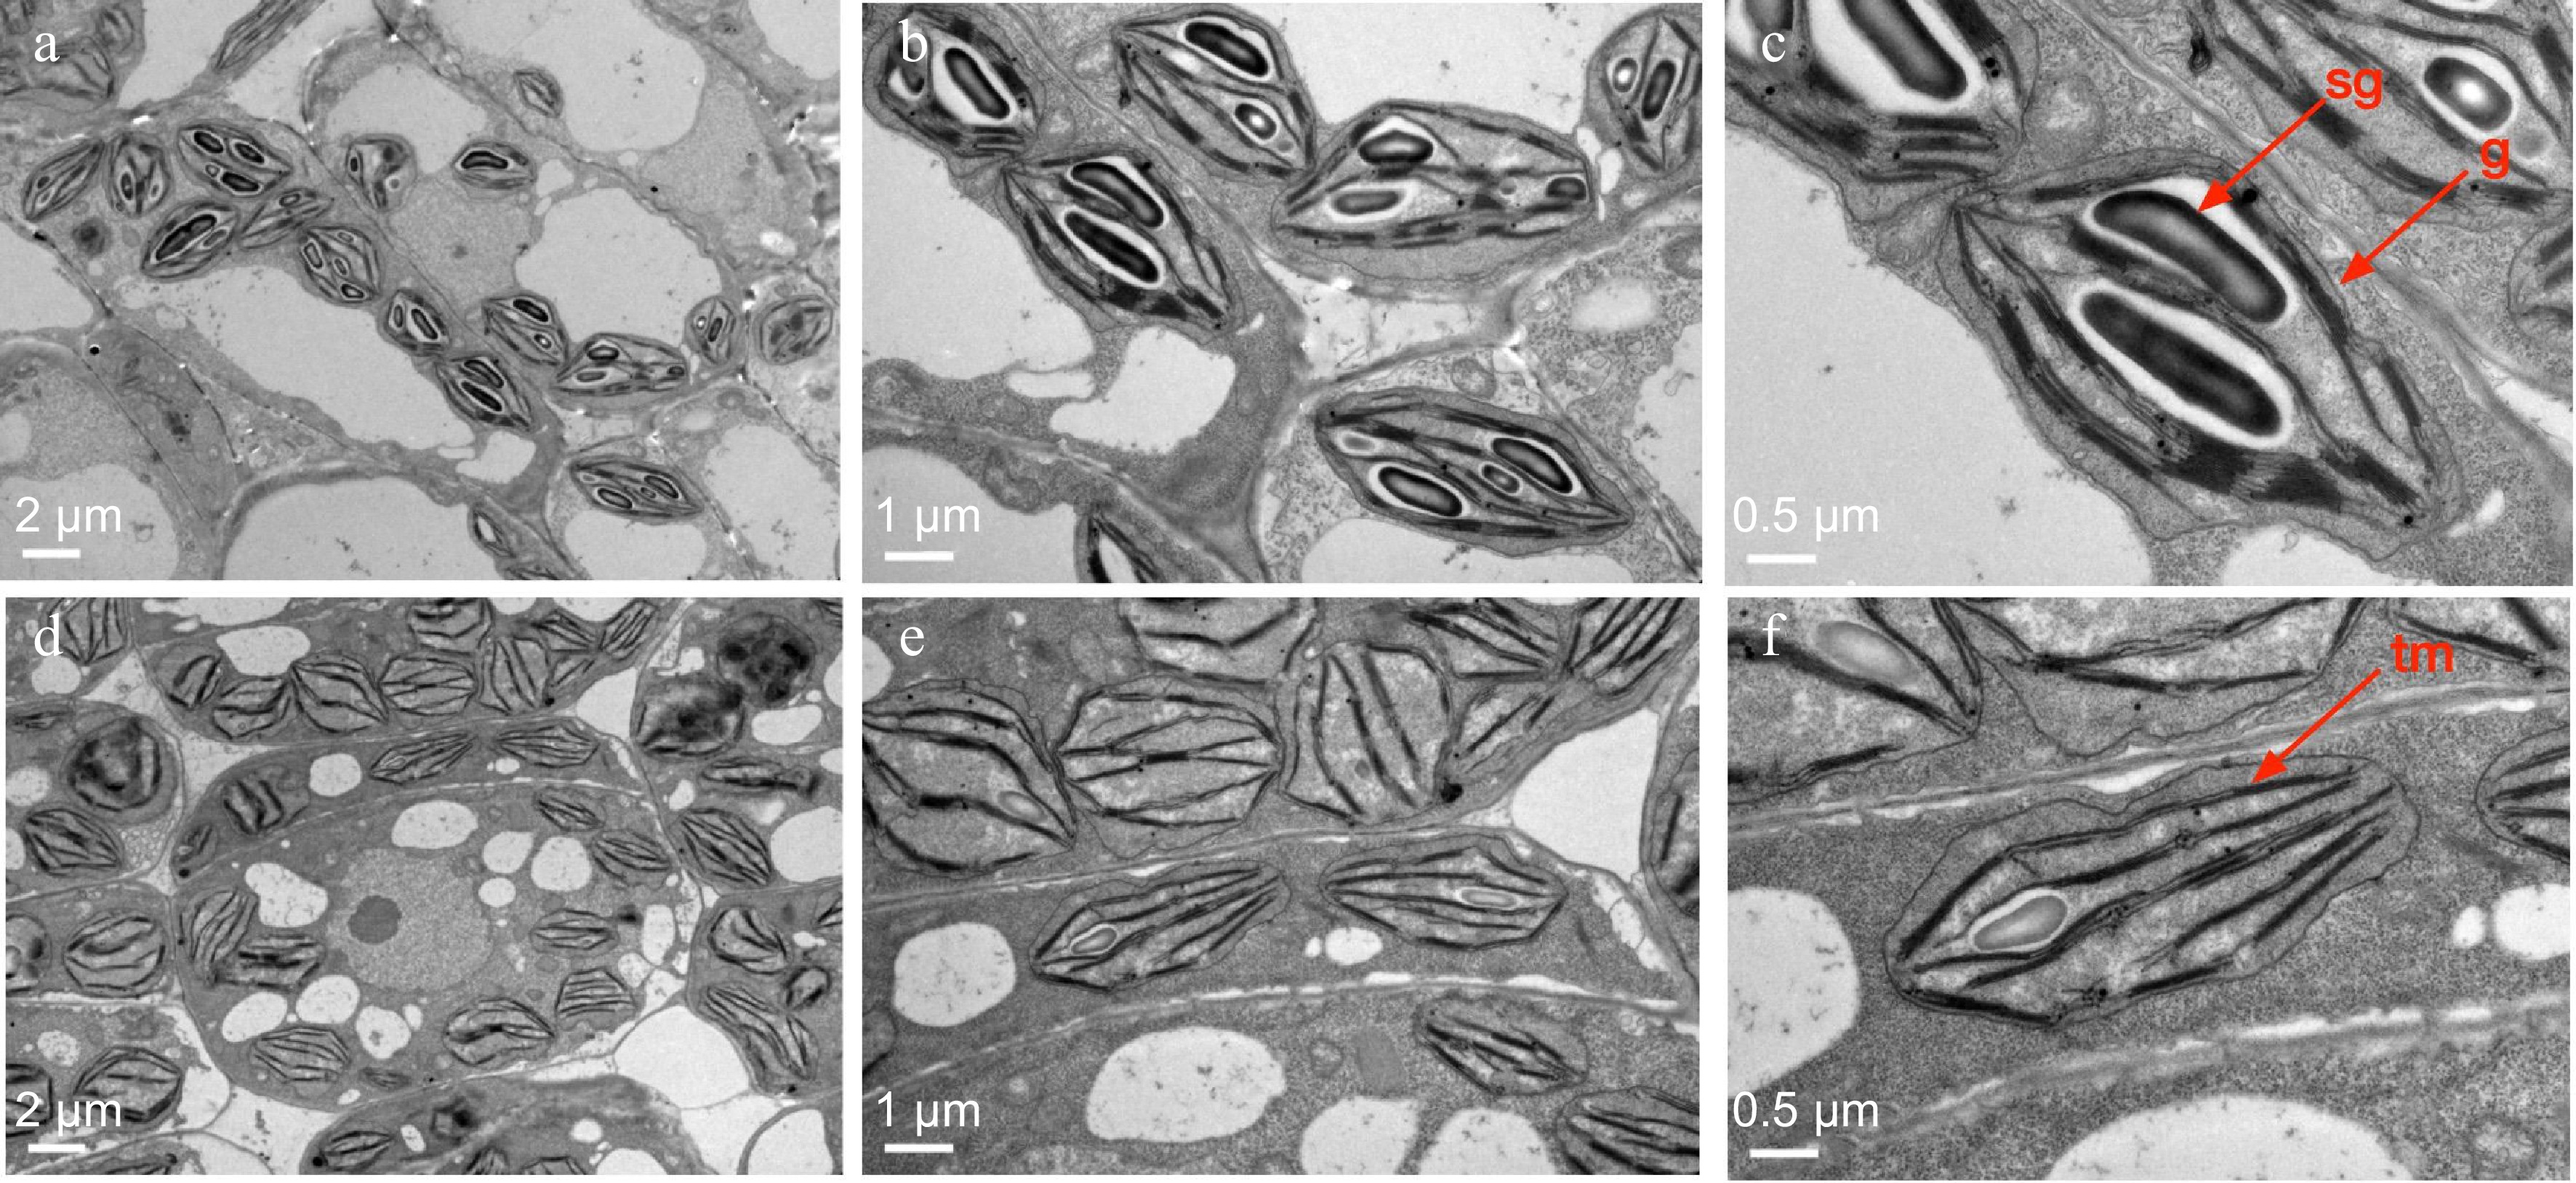
Figure 4.
Chloroplast ultrastructure of cucumber wt-9930 and tnyl2. (a)−(c) Chloroplast structure of WT, and (d)−(f) tnyl2. sg = starch granules; tm = thylakoid membranes; g = grana. Scale bars are shown in the figure.
-
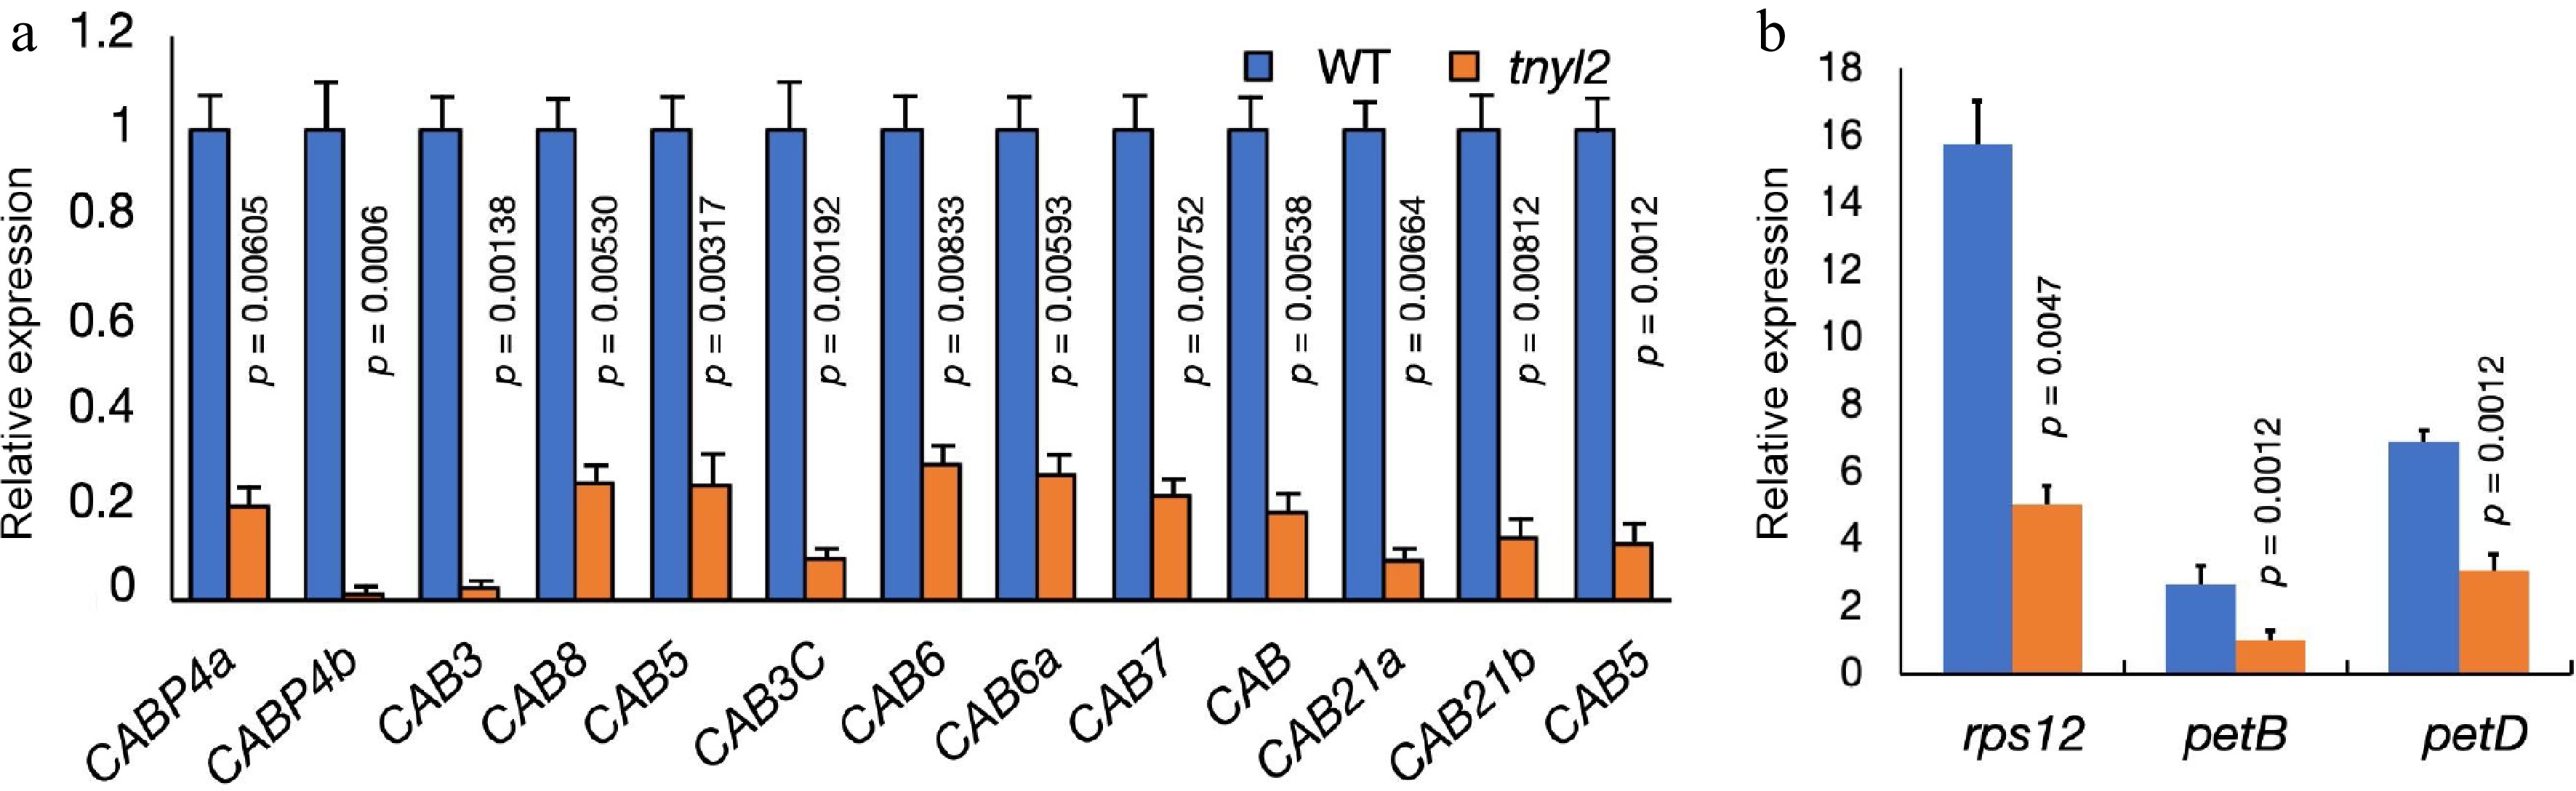
Figure 5.
Expression levels of chlorophyll-related genes in cucumber leaves. (a) Expression levels of the Chlorophyll a/b binding protein (CAB) related genes in wt-9930 and tnyl2. (b) Expression levels of chloroplast gene introns in the wt-9930 and tnyl2. For each sample, three independent biological replications were performed. Data are means ± SD (n = 3). The p-values were calculated using the Student's t-test.
-
Population Total number Green leaf Yellow leaf Expected ratio χ2 F1 (tnyl2 × S06) 10 10 − − − F2 (tnyl2 × S06) 96 69 27 3:1 0.3221 F2 (tnyl2 × S06) 656 501 155 3:1 0.6103 χ2 (0.05,1) = 3.84. Table 1.
Segregation analysis of leaf color in the F2 population of cucumber.
-
Material F0 Fm Fv/Fm qP NPQ Y(II) tnyl2 0.07 ± 0.02** 0.20 ± 0.03** 0.43 ± 0.05** 0.25 ± 0.08** 0.34 ± 0.02** 0.19 ± 0.05** 9930 0.14 ± 0.03 0.45 ± 0.02 0.69 ± 0.01 0.69 ± 0.02 0.53 ± 0.01 0.53 ± 0.01 Five independent biological replications were performed. Each independent biological replication contains three different individuals. Three technical repeats were performed for each biological replication. Data are means ± SD (n = 5). Asterisks indicate statistically significant differences compared with the wild-type at ** p < 0.01 by Student's t-test. Table 2.
Chlorophyll fluorescence kinetic parameters of young leaves of cucumber 9930 and mutant tnyl2.
Figures
(5)
Tables
(2)