-
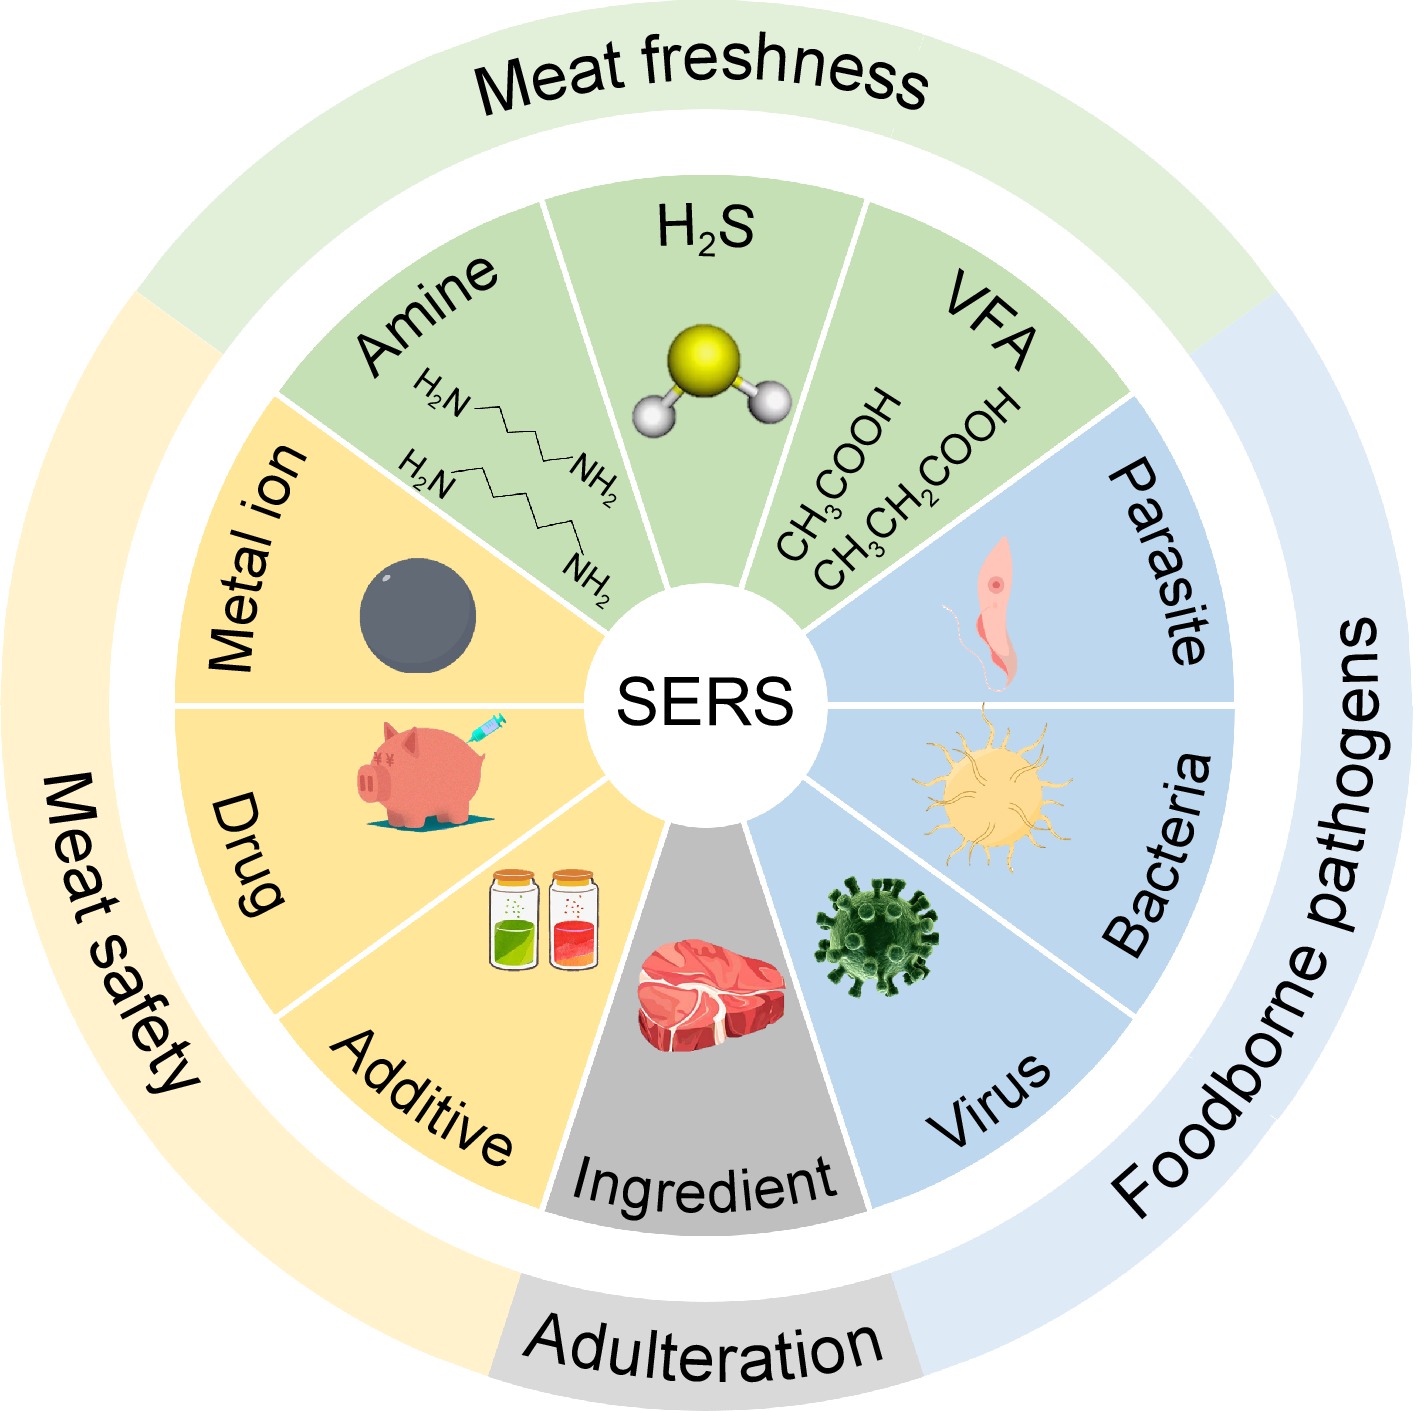
Figure 1.
Schematic application of SERS analysis in meat and meat products.
-
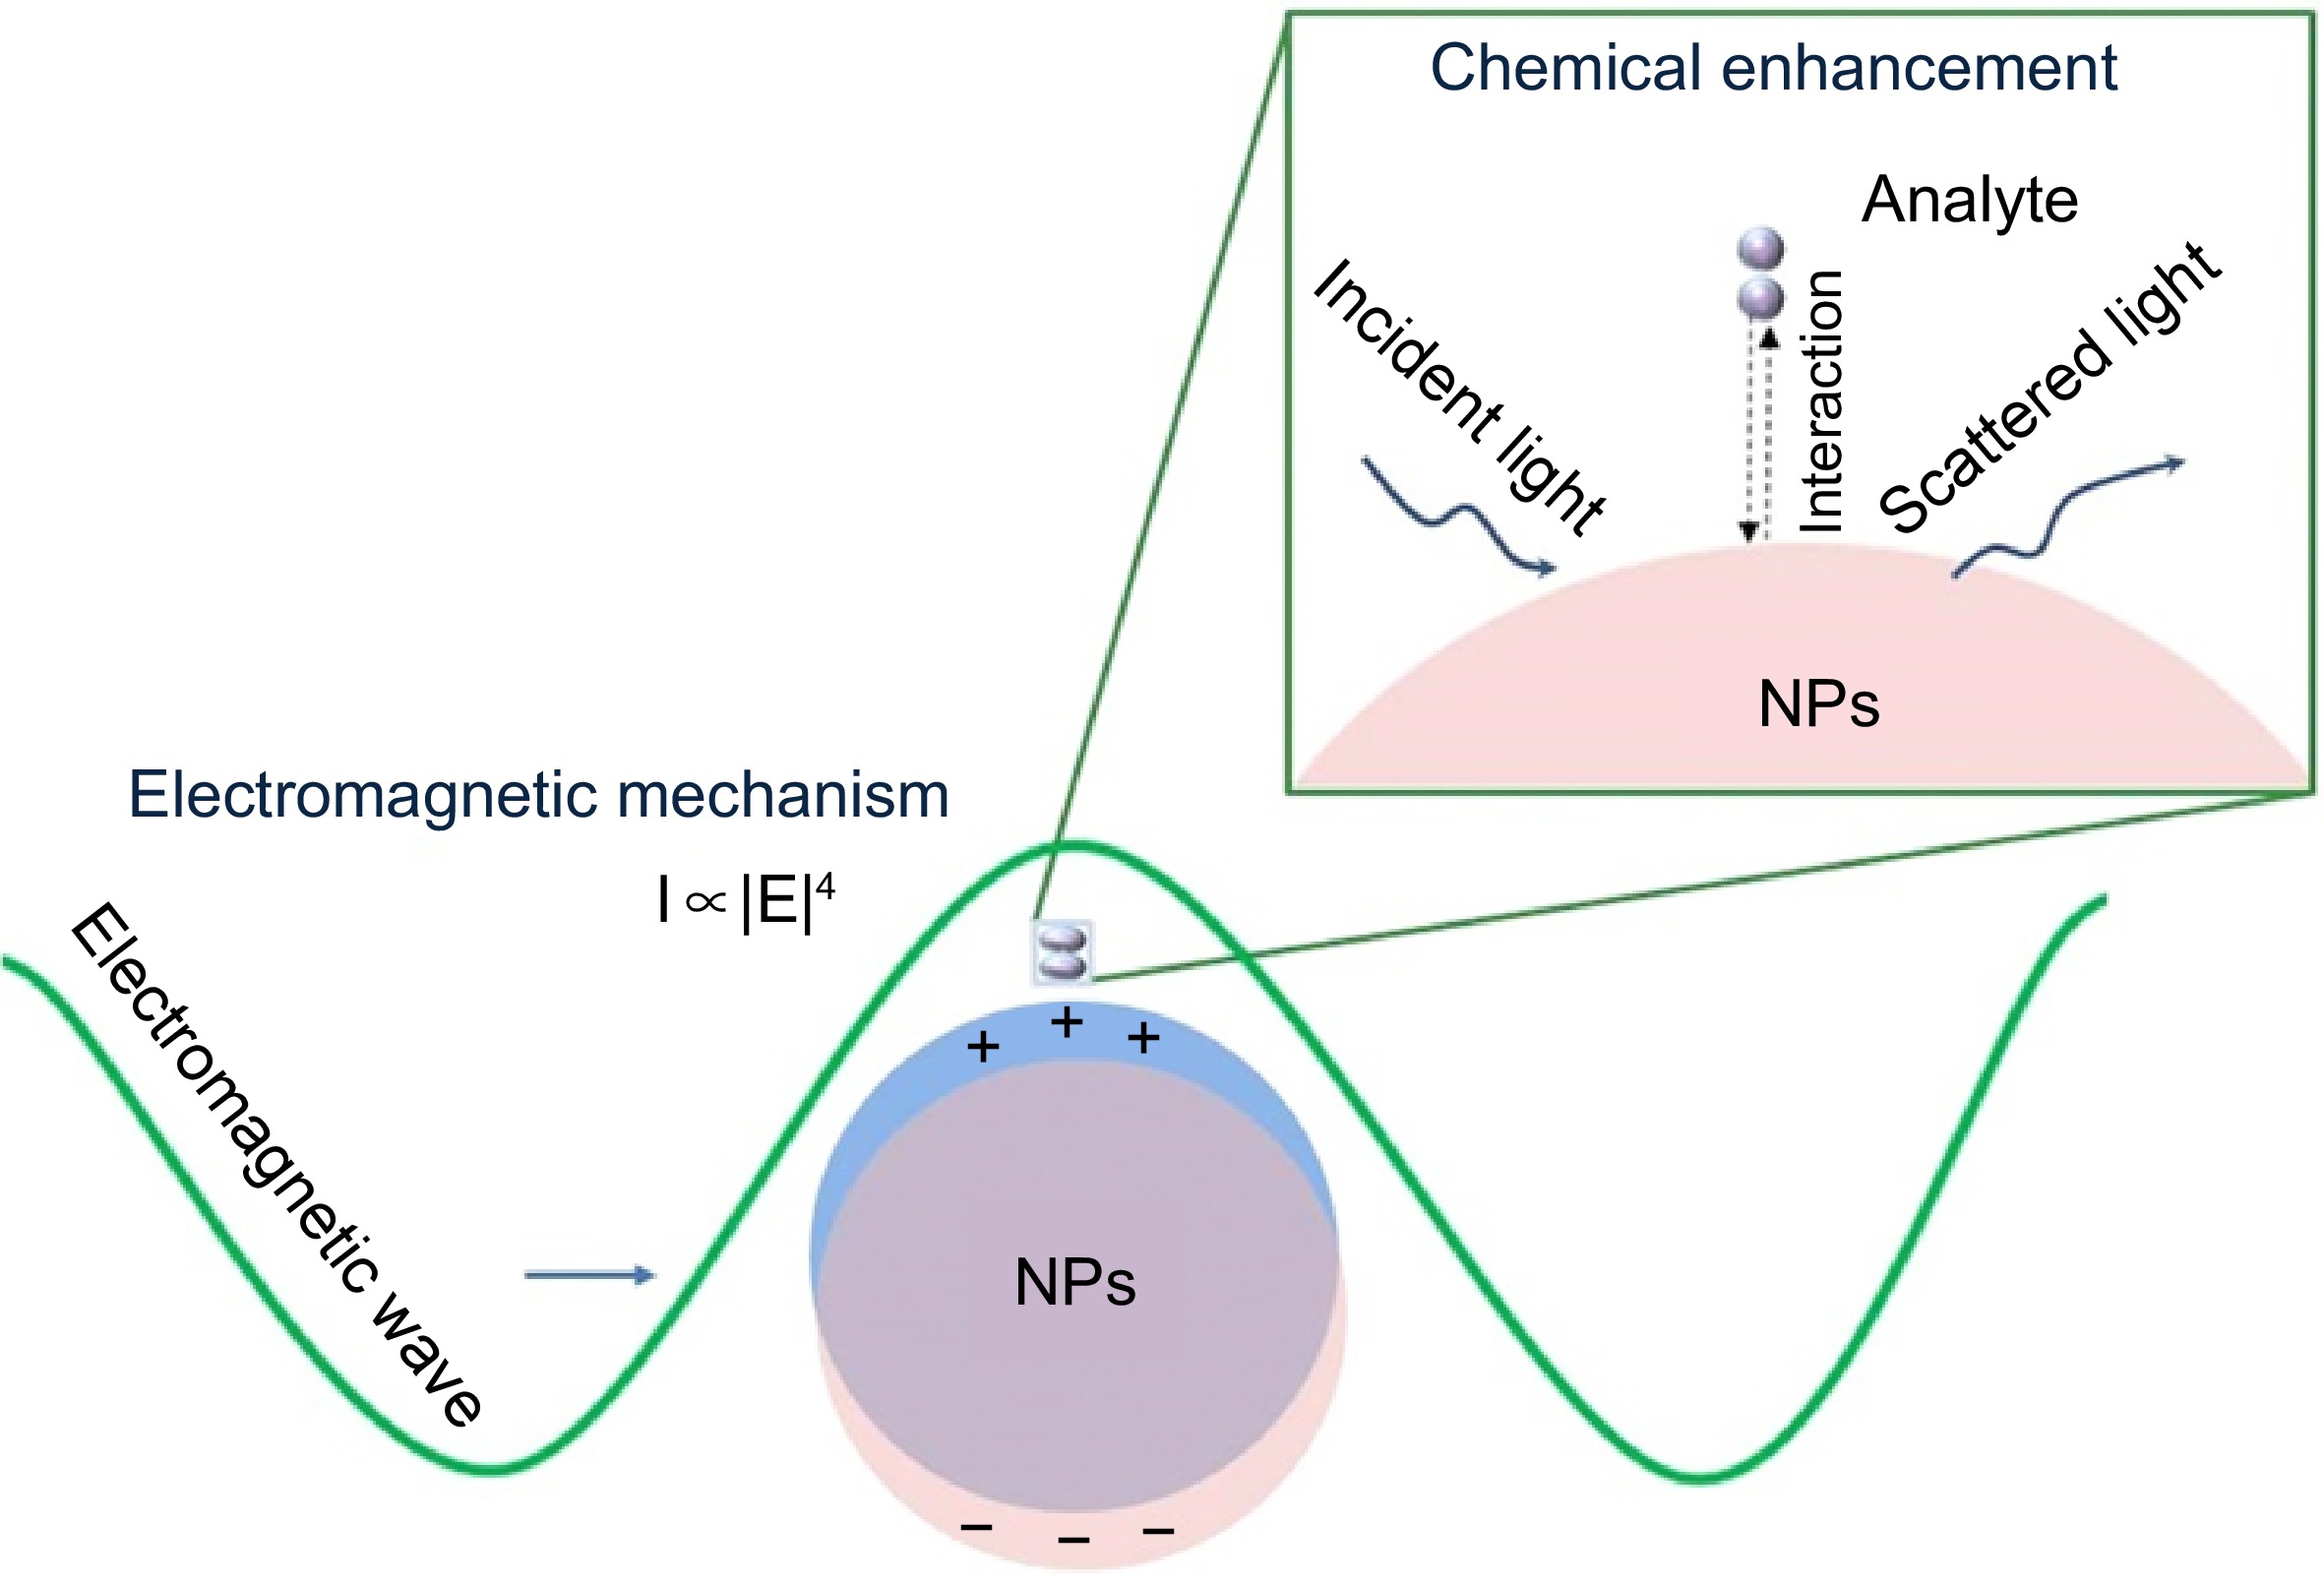
Figure 2.
Enhancement mechanisms of SERS[34].
-
-
-
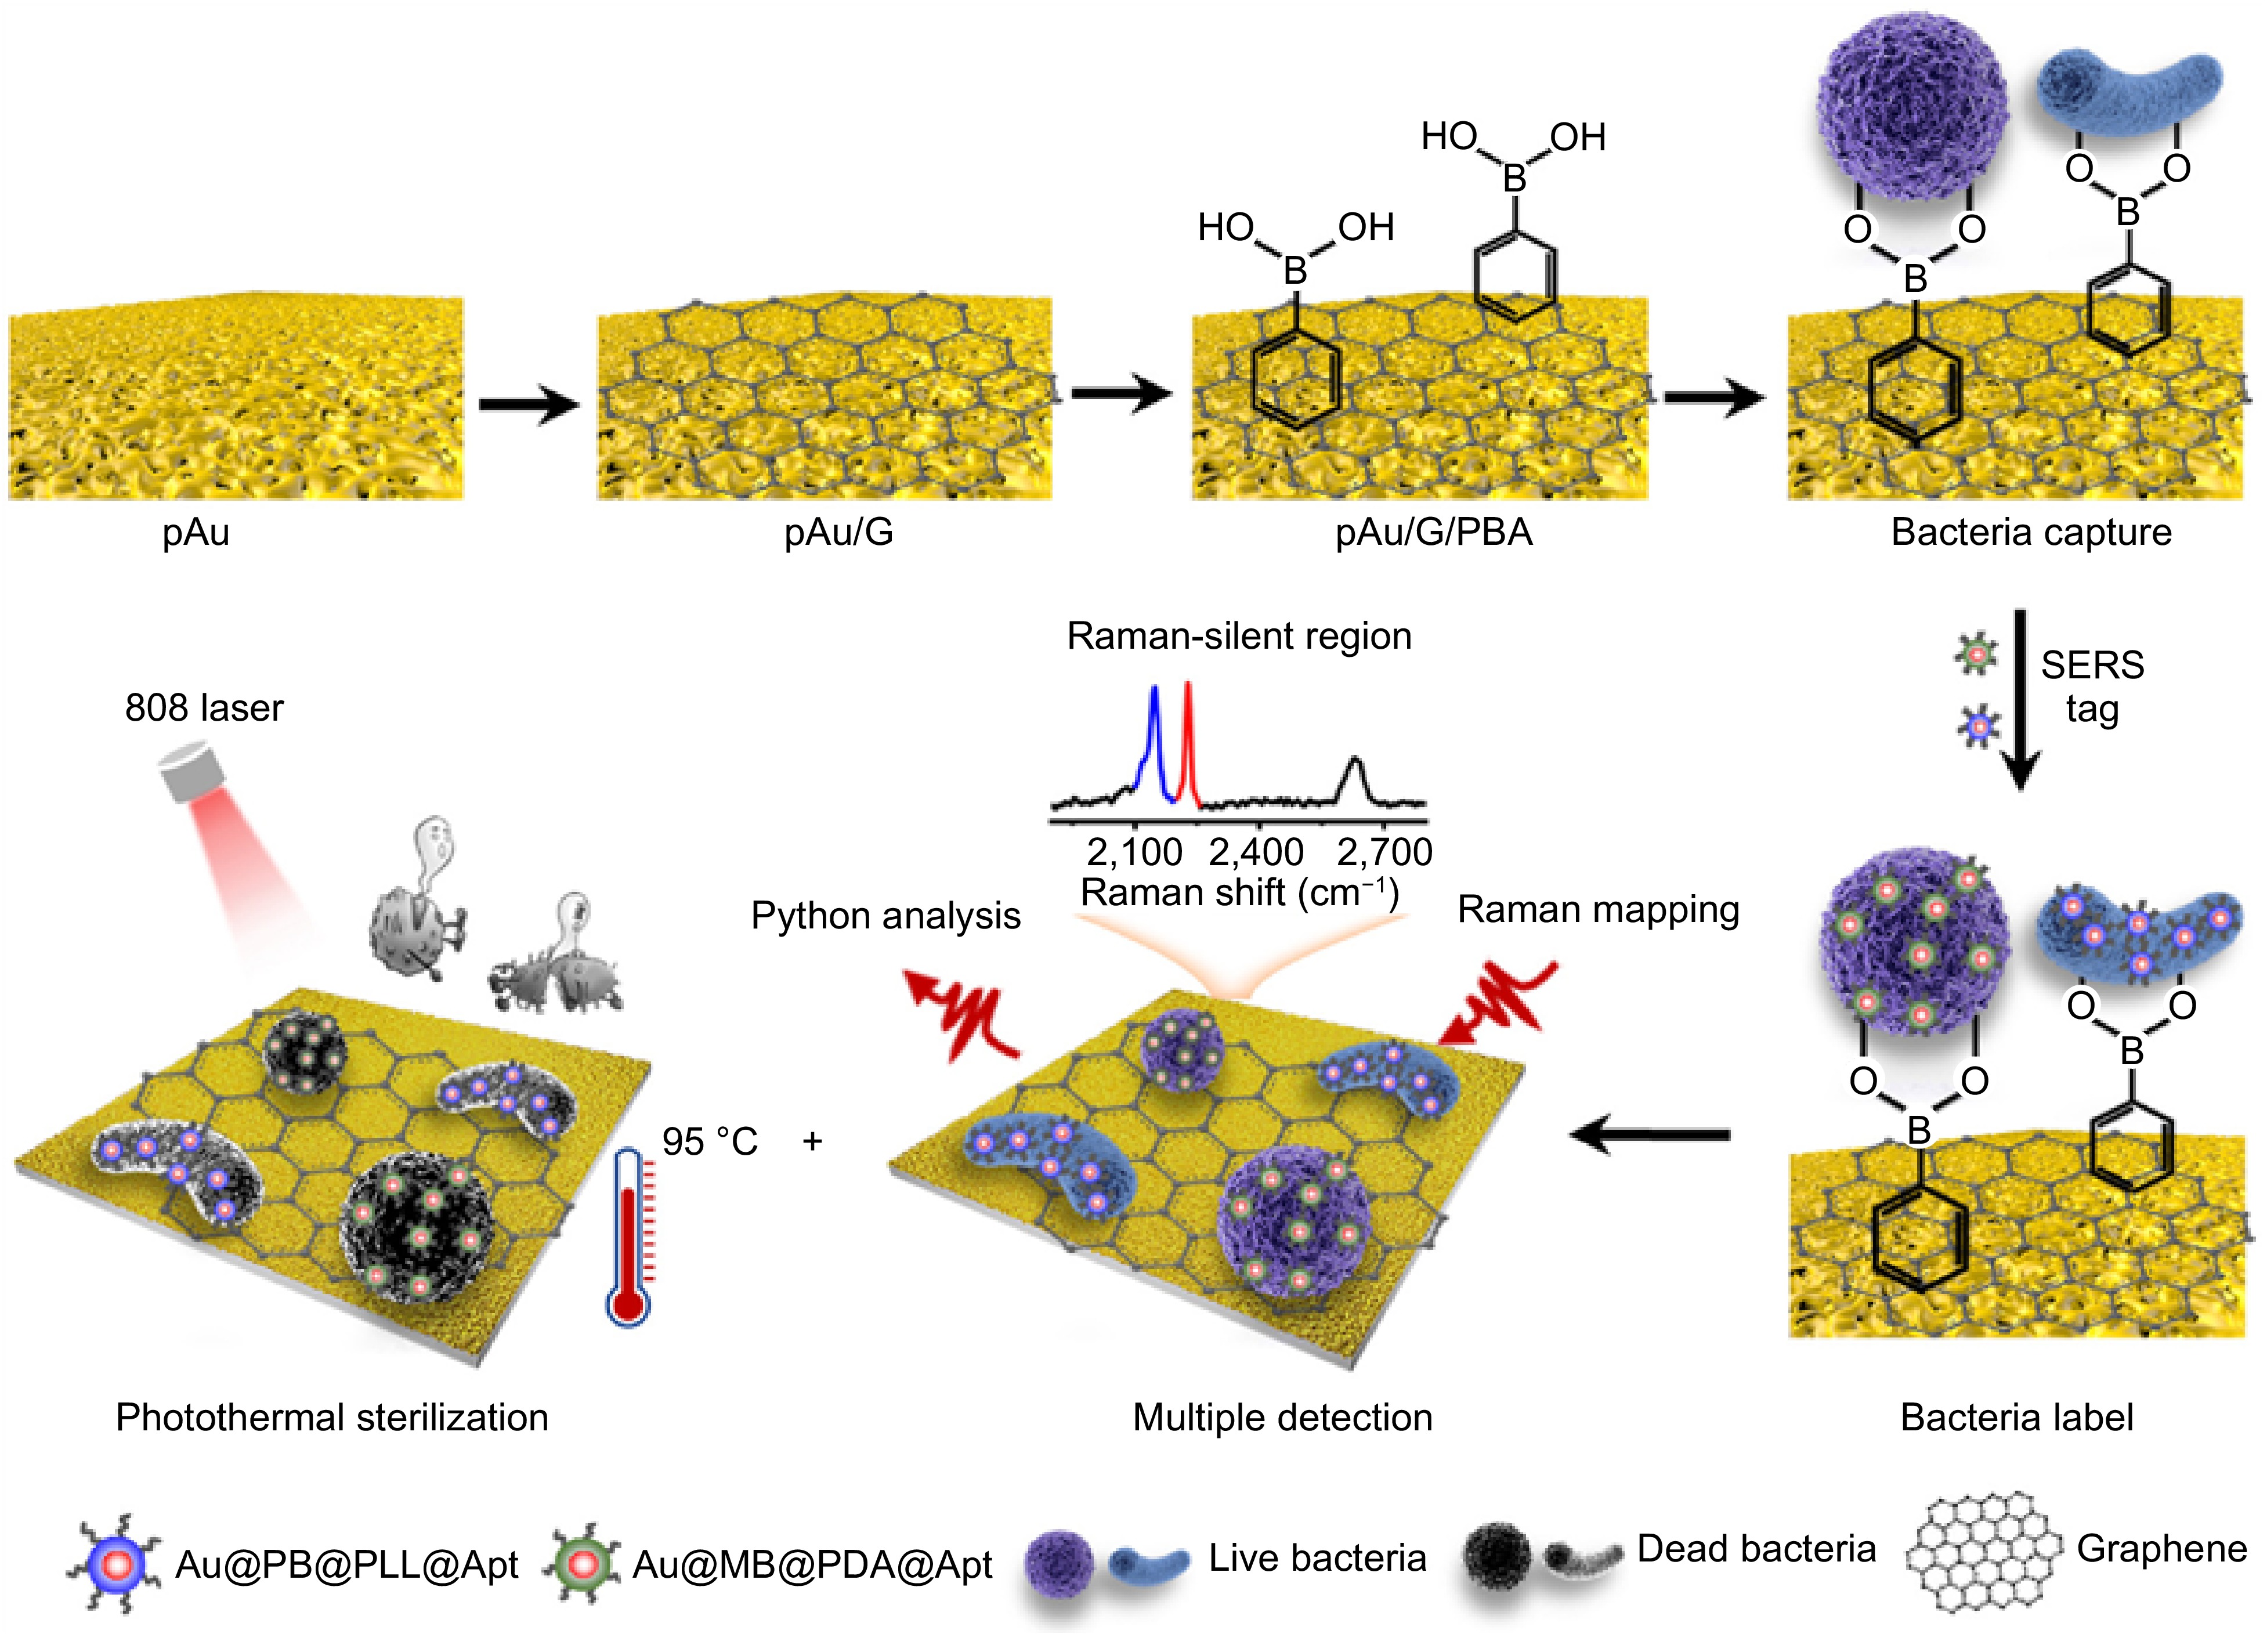
Figure 5.
Schematic diagram of capturing, detecting, and inactivating bacteria[90].
-
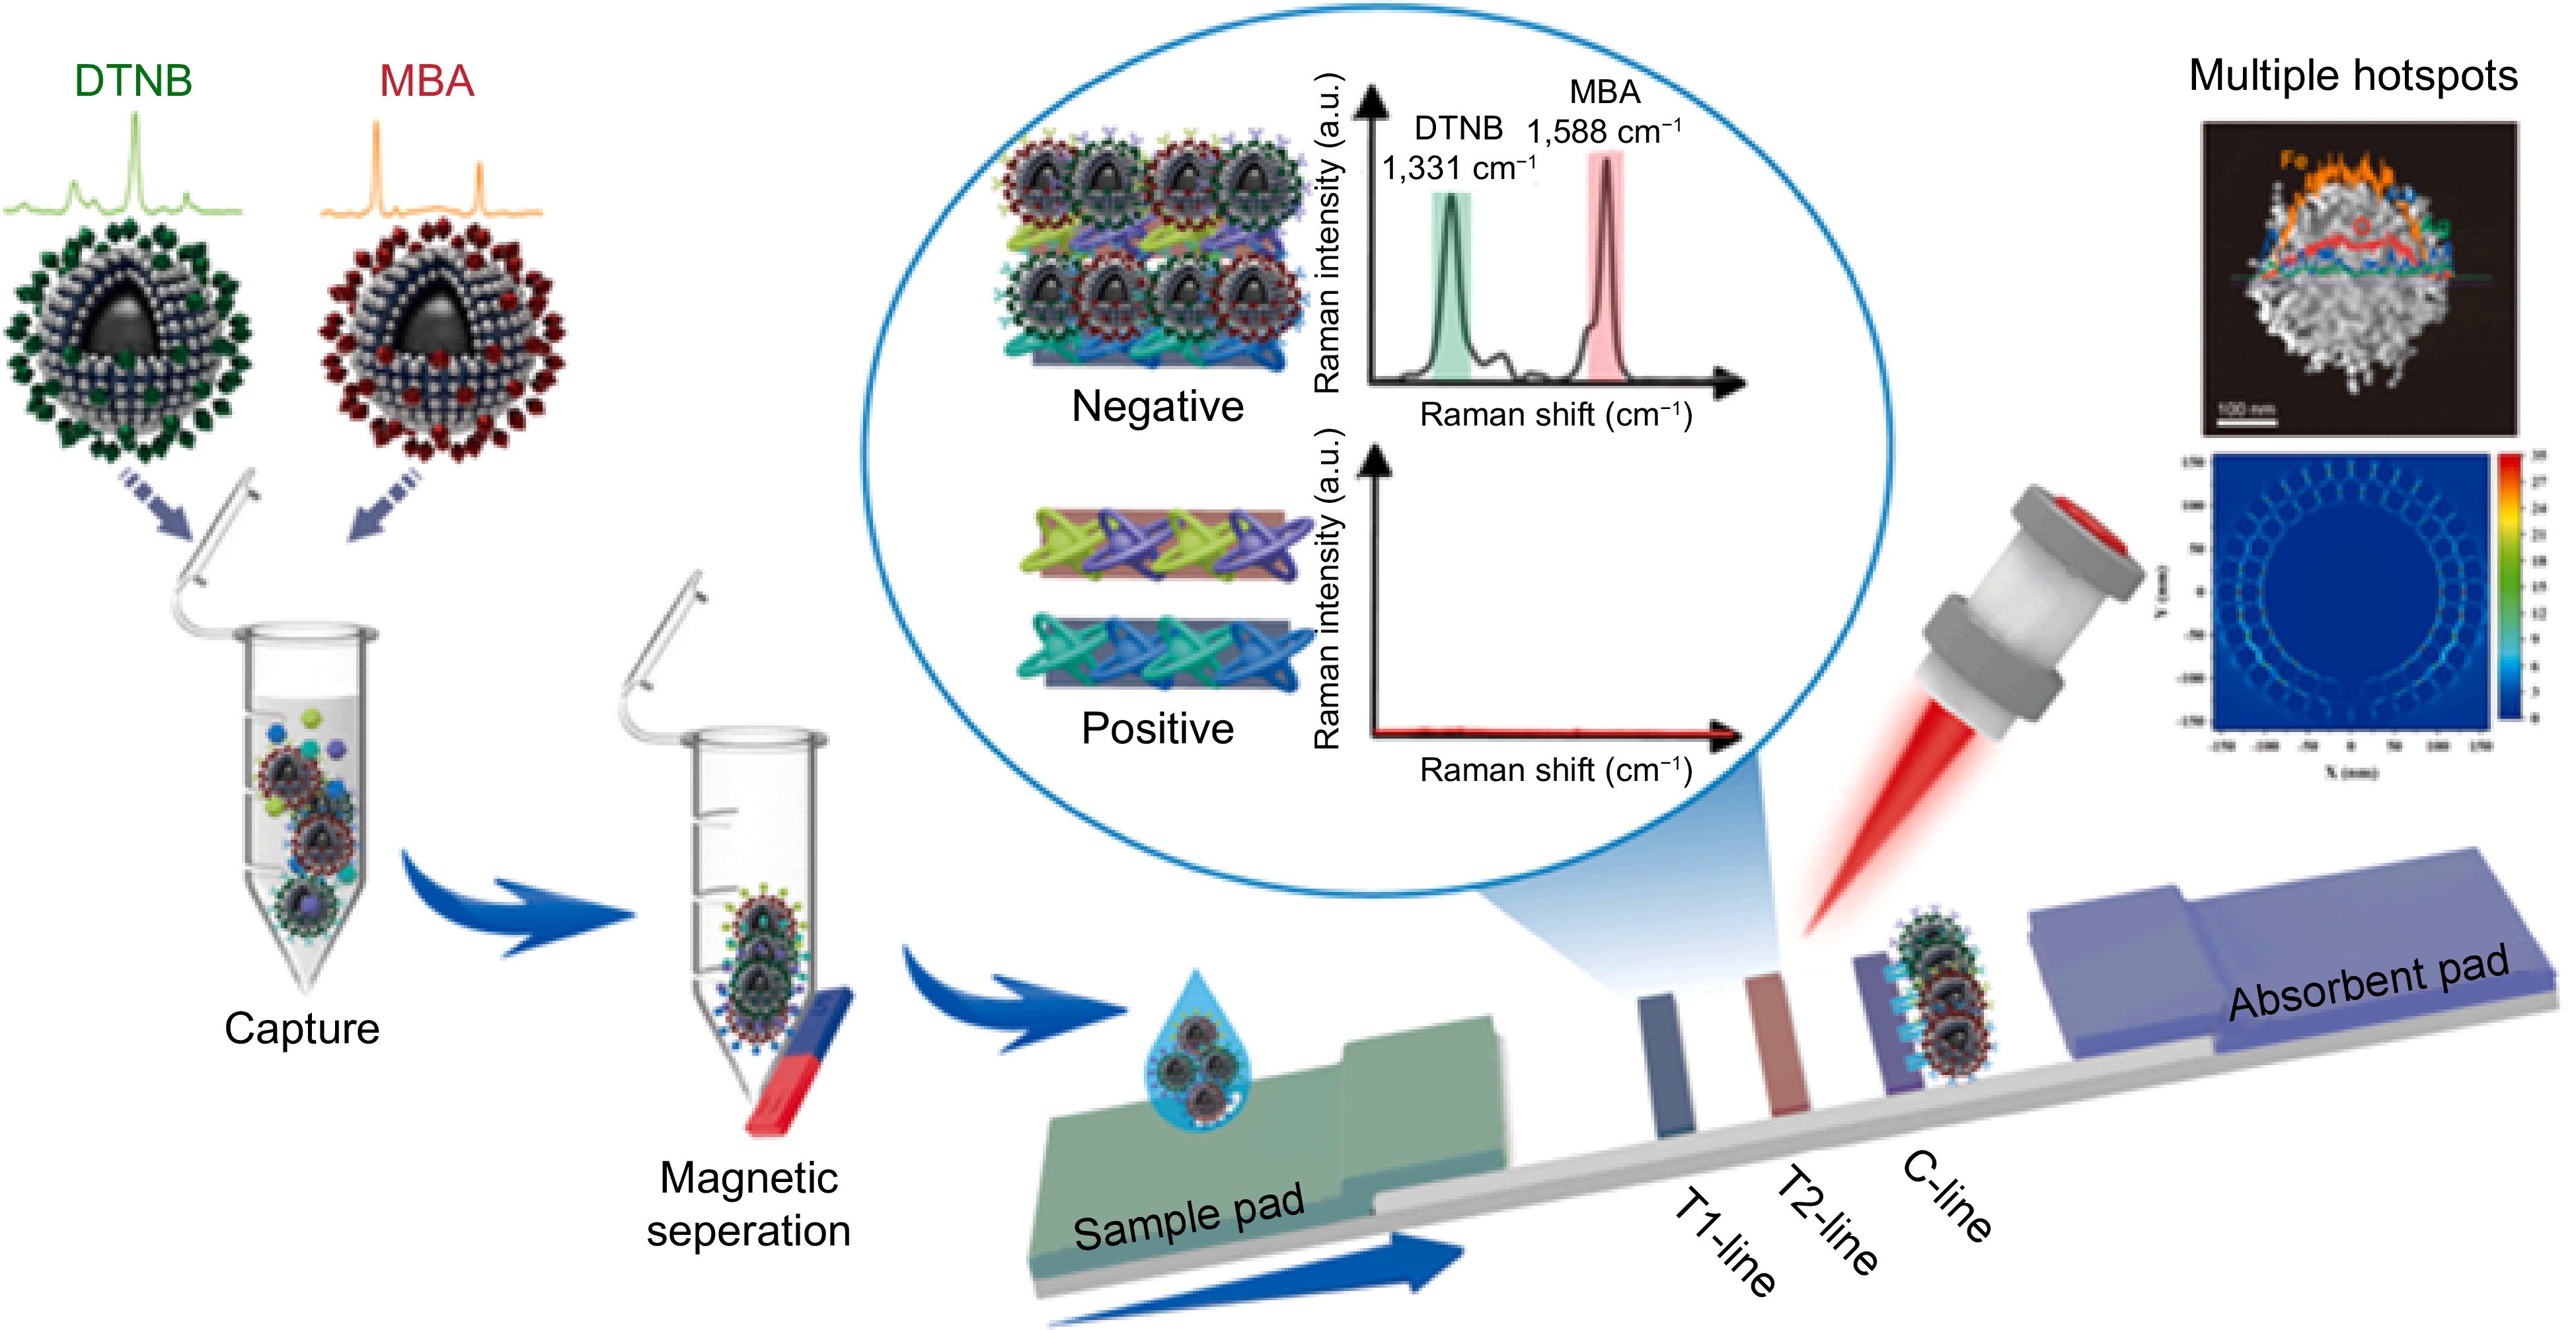
Figure 6.
Schematic diagram of using the SERS-LFA system to detect multiple veterinary drugs[109].
-
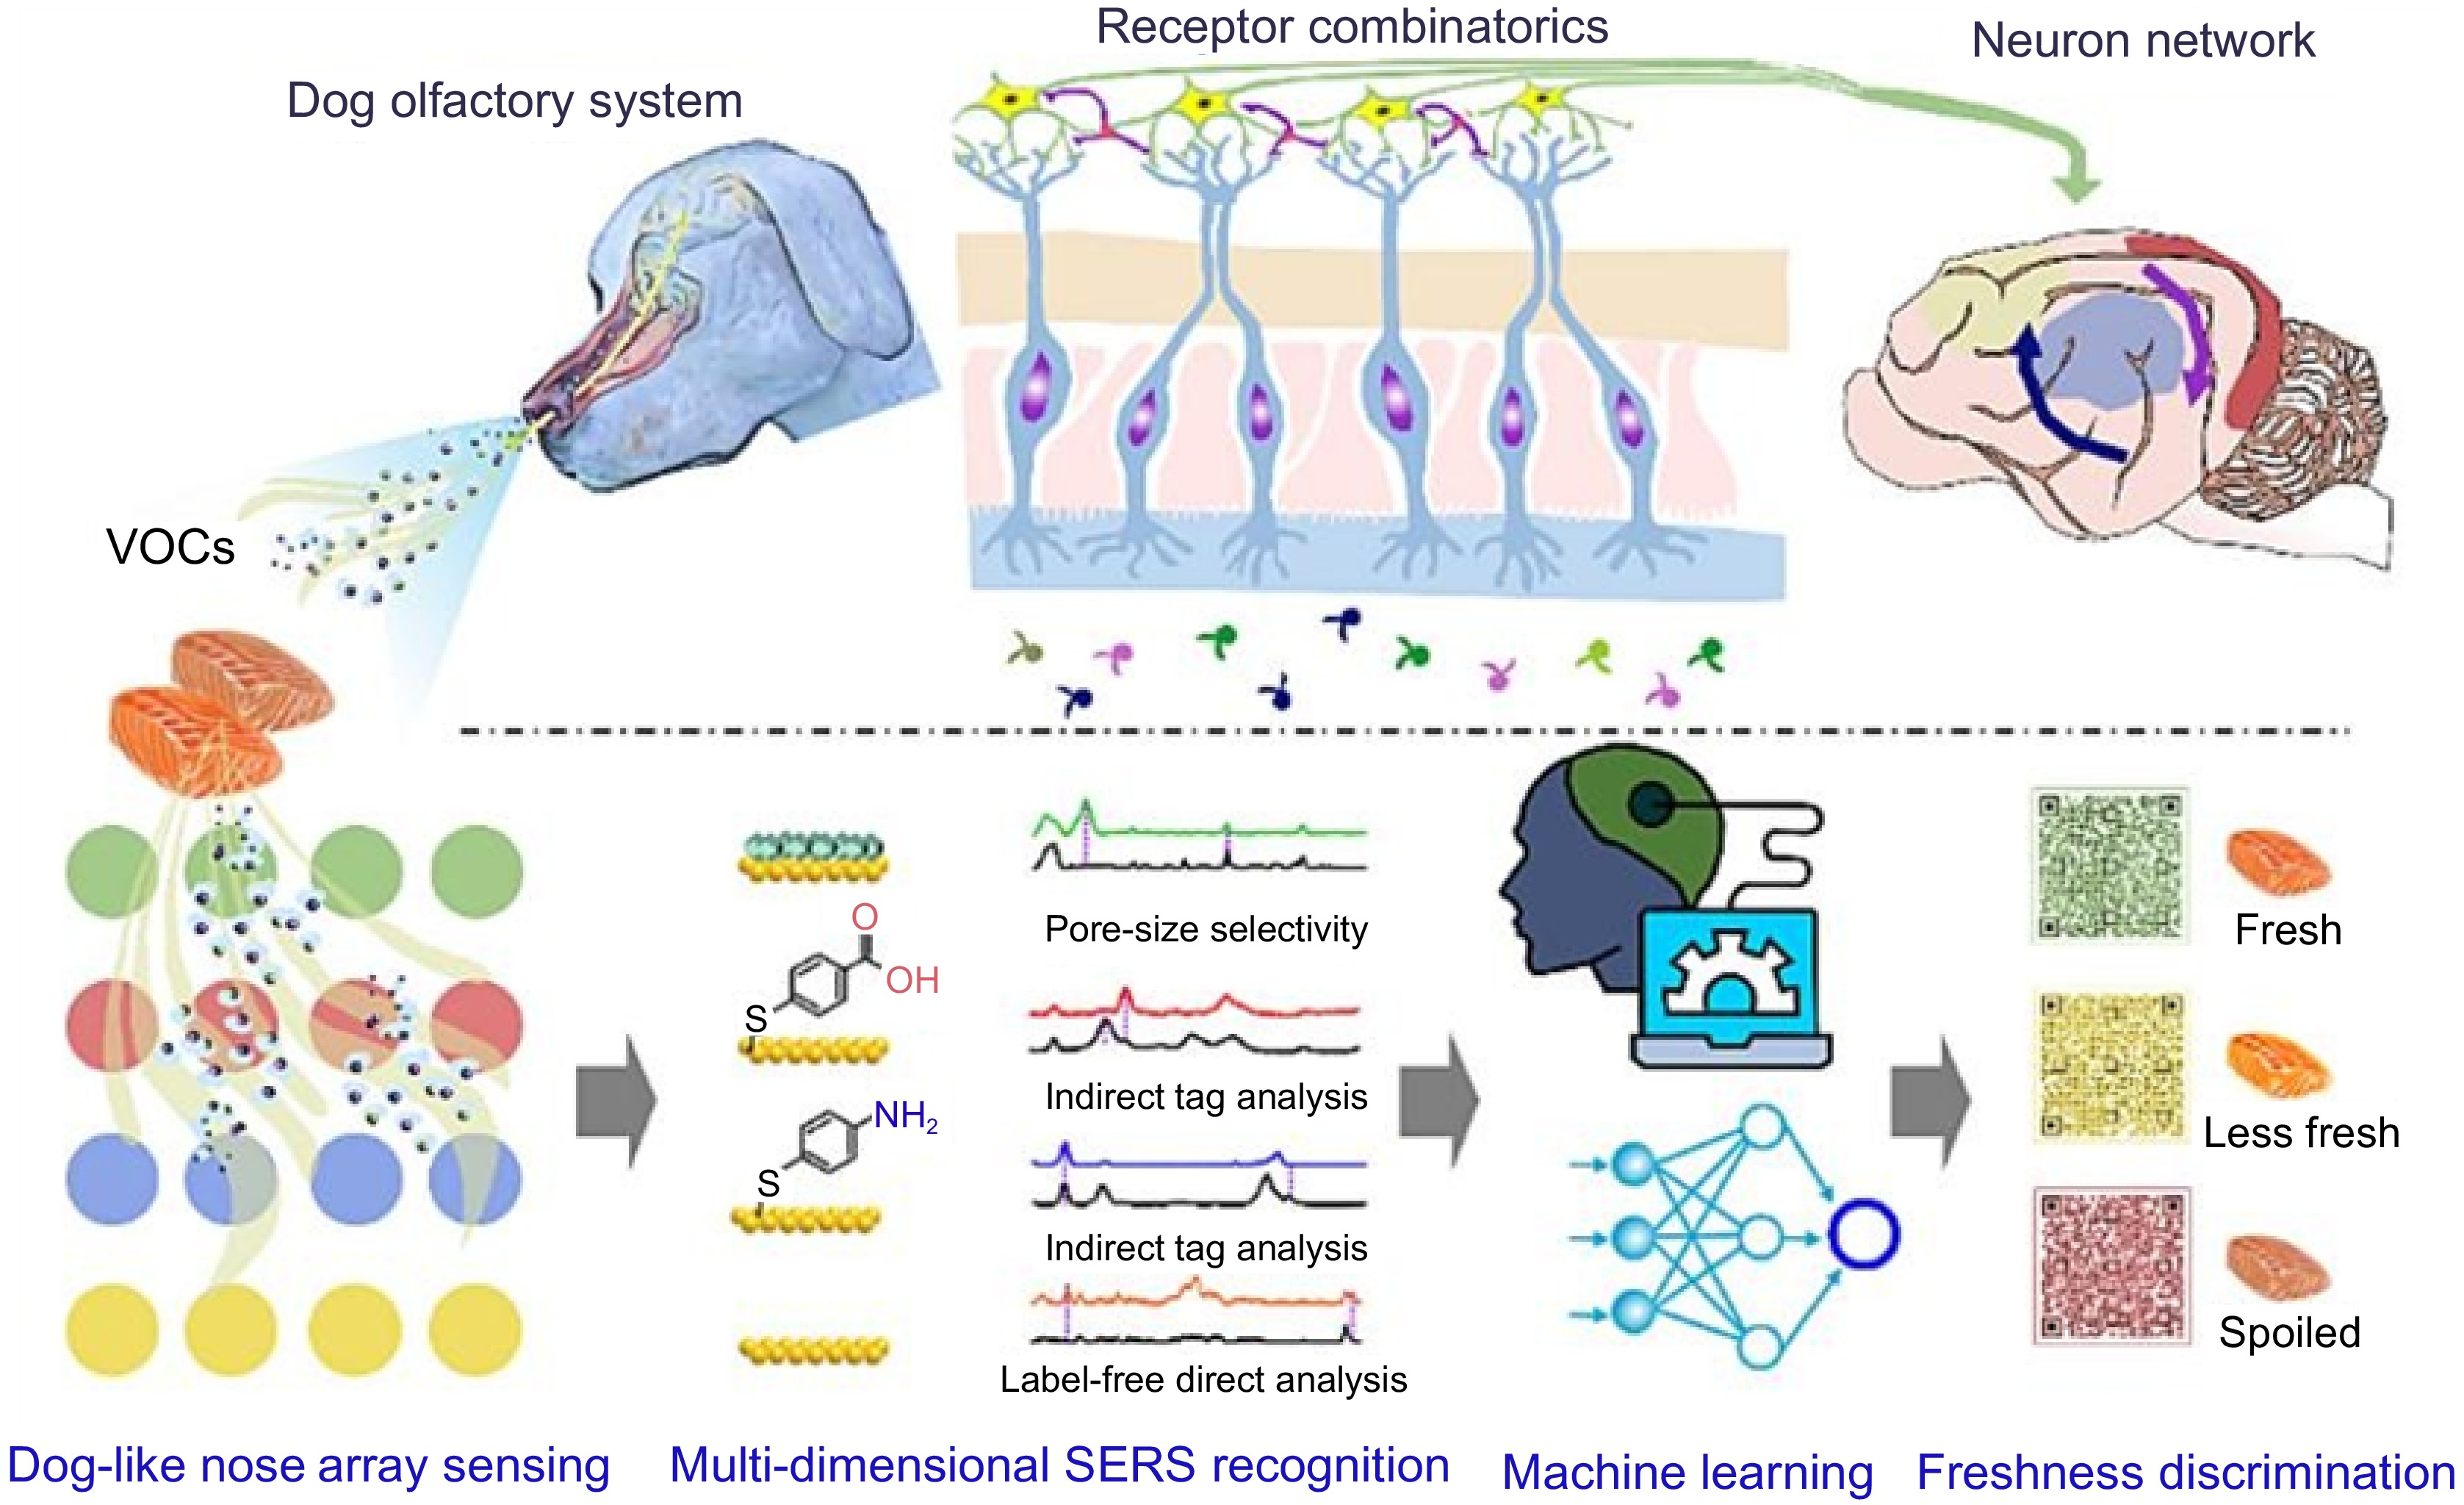
Figure 7.
Schematic diagram of a scalable plasma array gas sensor for multi-dimensional SERS recognition[166].
-
Detection object SERS substrate Method LOD Ref. Foodborne pathogens E. coli O157:H7 AgNPs SERS-SCIS 1.35 CFU/mL [84] E. coli O157:H7 AuNPs SERS 10 CFU/mL [85] Salmonella typhimurium AgNPs SERS-SVM / [89] Salmonella typhimurium and Staphylococcus aureus pAu/G SERS-Python / [90] Foodborne viruses H5N1 AgNPs SERS 5.0 × 10⁻⁶ TCID50/mL [97] H3N2 AuNPs SERS 102 TCID50/mL [98] HAdV, H1N1 AgNPs SERS-LFIA 10, 50 PFU/mL [99] Veterinary drug residues Benzylpenicillin potassium AuNPs SERS / [105] Tetracycline OTR202-OTR103 SERS-air PLS 1.120 mg/L [106] Marbofloxacin AgNPs SERS 1.7 nmol/L [107] Nitroimidazoles AuNPs SERS-TLC 0.1 mg/L [108] Multiple veterinary drugs Au@AgNPs SERS-LFA 0.52–6.2 pg/mL [109] Food additives Nitrite ions AgNPs SERS 0.51 μg/L [118] Nitrite AgNPs SERS 15.29 ng/L [120] Sodium nitrite AuNPs SERS 3.75–8.11 mg/kg [121] Illegal additives Acid orange II AuNPs SERS-DFT 1 μg/mL [127] Ractopamine AgNPs SERS 10−8 mol/L [131] Clenbuterol Au/AuNS SERS-LFIA 0.05 ng/mL [134] Biotoxin Botulinum neurotoxin type A AgNPs SERS 2.4 ng/mL [139] Botulinum toxins A and B AuNPs SERS 5.7 ng/mL (A), 1.3 ng/mL (B) [140] BoNT/A AuNPs SERS-LFIA 0.1 ng/mL [141] Table 1.
Applications of SERS in detection of meat hazards and additives.
Figures
(7)
Tables
(1)