-

Figure 1.
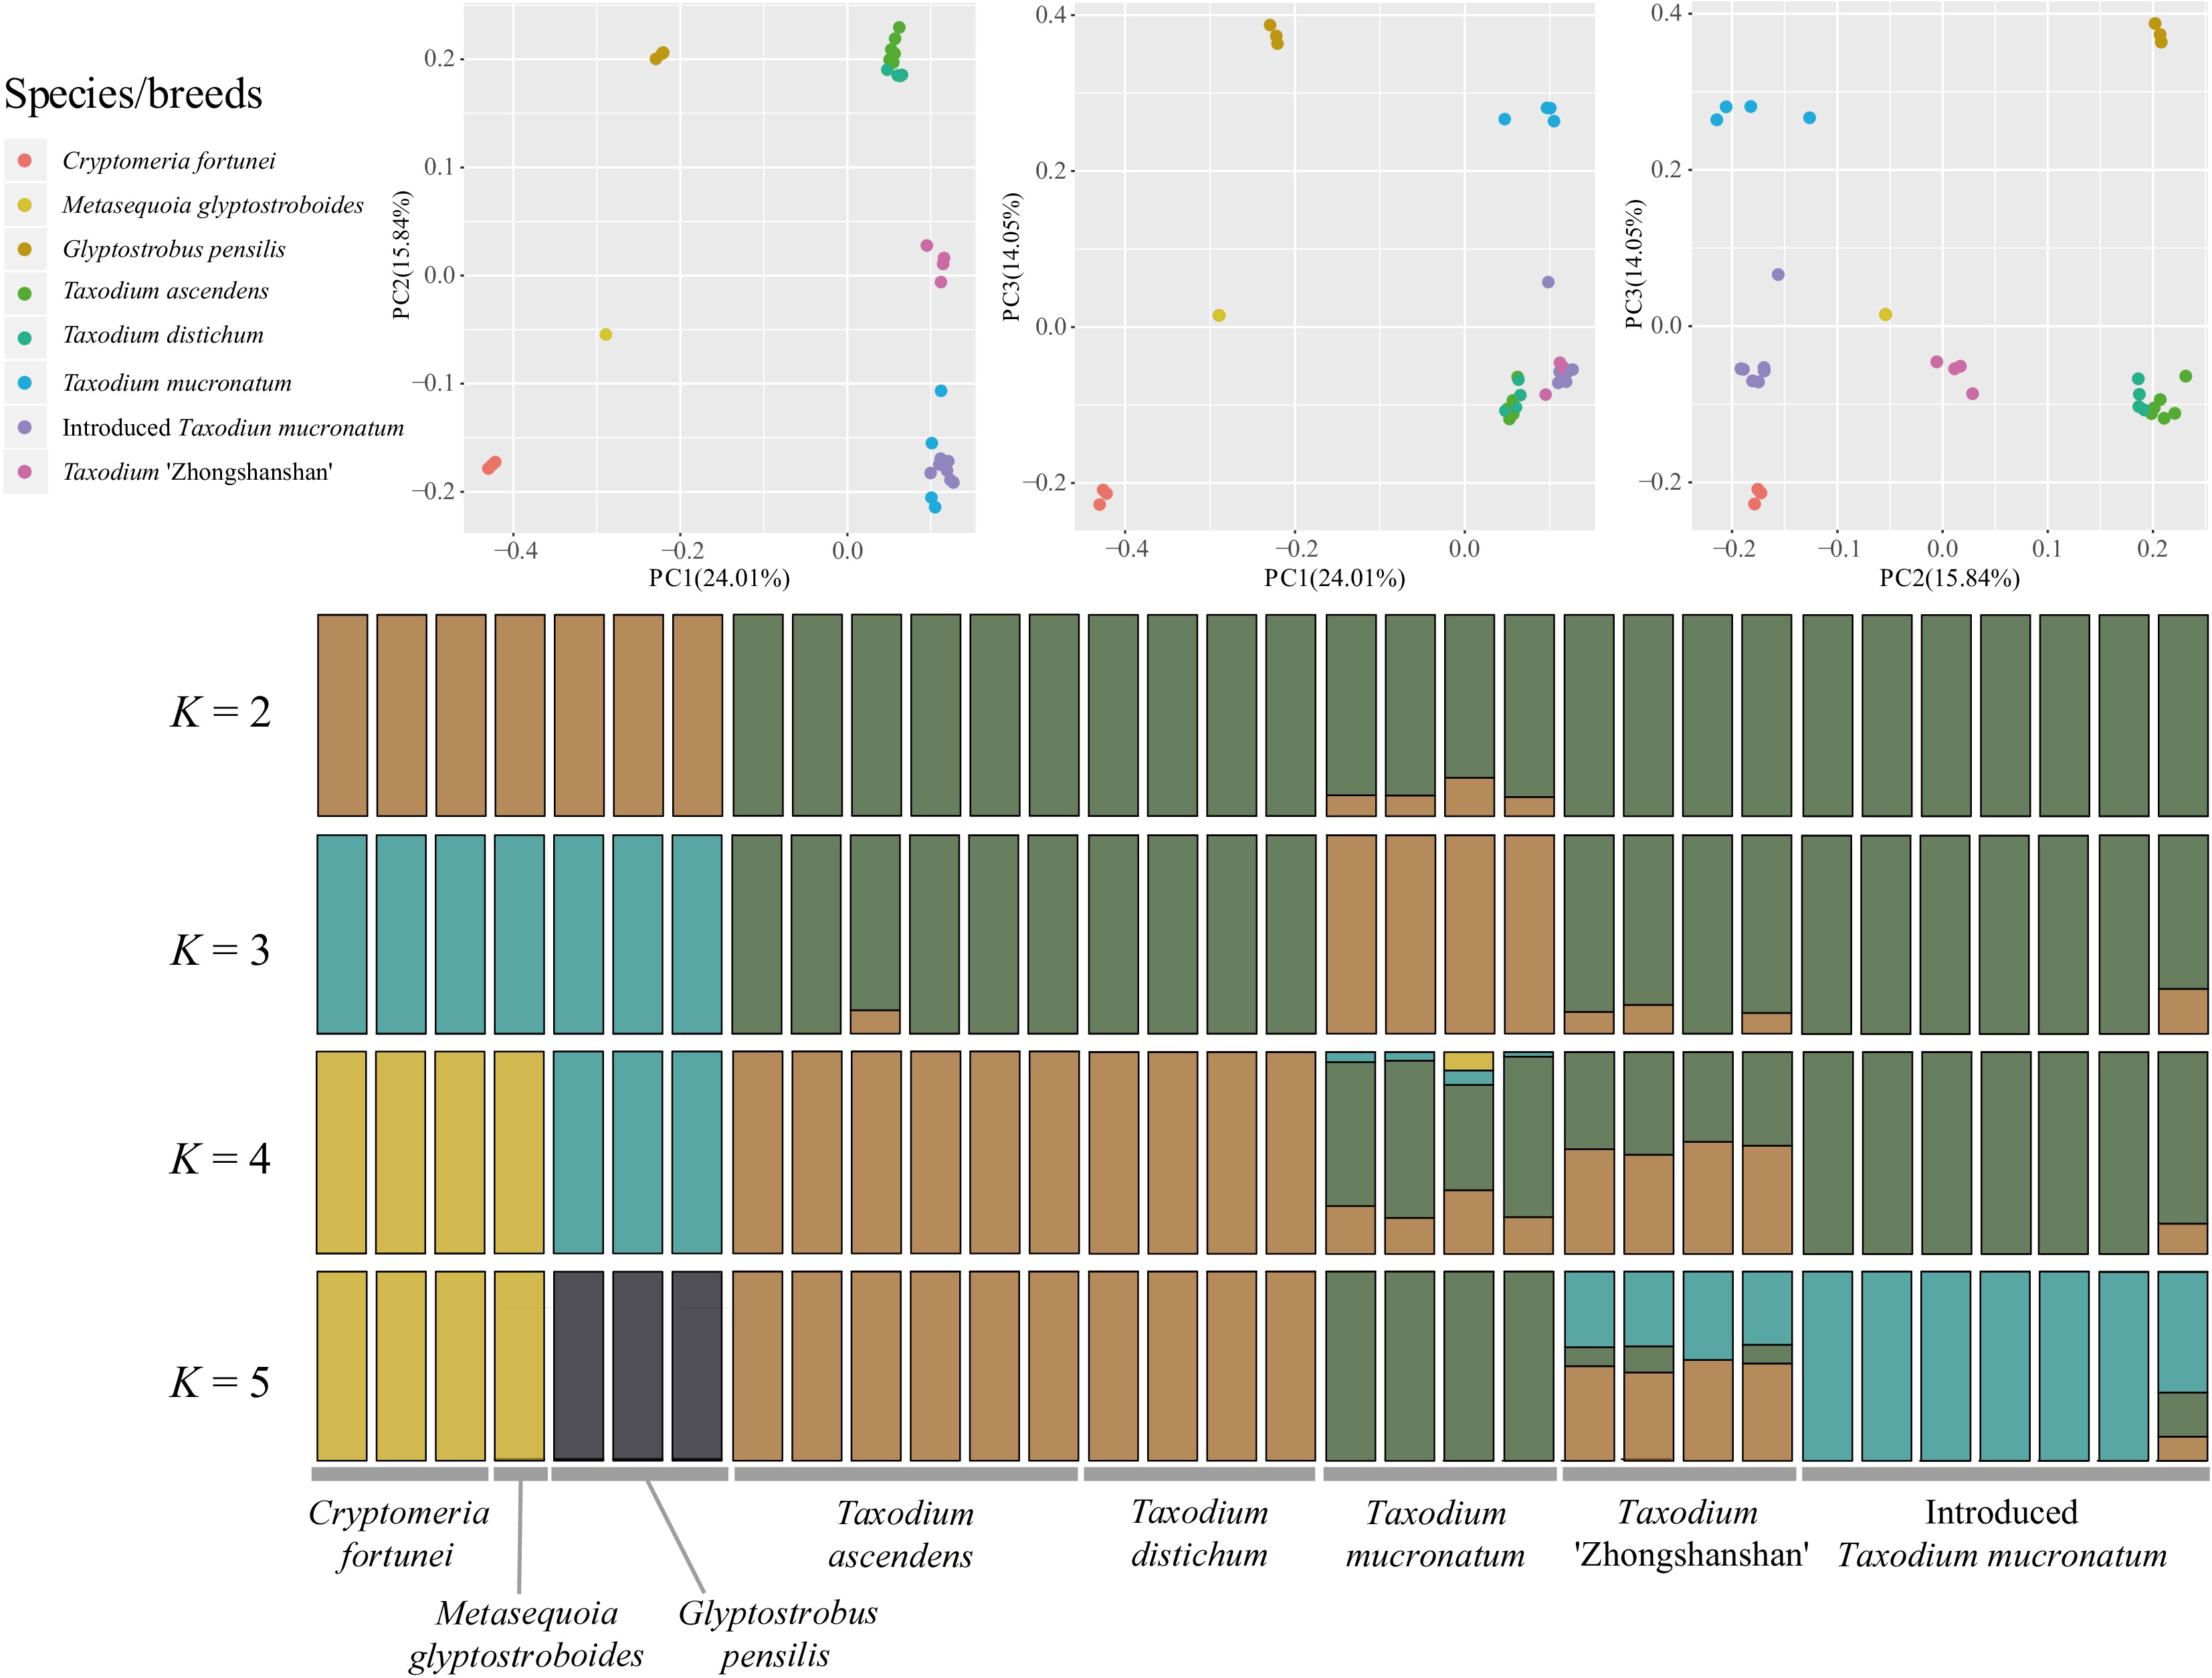
Population structure analysis with PCA and ADMIXTURE. Principal component analysis (PCA) of the seven taxa involved for 2,752,534 nuclear SNPs. The first and the second eigenvectors separated G. pensilis, M. glyptostroboides, and C. fortunei from the Taxodium (including ITM; p = 0.0252, 0.0113 and 0.0004 separately, Tracy-Widom test). The third eigenvector segregated each species/breed within Taxodium (p = 3.47026e-08). Genetic clustering of species and cultivars inferred by ADMIXTURE. Simulations were set at 1,000 bootstraps. Each individual is represented by a thin vertical bar, which is partitioned into K-colored segments and represents the individual affiliation to each cluster (K is set from 2 to 10). Delta K = 2 and K = 4 are the two peak values according to cross-validation analysis.
-

Figure 2.
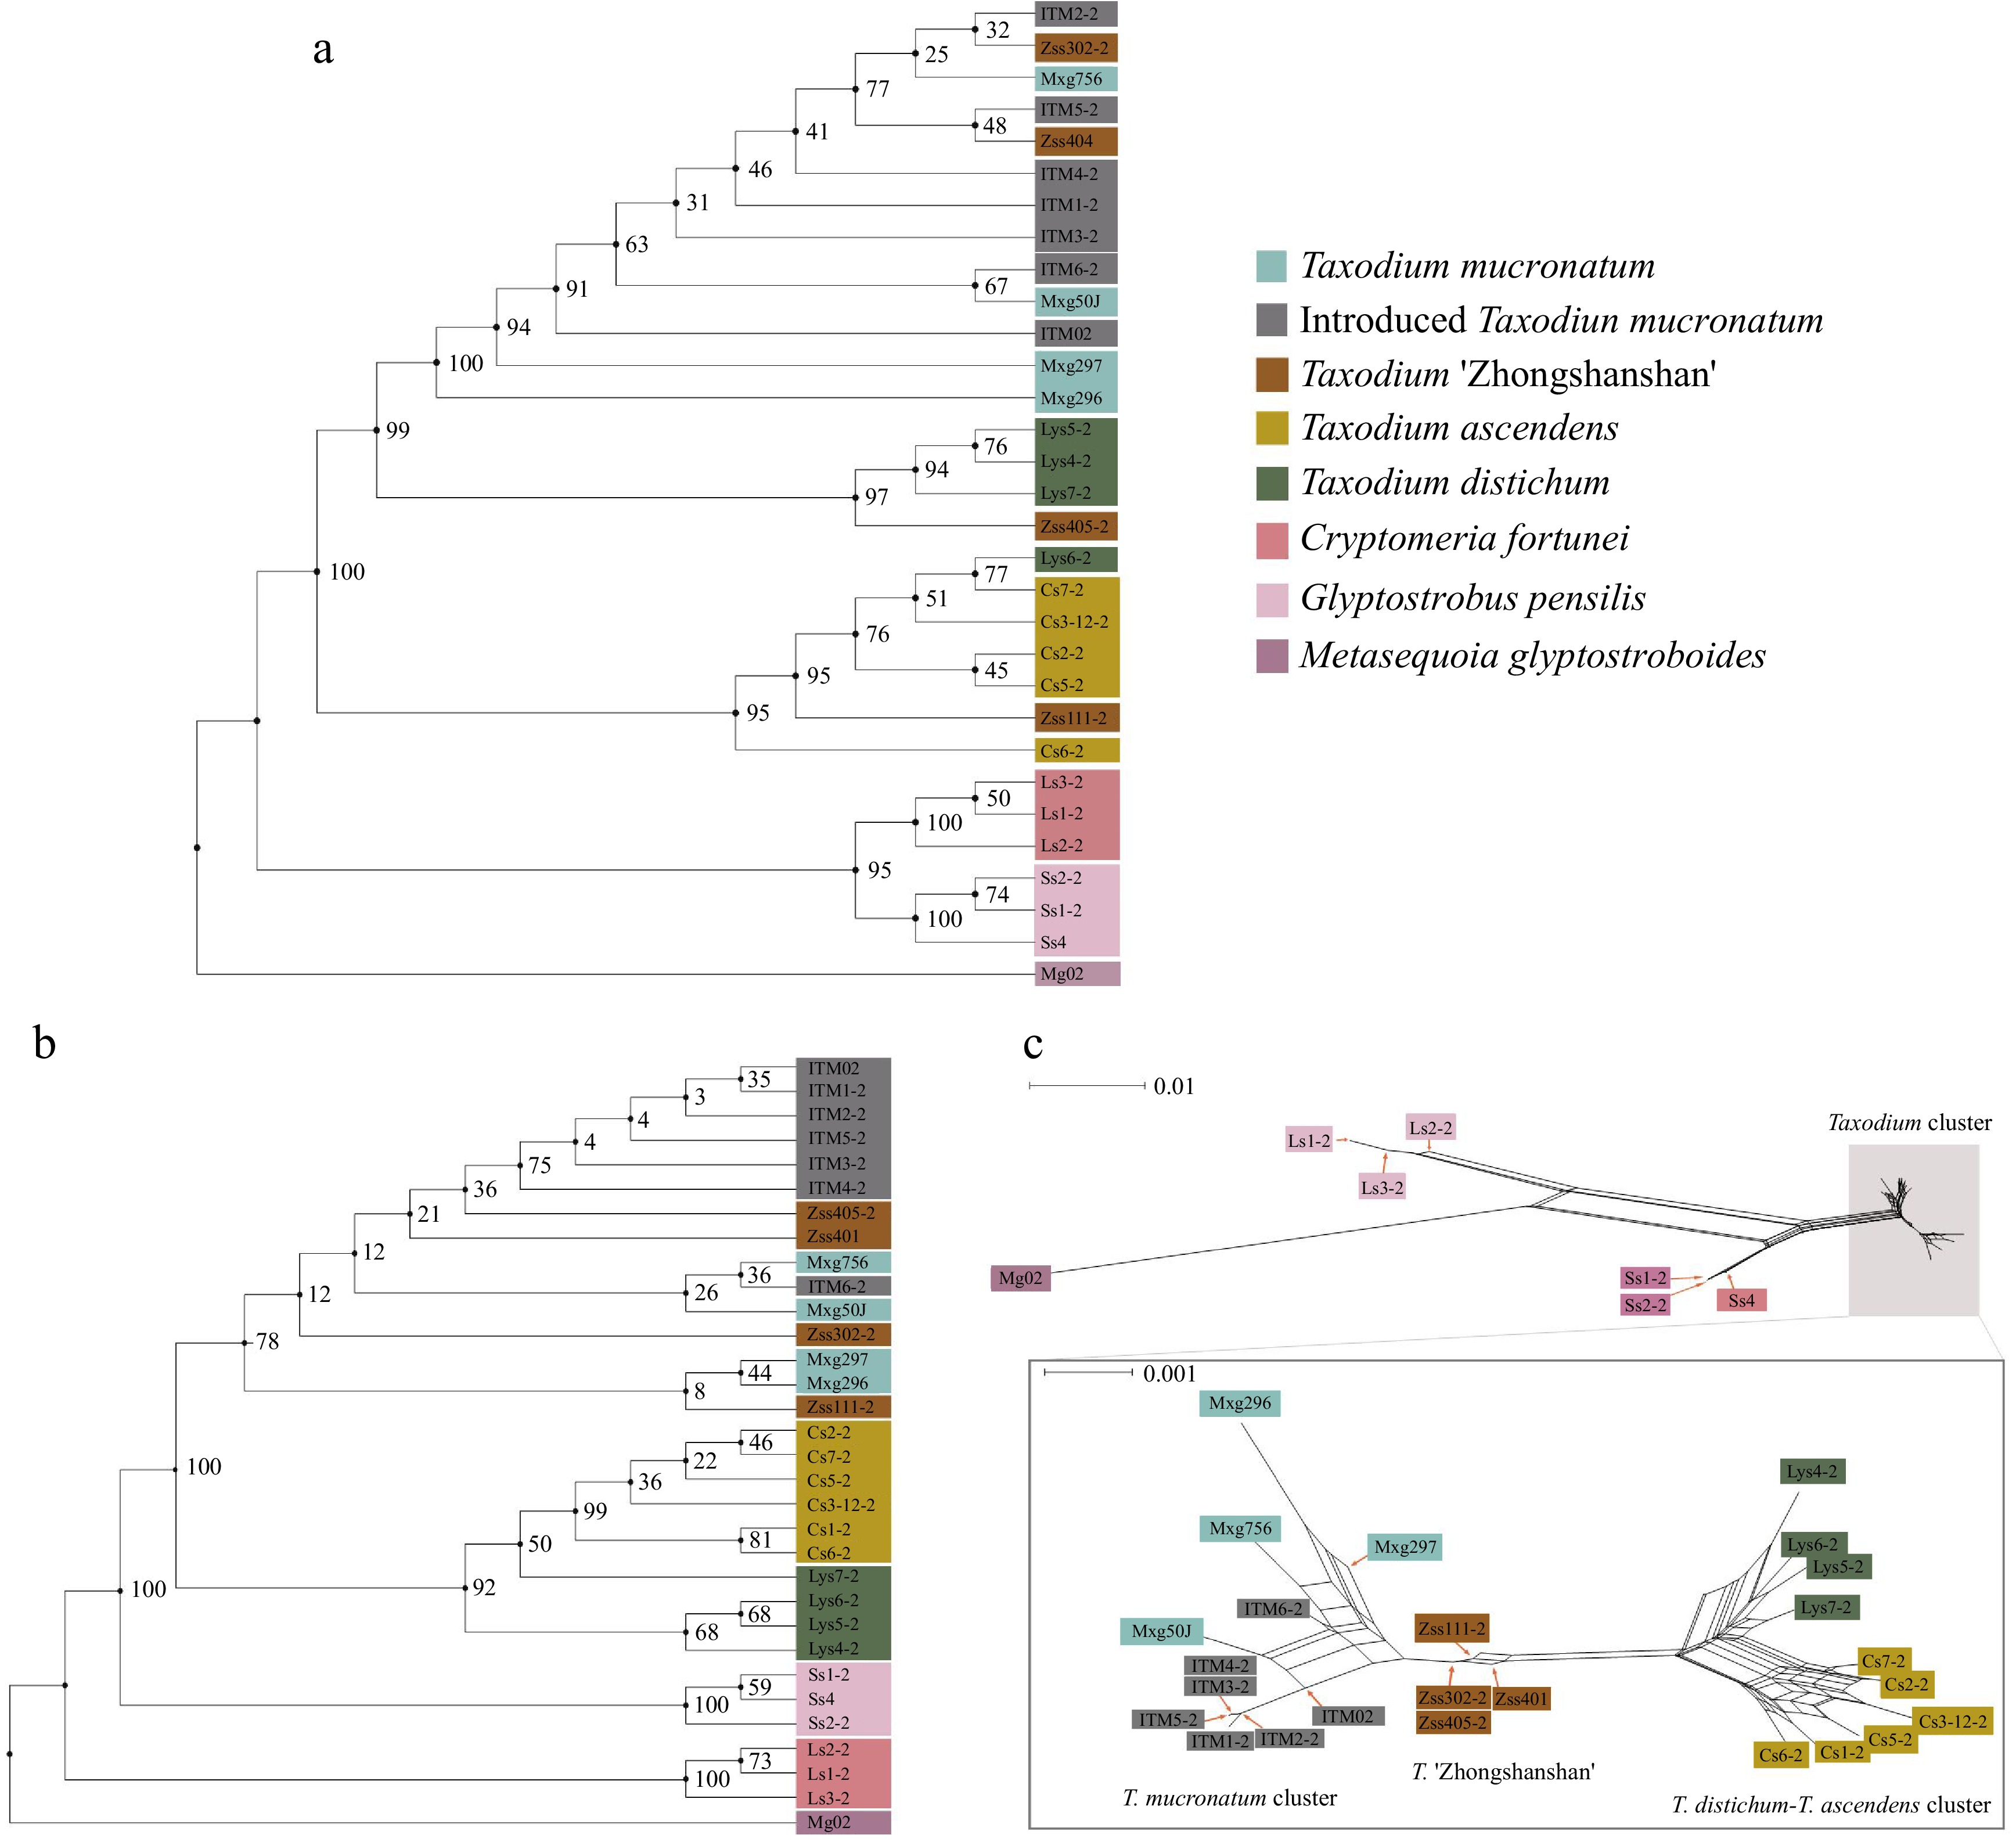
Phylogenetic and neighbour-net analyses. Colour represents the population. Branch labels are bootstrap support values from 1,000 replicates. (a) ML tree based on 6,901 chloroplast SNPs. (b) Maximum Likelihood tree based on 2,752,534 nuclear SNPs. (c) Results of neighbour-net analysis based on 2,752,534 nuclear SNPs, with a zoomed-in view of the Taxodium cluster in the lower half. All species and cultivars are highlighted in different colours, and the length of the lines indicates the distance among clusters/individuals.
-

Figure 3.
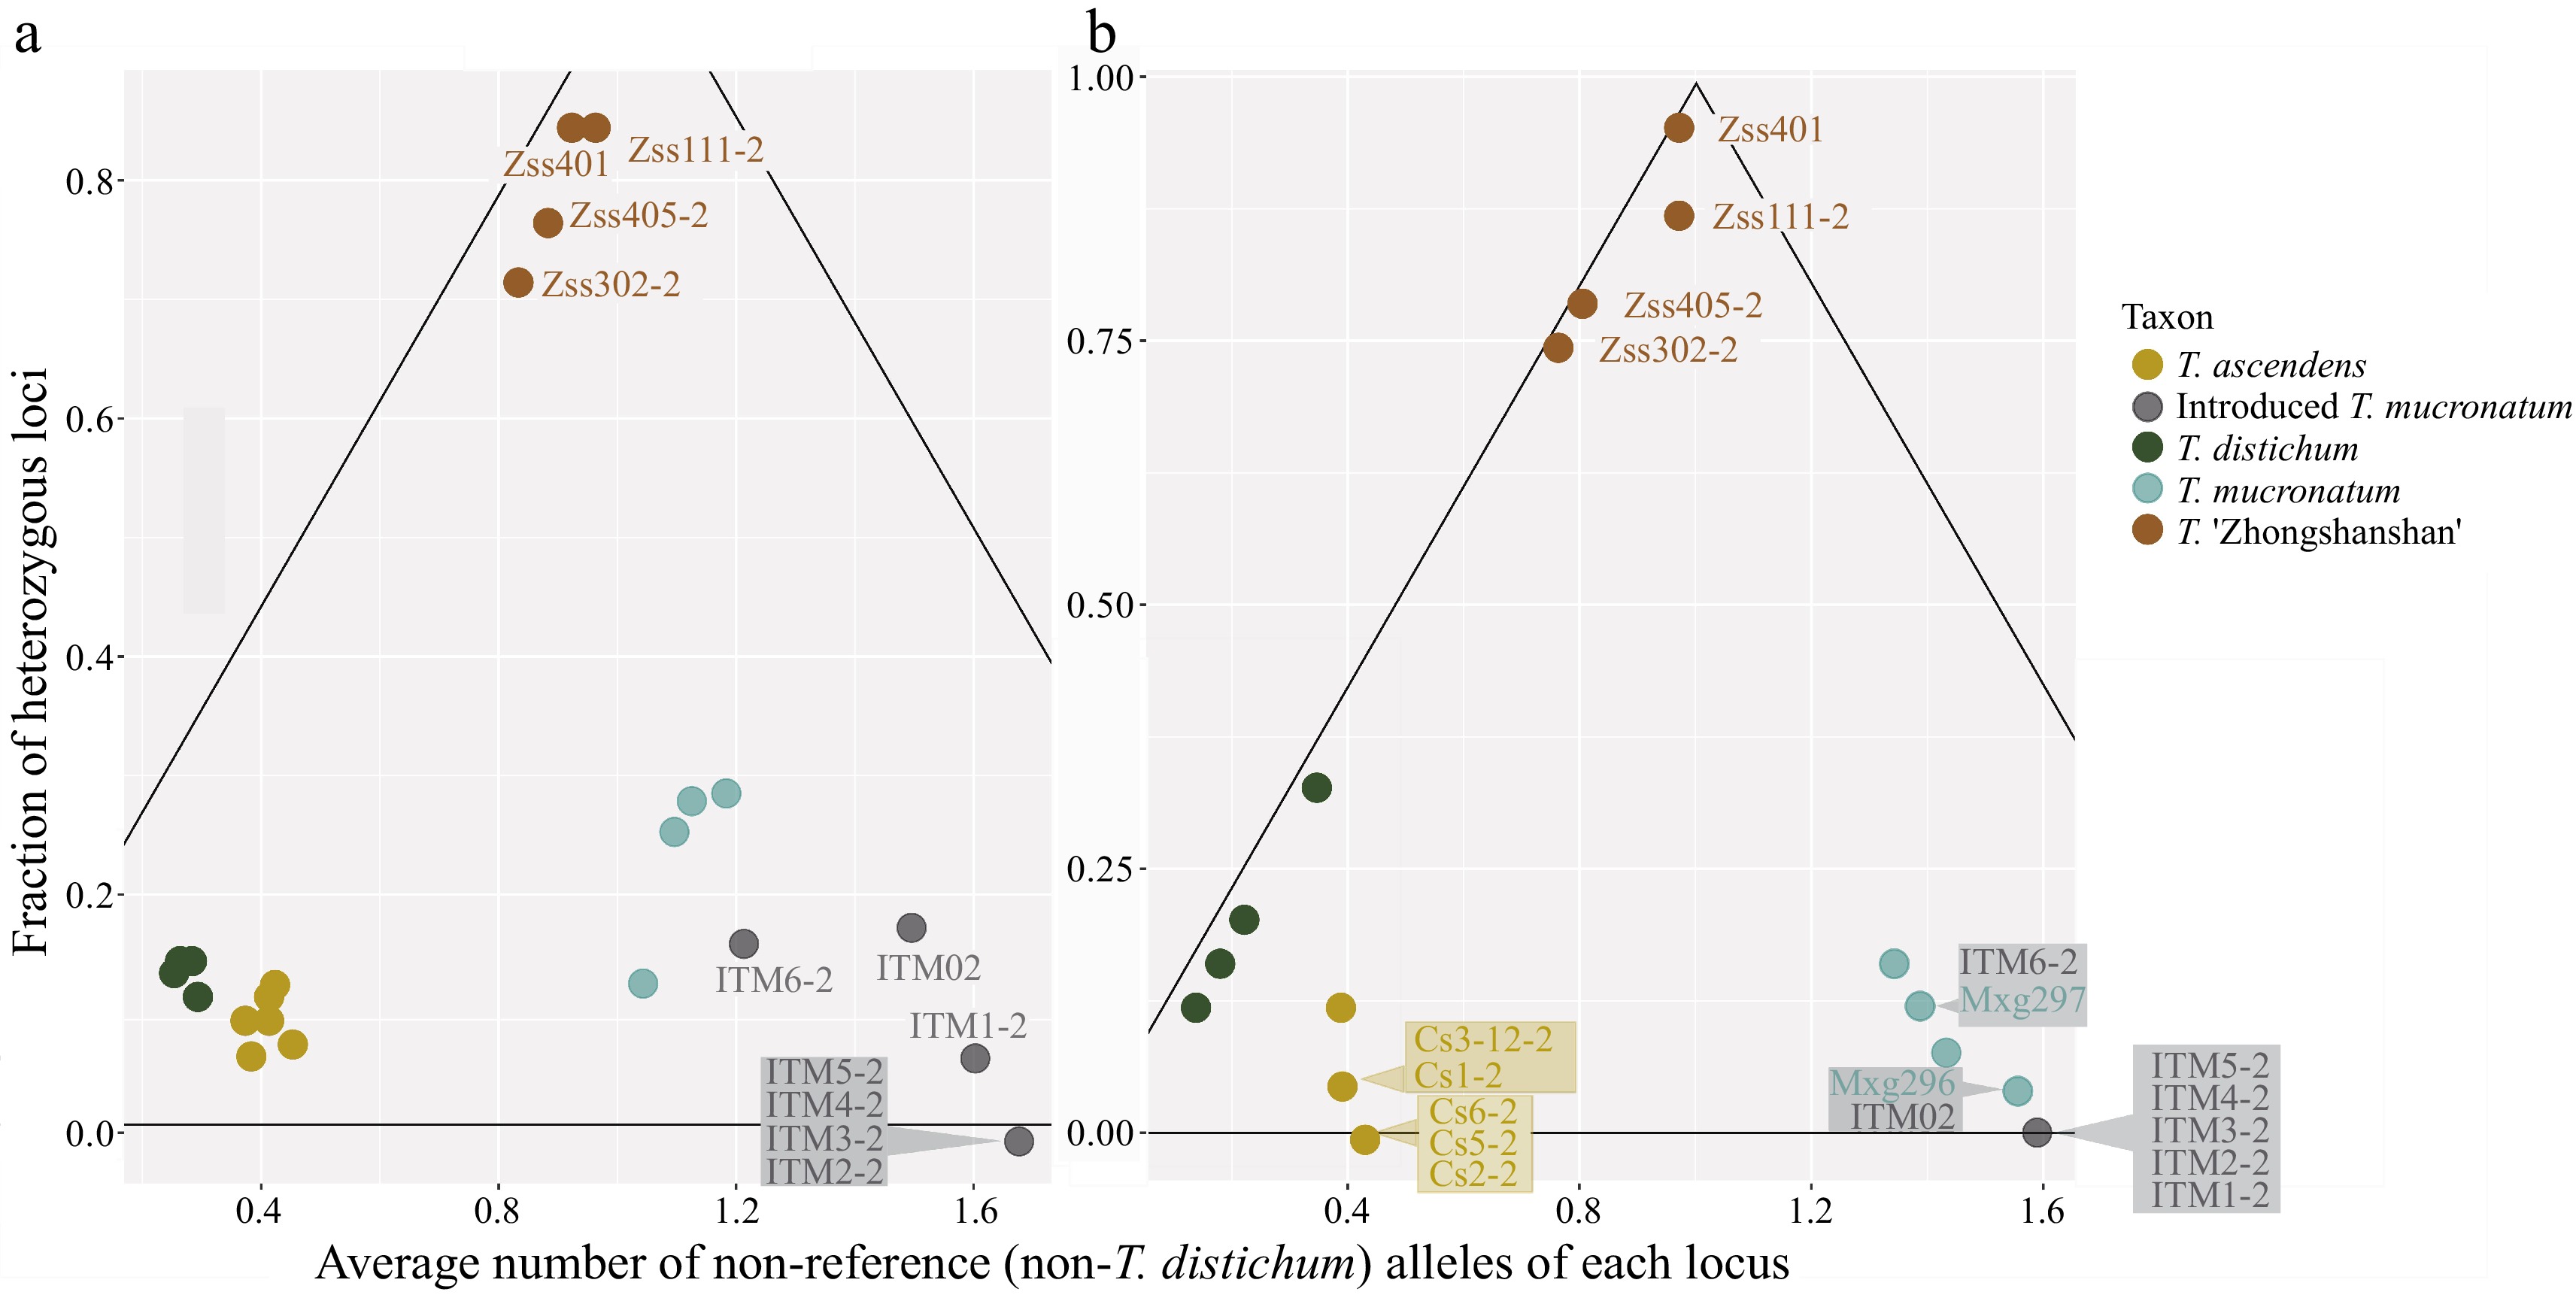
Detection of recent hybridization (DRH) analysis. Each dot represents an individual, and the colour shows the taxon. Hybrid individuals and individuals with overlapping positions are labelled. The black lines delineated the triangle formed a hybrid region, the vertex angle of which represents pure F1 generation and the base angles represent pure parents (one on each side). (a) DRH analysis based on the 100-SNP panel. (b) DRH analysis based on the 24-SNP panel.
-

Figure 4.
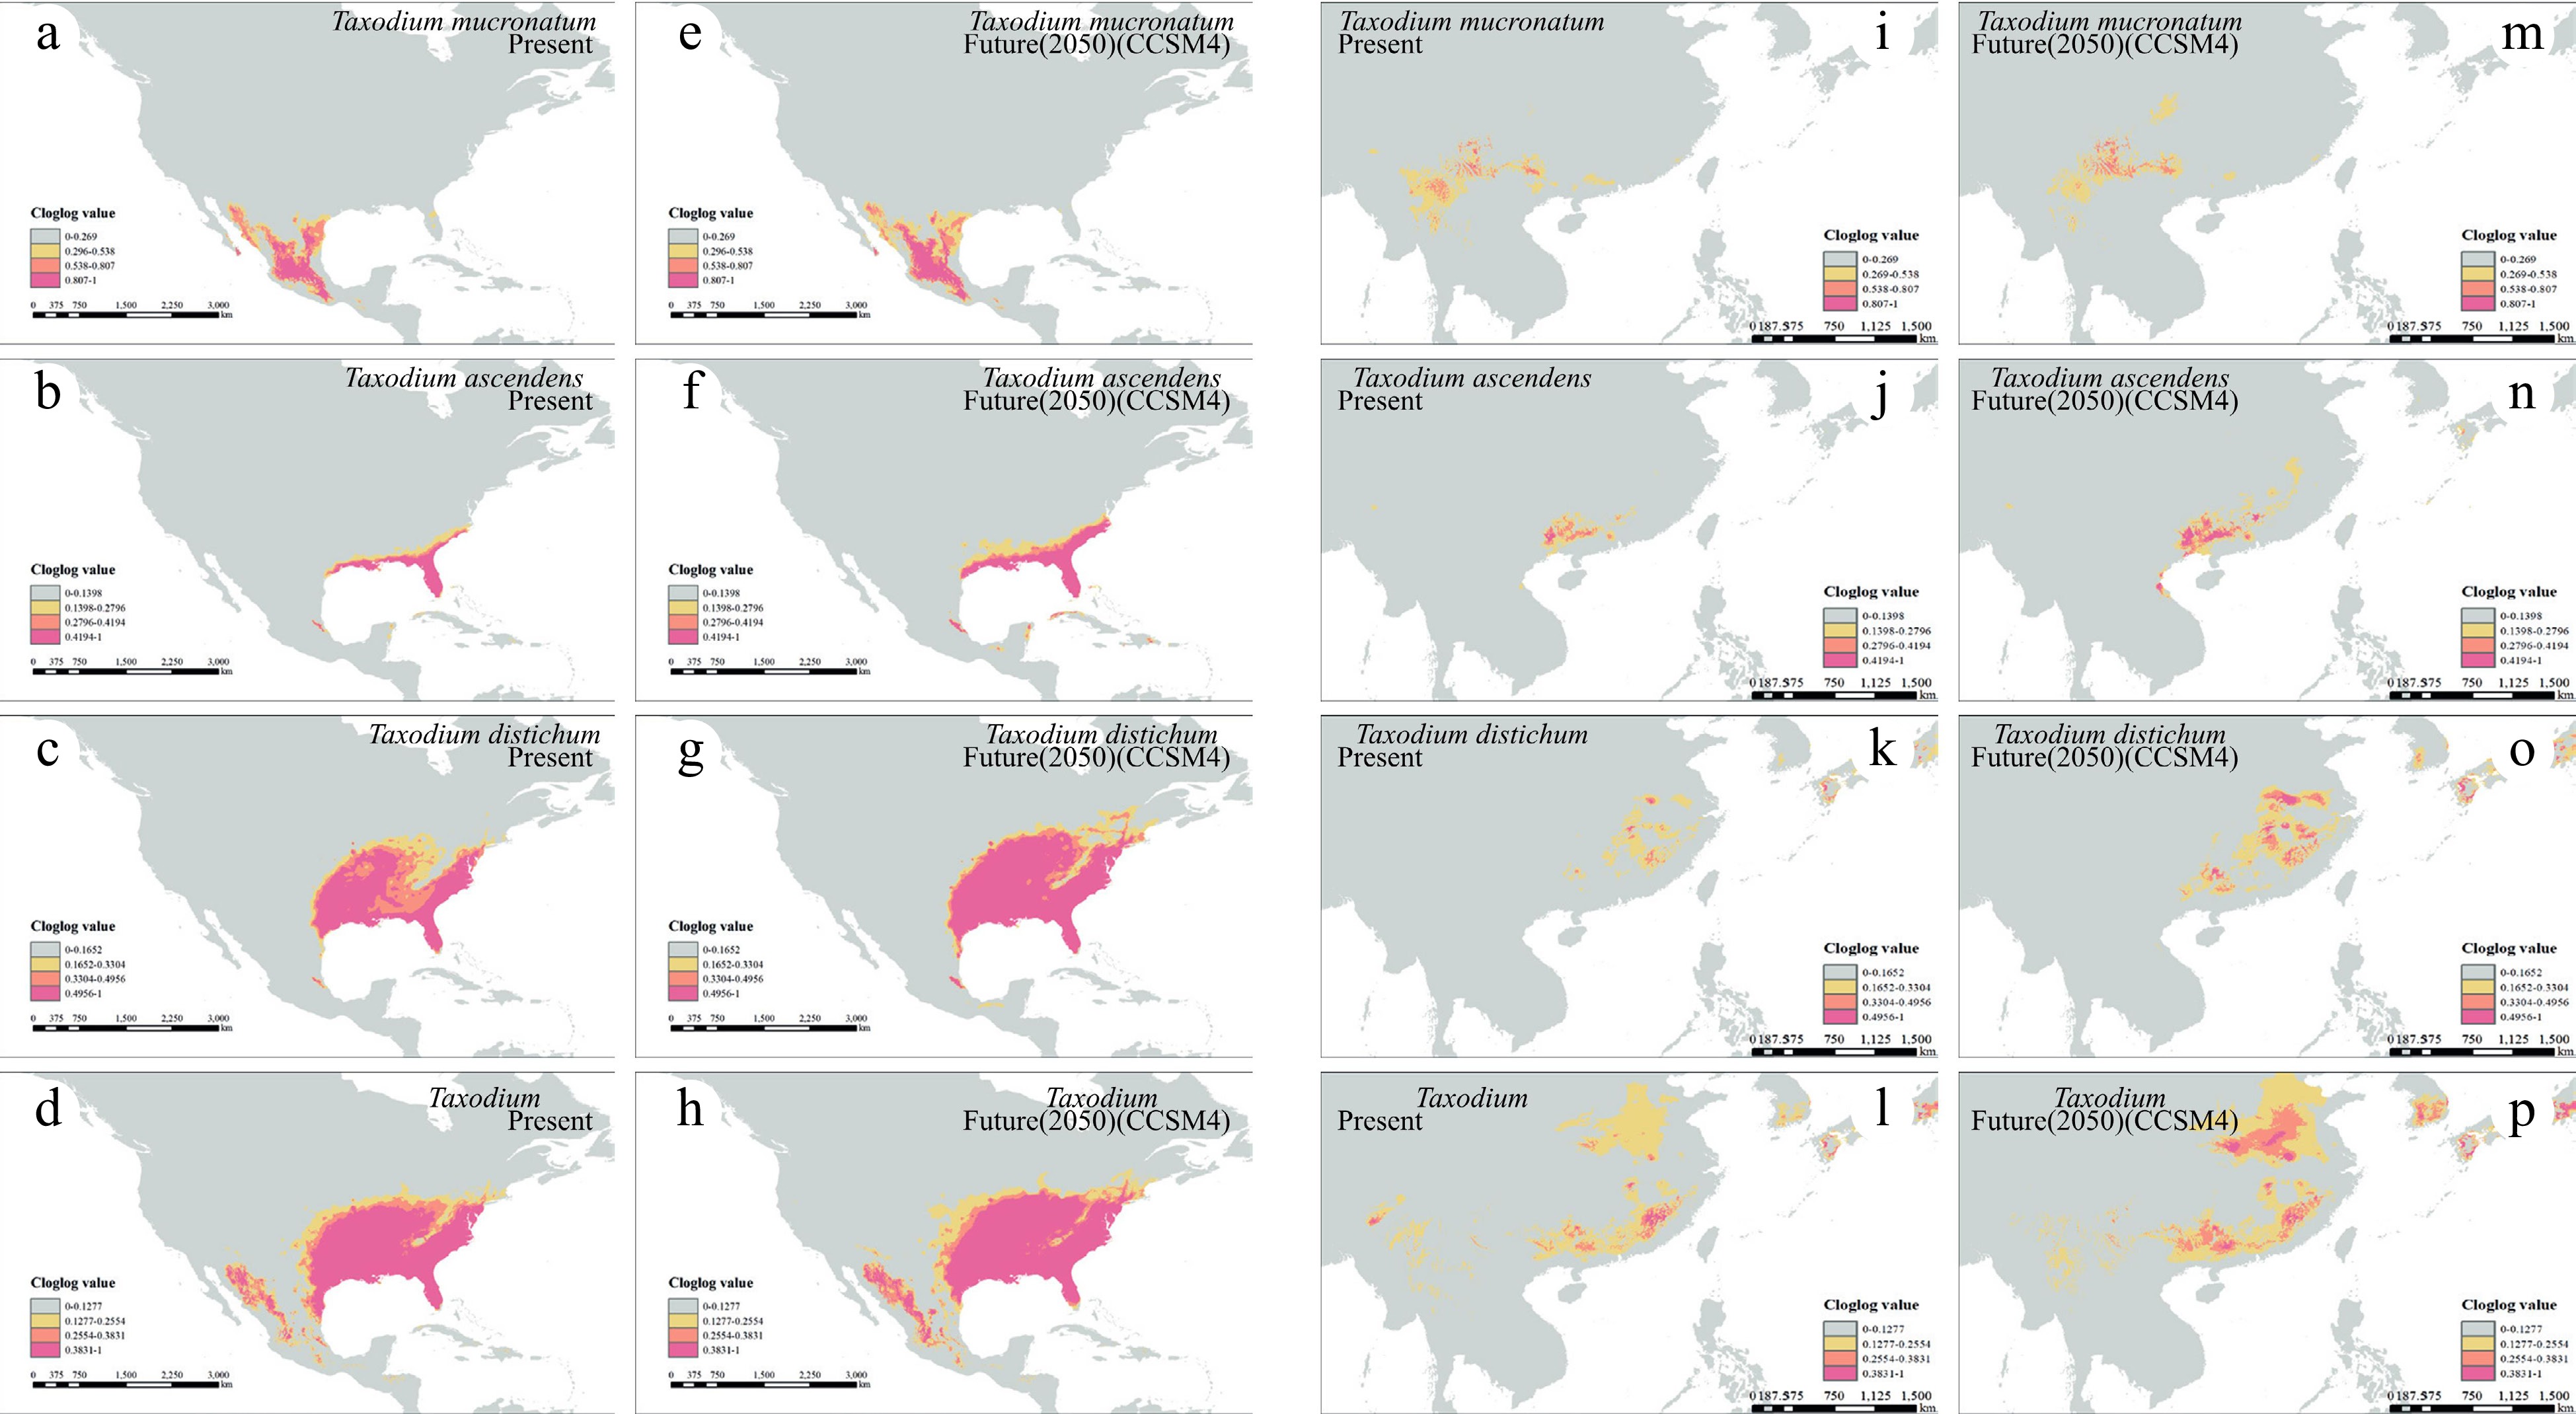
Species distribution modeling of the three Taxodium species in present and future 2050. (a)−(h) shows the native distribution of Taxodium species. (a)−(d) present the present distribution, and (e)−(h) for future 2050. Order in rows (a)−(d) represents T. mucronatum, T. ascendens, T. distichum, and the whole genus, respectively. The identical models' output was symmetrically projected to east coast Asia (i)−(p).
Figures
(4)
Tables
(0)