-

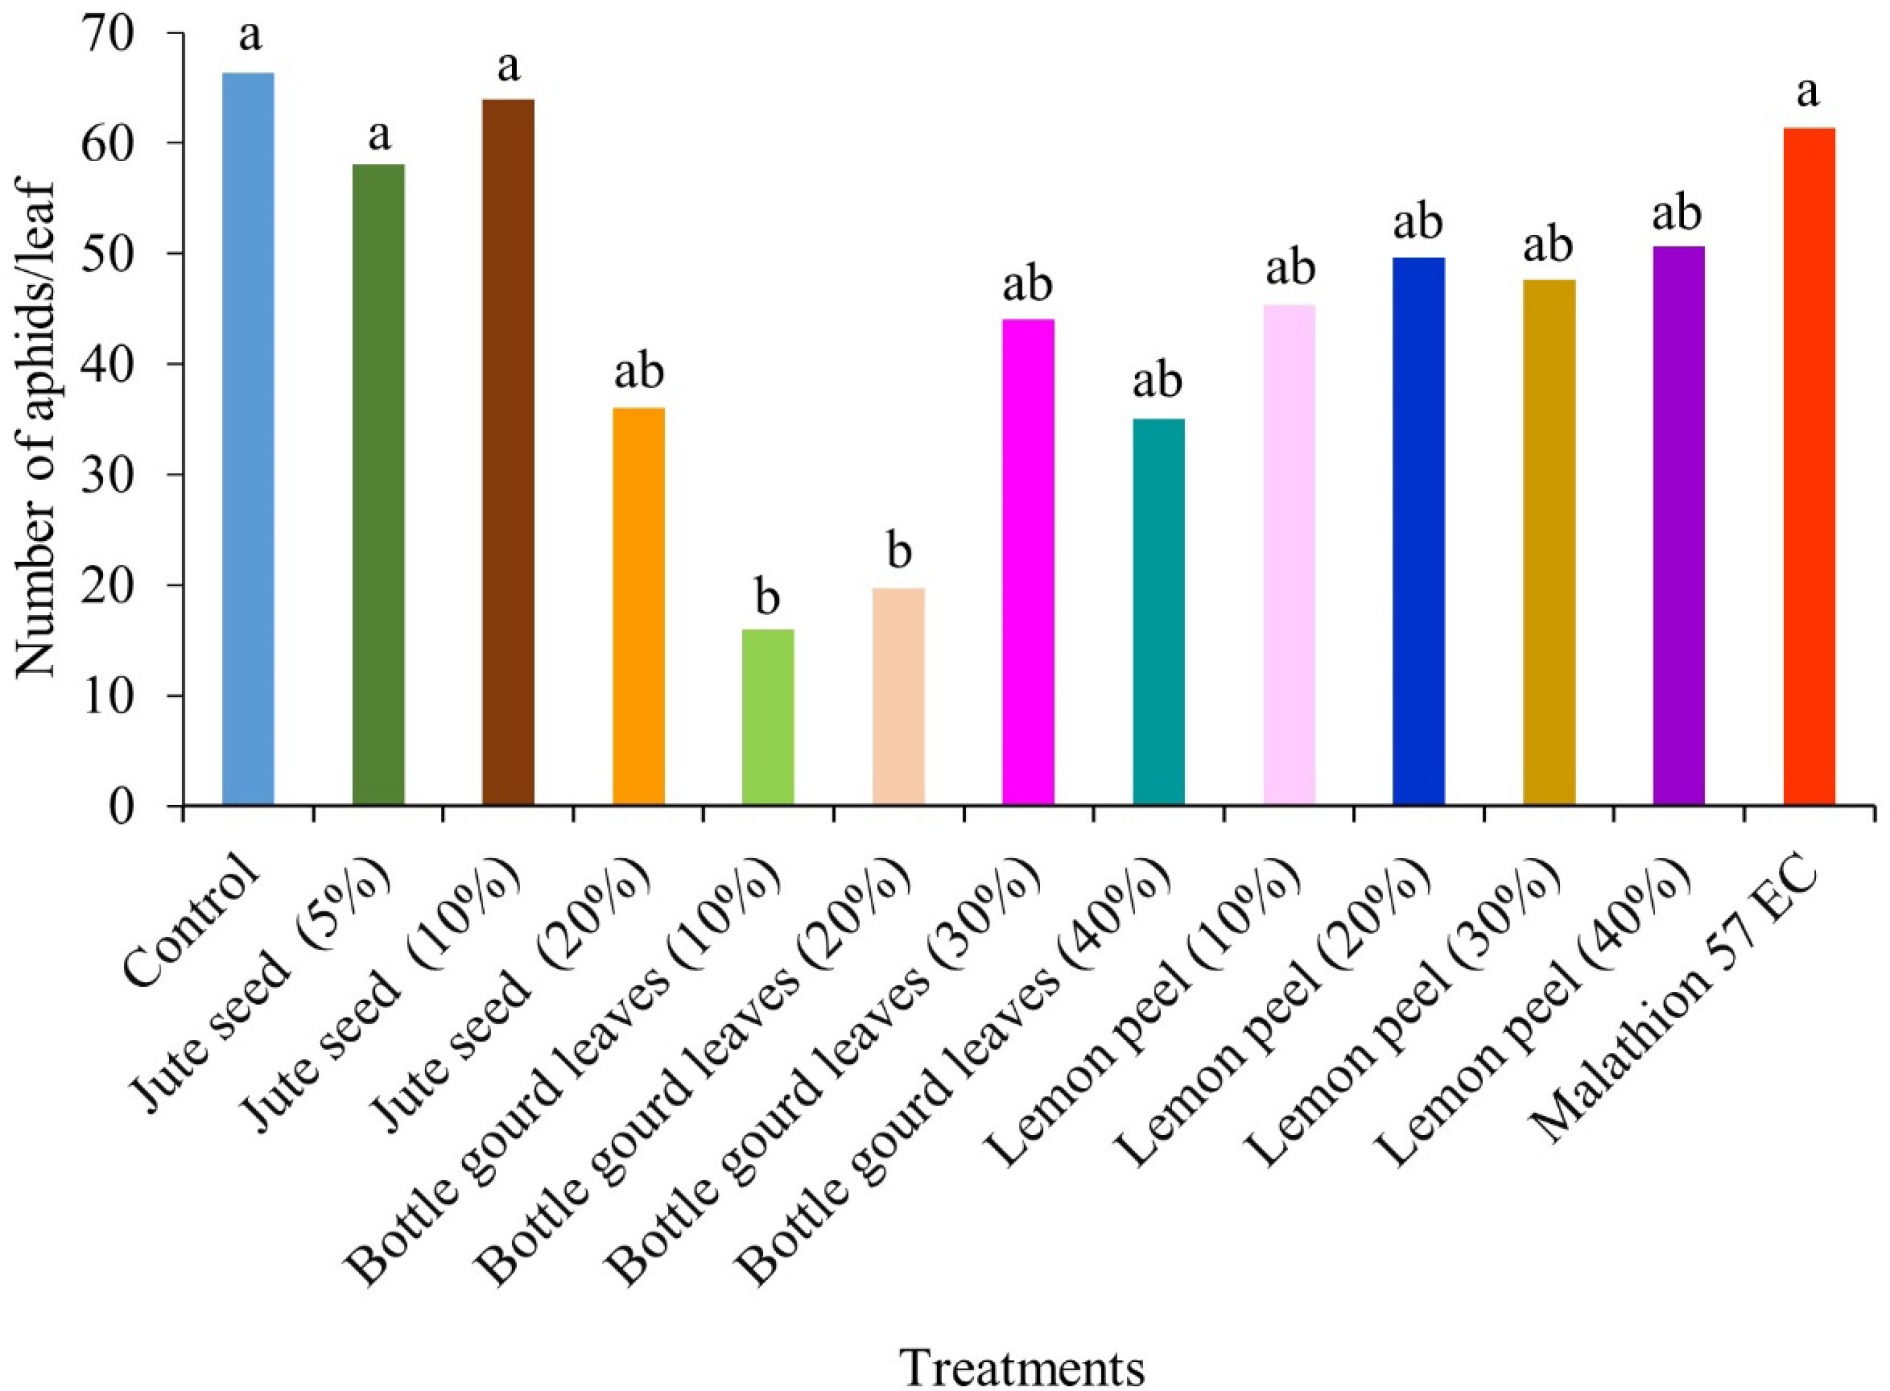
Figure 1.
Effect of plant extracts on the number of aphids/leaf on field grown cabbage at 45 DAT. Different letters within the same column indicate significant difference at p < 0.05; DAT= Days after transplanting; EC= Emulsifiable concentrate.
-

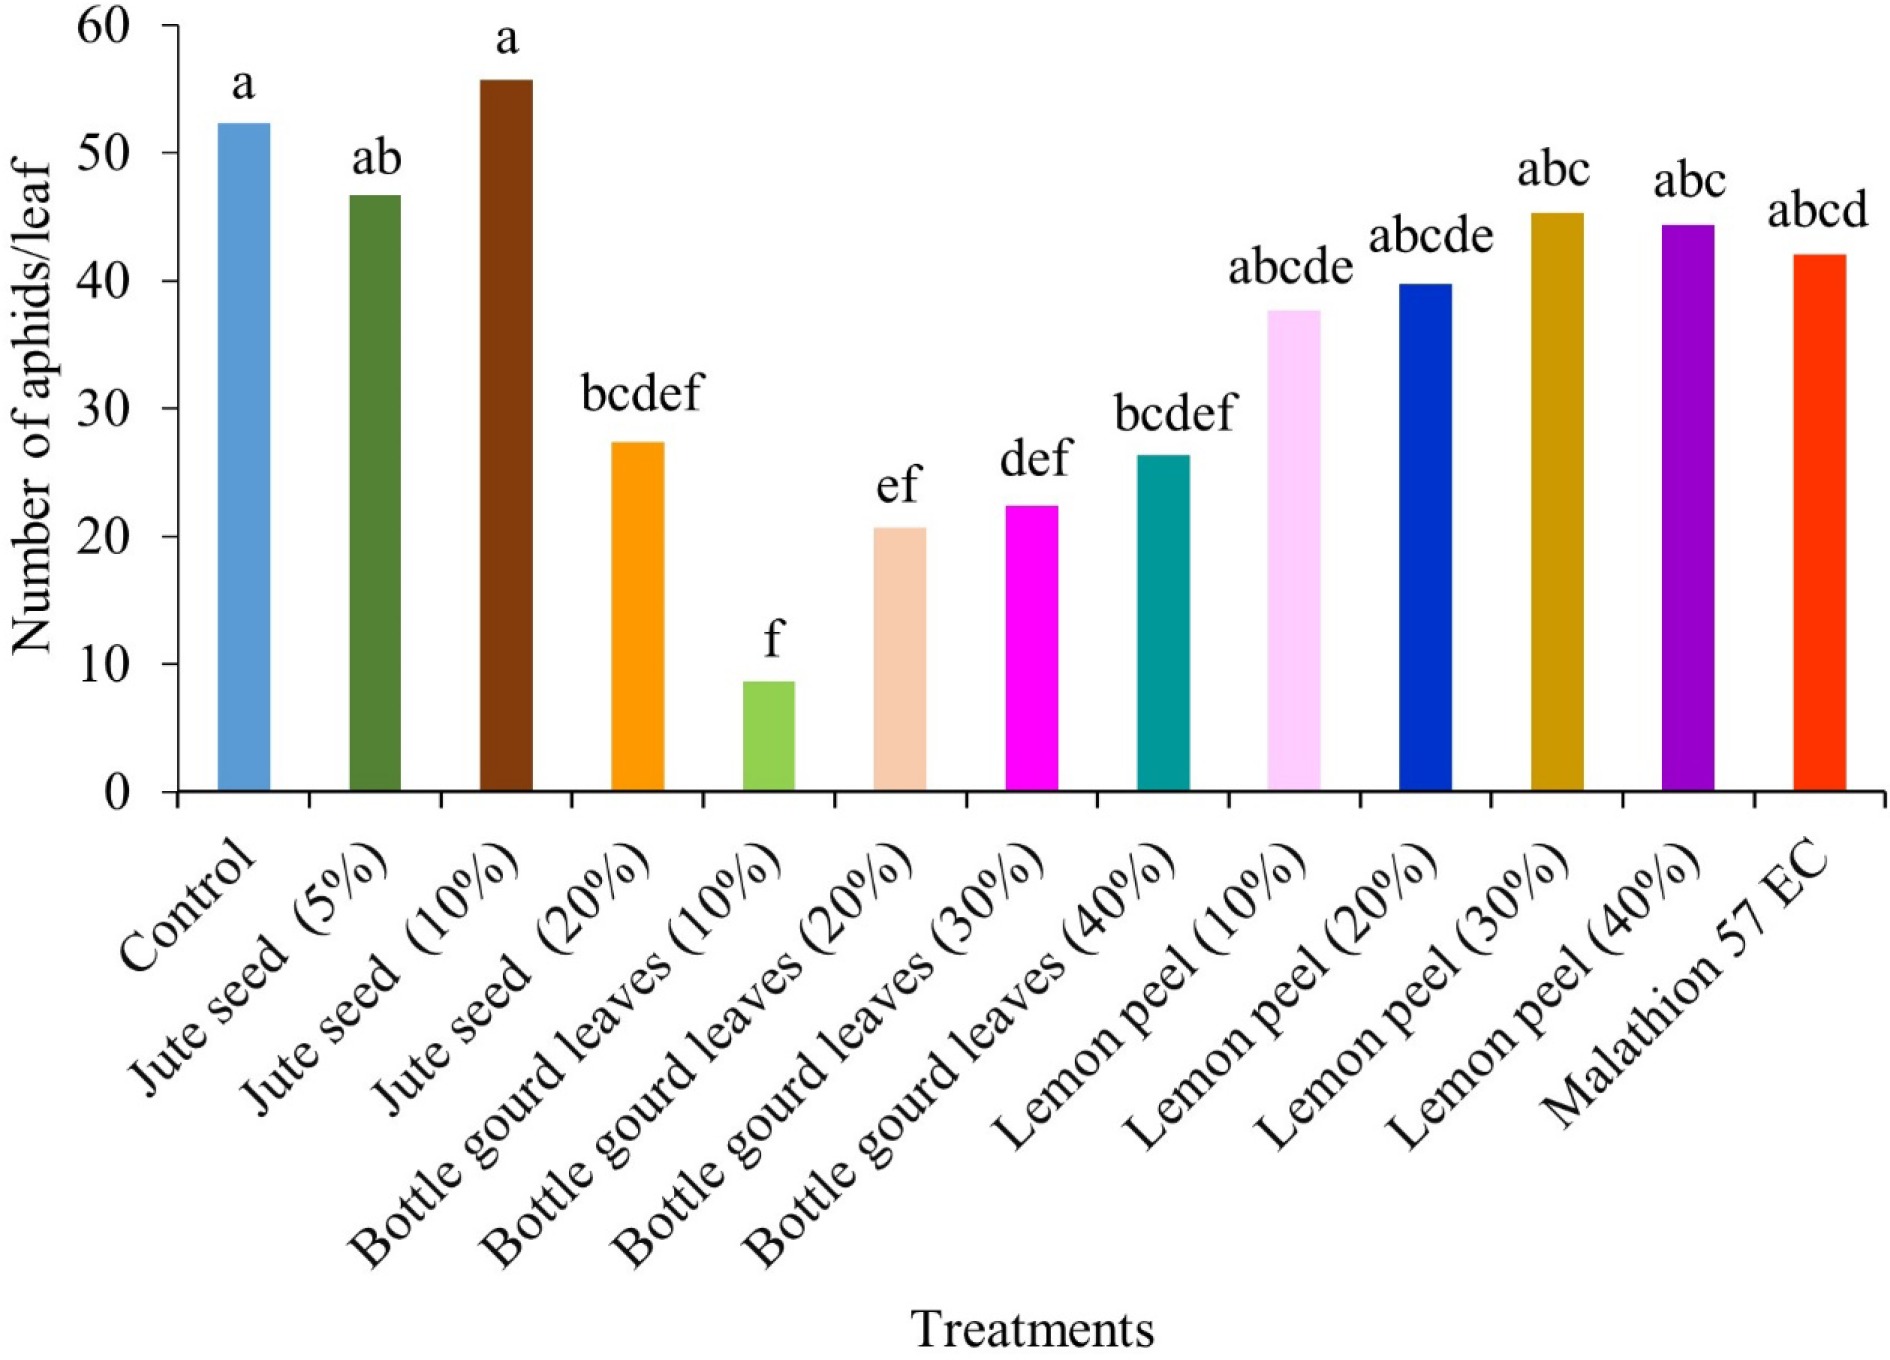
Figure 2.
Effect of plant extracts on the number of aphids/leaf on field grown cabbage at 60 DAT. Different letters within the same column indicate significant difference at p < 0.05; DAT= Days after transplanting; EC= Emulsifiable concentrate.
-
Treatment Number of leaves per plant Plant spread (cm) Head diameter (cm) Head weight (kg)/plant Control 22.12 ± 1.58de 32.75 ± 4.07fg 10.81 ± 0.31ab 2.17 ± 0.28de Jute seed (5%) 12.91 ± 0.66f 20.73 ± 1.20h 7.20 ± 0.50ab 1.26 ± 3.40f Jute seed (10%) 21.76 ± 8.09ef 32.21 ± 2.41fg 10.74 ± 0.51ab 2.56 ± 1.01cd Jute seed (20%) 23.95 ± 4.72bc 35.46 ± 2.53ef 12.31 ± 0.92bc 2.66 ± 0.68bc Bottle gourd leaves (10%) 23.44 ± 1.71ef 34.69 ± 4.31ef 11.45 ± 0.01a 2.47 ± 0.27cd Bottle gourd leaves (20%) 24.80 ± 5.64de 36.69 ± 9.11de 12.80 ± 0.82bc 2.45 ± 0.50cd Bottle gourd leaves (30%) 30.58 ± 0.53a 45.80 ± 1.45a 15.11 ± 0.9bc 3.30 ± 0.72a Bottle gourd leaves (40%) 27.37 ± 9.90de 40.52 ± 3.21bc 13.37 ± 0.82bc 2.80 ± 4.41fg Lemon peel (10%) 29.57 ± 7.26bc 40.82 ± 6.14bc 14.44 ± 0.81bc 3.15 ± 0.55ab Lemon peel (20%) 27.43 ± 0.38ab 43.77 ± 3.18ab 13.56 ± 0.46ab 3.12 ± 1.47ab Lemon peel (30%) 21.49 ± 2.70cd 31.80 ± 2.23g 11.04 ± 0.18a 2.12 ± 0.52a Lemon peel (40%) 28.11 ± 0.61ab 41.60 ± 3.10ab 13.82 ± 0.54ab 2.84 ± 0.50ab Malathion 57 EC 25.96 ± 1.92ab 38.42 ± 4.61cd 12.67 ± 0.90bc 2.52 ± 0.62bc p value <0.0001** <0.0001** <0.0001** <0.0001** F value 17.664 46.541 8.644 4.892 DF 12 12 12 12 Different letters within the same column indicate significant difference at p < 0.05; ** significance at p ≤ 0.01; DAT= Days After Transplanting; EC = Emulsifiable Concentrate. Table 1.
Effects of plant extracts on number of leaves per plant, plant spread, head diameter, and head weight/plant of field-grown cabbage.
-
Treatment Aphid abundance (number/plant) Abundance (%) over Malathion 57 EC 45 DAT 60 DAT 45 DAT 60 DAT Control 198.99 ± 7.54a 156.99 ± 2.40a +8.15 +24.60 Jute seed (5%) 174.00 ± 8.19a 140.01 ± 8.84ab −5.43 +11.12 Jute seed (10%) 192.00 ± 9.07a 167.01 ± 6.36a +4.35 +32.55 Jute seed (20%) 108.00 ± 7.94ab 81.99 ± 4.81bcdef −41.30 −34.93 Bottle gourd leaves (10%) 48.00 ± 4.62b 26.01 ± 0.88f −73.91 −79.36 Bottle gourd leaves (20%) 59.01 ± 5.21b 62.01 ± 5.93ef −67.93 −50.79 Bottle gourd leaves (30%) 132.00 ± 21.66ab 66.99 ± 4.91def −28.26 −46.83 Bottle gourd leaves (40%) 105.00 ± 10.26ab 78.99 ± 9.02bcdef −42.93 −37.30 Lemon peel (10%) 135.99 ± 13.37ab 113.01 ± 9.68abcde −26.09 −10.31 Lemon peel (20%) 149.01 ± 17.82ab 119.01 ± 7.17abcde −19.01 −5.55 Lemon peel (30%) 143.01 ± 11.26ab 135.99 ± 7.26abc −22.27 +7.93 Lemon peel (40%) 152.01 ± 3.33ab 132.99 ± 3.84abc −17.38 +5.55 Malathion 57 EC 183.99 ± 6.64a 126.00 ± 5.20abcd − − p value <0.0001** <0.0001** − − F value 2.051 4.741 − − DF 12 12 − − Different letters within the same column indicate a significant difference at p < 0.05; ** significance at p ≤ 0.01; DAT = Days After Transplanting; EC = Emulsifiable Concentrate; Increased (+) aphid abundance compared with that in Malathion 57 EC group; Reduced aphid abundance (−) compared with that in Malathion 57 EC group. Table 2.
Abundance of aphids in treatment groups, control group, and Malathion 57 EC group, and abundance of aphids (%) over that in the Malathion 57 EC group.
-
Treatment Yield (kg/plot) Yield (mt/ha) Yield over control (%) Yield over Malathion 57 EC (%) Control 17.36 80.37 − −13.90 Jute seed (5%) 10.08 46.67 −42 −50 Jute seed (10%) 20.48 94.81 +17.97 +1.58 Jute seed (20%) 21.28 98.53 +22.58 +5.56 Bottle gourd leaves (10%) 19.76 91.49 +13.83 −1.98 Bottle gourd leaves (20%) 19.60 90.75 +12.90 −2.77 Bottle gourd leaves (30%) 26.40 122.23 +52.07 +30.95 Bottle gourd leaves (40%) 22.40 103.71 +29.03 +11.11 Lemon peel (10%) 25.20 116.68 +45.16 +25.01 Lemon peel (20%) 24.96 115.57 +43.78 +23.82 Lemon peel (30%) 16.96 78.53 −2.29 −15.87 Lemon peel (40%) 22.72 105.19 +30.88 +12.70 Malathion 57 EC 20.16 93.34 +16.13 − Increased (+) yield compared with control and Malathion 57 EC; Decreased (−) yield compared with control and Malathion 57 EC. Table 3.
Effects of plant extracts on yield per plot and yield over that of the control and Malathion 57 EC groups.
-
Name of the compounds Molecular formula Retention time Molecular weight (g/mol) % of composition 1,3,6,10-Dodecatetraene, 3,7,11-trimethyl-, (Z, E)- C15H24 14.369 93.00 2.557 Hexadecanal C16H32O 22.775 57.00 2.109 Dodecane, 1,1-dimethoxy- C14H30O2 26.991 75.00 6.363 Hexadecanoic acid, 15-methyl-, methyl ester C18H36O2 28.213 74.00 4.346 Cyclopropanepentanoic acid, 2-undecyl-, methyl ester, trans- C20H38O2 31.927 55.00 1.293 Phenol, 2-methoxy-4-(2-propenyl)-, acetate C12H14O3 12.329 164.00 16.666 Pentadecanoic acid, 14-methyl-, methyl ester C16H32O2 28.217 74.00 2.748 1,2-Benzenedicarboxylic acid, butyl 2-ethylhe C20H30O4 28.827 149.00 6.532 9,12-Octadecadienoic acid, methyl ester, (E, E)- C19H34O2 31.795 67.00 17.713 9-Octadecenoic acid (Z)-, methyl ester C19H36O2 31.950 55.00 4.697 Undecanoic acid, 10-methyl-, methyl ester C13H26O2 28.197 74.00 6.294 Phytol C20H40O 32.134 71.00 12.015 1,2-Benzenedicarboxylic acid, bis (2-methylpropyl) ester C16H22O4 26.554 149.00 16.667 Table 4.
Thirteen (methanol-soluble) compounds detected in bottle gourd leaf extract by GC−MS.
Figures
(2)
Tables
(4)