-
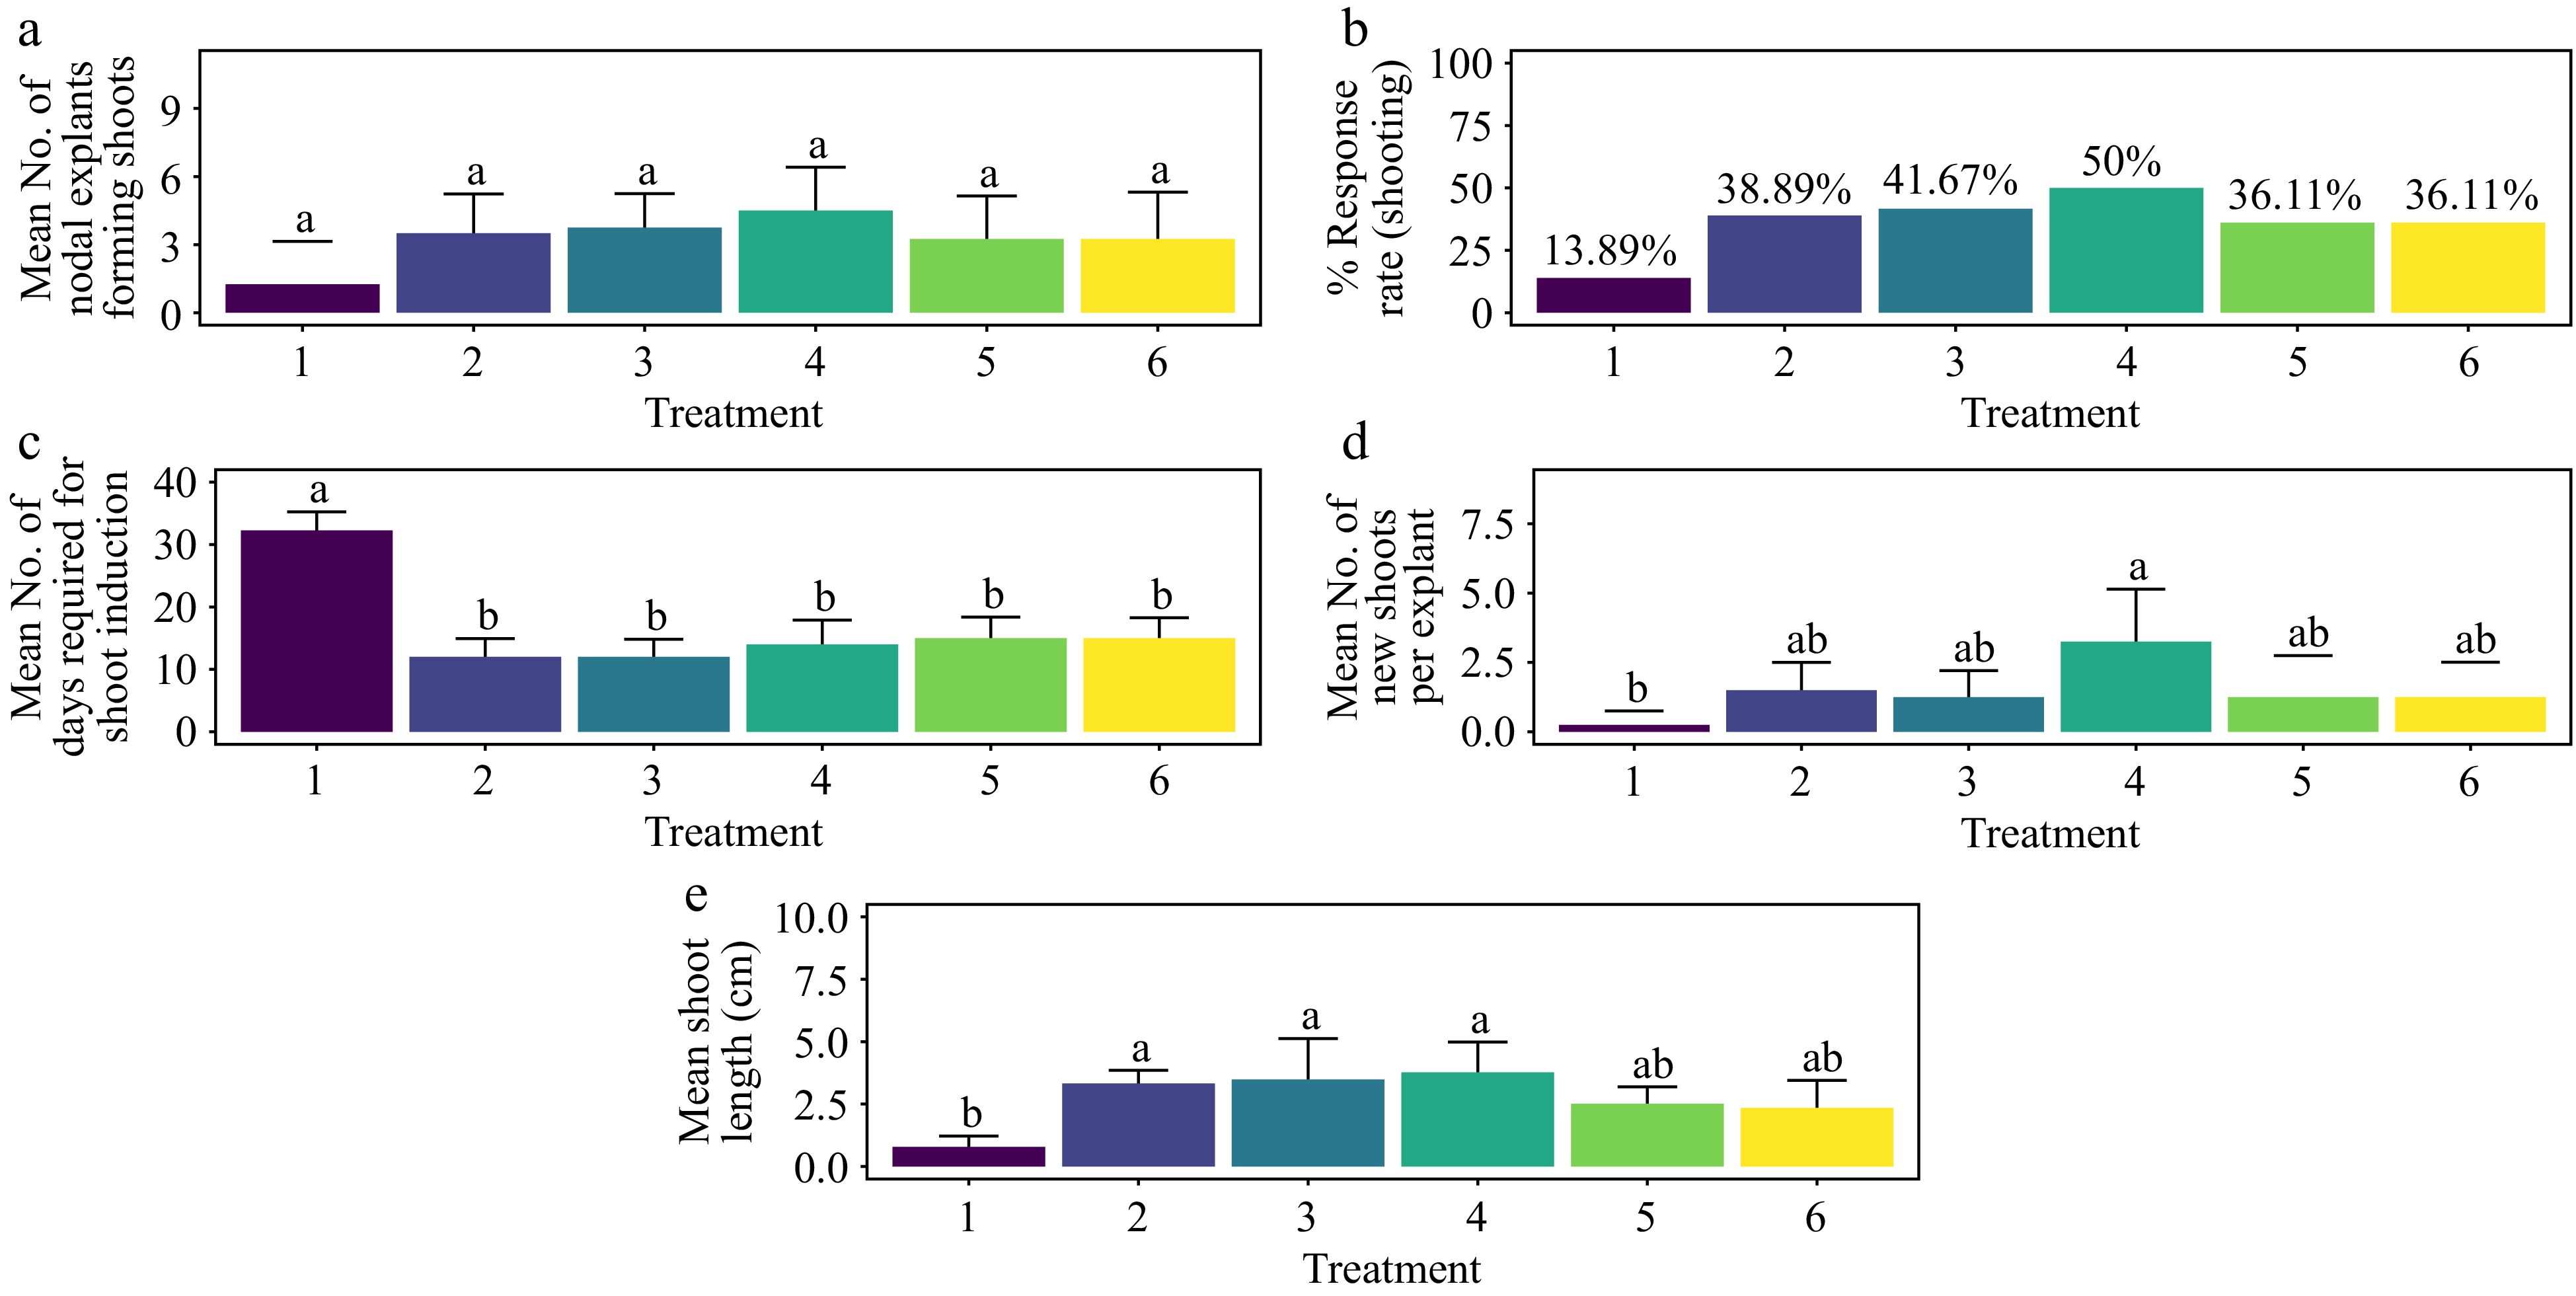
Figure 1.
Effect of PGRs on in vitro morphogenetic response (shoot multiplication) in nodal explant of Gloriosa superba L. (a) Mean nodal explants forming shoots, (b) response rate to shooting treatment, and (c) mean days required for shoot induction, (d) mean of new shoots per explant, and (e) mean shoot length. Treatments were T1: Control (media without PGRs); T2: 0.5 mg·L−1 BAP; T3: 1.0 mg·L−1 BAP; T4: 1.5 mg·L−1 BAP; T5: 2.0 mg·L−1 BAP; T6: 2.5 mg·L−1 BAP. Bars indicate mean ± SE. Different letters indicate significant differences by Tukey's test at p ≤ 0.05.
-

Figure 2.
Effect of PGRs on in vitro morphogenetic response (shoot multiplication) in nodal explant of Gloriosa superba L. (a) Mean nodal explants forming shoots, (b) response rate to shooting treatment, and (c) mean days required for shoot induction, (d) mean of new shoots per explant, and (e) mean shoot length. Treatments were T1: Control (media without PGRs); T7: 0.5 mg·L−1 BAP, 0.1 mg·L−1 TDZ; T8: 0.5 mg·L−1 BAP, 0.2 mg·L−1 TDZ; T9: 1.0 mg·L−1 BAP, 0.2 mg·L-1 TDZ; T10: 1.0 mg·L−1 BAP, 0.5 mg·L−1 TDZ; T11: 1.5 mg·L−1 BAP, 0.2 mg·L−1 TDZ; T12: 1.5 mg·L−1 BAP, 0.5 mg·L−1 TDZ; T13: 1.5 mg·L−1 BAP, 1.0 mg·L−1 TDZ; T14: 2.0 mg·L−1 BAP, 0.5 mg·L−1 TDZ; T15: 2.0 mg·L−1 BAP, 1.0 mg·L−1 TDZ; T16: 2.5 mg·L−1 BAP, 0.5 mg·L−1 TDZ; T17: 2.5 mg·L−1 BAP, 1.0 mg·L−1 TDZ. Bars indicate mean ± SE. Different letters indicate significant differences by Tukey's test at p ≤ 0.05.
-
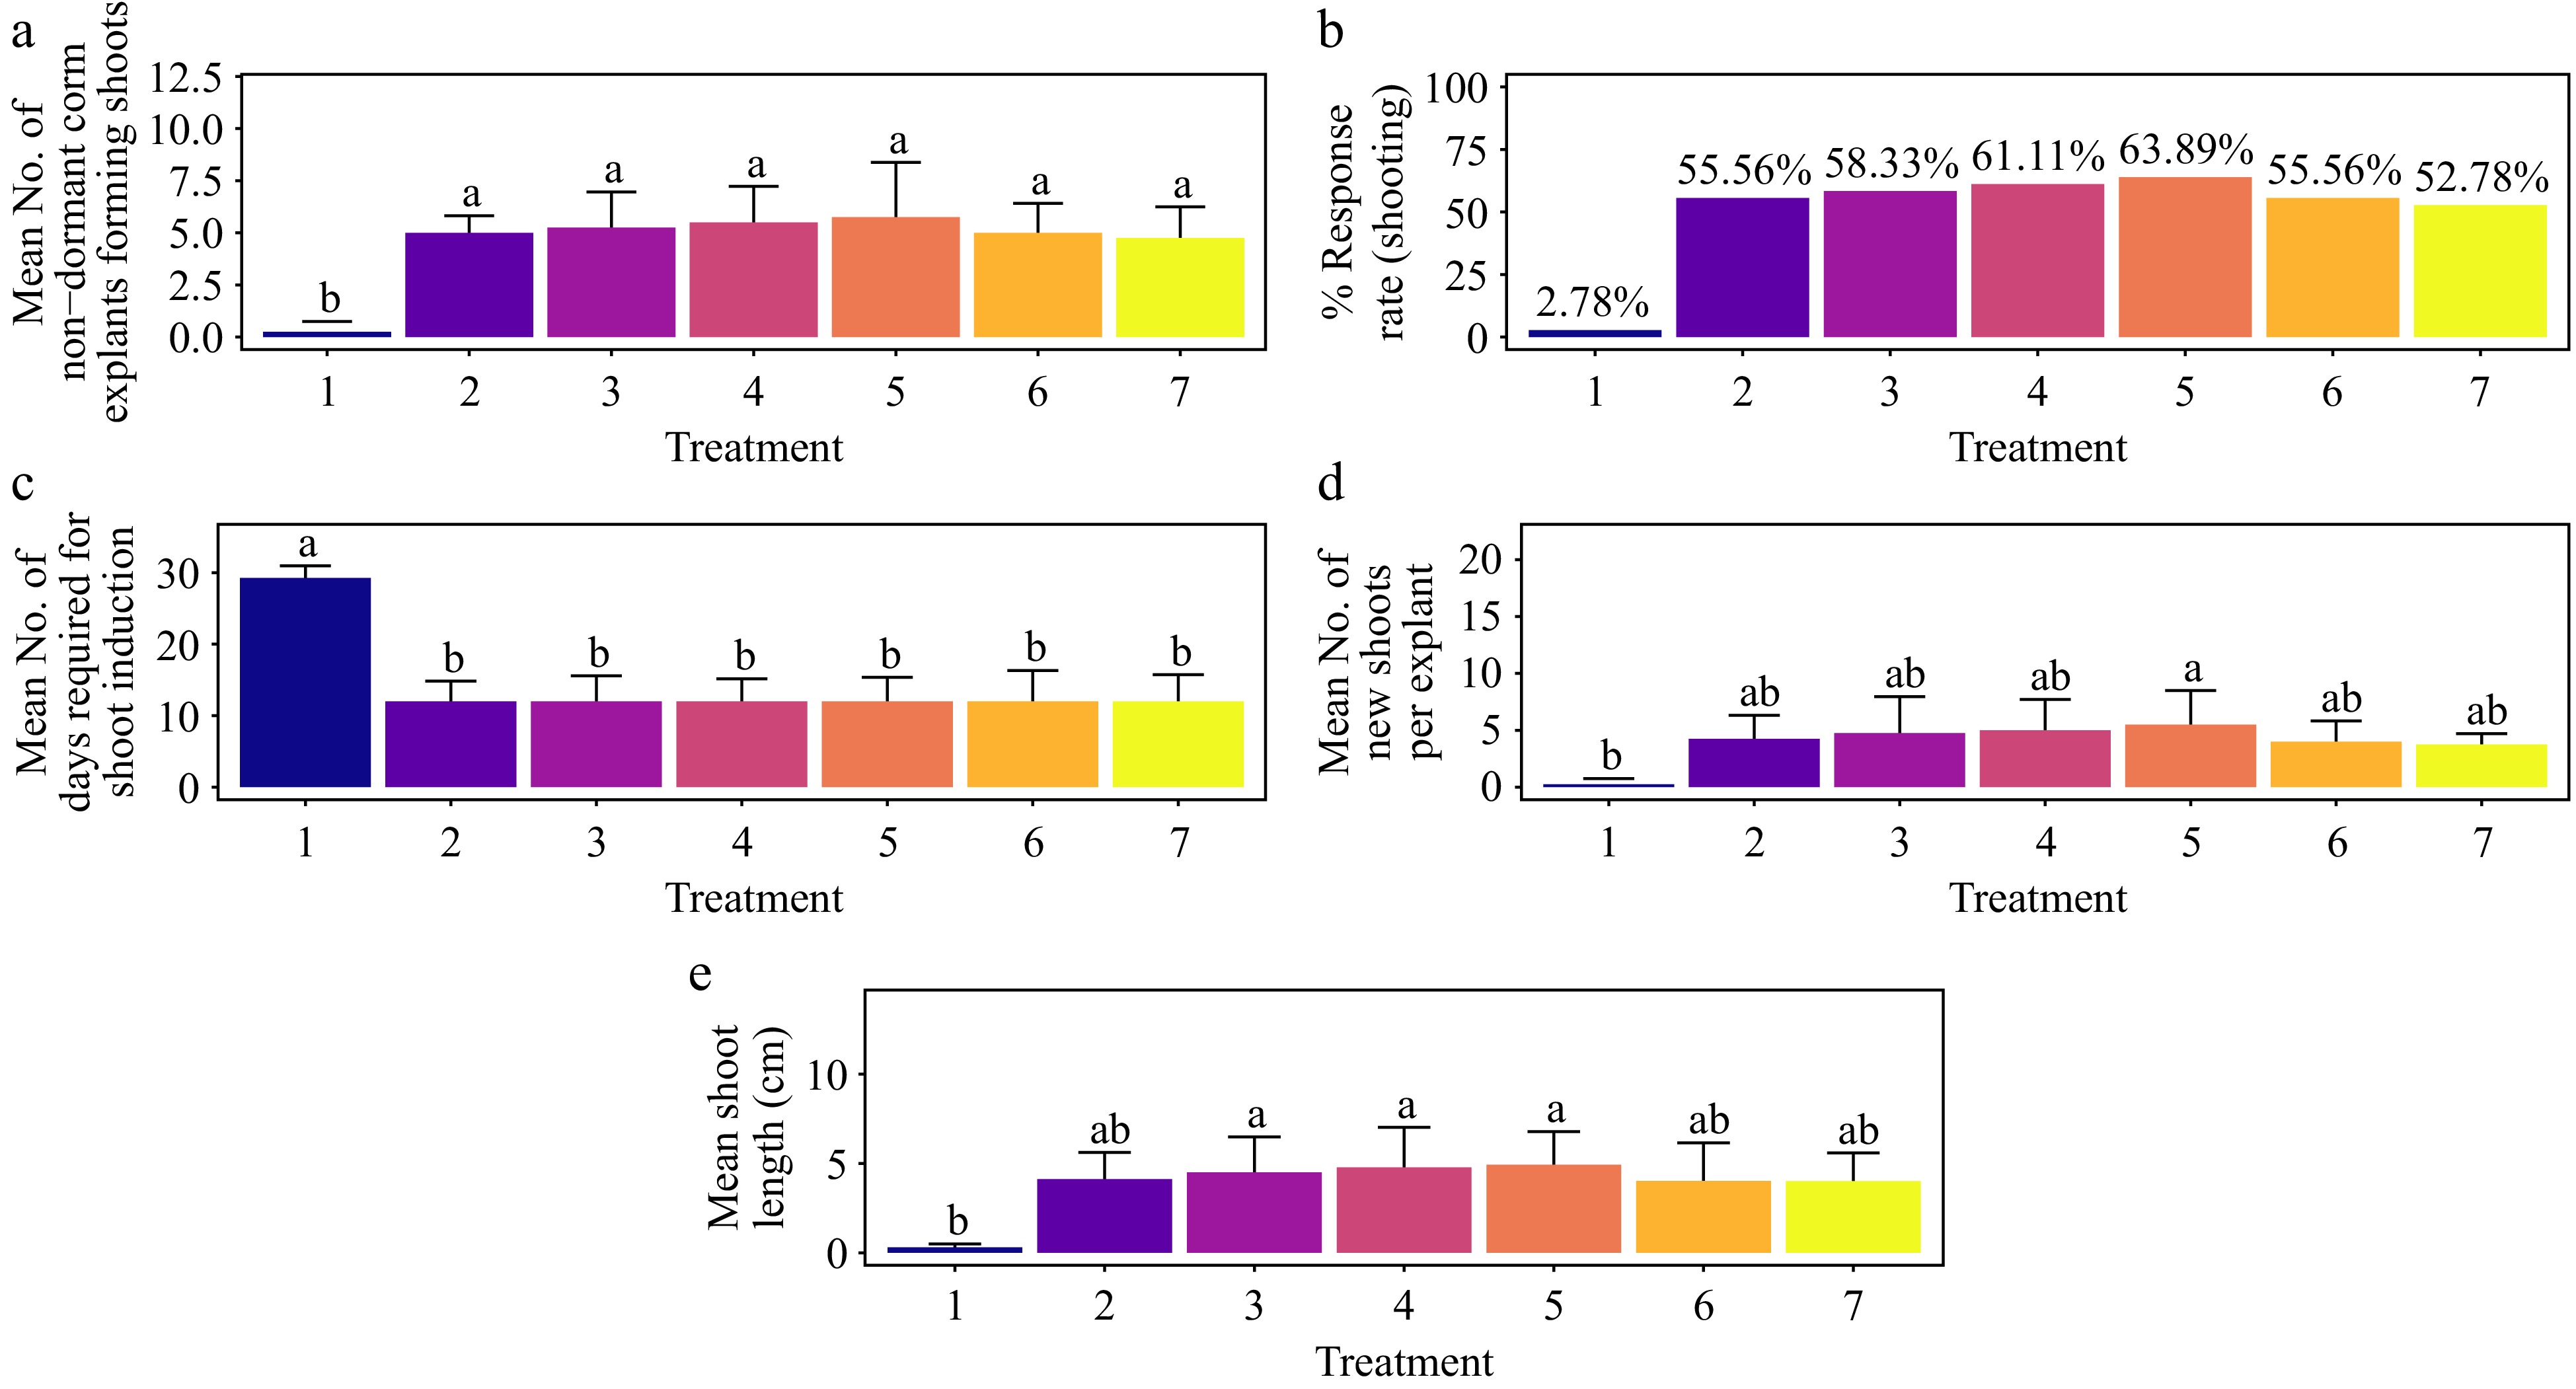
Figure 3.
Effect of PGRs on in vitro morphogenetic response (shoot multiplication) in non-dormant corm explant of Gloriosa superba L. (a) Mean non-dormant corm explants forming shoots, (b) response rate to shooting treatment, and (c) mean days required for shoot induction, (d) mean of new shoots per explant, and (e) mean shoot length. Treatments were T1: Control (media without PGRs); T2: 0.2 mg·L−1 BAP, 1.5 mg·L−1 AC; T3: 0.5 mg·L−1 BAP, 1.5 mg·L−1 AC; T4: 1.0 mg·L−1 BAP, 1.5 mg·L−1 AC; T5: 1.5 mg·L−1 BAP, 1.5 mg·L−1 AC; T6: 2.0 mg·L−1 BAP, 1.5 mg·L−1 AC; T7: 2.5 mg·L−1 BAP, 1.5 mg·L−1 AC. Bars indicate mean ± SE. Different letters indicate significant differences by Tukey's test at p ≤ 0.05.
-

Figure 4.
Effect of PGRs on in vitro morphogenetic response (shoot multiplication) in non-dormant corm explant of Gloriosa superba L. (a) Mean non-dormant corm explants forming shoots, (b) response rate to shooting treatment, and (c) mean days required for shoot induction, (d) mean of new shoots per explant, and (e) mean shoot length. Treatments were T1: Control (media without PGRs); T8: 0.2 mg·L−1 KN, 1.5 mg·L−1 AC; T9: 0.5 mg·L−1 KN, 1.5 mg·L−1 AC; T10: 1.0 mg·L−1 KN, 1.5 mg·L−1 AC; T11: 1.5 mg·L−1 KN, 1.5 mg·L−1 AC; T12: 2.0 mg·L−1 KN, 1.5 mg·L−1 AC; T13: 2.5 mg·L−1 KN, 1.5 mg·L−1 AC. Bars indicate mean ± SE. Different letters indicate significant differences by Tukey's test at p ≤ 0.05.
-

Figure 5.
Effect of PGRs on in vitro morphogenetic response (shoot multiplication) in non-dormant corm explant of Gloriosa superba L. (a) Mean non-dormant corm explants forming shoots, (b) response rate to shooting treatment, and (c) mean days required for shoot induction, (d) mean of new shoots per explant, and (e) mean shoot length. Treatments were T1: Control (media without PGRs); T14: 0.5 mg·L−1 BAP, 10 mg·L−1 ADS; T15: 1.0 mg·L−1 BAP, 10 mg·L−1 ADS; T16: 1.5 mg·L−1 BAP, 10 mg·L−1 ADS; T17: 0.5 mg·L−1 BAP, 20 mg·L−1 ADS; T18: 1.0 mg·L−1 BAP, 20 mg·L−1 ADS; T19: 1.5 mg·L−1 BAP, 20 mg·L−1 ADS. Bars indicate mean ± SE. Different letters indicate significant differences by Tukey's test at p ≤ 0.05.
-

Figure 6.
Effect of PGRs on in vitro morphogenetic response (shoot multiplication) in non-dormant corm explant of Gloriosa superba L. (a) Mean non-dormant corm explants forming shoots, (b) response rate to shooting treatment, and (c) mean days required for shoot induction, (d) mean of new shoots per explant, and (e) mean shoot length. Treatments were T1: Control (media without PGRs); T20: 0.5 mg·L−1 KN, 10 mg·L−1 ADS; T21: 1.0 mg·L−1 KN, 10 mg·L−1 ADS; T22: 1.5 mg·L−1 KN, 10 mg·L−1 ADS; T23: 0.5 mg·L−1 KN, 20 mg·L−1 ADS; T24: 1.0 mg·L−1 KN, 20 mg·L−1 ADS; T25: 1.5 mg·L−1 KN, 20 mg·L−1 ADS. Bars indicate mean ± SE. Different letters indicate significant differences by Tukey's test at p ≤ 0.05.
-
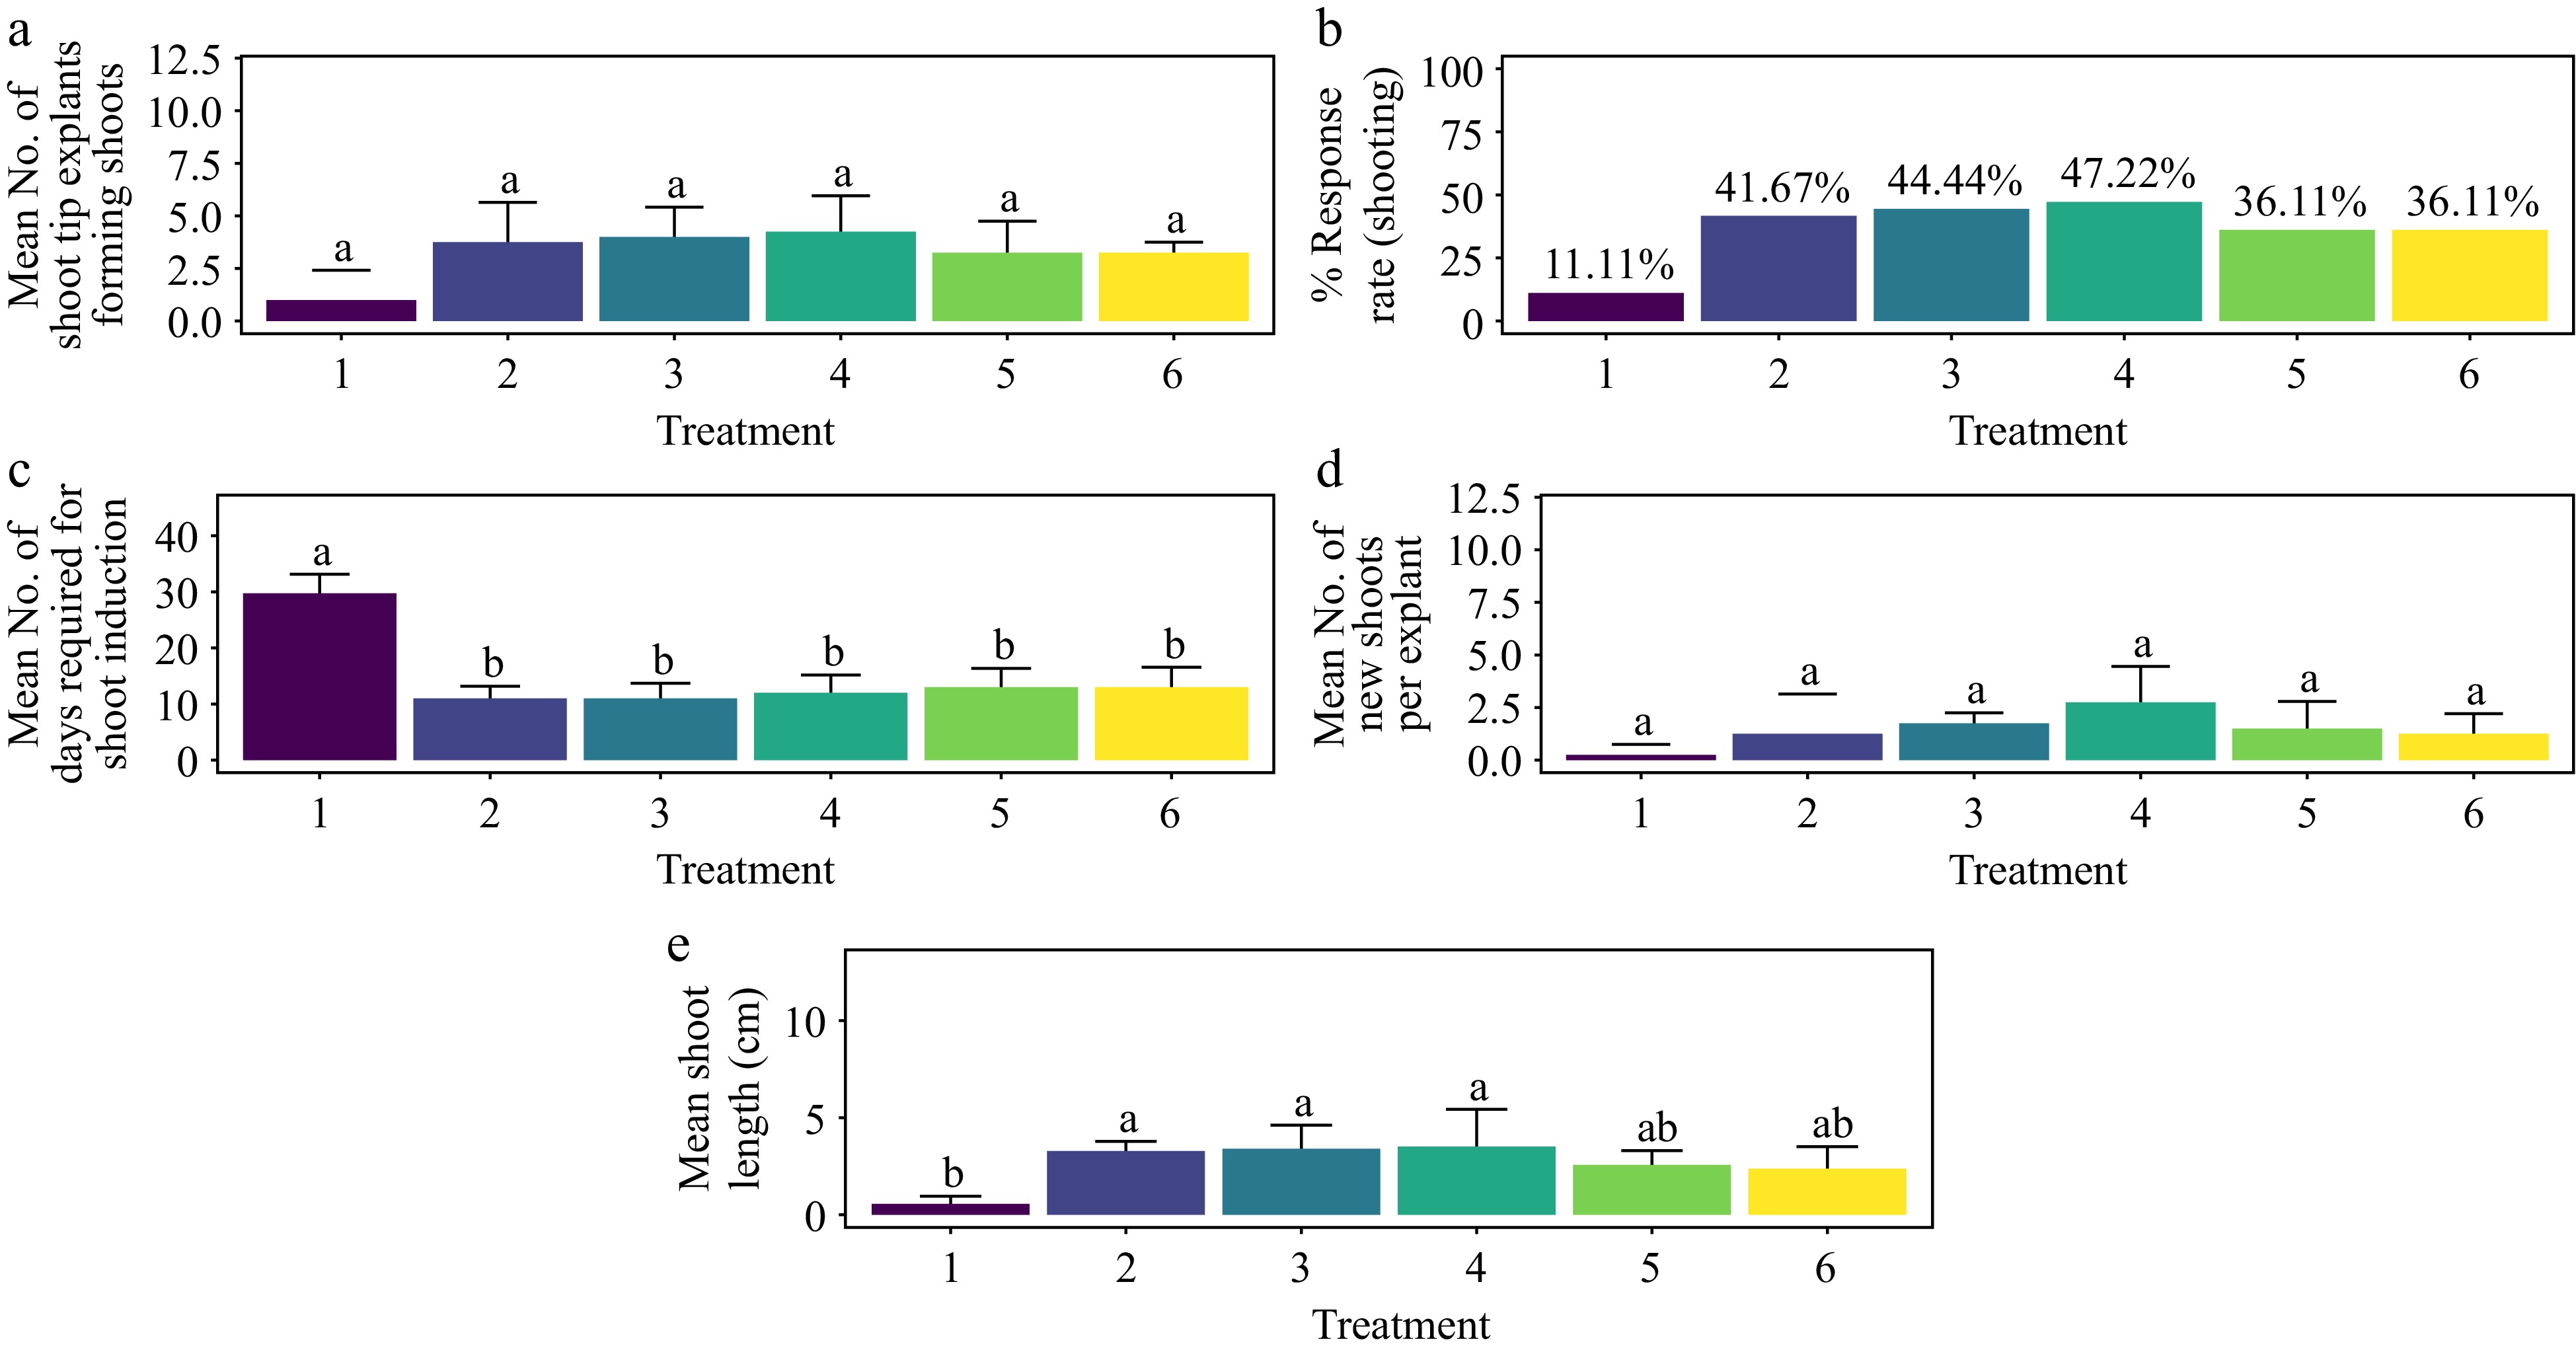
Figure 7.
Effect of PGRs on in vitro morphogenetic response (shoot multiplication) in shoot tip explant of Gloriosa superba L. (a) Mean shoot tip explants forming shoots, (b) response rate to shooting treatment, and (c) days required for shoot induction, (d) mean of new shoots per explant, and (e) mean shoot length. Treatments were T1: Control (media without PGRs); T2: 0.5 mg·L−1 BAP, 5 mg·L−1 ADS; T3: 1.0 mg·L−1 BAP, 5 mg·L−1 ADS; T4: 1.5 mg·L−1 BAP, 5 mg·L−1 ADS; T5: 2.0 mg·L−1 BAP, 5 mg·L−1 ADS; T6: 2.5 mg·L−1 BAP, 5 mg·L−1 ADS. Bars indicate mean ± SE. Different letters indicate significant differences by Tukey's test at p ≤ 0.05.
-
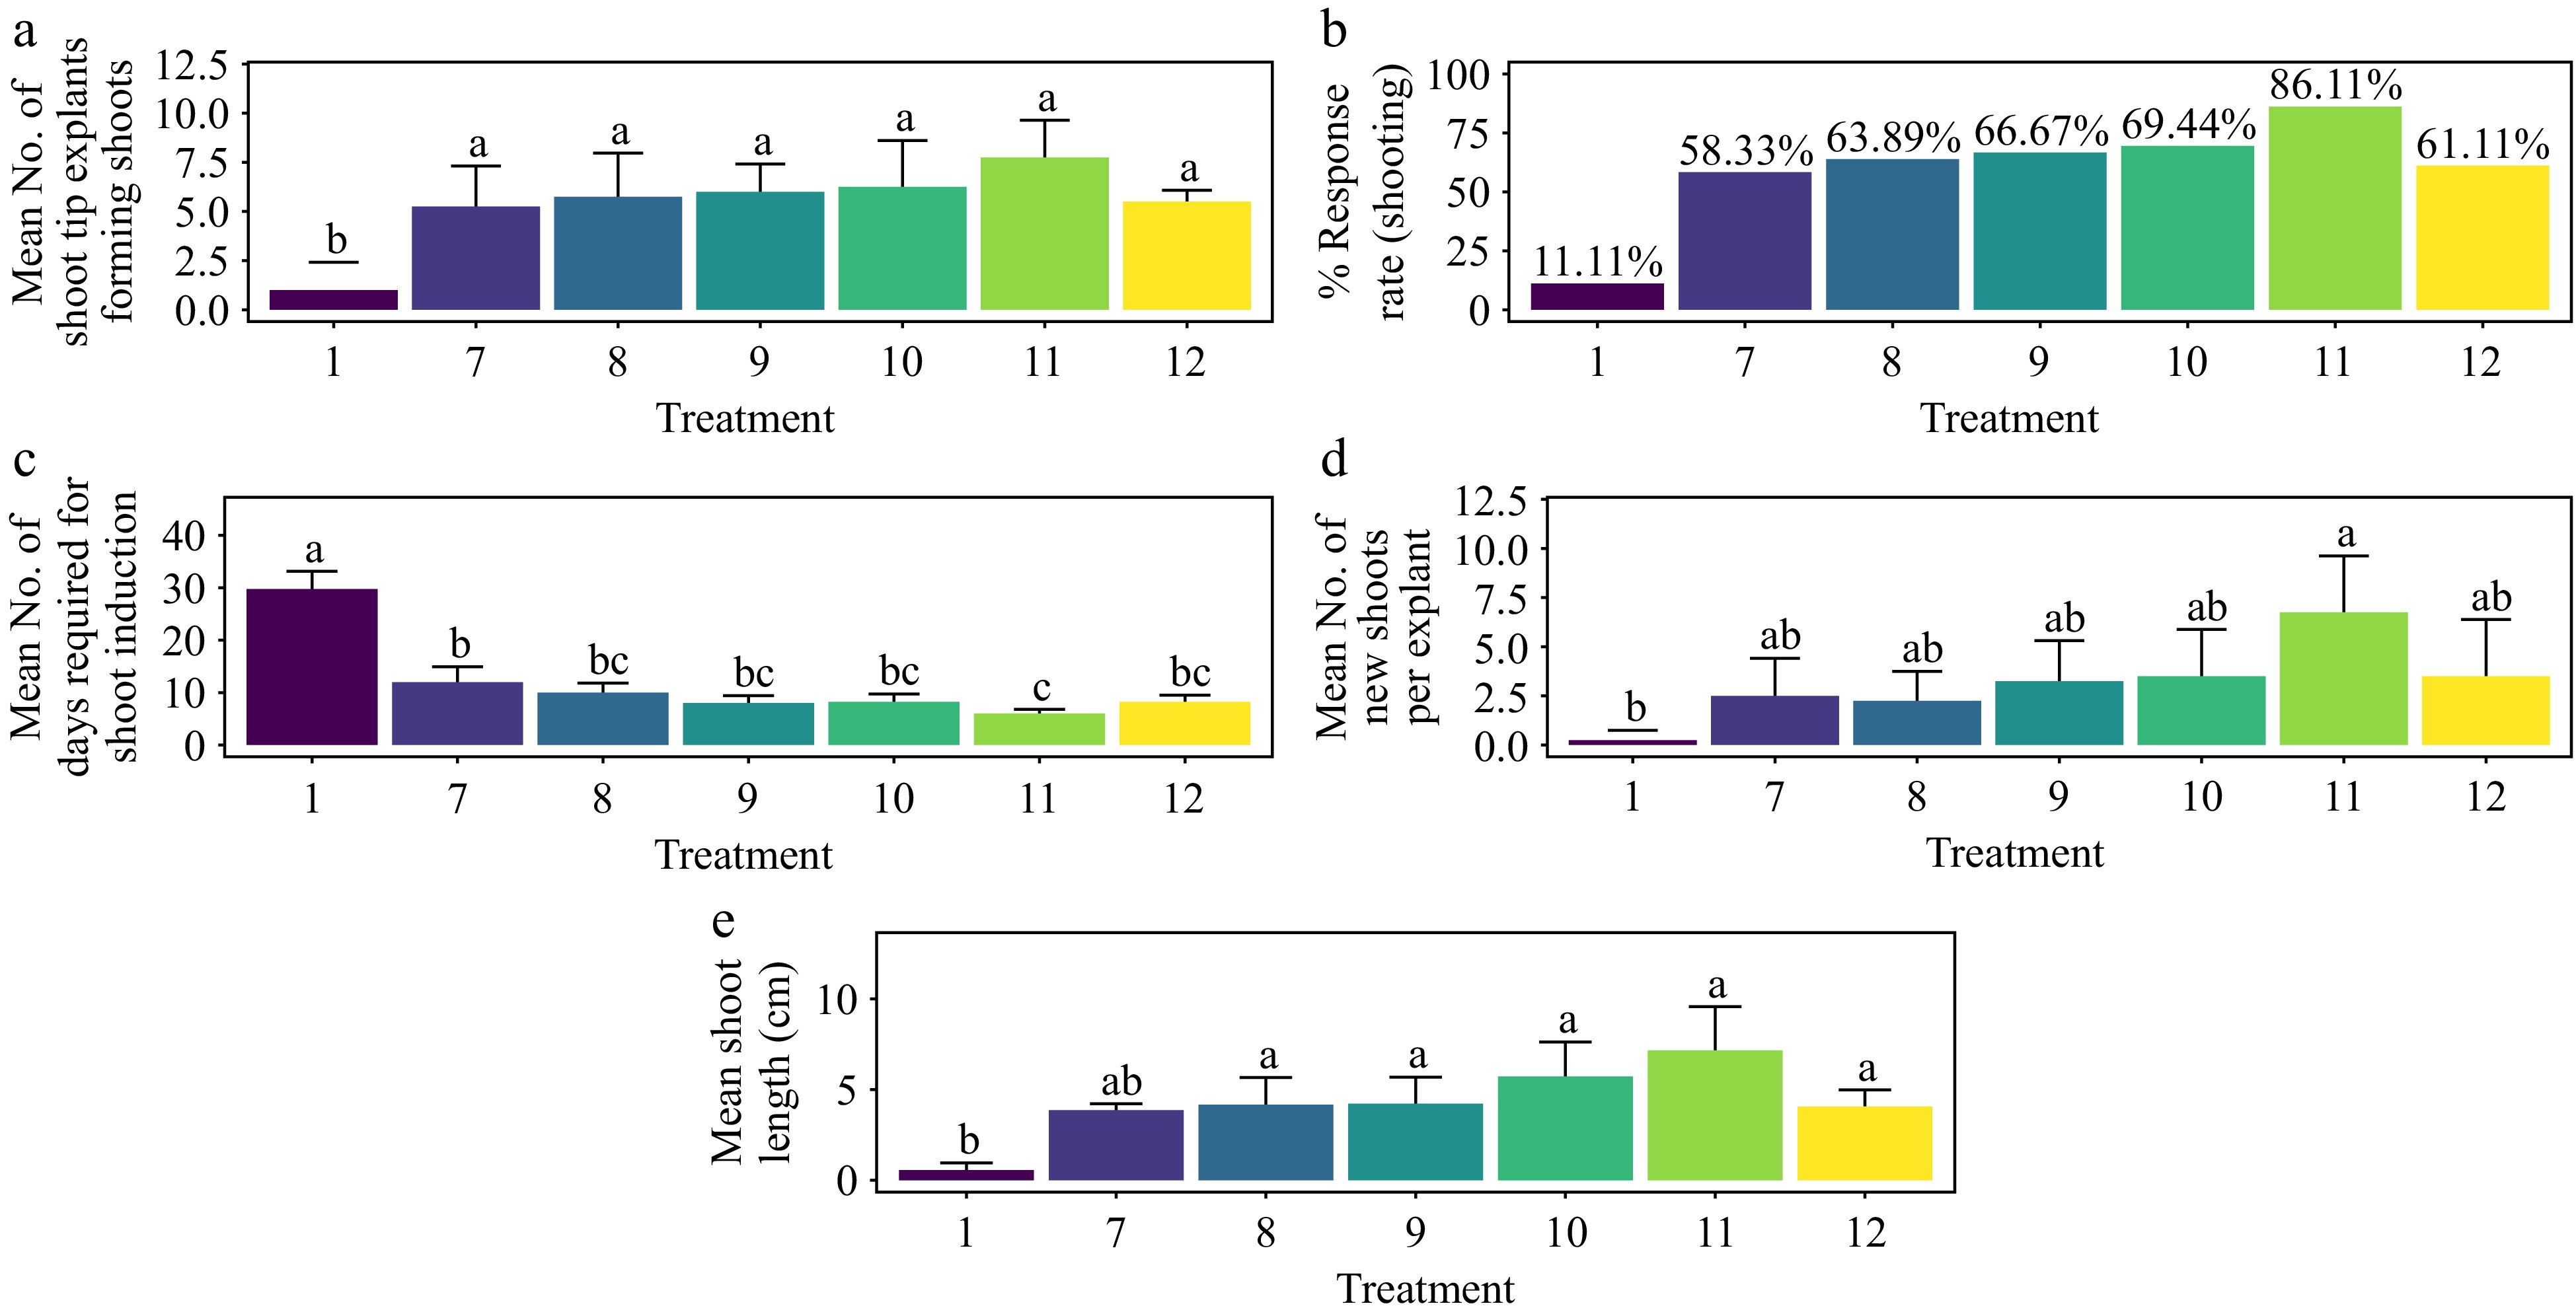
Figure 8.
Effect of PGRs on in vitro morphogenetic response (shoot multiplication) in shoot tip explant of Gloriosa superba L. (a) Mean shoot tip explants forming shoots, (b) response rate to shooting treatment, and (c) days required for shoot induction, (d) mean of new shoots per explant, and (e) mean shoot length. Treatments were T1: Control (media without PGRs); T7: 0.5 mg·L−1 BAP, 0.1 mg·L−1 TDZ, 8 mg·L−1 ADS; T8: 0.5 mg·L−1 BAP, 0.2 mg·L−1 TDZ, 8 mg·L−1 ADS; T9: 1.0 mg·L−1 BAP, 0.2 mg·L−1 TDZ, 8 mg·L−1 ADS; T10: 1.0 mg·L−1 BAP, 0.5 mg·L−1 TDZ, 8 mg·L−1 ADS; T11: 1.5 mg·L−1 BAP, 0.2 mg·L−1 TDZ, 8 mg·L−1 ADS; T12: 1.5 mg·L−1 BAP, 0.5 mg·L−1 TDZ, 8 mg·L−1 ADS. Bars indicate mean ± SE. Different letters indicate significant differences by Tukey's test at p ≤ 0.05.
-

Figure 9.
Effect of PGRs on in vitro morphogenetic response (shoot multiplication) in shoot tip explant of Gloriosa superba L. (a) Mean shoot tip explants forming shoots, (b) response rate to shooting treatment, and (c) days required for shoot induction, (d) mean of new shoots per explant, and (e) mean shoot length. Treatments were T1: Control (media without PGRs); T13: 1.5 mg·L−1 BAP, 1.0 mg·L−1 TDZ, 10 mg·L−1 ADS; T14: 2.0 mg·L−1 BAP, 0.5 mg·L−1 TDZ, 10 mg·L−1 ADS; T15: 2.0 mg·L−1 BAP, 1.0 mg·L−1 TDZ, 10 mg·L−1 ADS; T16: 2.5 mg·L−1 BAP, 0.5 mg·L−1 TDZ, 10 mg·L−1 ADS; T17: 2.5 mg·L−1 BAP, 1.0 mg·L−1 TDZ, 10 mg·L−1 ADS. Bars indicate mean ± SE. Different letters indicate significant differences by Tukey's test at p ≤ 0.05.
-
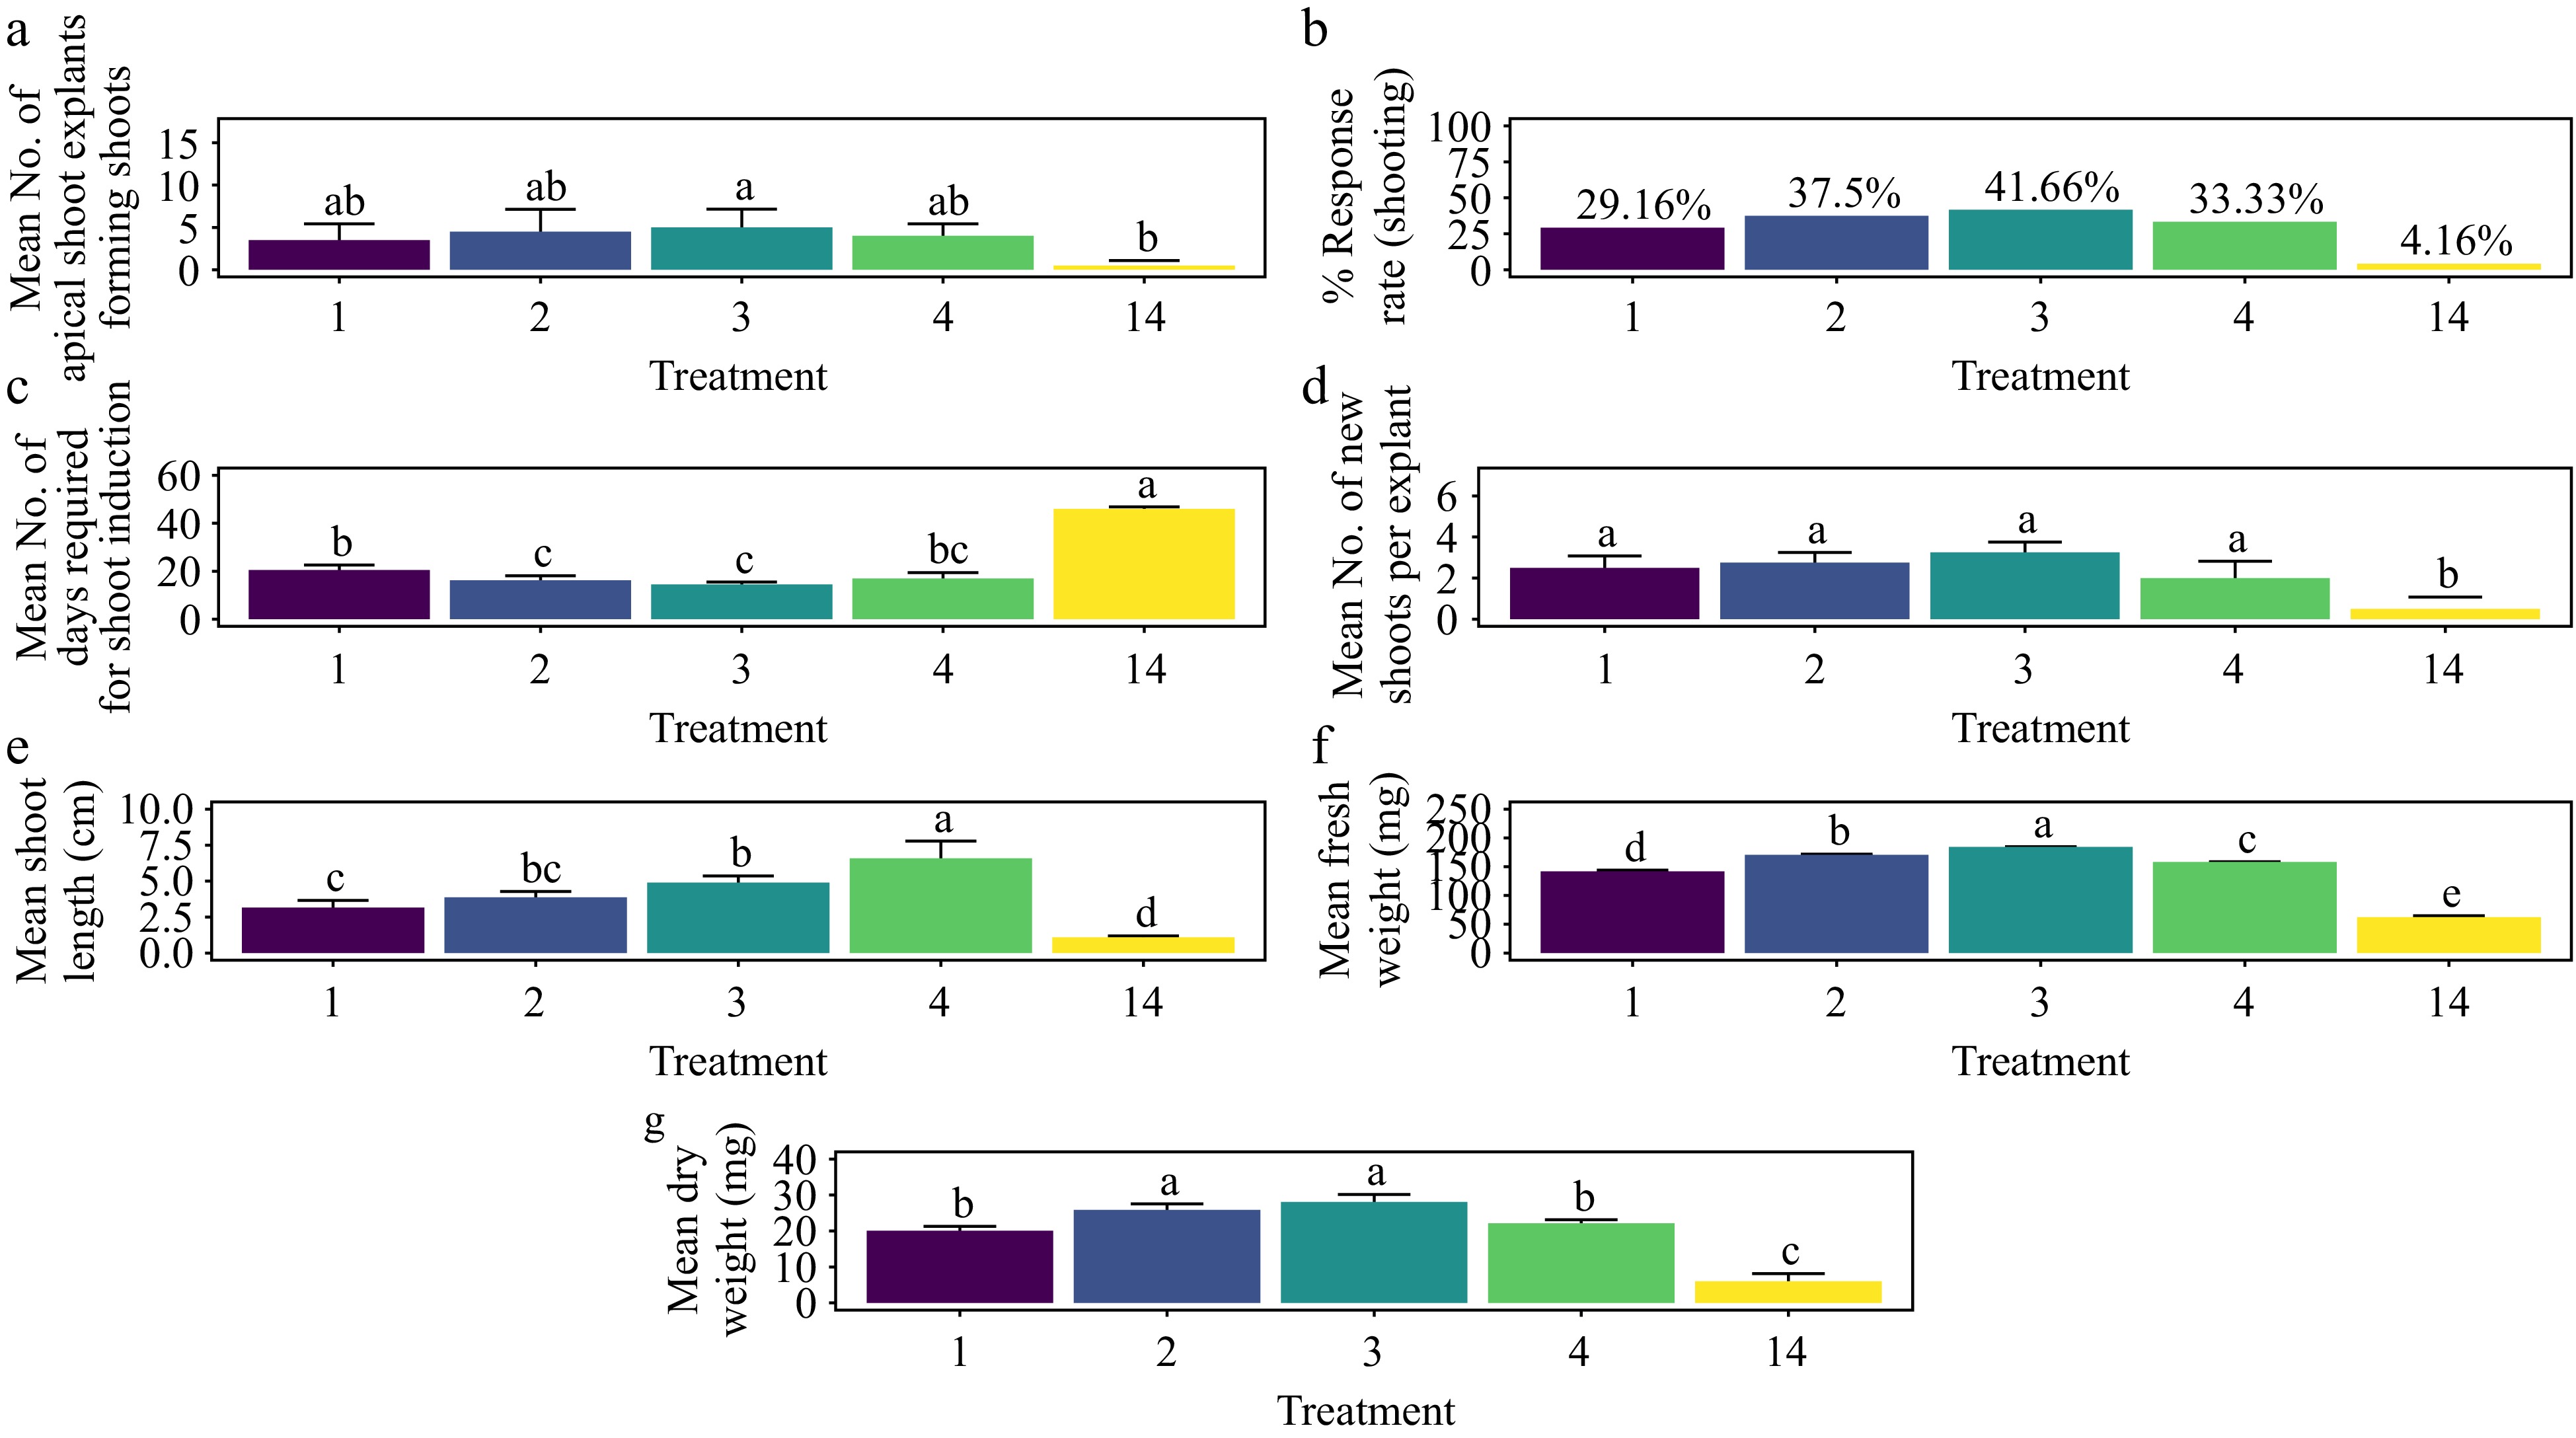
Figure 10.
Effect of PGRs on in vitro morphogenetic response (shoot multiplication) in apical shoot explant of Gloriosa superba L. (a) Mean apical shoot bud explants forming shoots, (b) response rate to shooting treatment, and (c) days required for shoot induction, (d) mean of new shoots per explant, (e) mean shoot length, (f) mean fresh weight of shoots, and (g) mean dry weight of shoots. Treatments were T1: 0.5 mg·L−1 BAP; T2: 1.0 mg·L−1 BAP; T3: 1.5 mg·L−1 BAP; T4: 2.0 mg·L−1 BAP; T14: Control (media without PGRs). Bars indicate mean ± SE. Different letters indicate significant differences by Tukey's test at p ≤ 0.05.
-
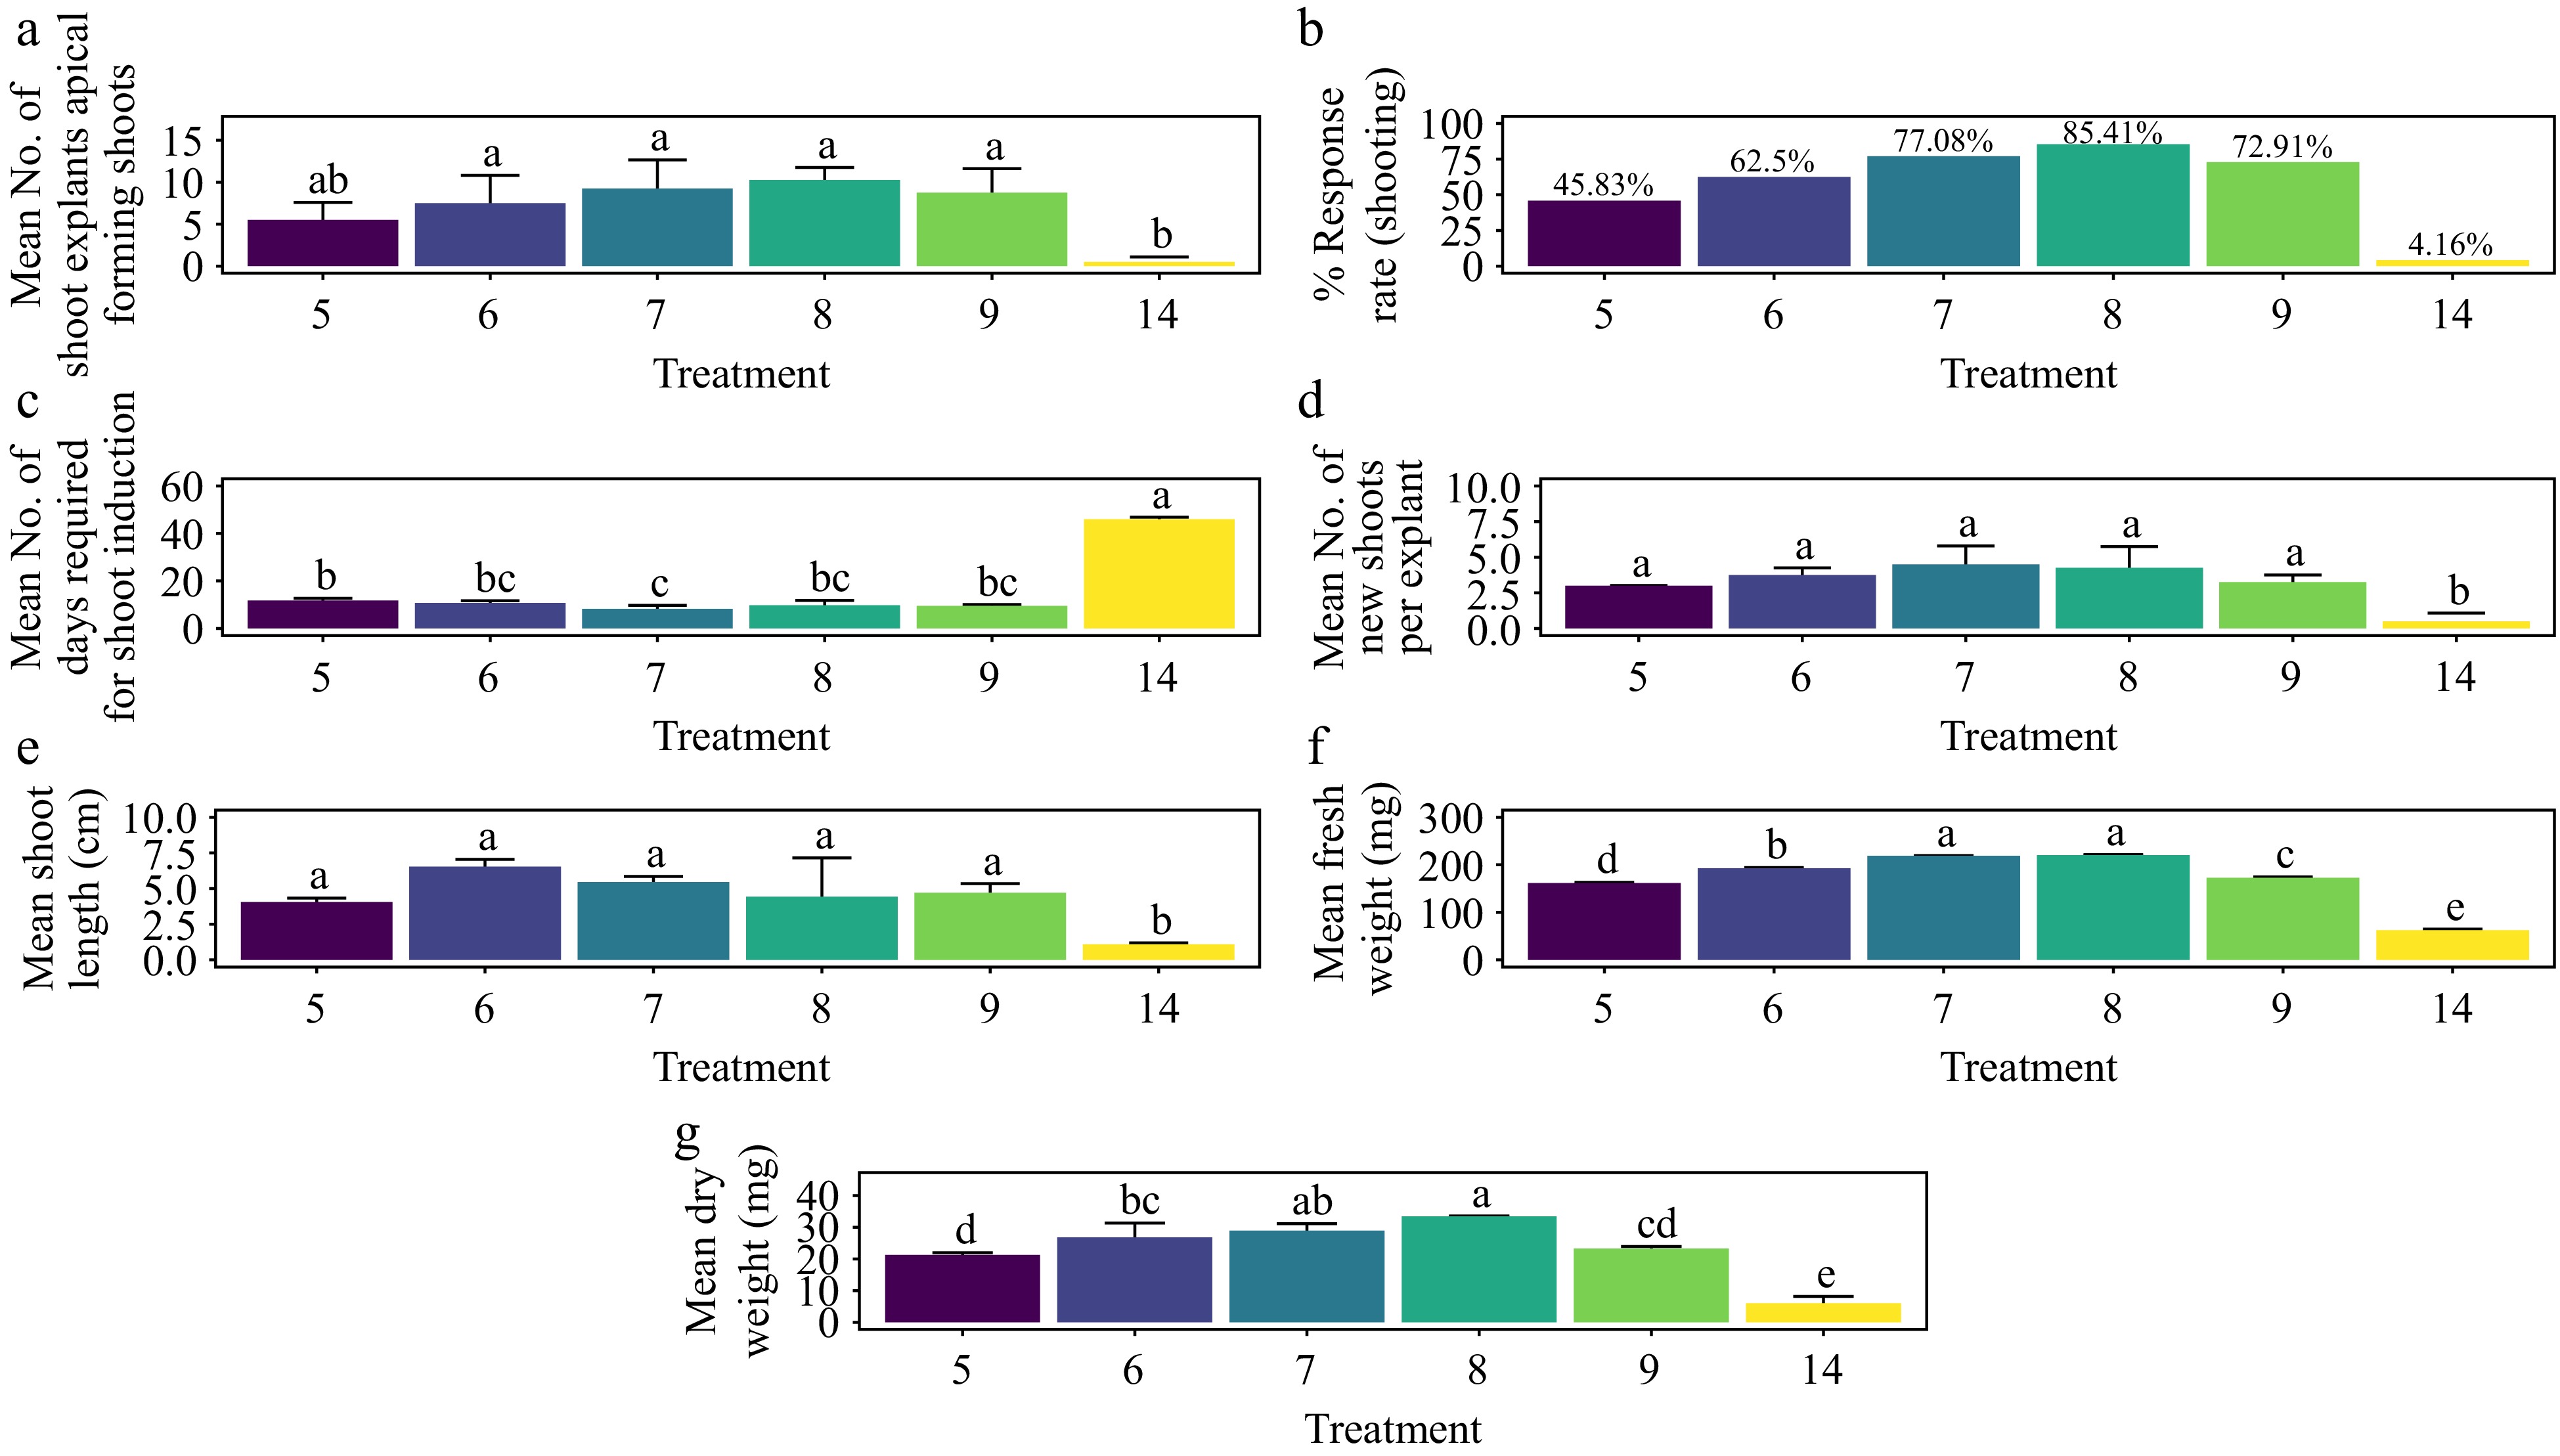
Figure 11.
Effect of PGRs on in vitro morphogenetic response (shoot multiplication) in apical shoot explant of Gloriosa superba L. (a) Mean apical shoot bud explants forming shoots, (b) response rate to shooting treatment, and (c) days required for shoot induction, (d) mean of new shoots per explant, (e) mean shoot length, (f) mean fresh weight of shoots, and (g) mean dry weight of shoots. Treatments were T5: 0.5 mg·L−1 BAP, 0.1 mg·L−1 NAA; T6: 1.0 mg·L−1 BAP, 0.2 mg·L−1 NAA; T7: 1.5 mg·L−1 BAP, 0.4 mg·L−1 NAA; T8: 2.0 mg·L−1 BAP, 0.6 mg·L−1 NAA; T9: 2.5 mg·L−1 BAP, 0.8 mg·L−1 NAA; T14: Control (media without PGRs). Bars indicate mean ± SE. Different letters indicate significant differences by Tukey's test at p ≤ 0.05.
-
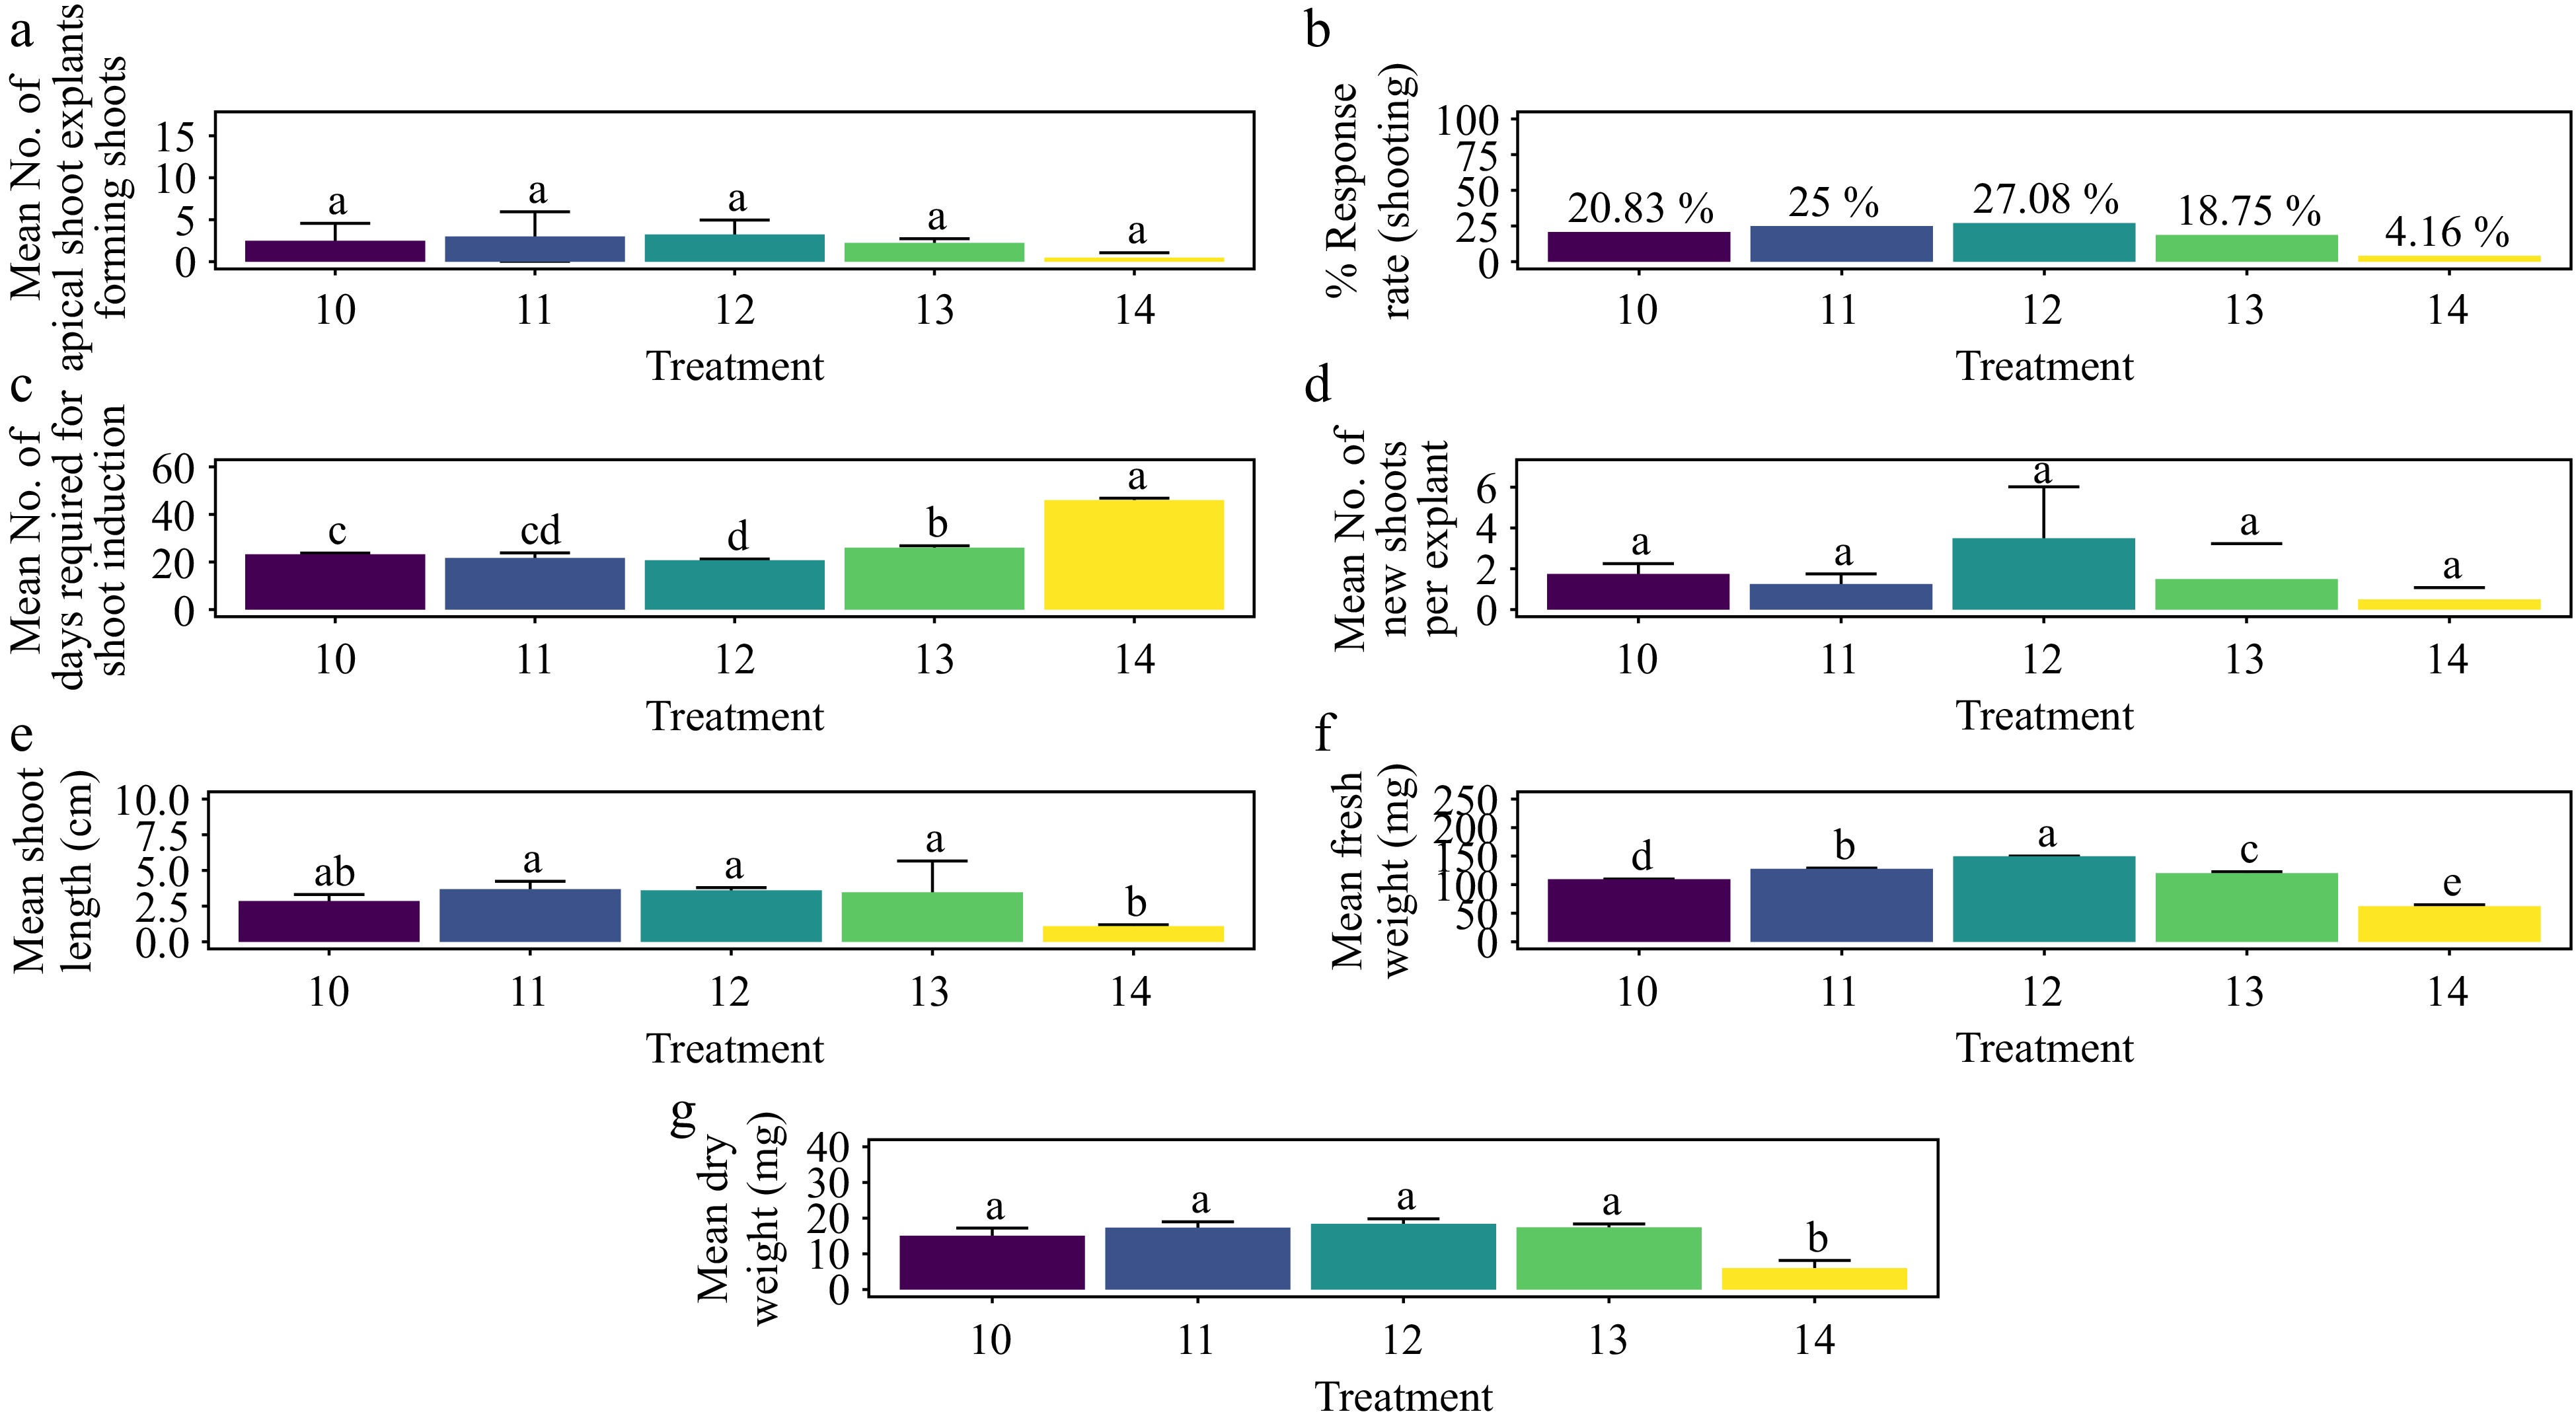
Figure 12.
Effect of PGRs on in vitro morphogenetic response (shoot multiplication) in apical shoot explant of Gloriosa superba L. (a) Mean apical shoot bud explants forming shoots, (b) response rate to shooting treatment, and (c) days required for shoot induction, (d) mean of new shoots per explant, (e) mean shoot length, (f) mean fresh weight of shoots, and (g) mean dry weight of shoots. Treatments were T10: 0.5 mg·L−1 KN; T11: 1.0 mg·L−1 KN; T12: 1.5 mg·L−1 KN; T13: 2.0 mg·L−1 KN; T14: Control (media without PGRs). Bars indicate mean ± SE. Different letters indicate significant differences by Tukey's test at p ≤ 0.05.
-
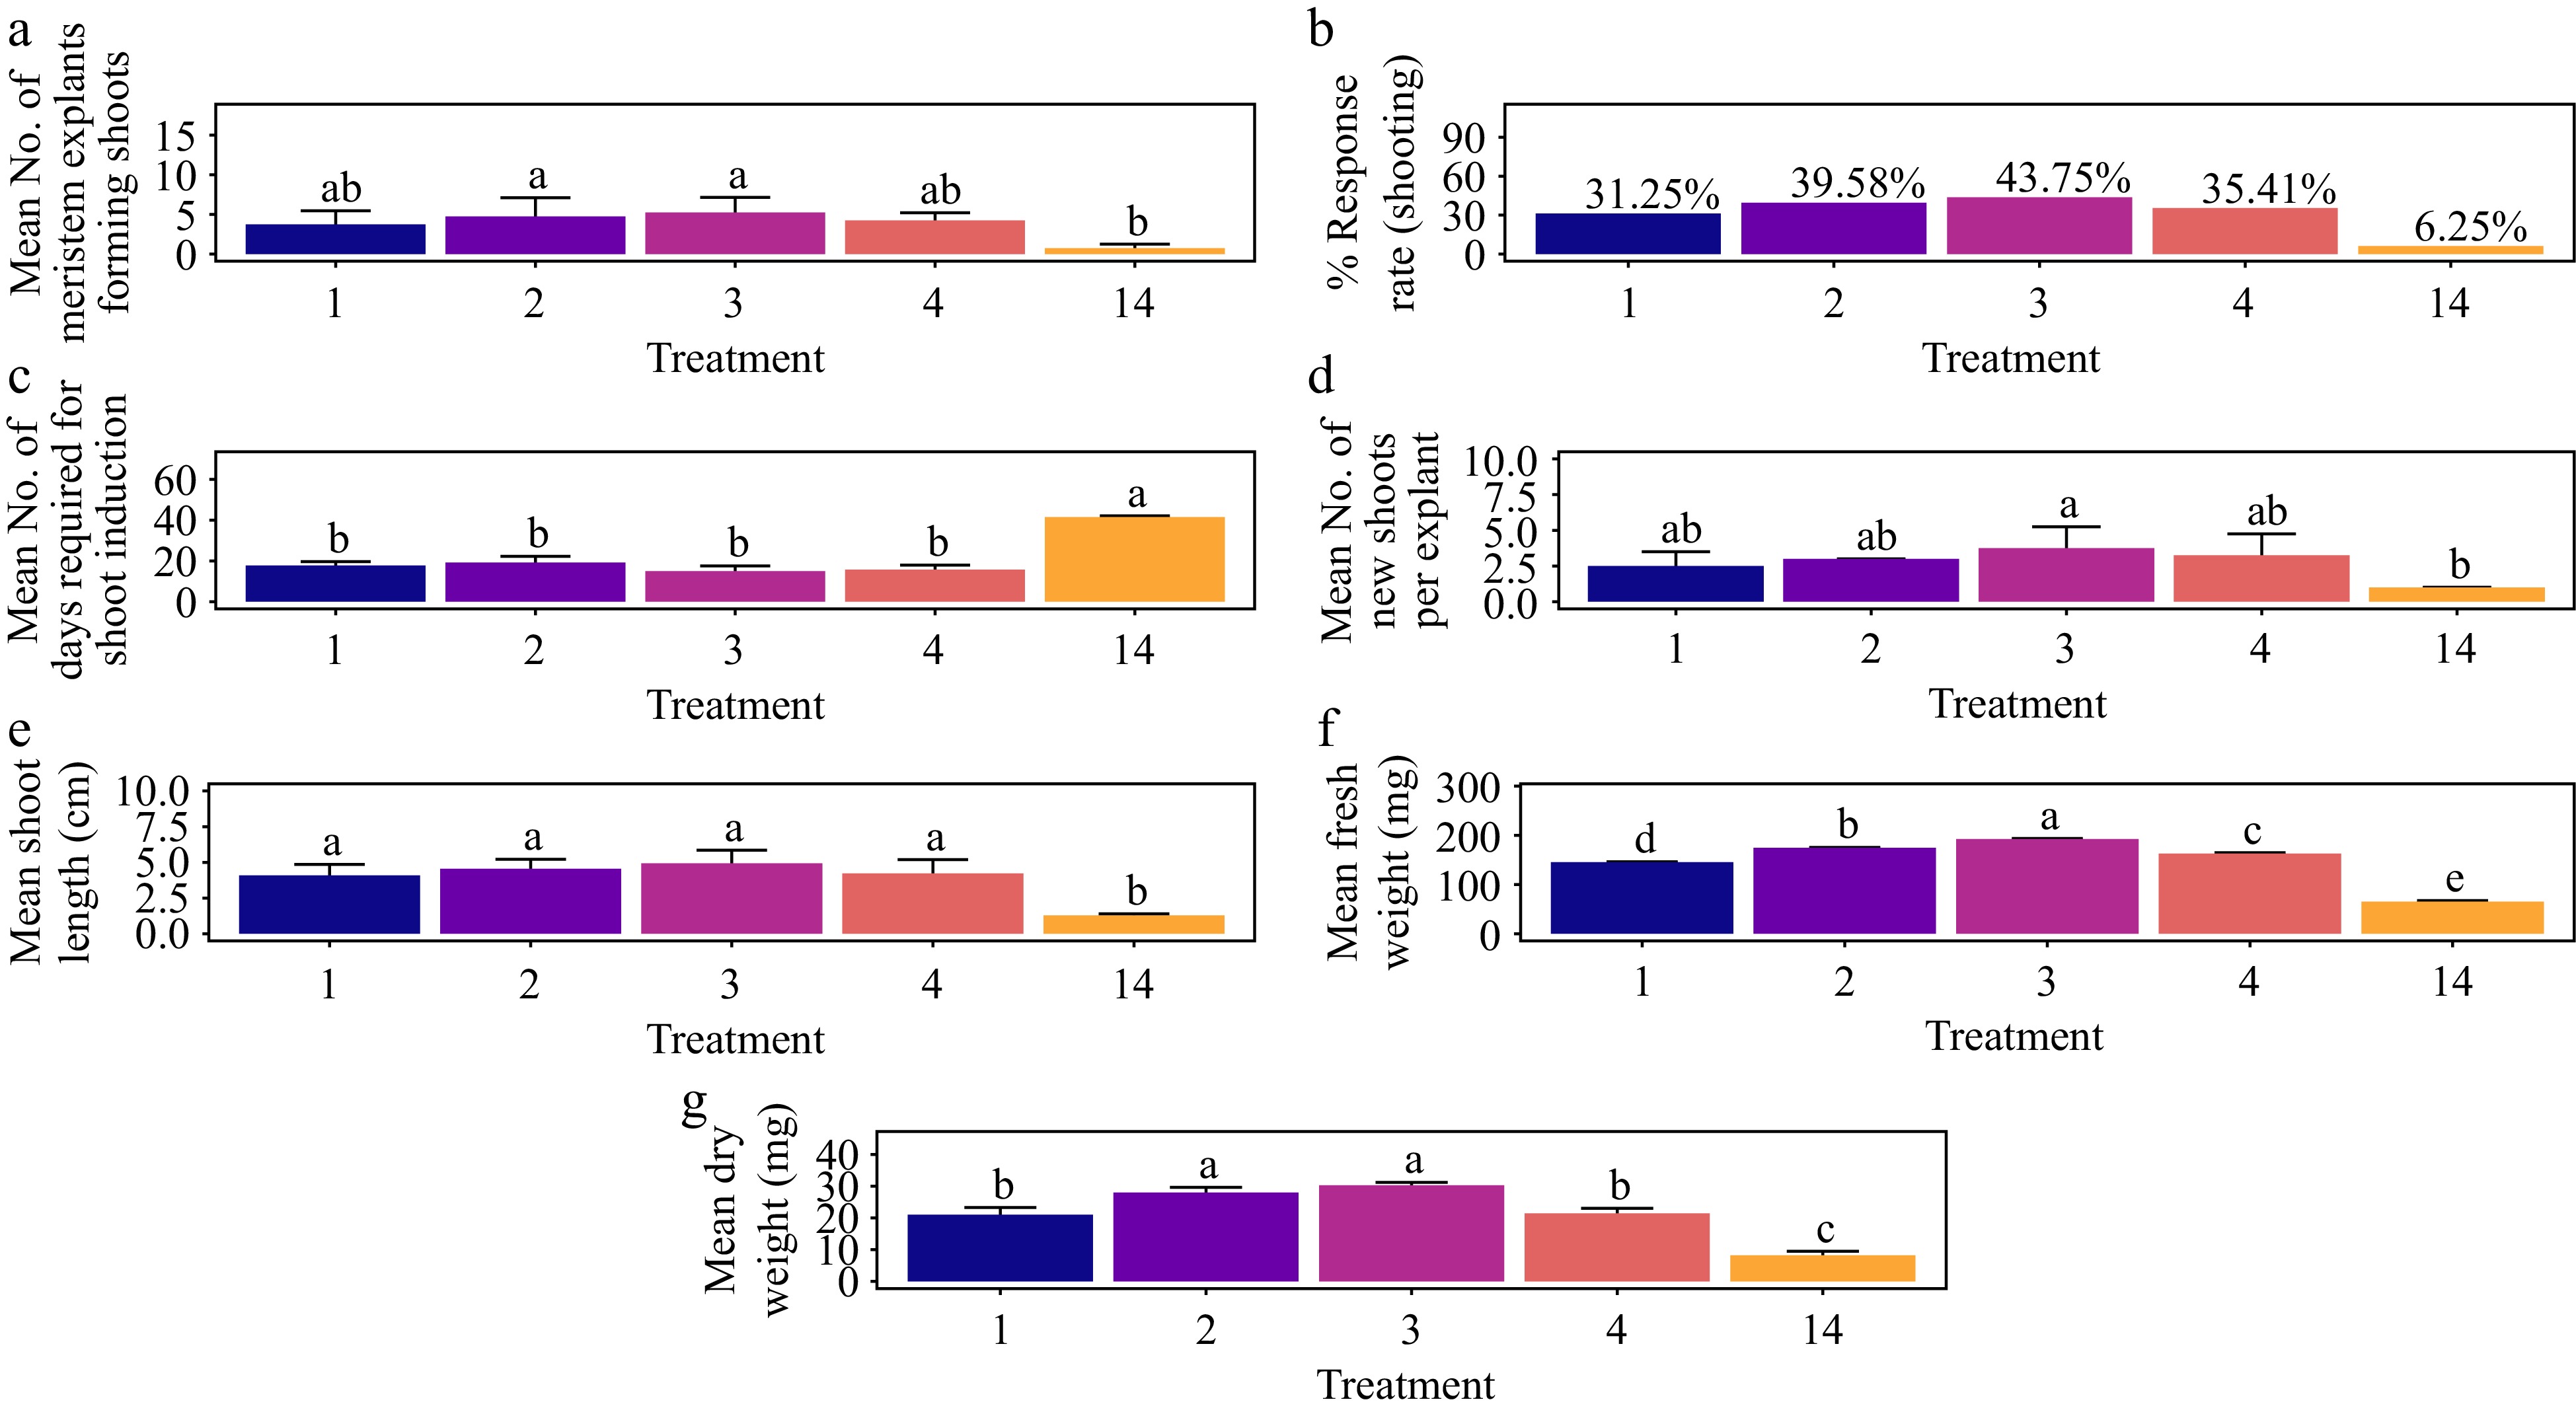
Figure 13.
Effect of PGRs on in vitro morphogenetic response (shoot multiplication) in meristem explant of Gloriosa superba L. (a) Mean meristem explants forming shoots, (b) response rate to shooting treatment, and (c) days required for shoot induction, (d) mean of new shoots per explant, (e) mean shoot length, (f) mean fresh weight of shoots, and (g) mean dry weight of shoots. Treatments were T1: 0.5 mg·L−1 BAP; T2: 1.0 mg·L−1 BAP; T3: 1.5 mg·L−1 BAP; T4: 2.0 mg·L−1 BAP; T14: Control (media without PGRs). Bars indicate mean ± SE. Different letters indicate significant differences by Tukey's test at p ≤ 0.05.
-
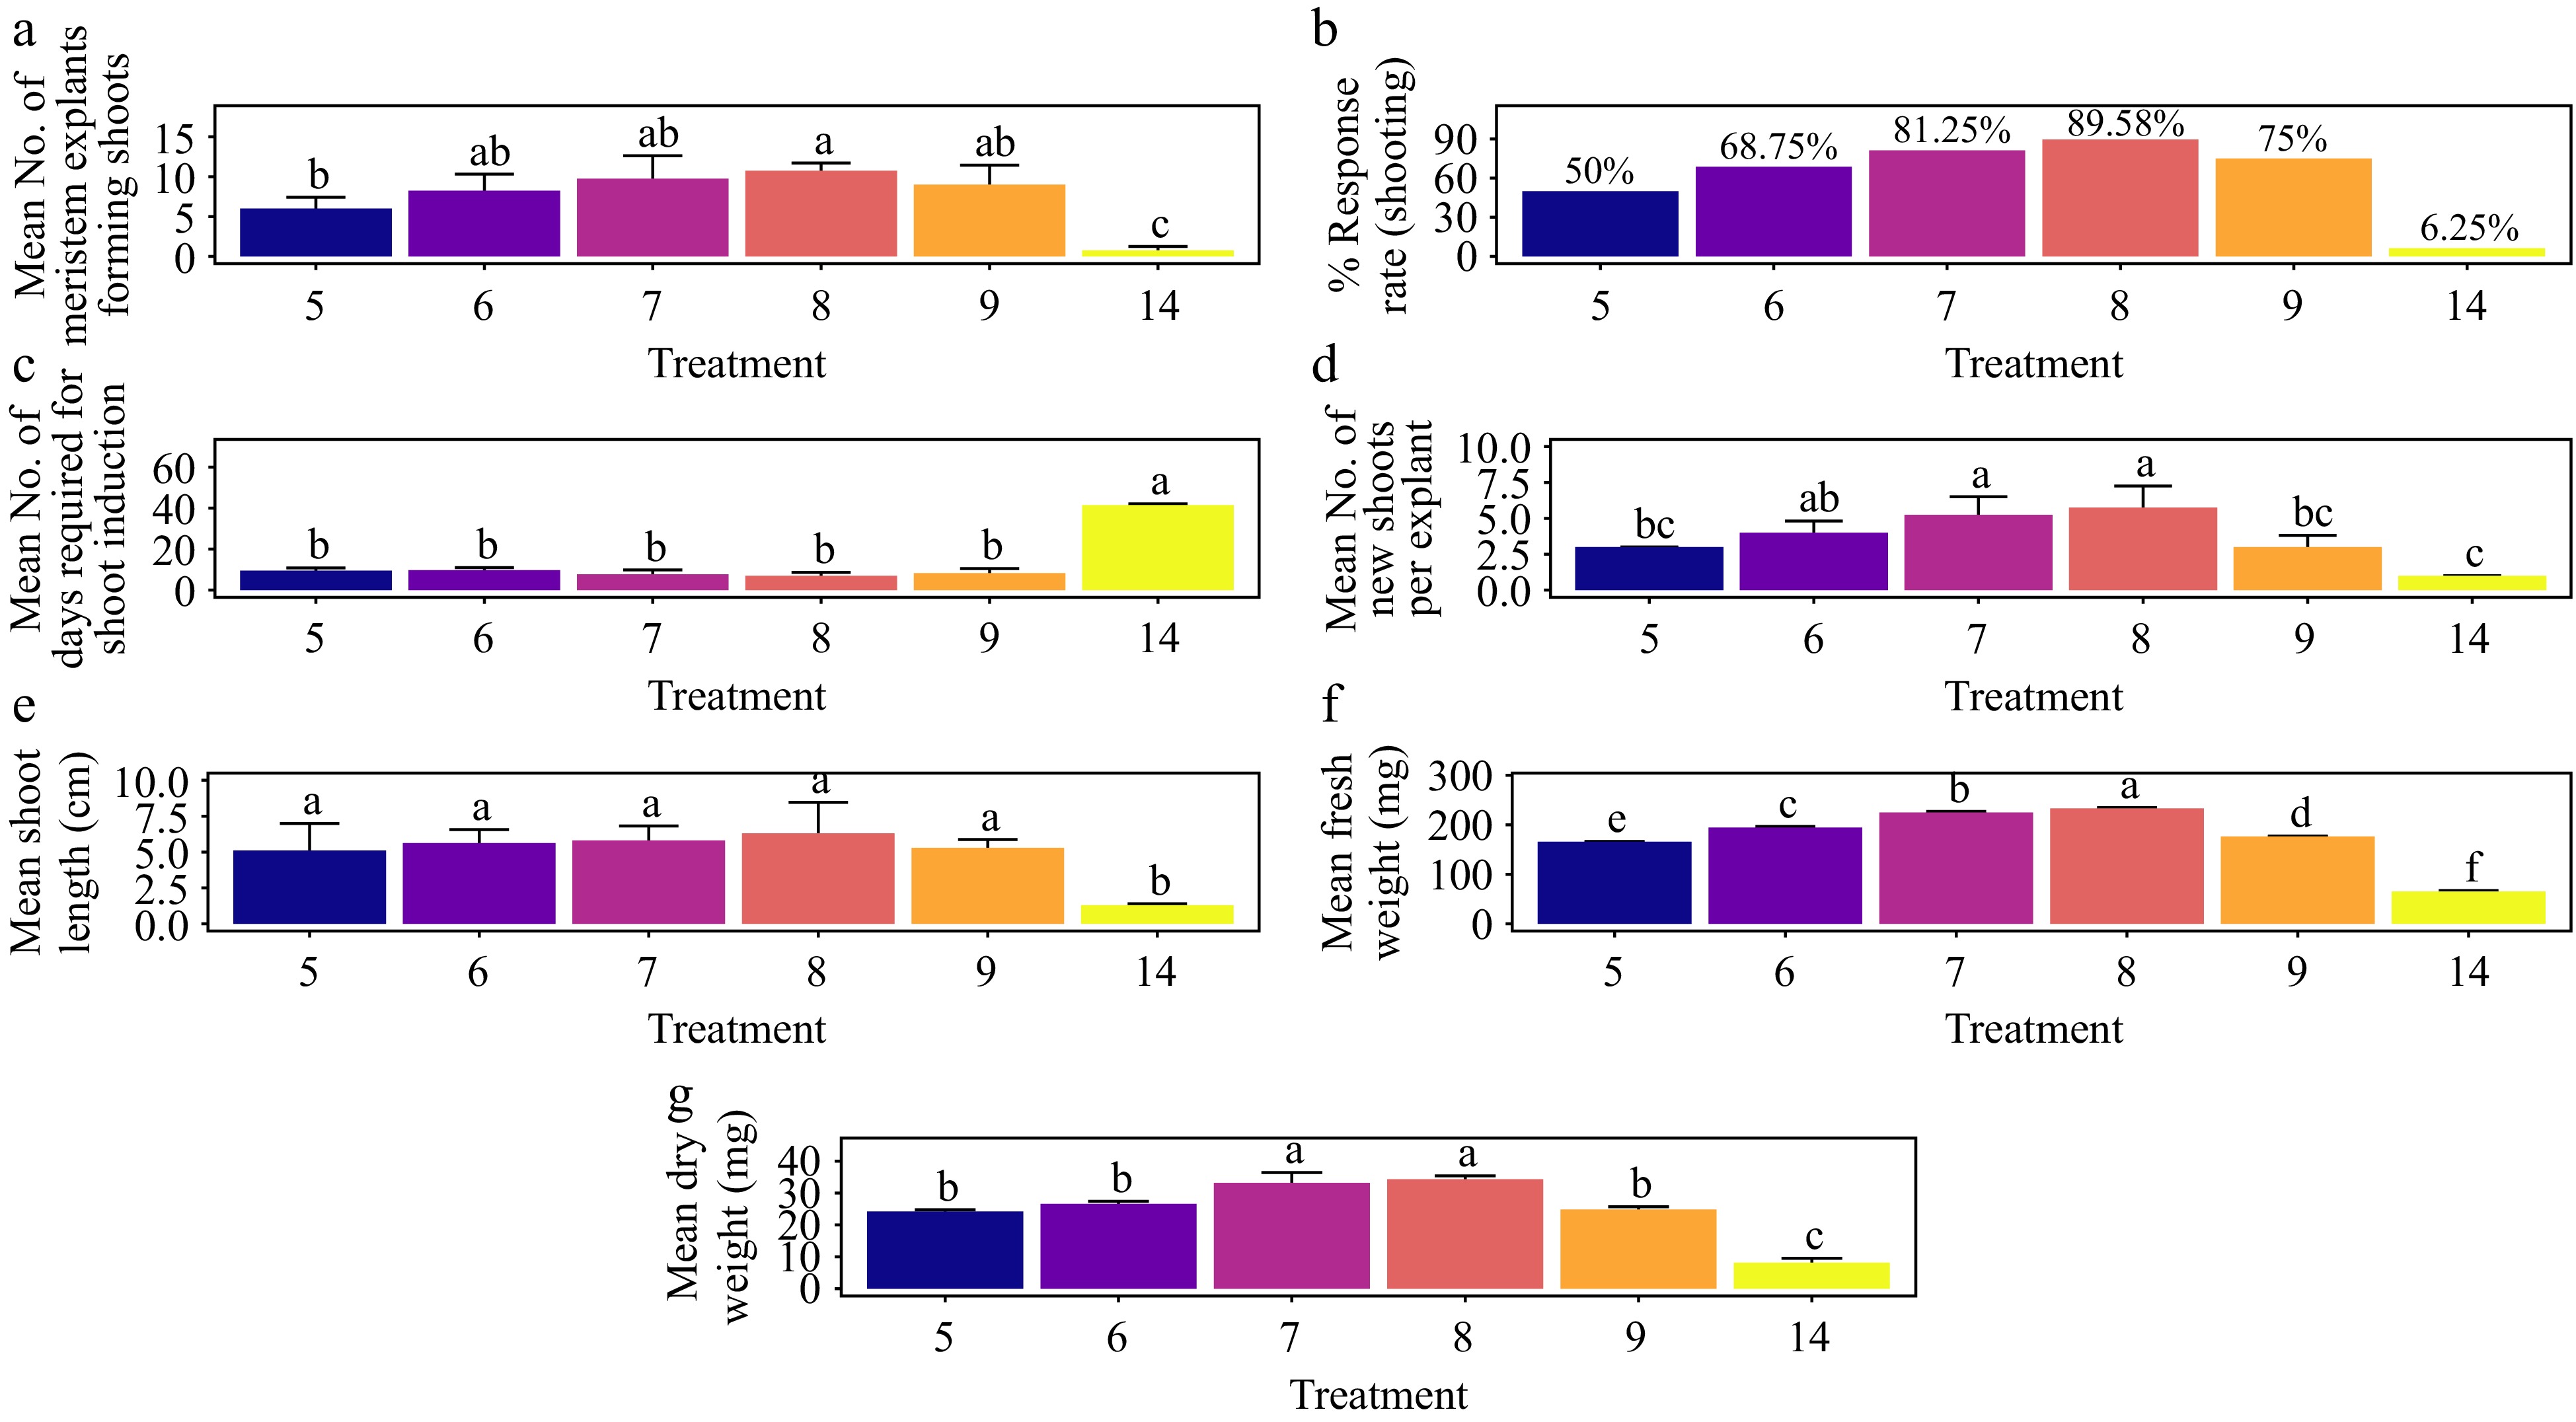
Figure 14.
Effect of PGRs on in vitro morphogenetic response (shoot multiplication) in meristem explant of Gloriosa superba L. (a) Mean meristem explants forming shoots, (b) response rate to shooting treatment, and (c) days required for shoot induction, (d) mean of new shoots per explant, (e) mean shoot length, (f) mean fresh weight of shoots, and (g) mean dry weight of shoots. Treatments are T5: 0.5 mg·L−1 BAP, 0.1 mg·L−1 NAA; T6: 1.0 mg·L−1 BAP, 0.2 mg·L−1 NAA; T7: 1.5 mg·L−1 BAP, 0.4 mg·L−1 NAA; T8: 2.0 mg·L−1 BAP, 0.6 mg·L−1 NAA; T9: 2.5 mg·L−1 BAP, 0.8 mg·L−1 NAA; T14: Control (media without PGRs). Bars indicate mean ± SE. Different letters indicate significant differences by Tukey's test at p ≤ 0.05.
-
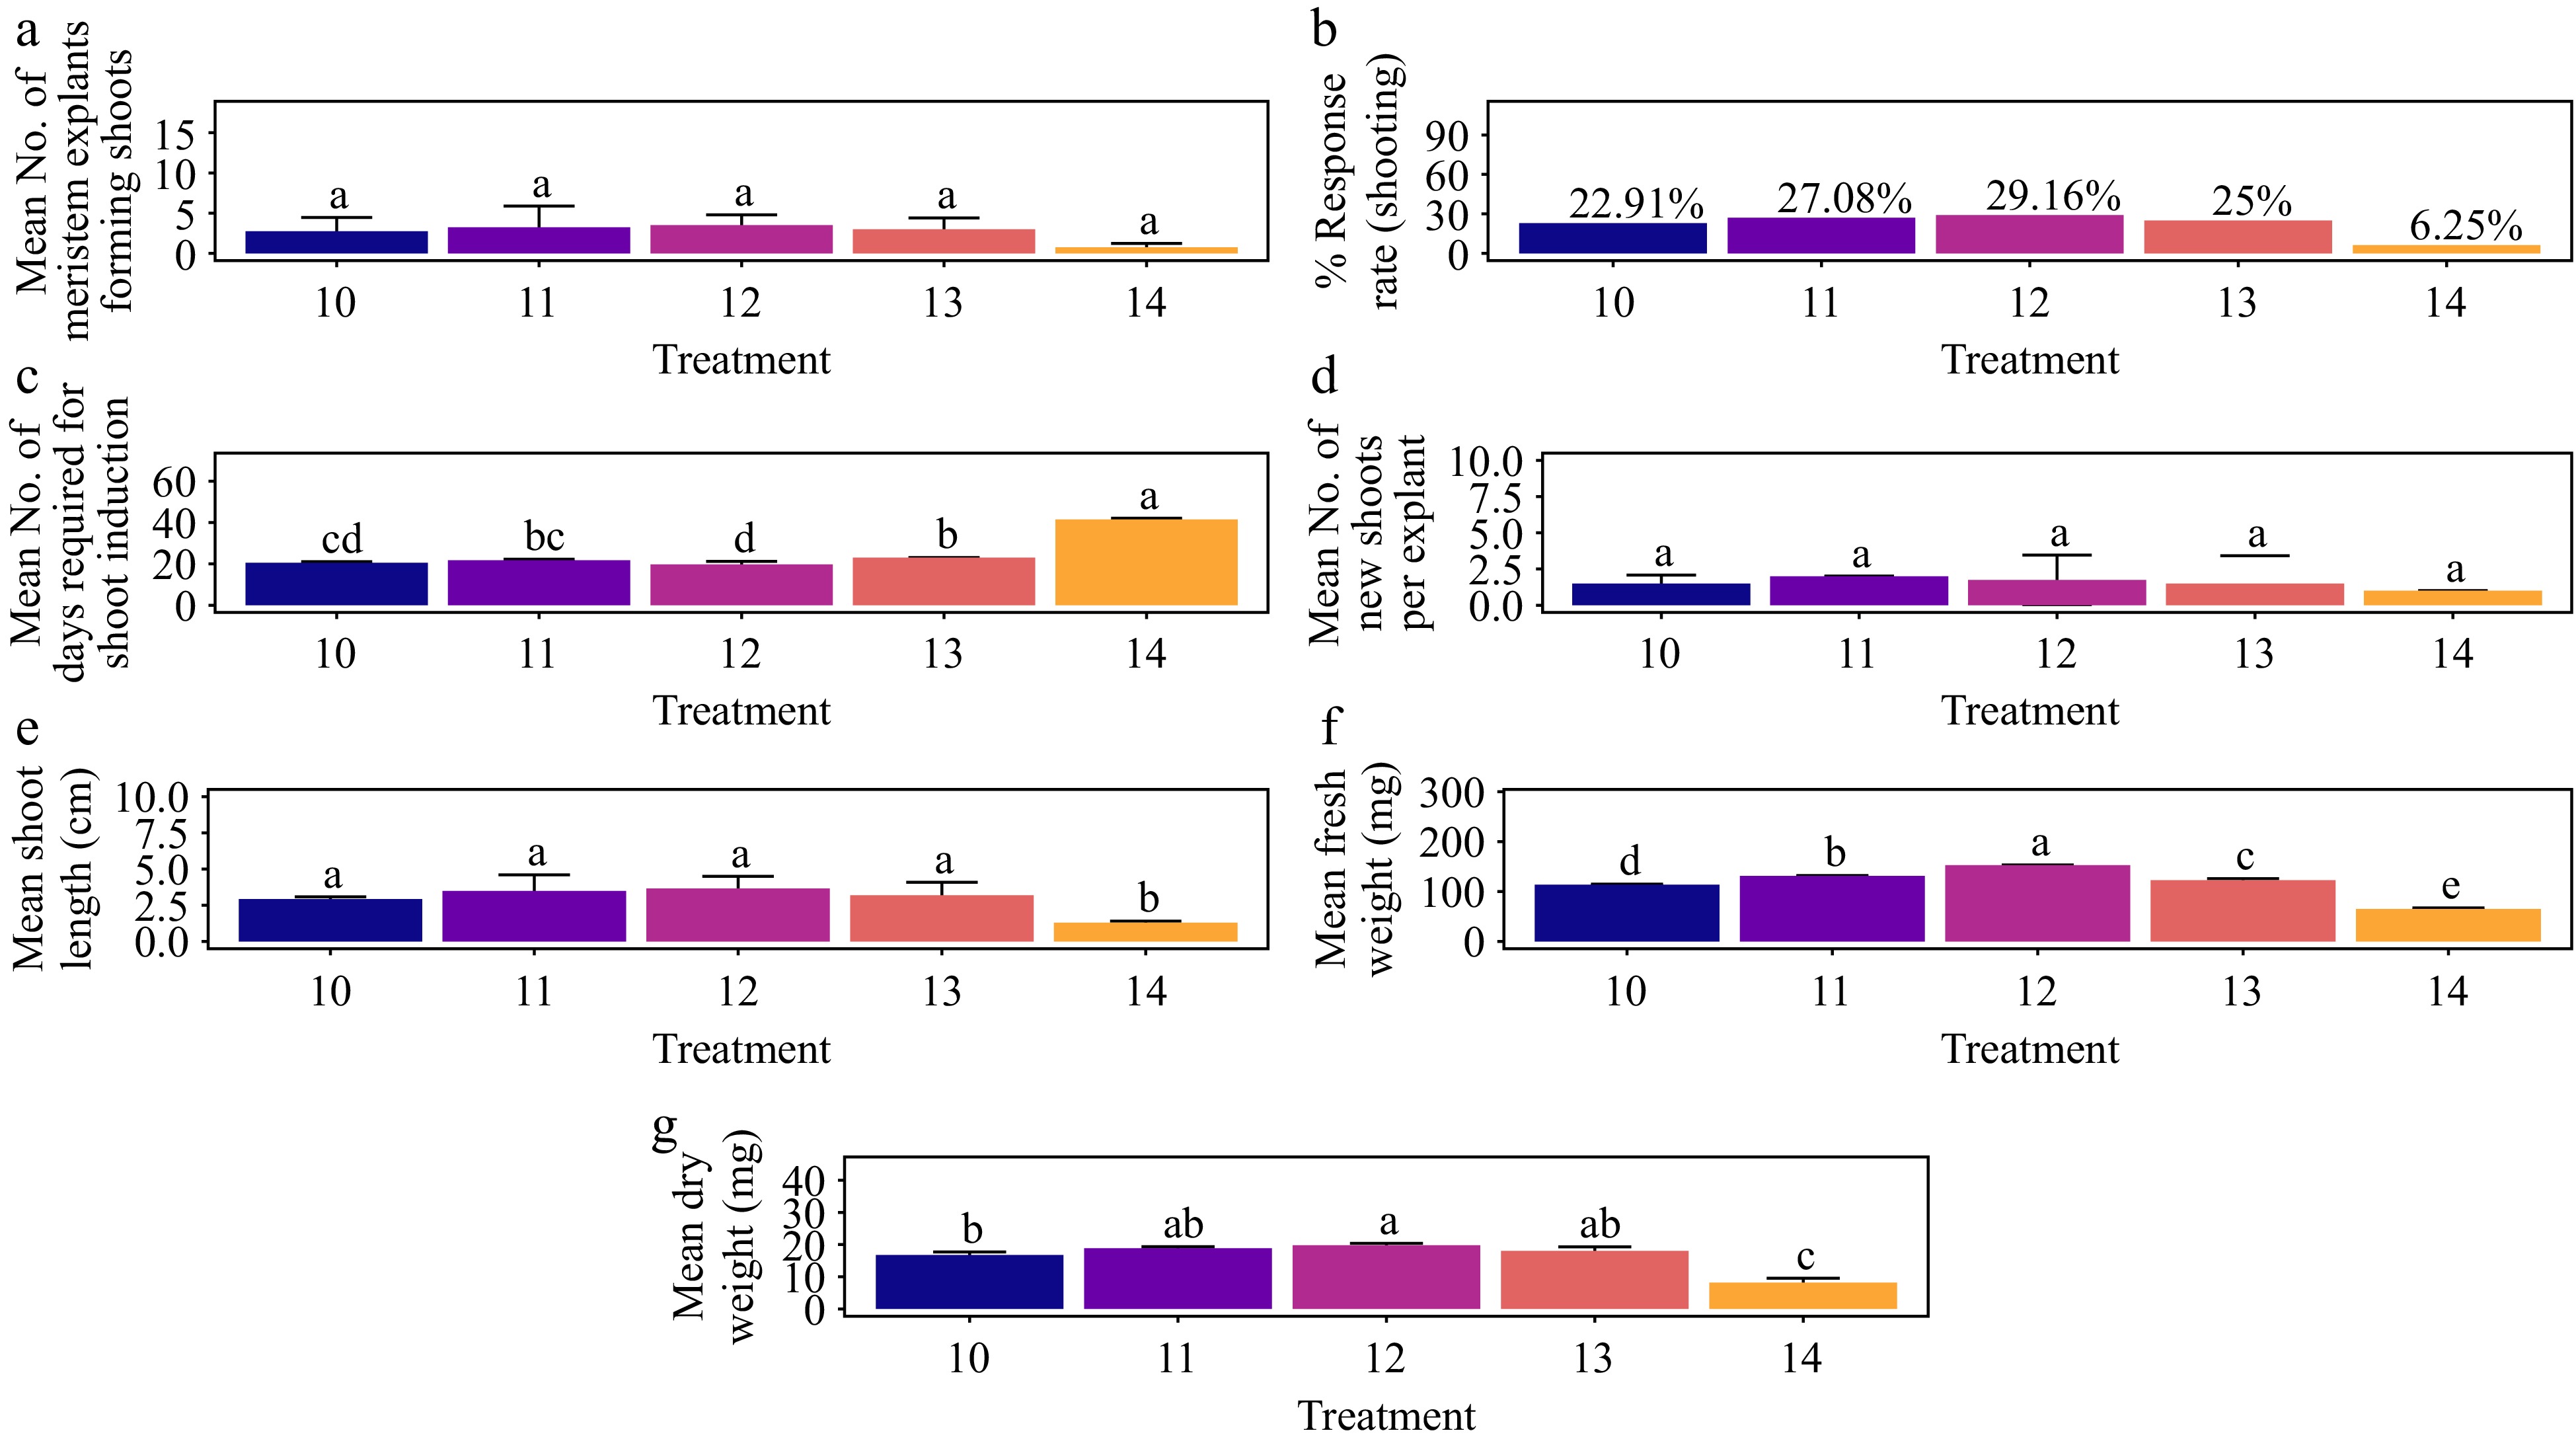
Figure 15.
Effect of PGRs on in vitro morphogenetic response (shoot multiplication) in meristem explant of Gloriosa superba L. (a) Mean meristem explants forming shoots, (b) response rate to shooting treatment, and (c) days required for shoot induction, (d) mean of new shoots per explant, (e) mean shoot length, (f) mean fresh weight of shoots, and (g) mean dry weight of shoots. Treatments were T10: 0.5 mg·L−1 KN; T11: 1.0 mg·L−1 KN; T12: 1.5 mg·L−1 KN; T13: 2.0 mg·L−1 KN; T14: Control (media without PGRs). Bars indicate mean ± SE. Different letters indicate significant differences by Tukey's test at p ≤ 0.05.
-
Group Treatments PGR combinations (mg·L−1) BAP TDZ T1 (control) 0.0 0.0 1 T2 0.5 0.0 T3 1.0 0.0 T4 1.5 0.0 T5 2.0 0.0 T6 2.5 0.0 2 T7 0.5 0.1 T8 0.5 0.2 T9 1.0 0.2 T10 1.0 0.5 T11 1.5 0.2 T12 1.5 0.5 T13 1.5 1.0 T14 2.0 0.5 T15 2.0 1.0 T16 2.5 0.5 T17 2.5 1.0 Table 1.
Concentrations and combinations of 6-benzylaminopurine (BAP) and thidiazuron (TDZ) evaluated for their efficacy in inducing direct organogenesis in nodal explants of Gloriosa superba L.
-
Group Treatments PGR combinations (mg·L−1) BAP KN AC (mg·L−1) T1 (control) 0.0 0.0 0.0 1 T2 0.2 − 1.5 T3 0.5 − 1.5 T4 1.0 − 1.5 T5 1.5 − 1.5 T6 2.0 − 1.5 T7 2.5 − 1.5 2 T8 − 0.2 1.5 T9 − 0.5 1.5 T10 − 1.0 1.5 T11 − 1.5 1.5 T12 − 2.0 1.5 T13 − 2.5 1.5 ADS (mg·L−1) 3 T14 0.5 − 10 T15 1.0 − 10 T16 1.5 − 10 T17 0.5 − 20 T18 1.0 − 20 T19 1.5 − 20 4 T20 − 0.5 10 T21 − 1.0 10 T22 − 1.5 10 T23 − 0.5 20 T24 − 1.0 20 T25 − 1.5 20 Table 2.
Concentrations and combinations of 6-benzylaminopurine (BAP), kinetin (KN), activated charcoal (AC), and adenine sulphate (ADS) evaluated for their efficacy in inducing direct organogenesis in non-dormant corm explants of Gloriosa superba L.
-
Group Treatments PGR combinations (mg·L−1) BAP TDZ ADS T1 (control) 0.0 0.0 0.0 1 T2 0.5 0.0 5 T3 1.0 0.0 5 T4 1.5 0.0 5 T5 2.0 0.0 5 T6 2.5 0.0 5 2 T7 0.5 0.1 8 T8 0.5 0.2 8 T9 1.0 0.2 8 T10 1.0 0.5 8 T11 1.5 0.2 8 T12 1.5 0.5 8 3 T13 1.5 1.0 10 T14 2.0 0.5 10 T15 2.0 1.0 10 T16 2.5 0.5 10 T17 2.5 1.0 10 Table 3.
Concentrations and combinations of 6-benzylaminopurine (BAP), thidiazuron (TDZ), and adenine sulphate (ADS) evaluated for their efficacy in inducing direct organogenesis in shoot tip explants of Gloriosa superba L.
-
Group Treatments PGR combinations (mg·L−1) BAP NAA KN 1 T1 0.5 − − T2 1.0 − − T3 1.5 − − T4 2.0 − − 2 T5 0.5 0.1 − T6 1.0 0.2 − T7 1.5 0.4 − T8 2.0 0.6 − T9 2.5 0.8 − 3 T10 − − 0.5 T11 − − 1.0 T12 − − 1.5 T13 − − 2.0 T14 (control) 0.0 0.0 0.0 Table 4.
Concentrations and combinations of 6-benzylaminopurine (BAP), kinetin (KN), and 1-naphthaleneacetic acid (NAA) evaluated for their efficacy in inducing direct organogenesis in apical shoot and meristem explants of Gloriosa superba L.
-
Treatments ½ MS + Auxins (mg·L−1) IBA T1 0.5 T2 1.0 T3 1.5 IAA T4 0.5 T5 1.0 T6 1.5 NAA T7 0.5 T8 1.0 T9 1.5 T10 (control) 0.0 Table 5.
Concentrations of indole-3-butyric acid (IBA), indole-3-acetic acid (IAA), and 1-naphthaleneacetic acid (NAA) evaluated for their efficacy in inducing rooting in micro shoots derived from nodal, non-dormant corm, shoot tip, apical shoot, and meristem explants of Gloriosa superba L.
Figures
(15)
Tables
(5)