-
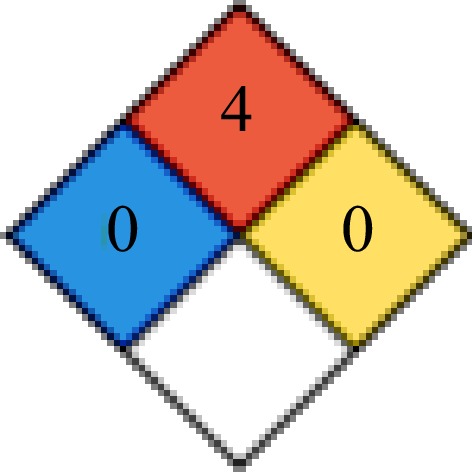
Figure 1.
4 hazard classes.
-
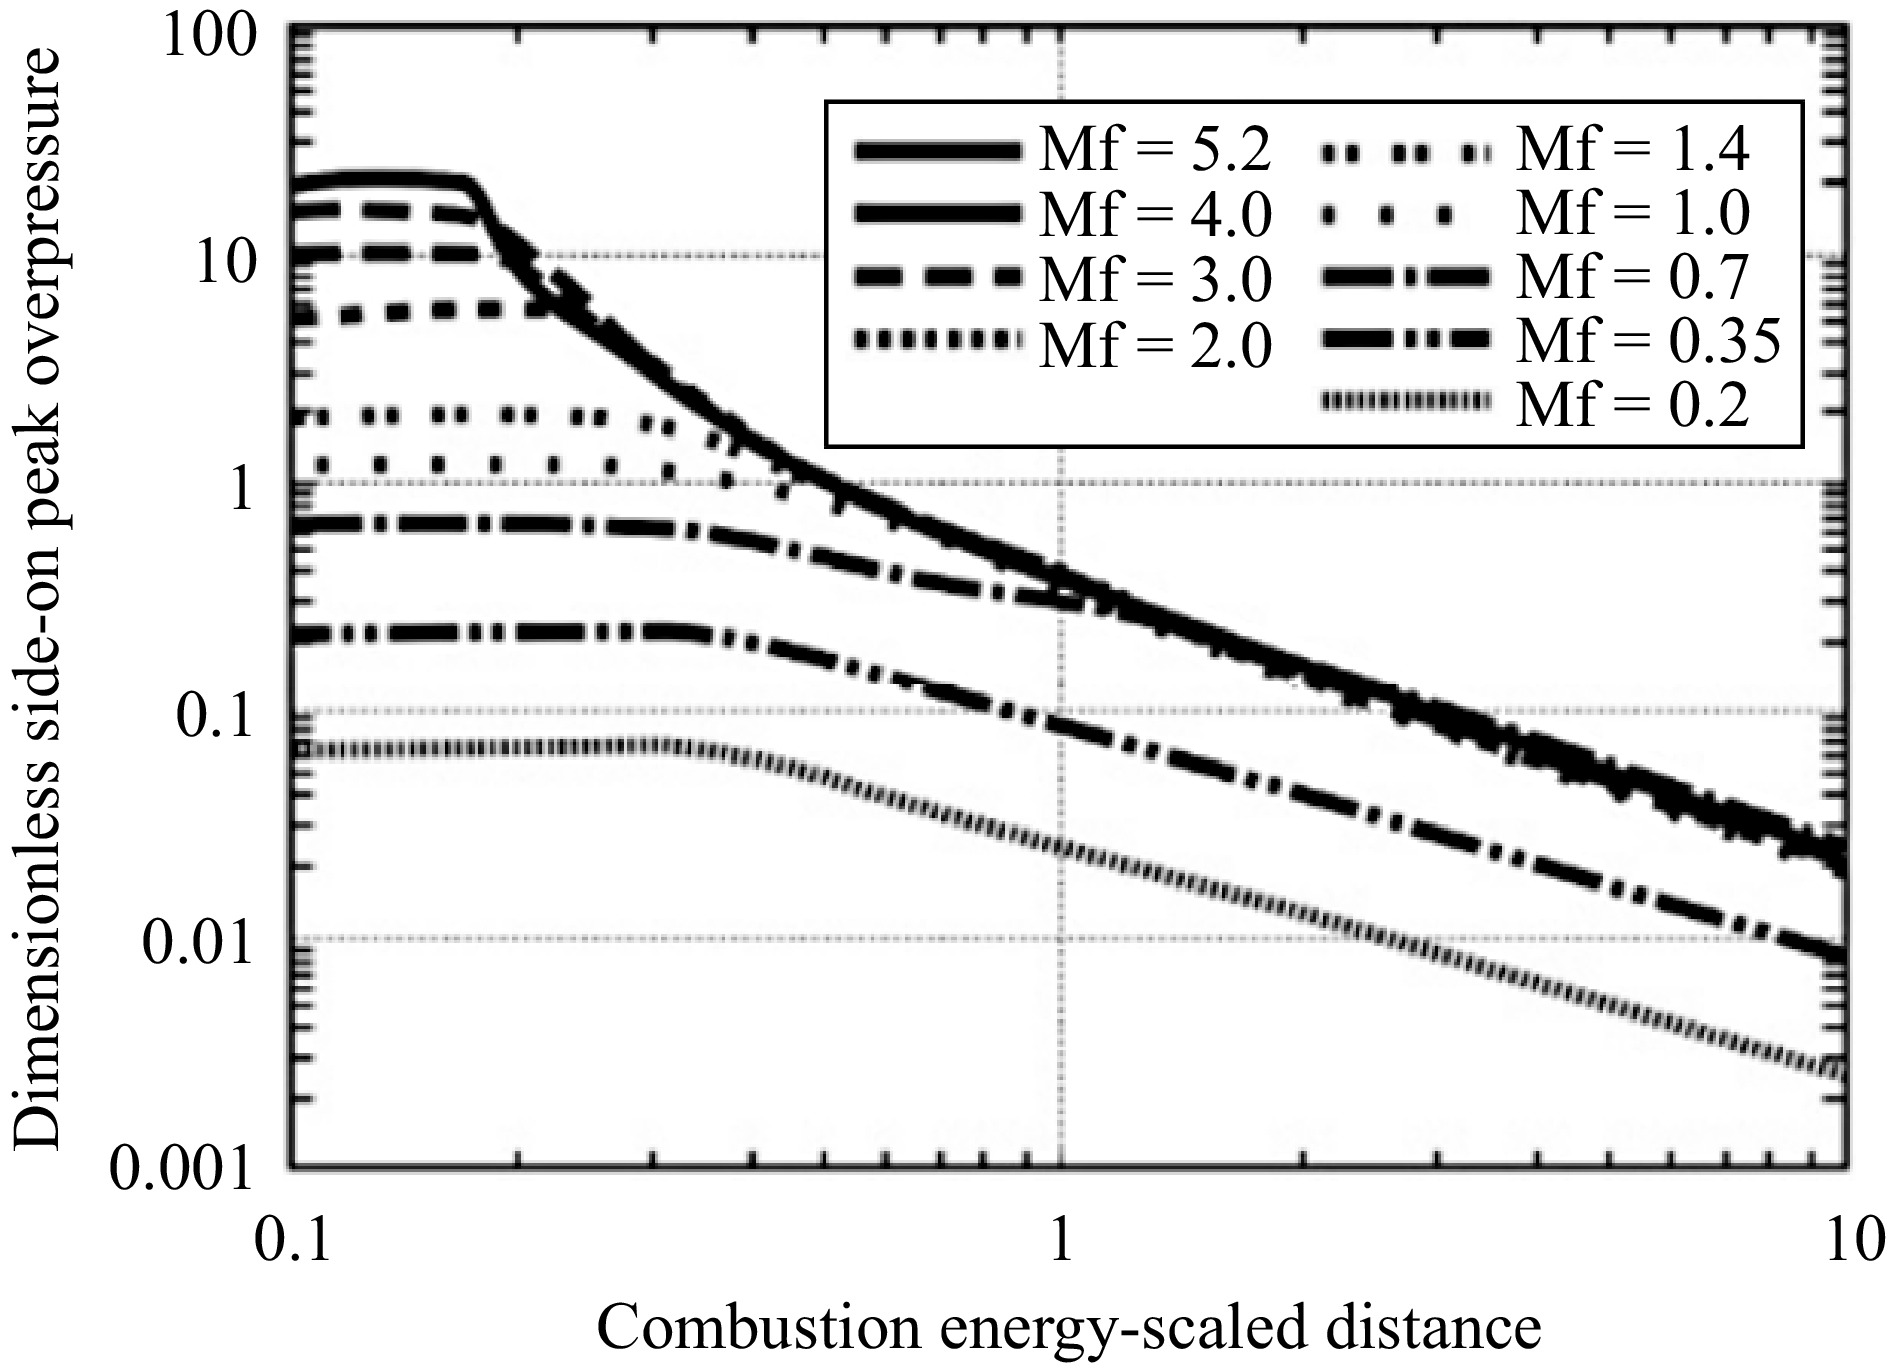
Figure 2.
Variation of peak pressure with combustion energy scale distance for different Mach numbers[31].
-
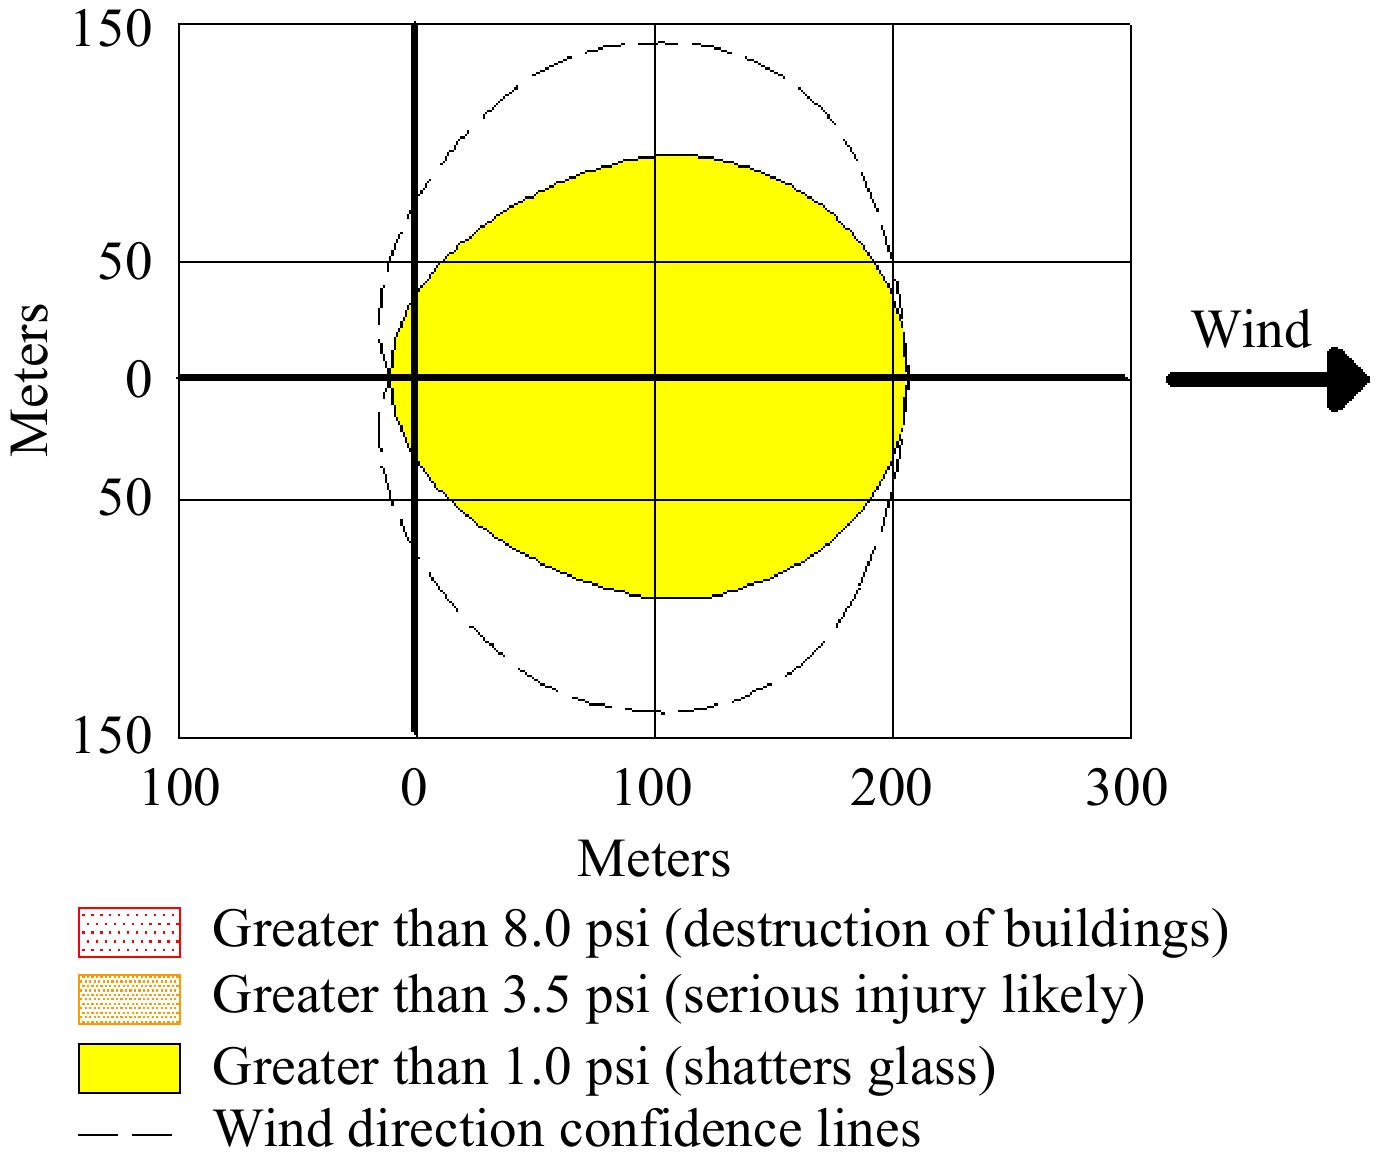
Figure 3.
Explosion threat zone of the vapor cloud for hydrogen storage tanks (Scenario -1)
-
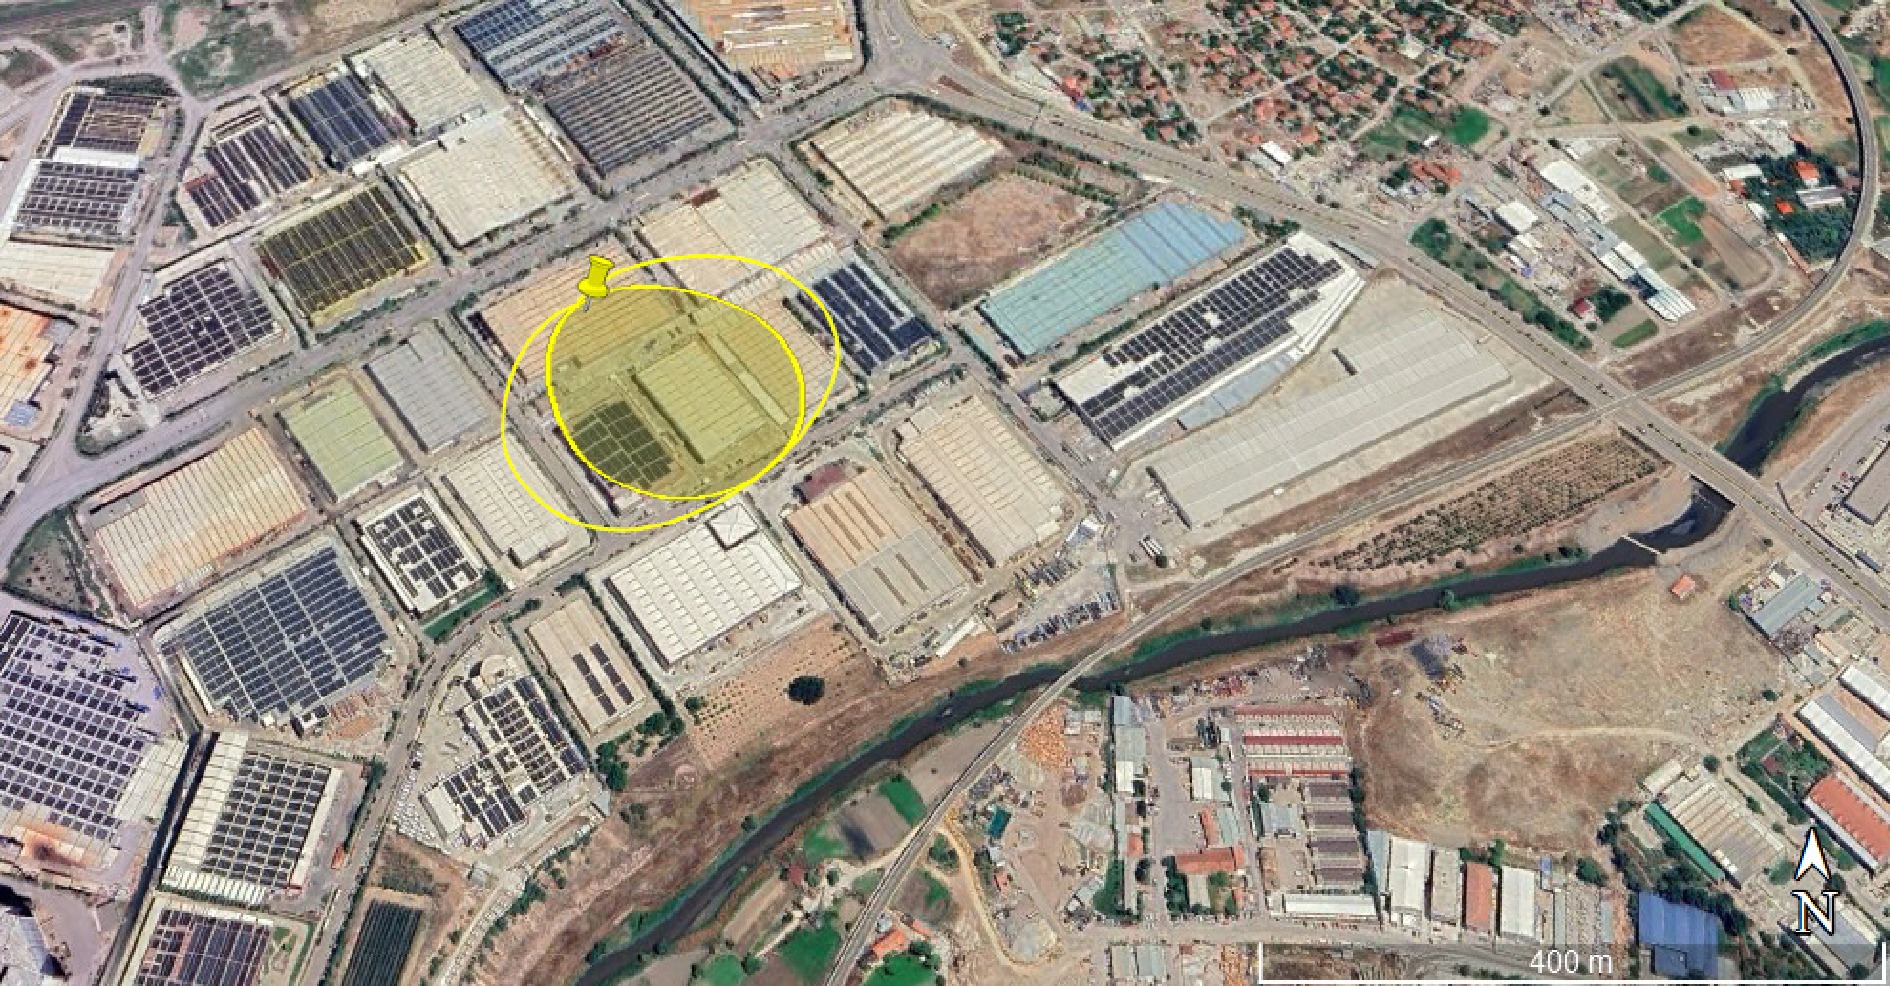
Figure 4.
Google Earth image of the explosion threat zone of the vapor cloud for hydrogen storage tanks (Scenario -1).
-
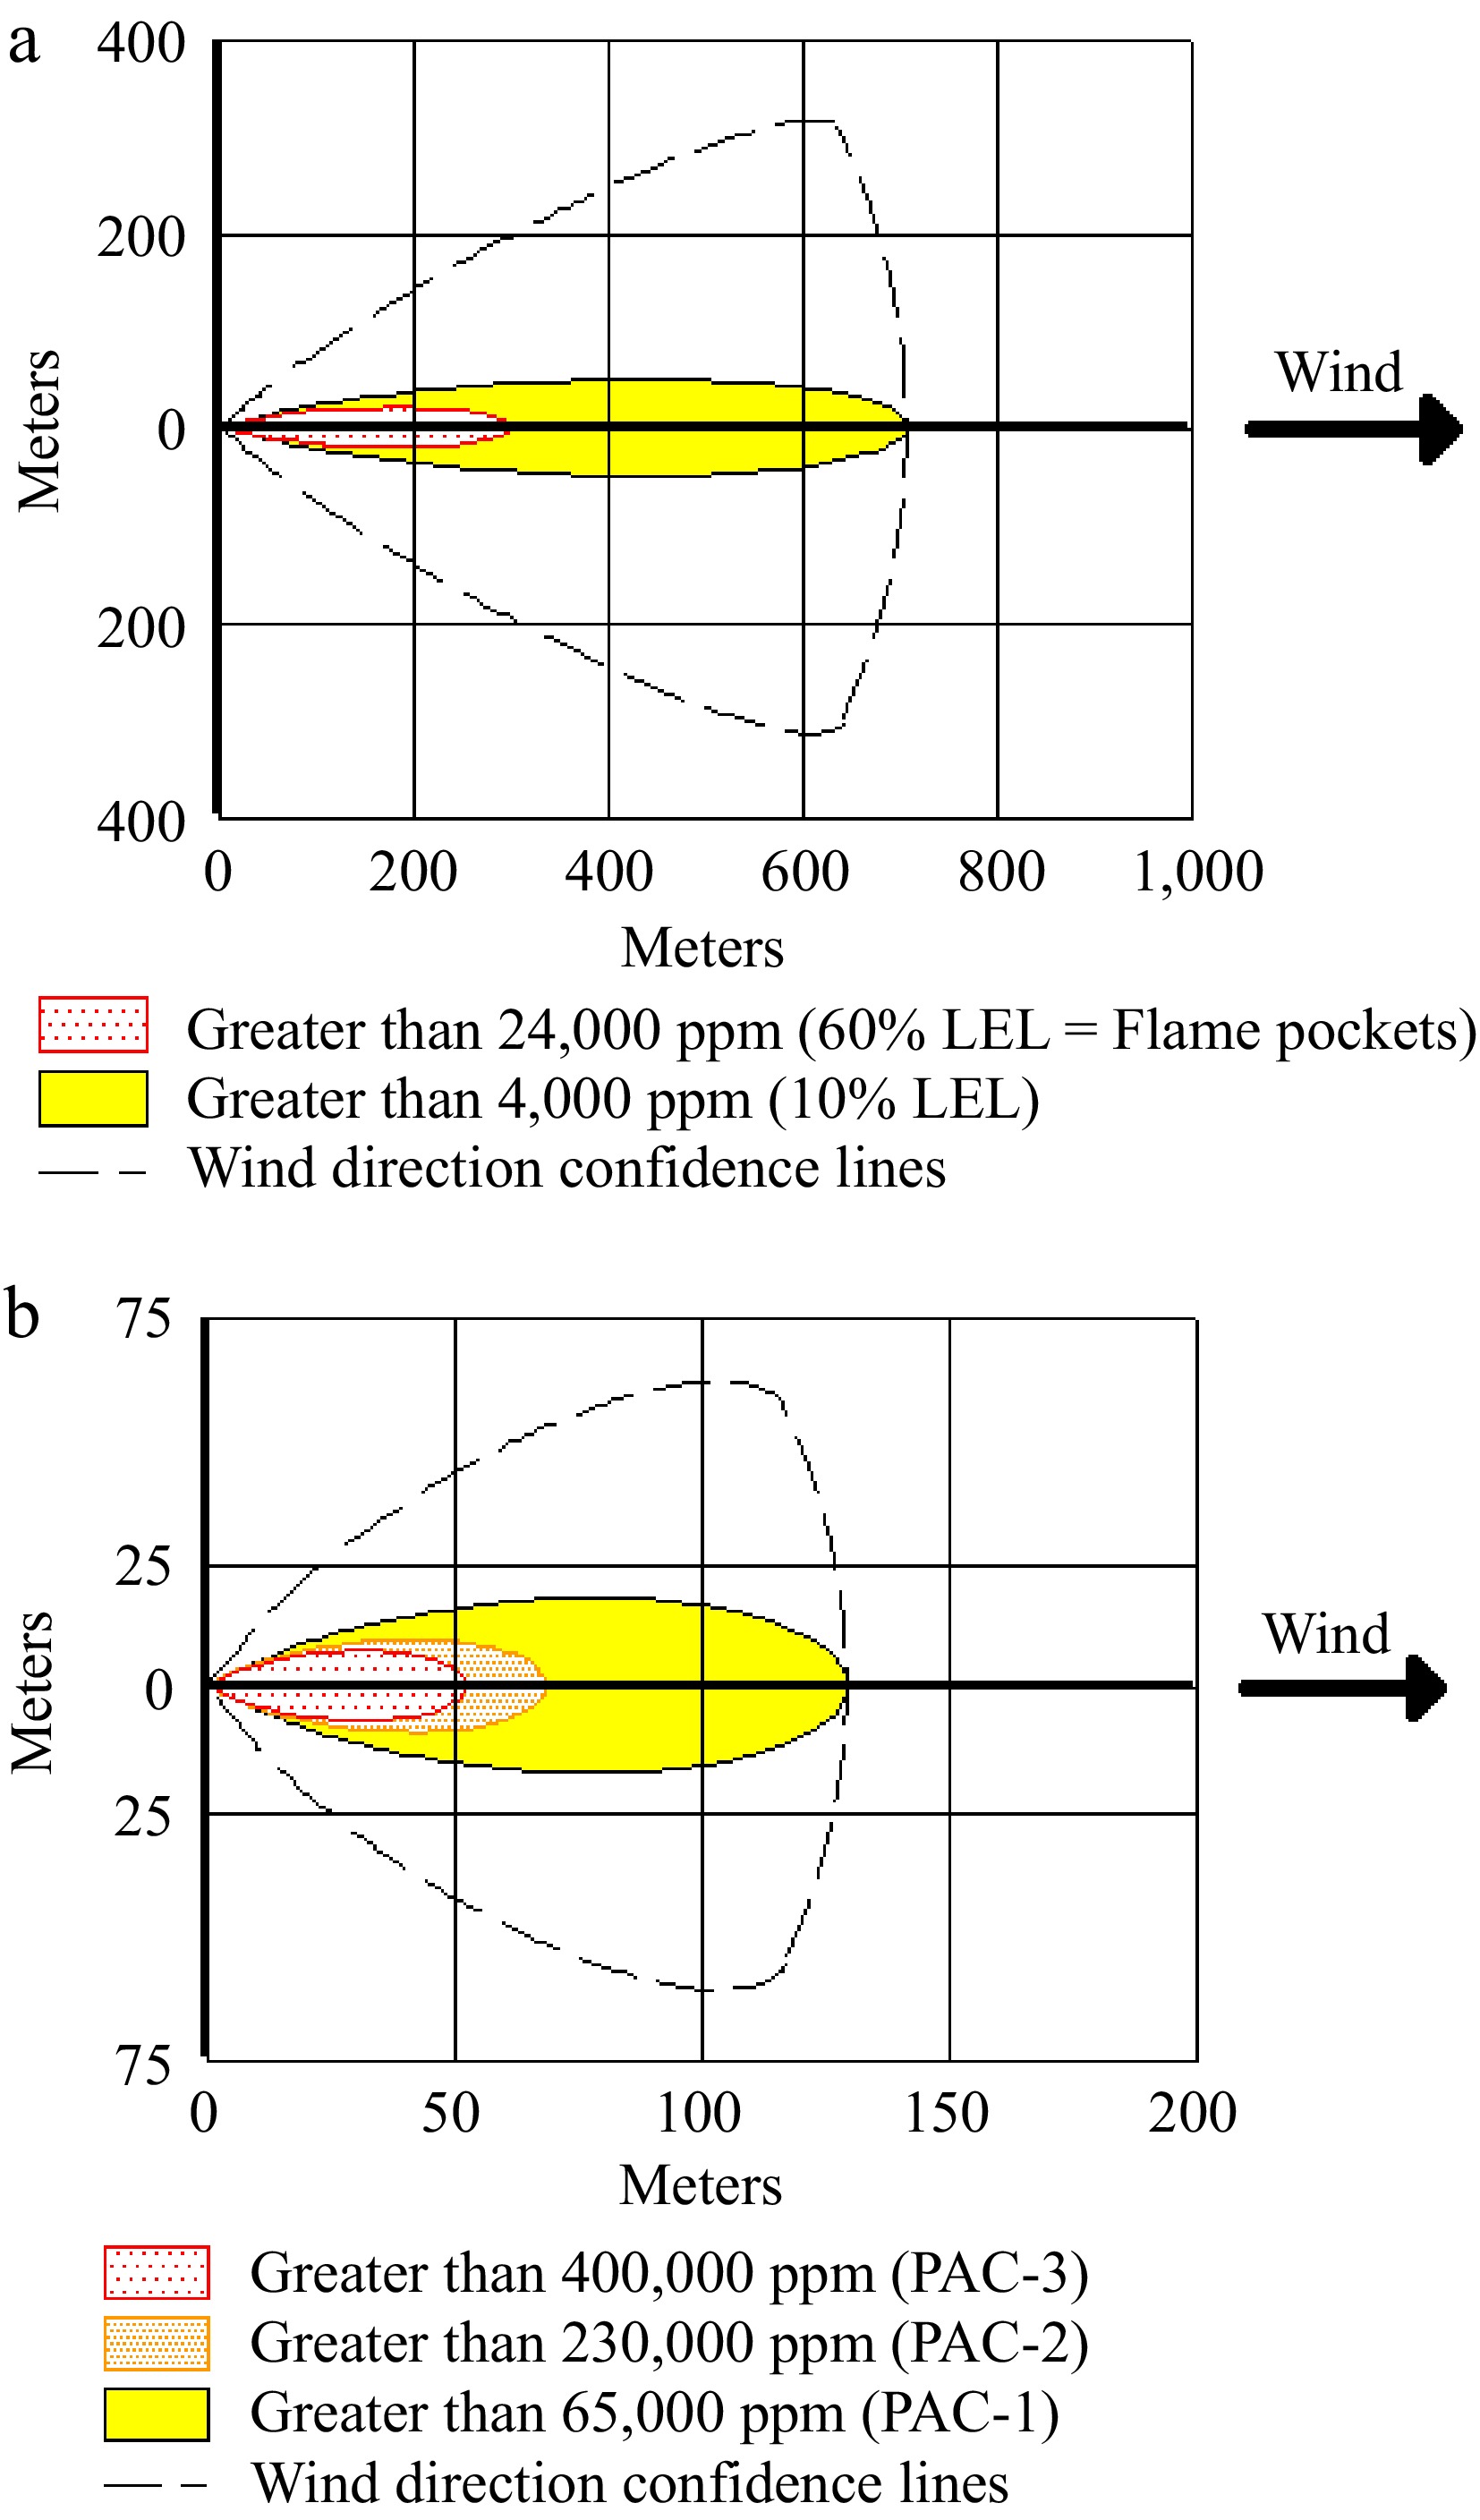
Figure 5.
(a) Flammable threat zone of vapor clouds. (b) Toxic threat zone of the vapor cloud for hydrogen storage tanks (Scenario-1).
-
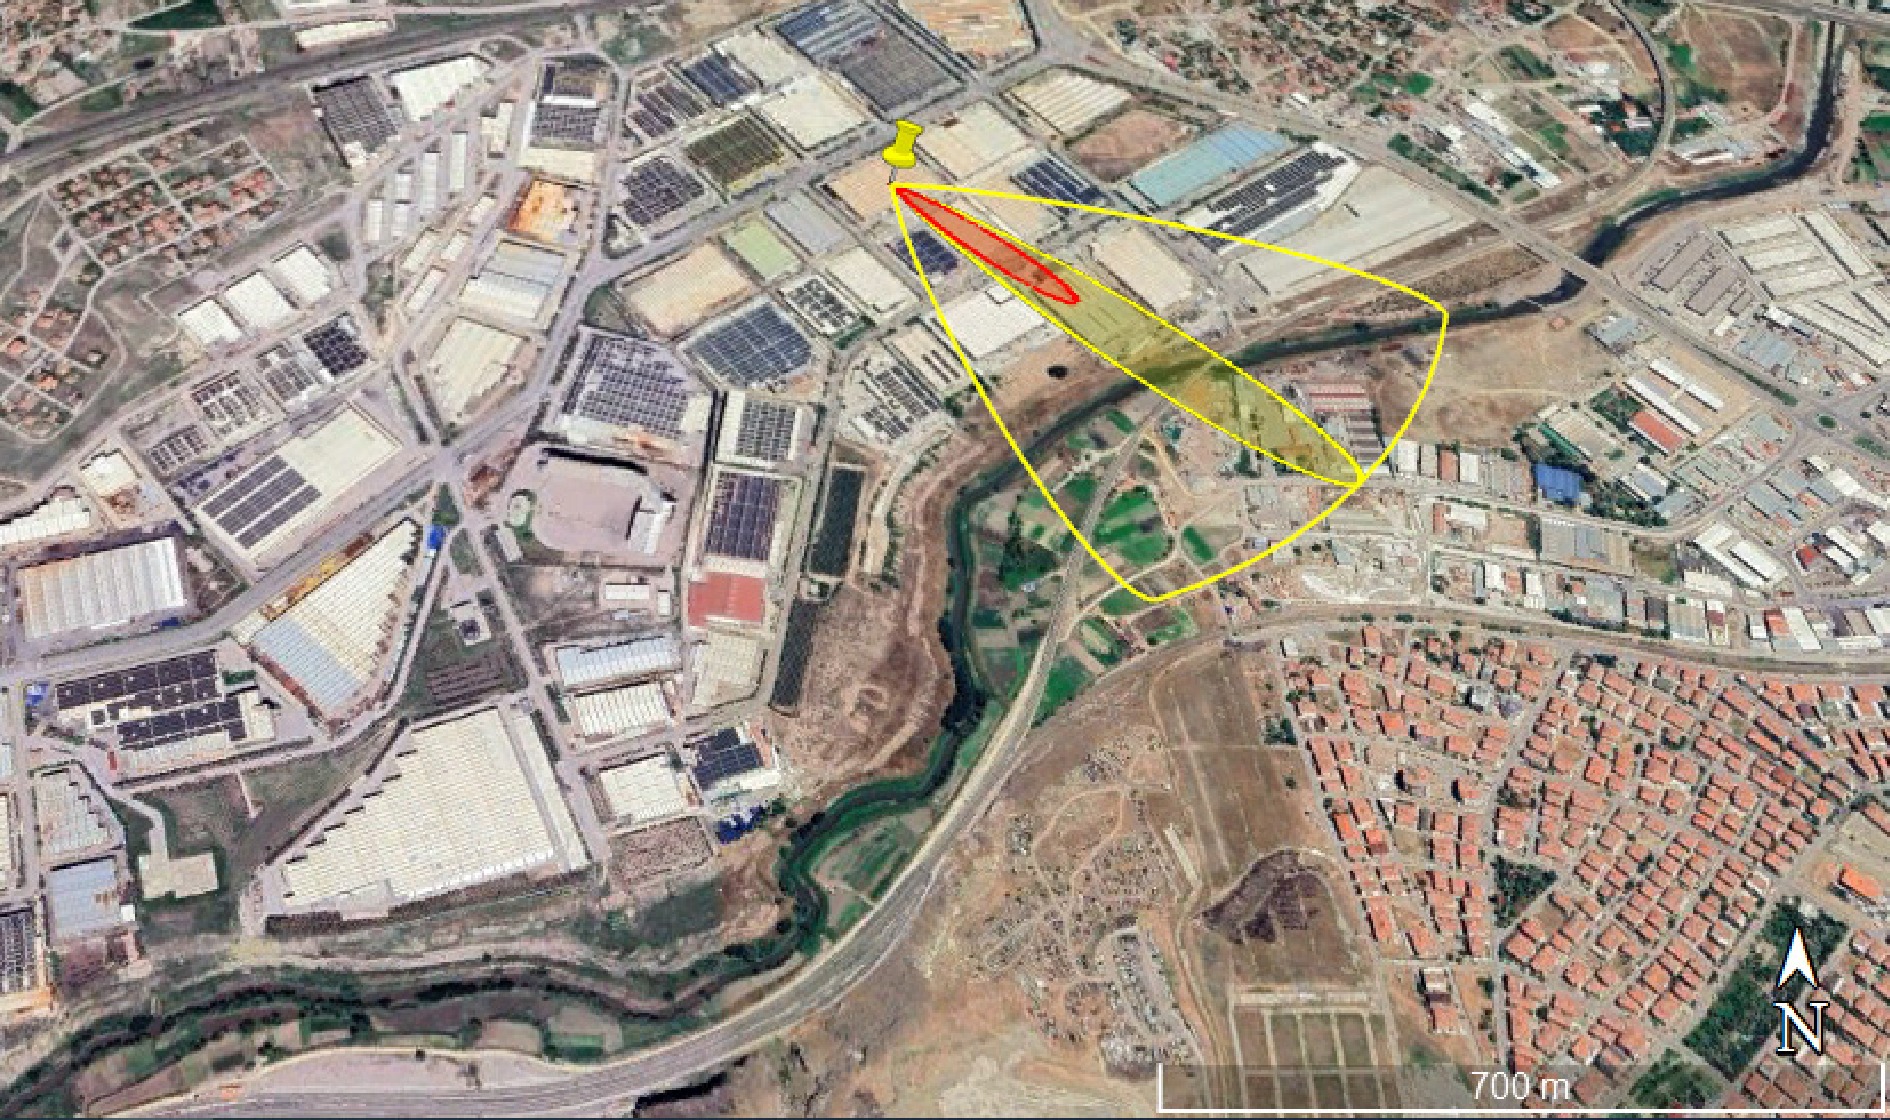
Figure 6.
Google Earth Image of the flammable threat zone of vapor clouds for hydrogen storage tanks (Scenario-1).
-
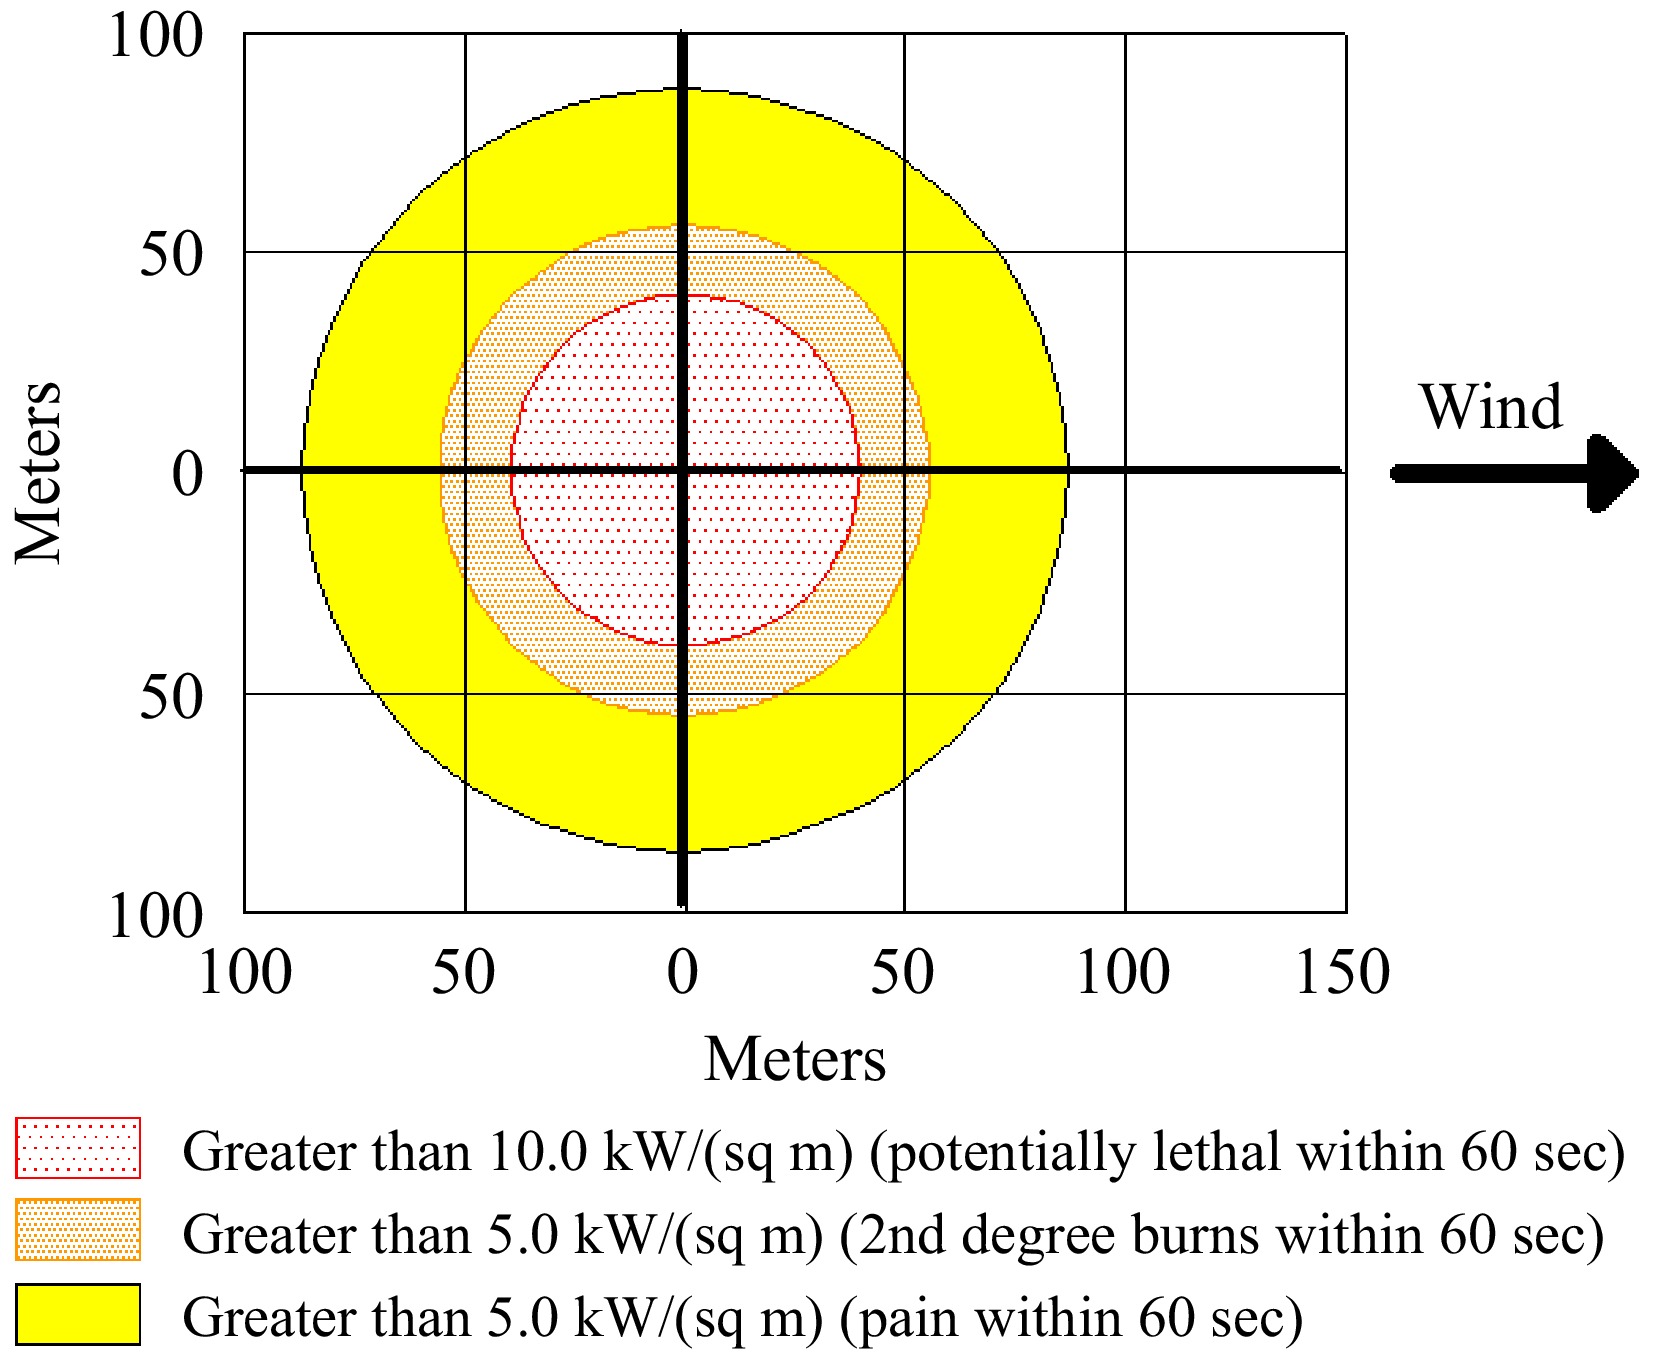
Figure 7.
Thermal radiation threat zone for hydrogen storage tanks (Scenario-2).
-
Physical state Gas Form Compressed gas Color Colorless Smell Odorless Melting point −259.2 °C Boiling point −253 °C Critical temperature −240.0 °C Flammability Flammable gas Flammability upper value 74.2% (V) Flammability lower value 4% (V) Vapor pressure 165,316.8 kPa (25 °C) Humidity 0.069 Relative humidity 0.07 Solubility in water 1.62 mg/L Auto-ignition temperature 560 °C Table 1.
Physical and chemical properties of hydrogen[29].
-
Parameter Value Nominal volume (L) 140 Pressure (atm) 345 Temperature (°C) 24 Orientation Vertical Diameter (m) 4.03 Length (m) 10.98 Tank type Cylinder Table 2.
Hydrogen storage tank specifications[30]
-
Parameter Value Air temperature 24 °C Wind speed 3 m/s Wind direction Northwest Cloudiness Open Relative humidity 40% Surface roughness Low Atmospheric stability D Table 3.
Atmospheric conditions of Ankara province in June[32].
-
Flame expansion Reactivity Congestion Low Medium High 2D High 0.599 DDT DDT Medium 0.47 0.66 1.6 Low 0.079 0.47 0.66 2.5D High 0.47 DDT DDT Medium 0.29 0.55 1.0 Low 0.053 0.35 0.50 3D High 0.36 DDT DDT Medium 0.11 0.44 0.50 Low 0.026 0.23 0.34 Table 4.
Mach numbers used in the B-S-T method[31].
-
Scenario Zone Red threat zone (m) Orange threat zone (m) Yellow threat zone (m) Scenario-1: No fire due to release Toxic threat zone 52 69 130 Flammable threat zone 301 − 711 Explosion threat zone − − 207 Scenario-2: Jet fire due to release Thermal radiation threat zone 40 56 87 Table 5.
All impact distances for scenarios used in the present study.
Figures
(7)
Tables
(5)