-

Figure 1.
Schematic map of the TIPS-EPSPS vector in pBI101 vector backbone for Agrobacterium-mediated genetic transformation. The nptII, eGFP, and TIPS-EPSPS are driven by the NOS promoter, prolD promoter, and double 35S promoter, respectively. LB, left border; RB, right border; NOSp, nopaline synthase promoter; prolD, A. rhizogenes rolD promoter; 2×35Sp, Enhanced Cauliflower Mosaic Virus promoter; nptII, neomycin phosphotransferase; p(A), CaMV polyadenylation signal; Tnos, nopaline synthase terminator; T35, Cauliflower Mosaic Virus terminator; eGFP, enhanced green fluorescence protein; TIPS, citrus shikimate pathway enzyme 5-enolpyruvylshikimate-3-phosphate synthase (EPSPS) modified to obtain glyphosate resistance[24].
-
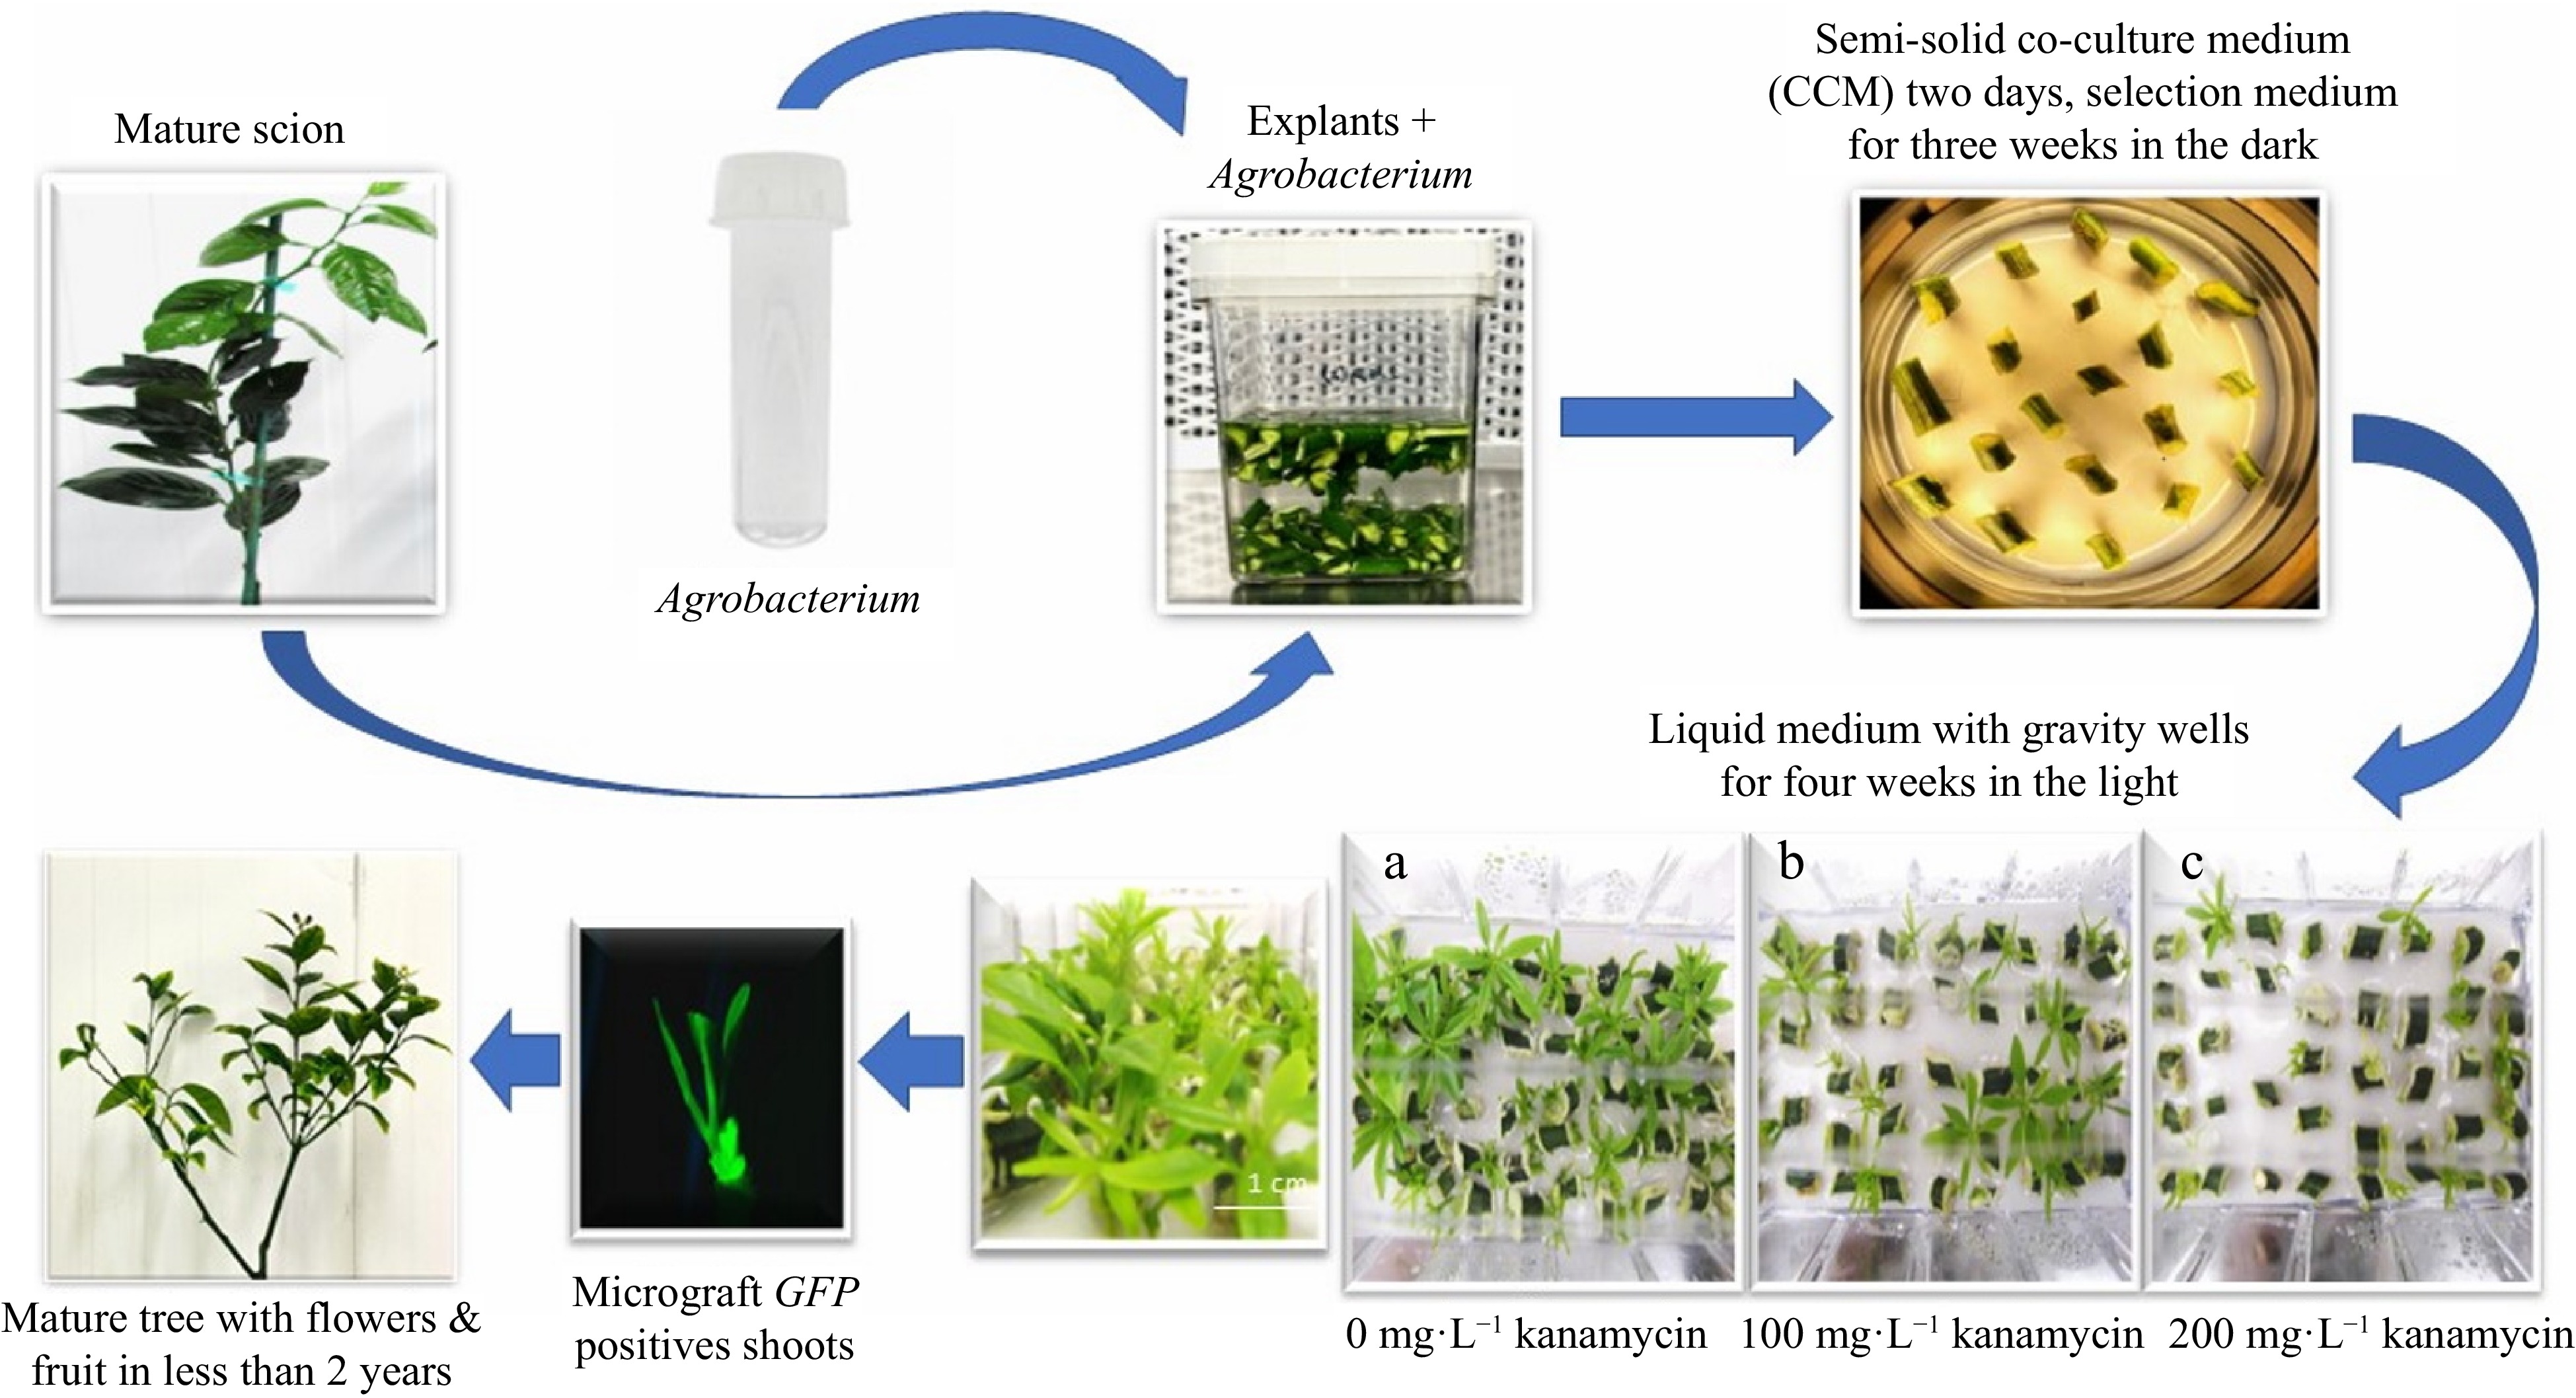
Figure 2.
Schematic representation of the transformation process using We-V™ liquid culture vessels with gravity wells with different kanamycin concentrations of (a) 0, (b) 100, and (c) 200 mg·L−1.
-
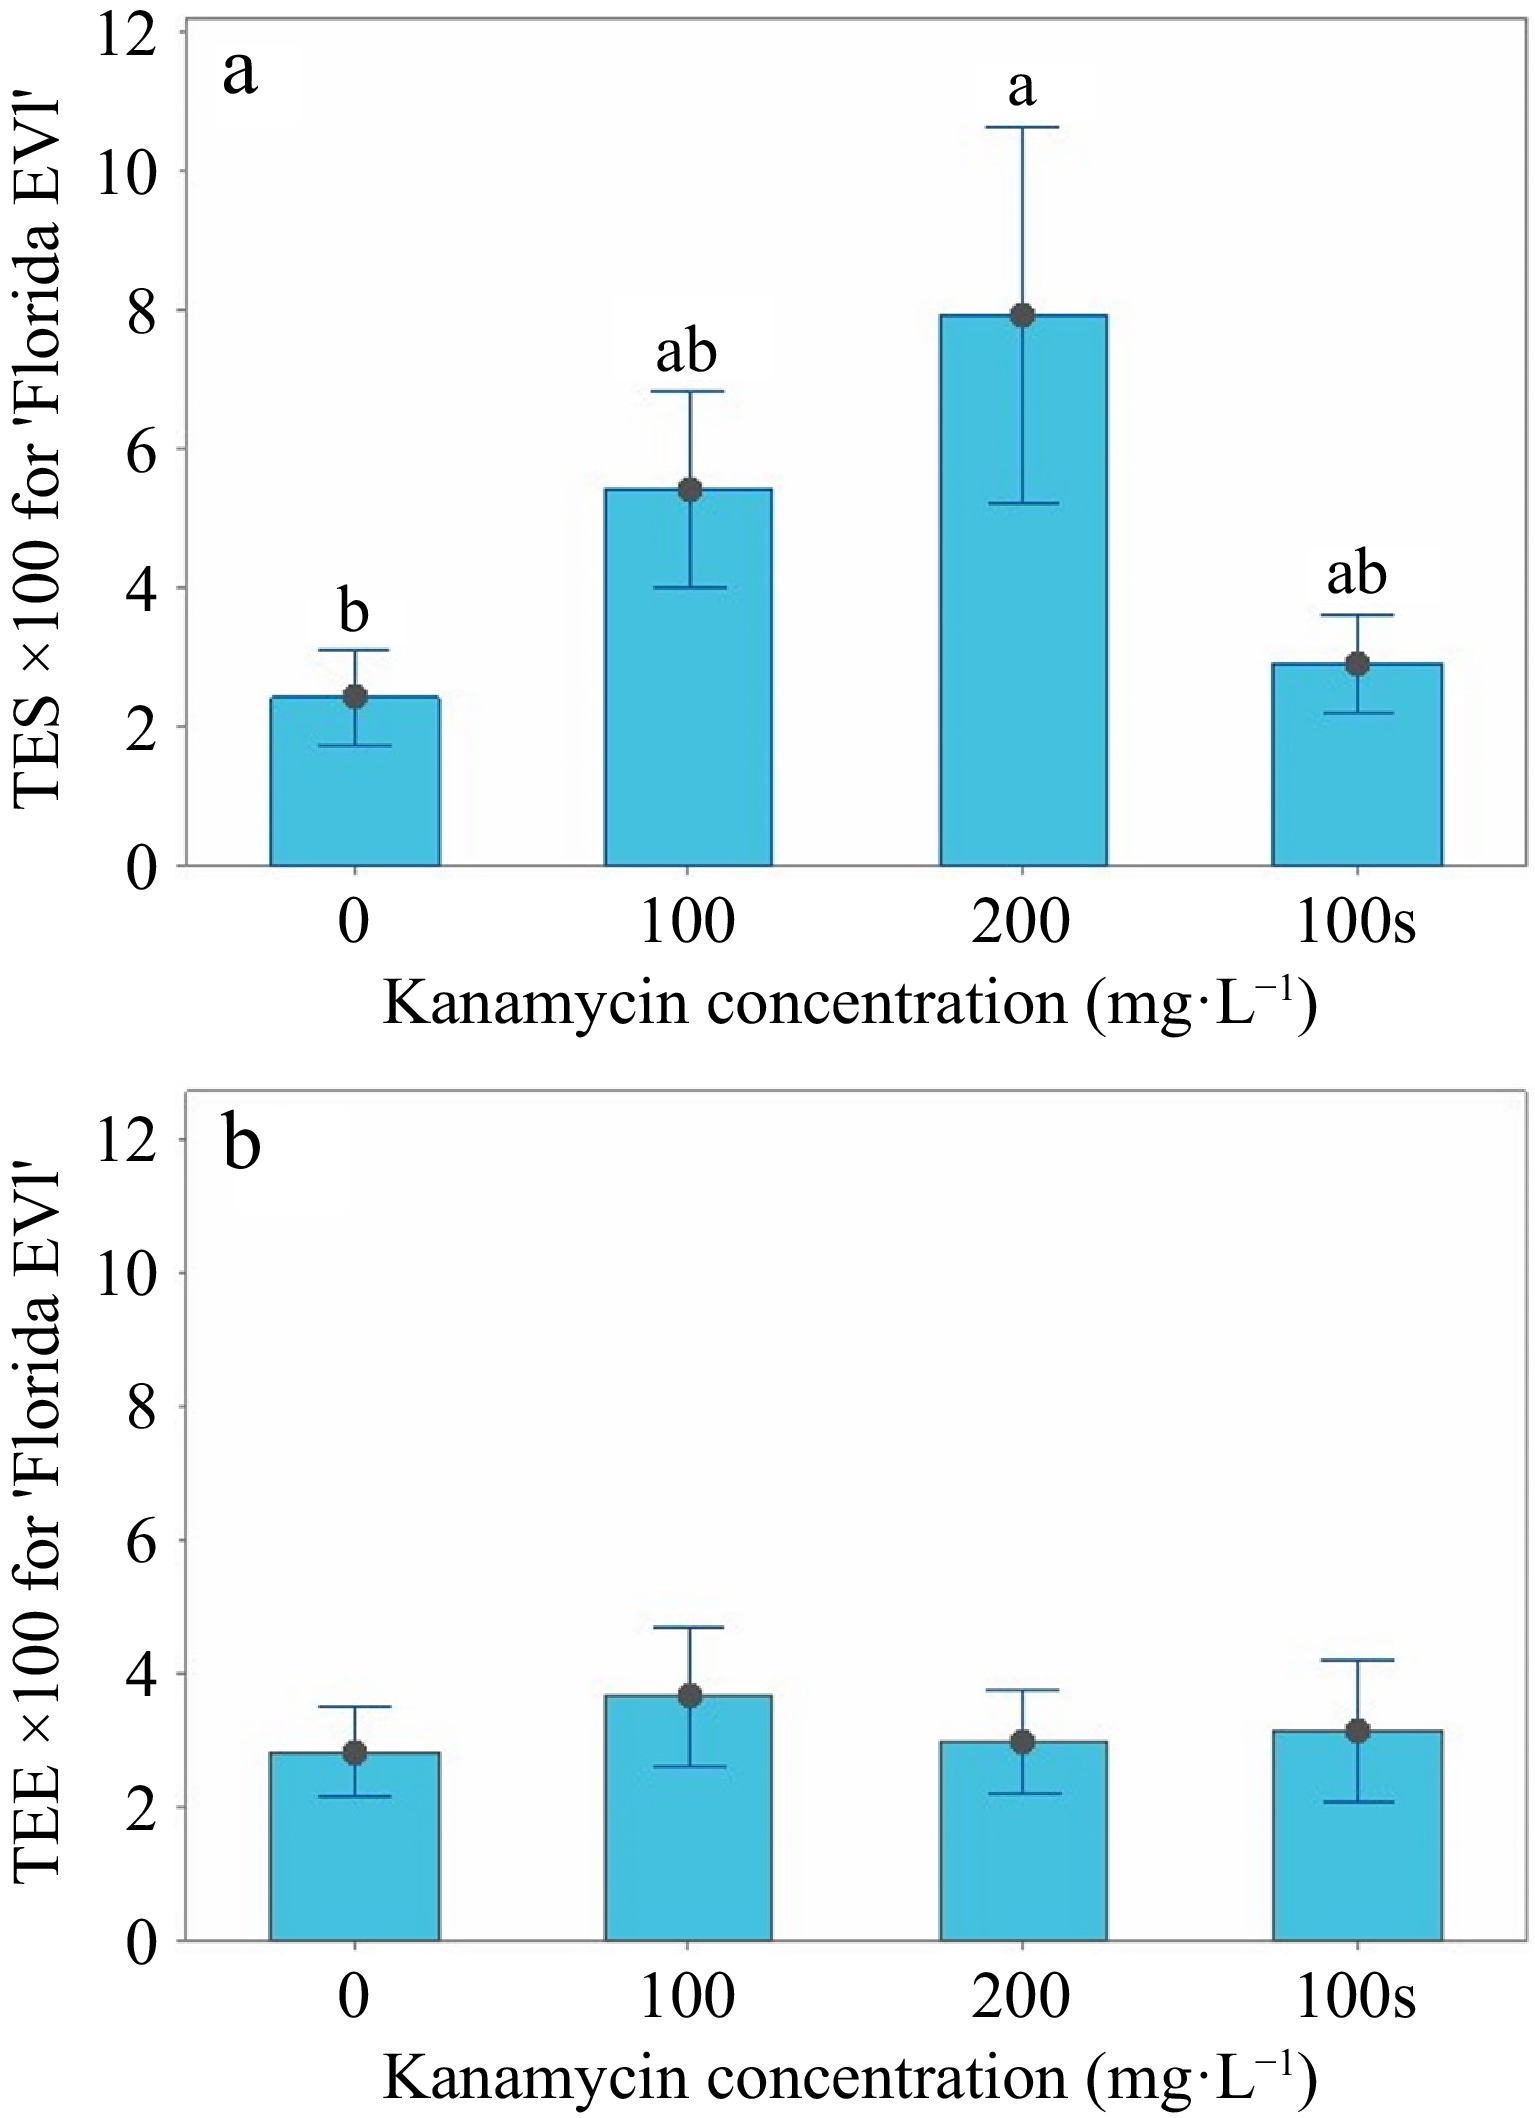
Figure 3.
TES and TEE interval graphs for 'Florida EV1'. (a) The means, standard errors (SE) for TES (transformation efficiency based on the number of positive shoots/total number of shoots × 100), and multiple comparisons are shown in liquid medium at 0, 100, and 200 mg·L−1 and in semi-solid medium at 100 mg·L−1. (b) The means and standard errors (SE) for TEE (transformation efficiency based on the number of positive shoots/explants × 100) are shown in liquid medium at 0, 100, and 200 mg·L−1 and in semi-solid medium at 100 mg·L−1.
-
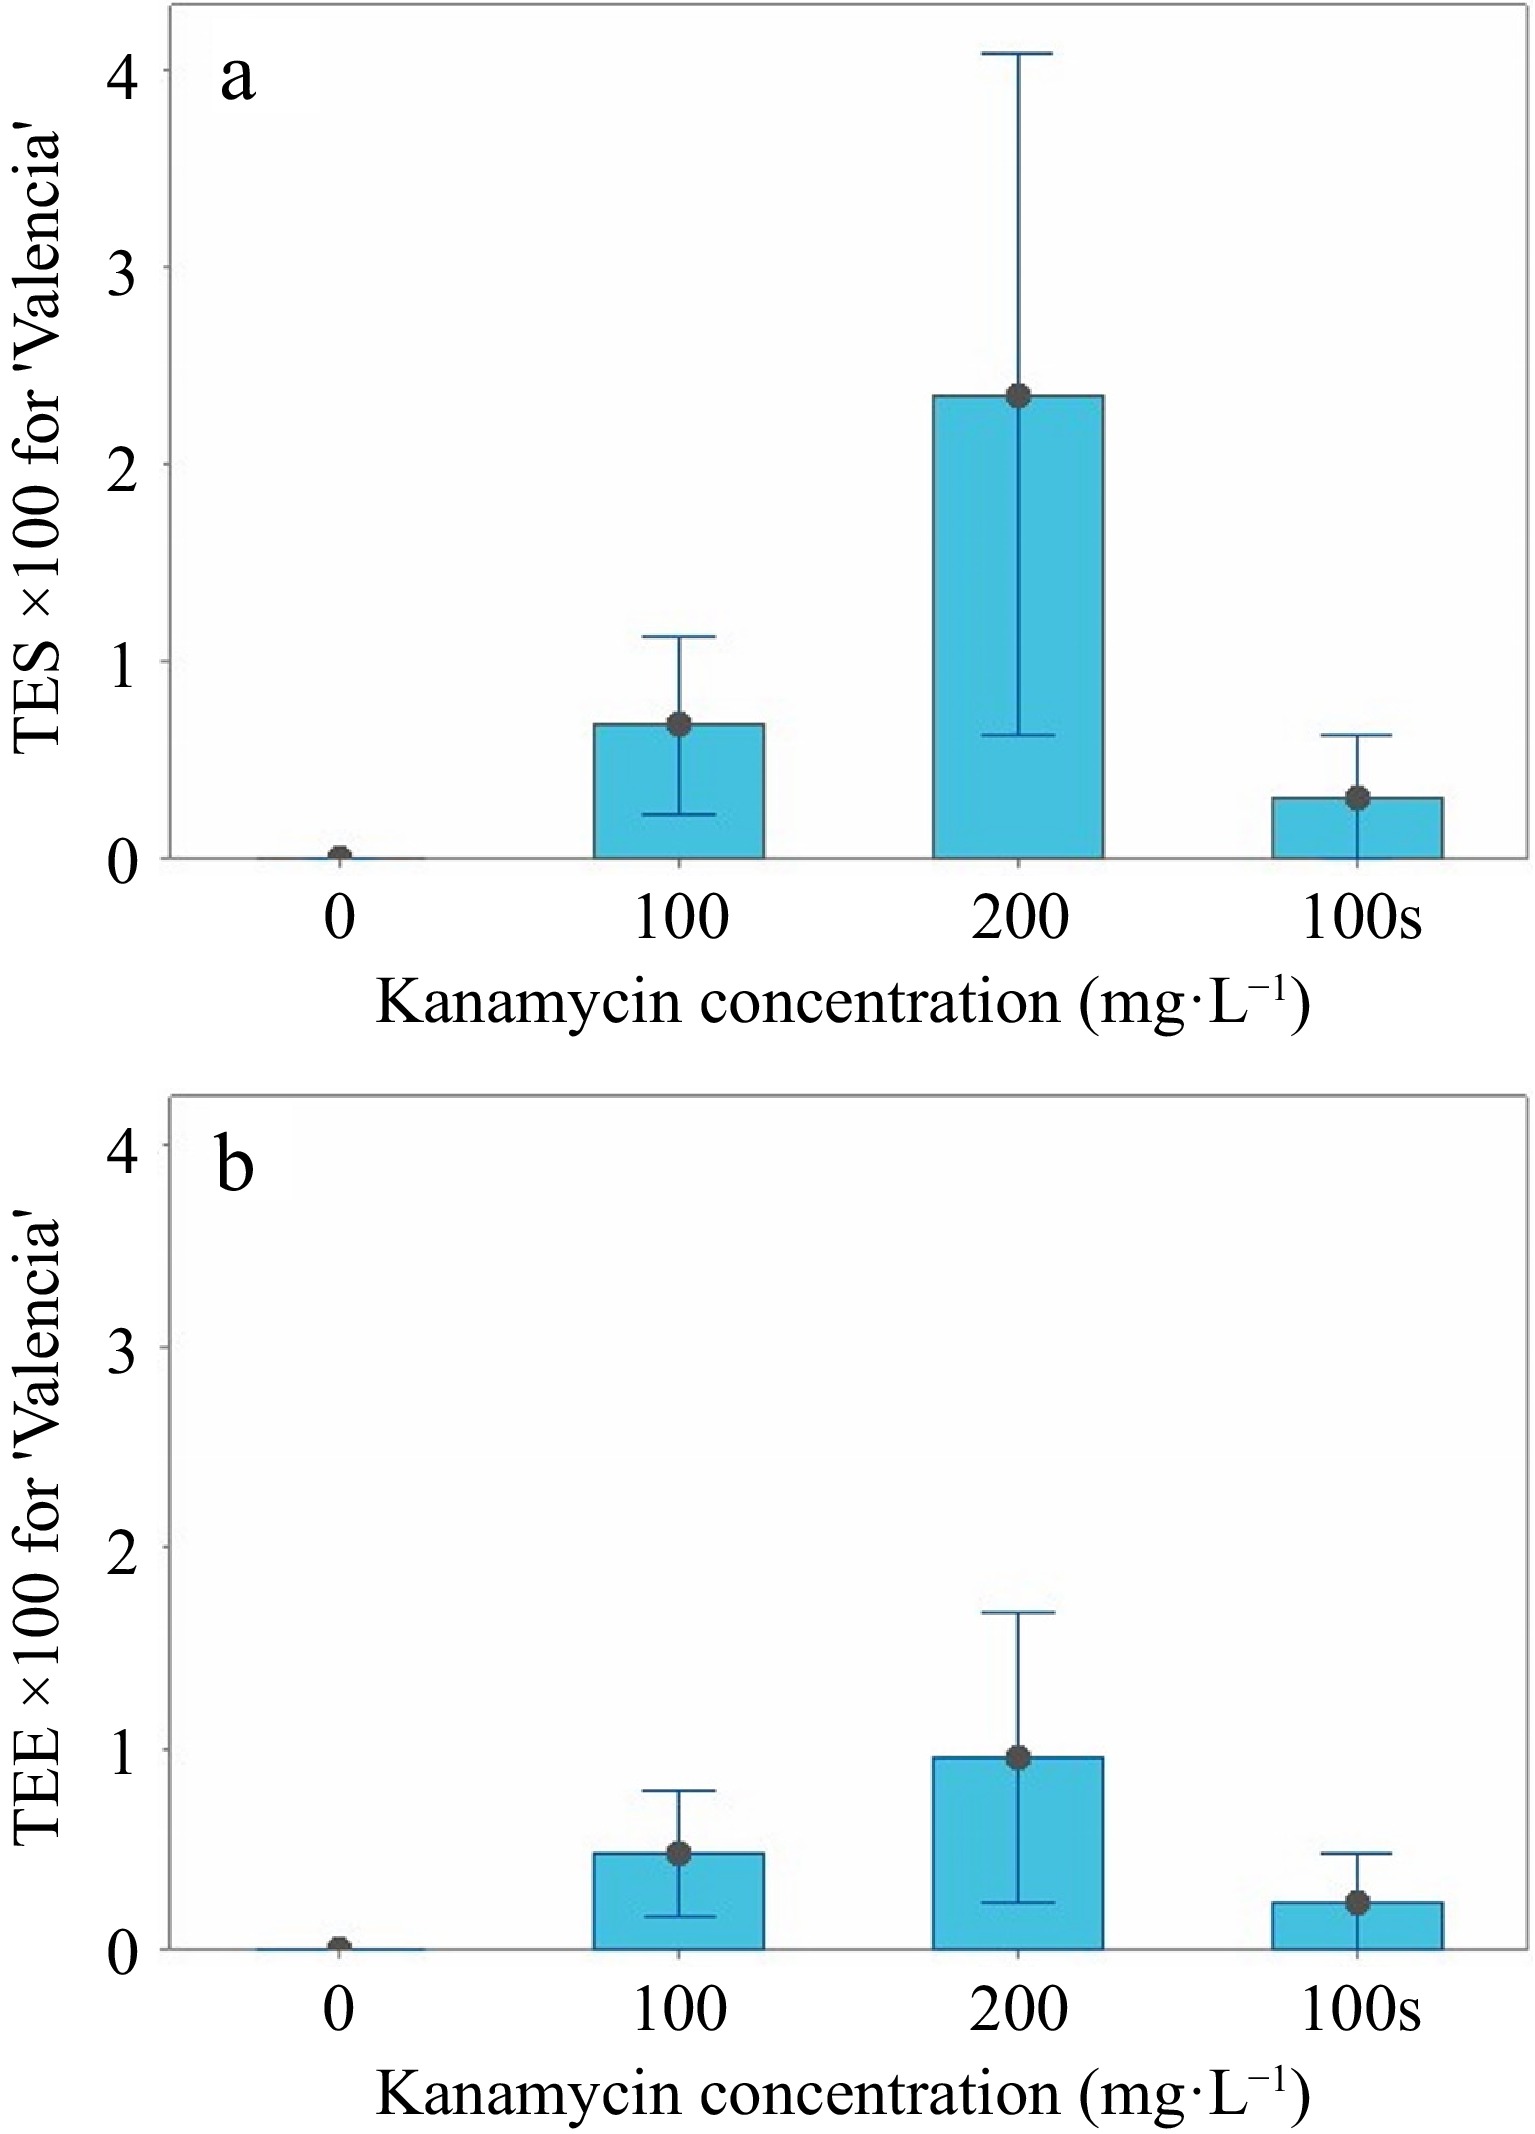
Figure 4.
TES and TEE interval graphs for 'Valencia'. (a) The means and standard errors for TES (transformation efficiency based on the number of positive shoots/number of shoots × 100) are shown in liquid medium at 0, 100, and 200 mg·L−1 and in semi-solid medium at 100 mg·L−1. (b) The means and standard errors (SE) for TEE (transformation efficiency based on the number of positive shoots/explants × 100) are shown in liquid medium at 0, 100, and 200 mg·L−1 and in semi-solid medium at 100 mg·L−1.
-
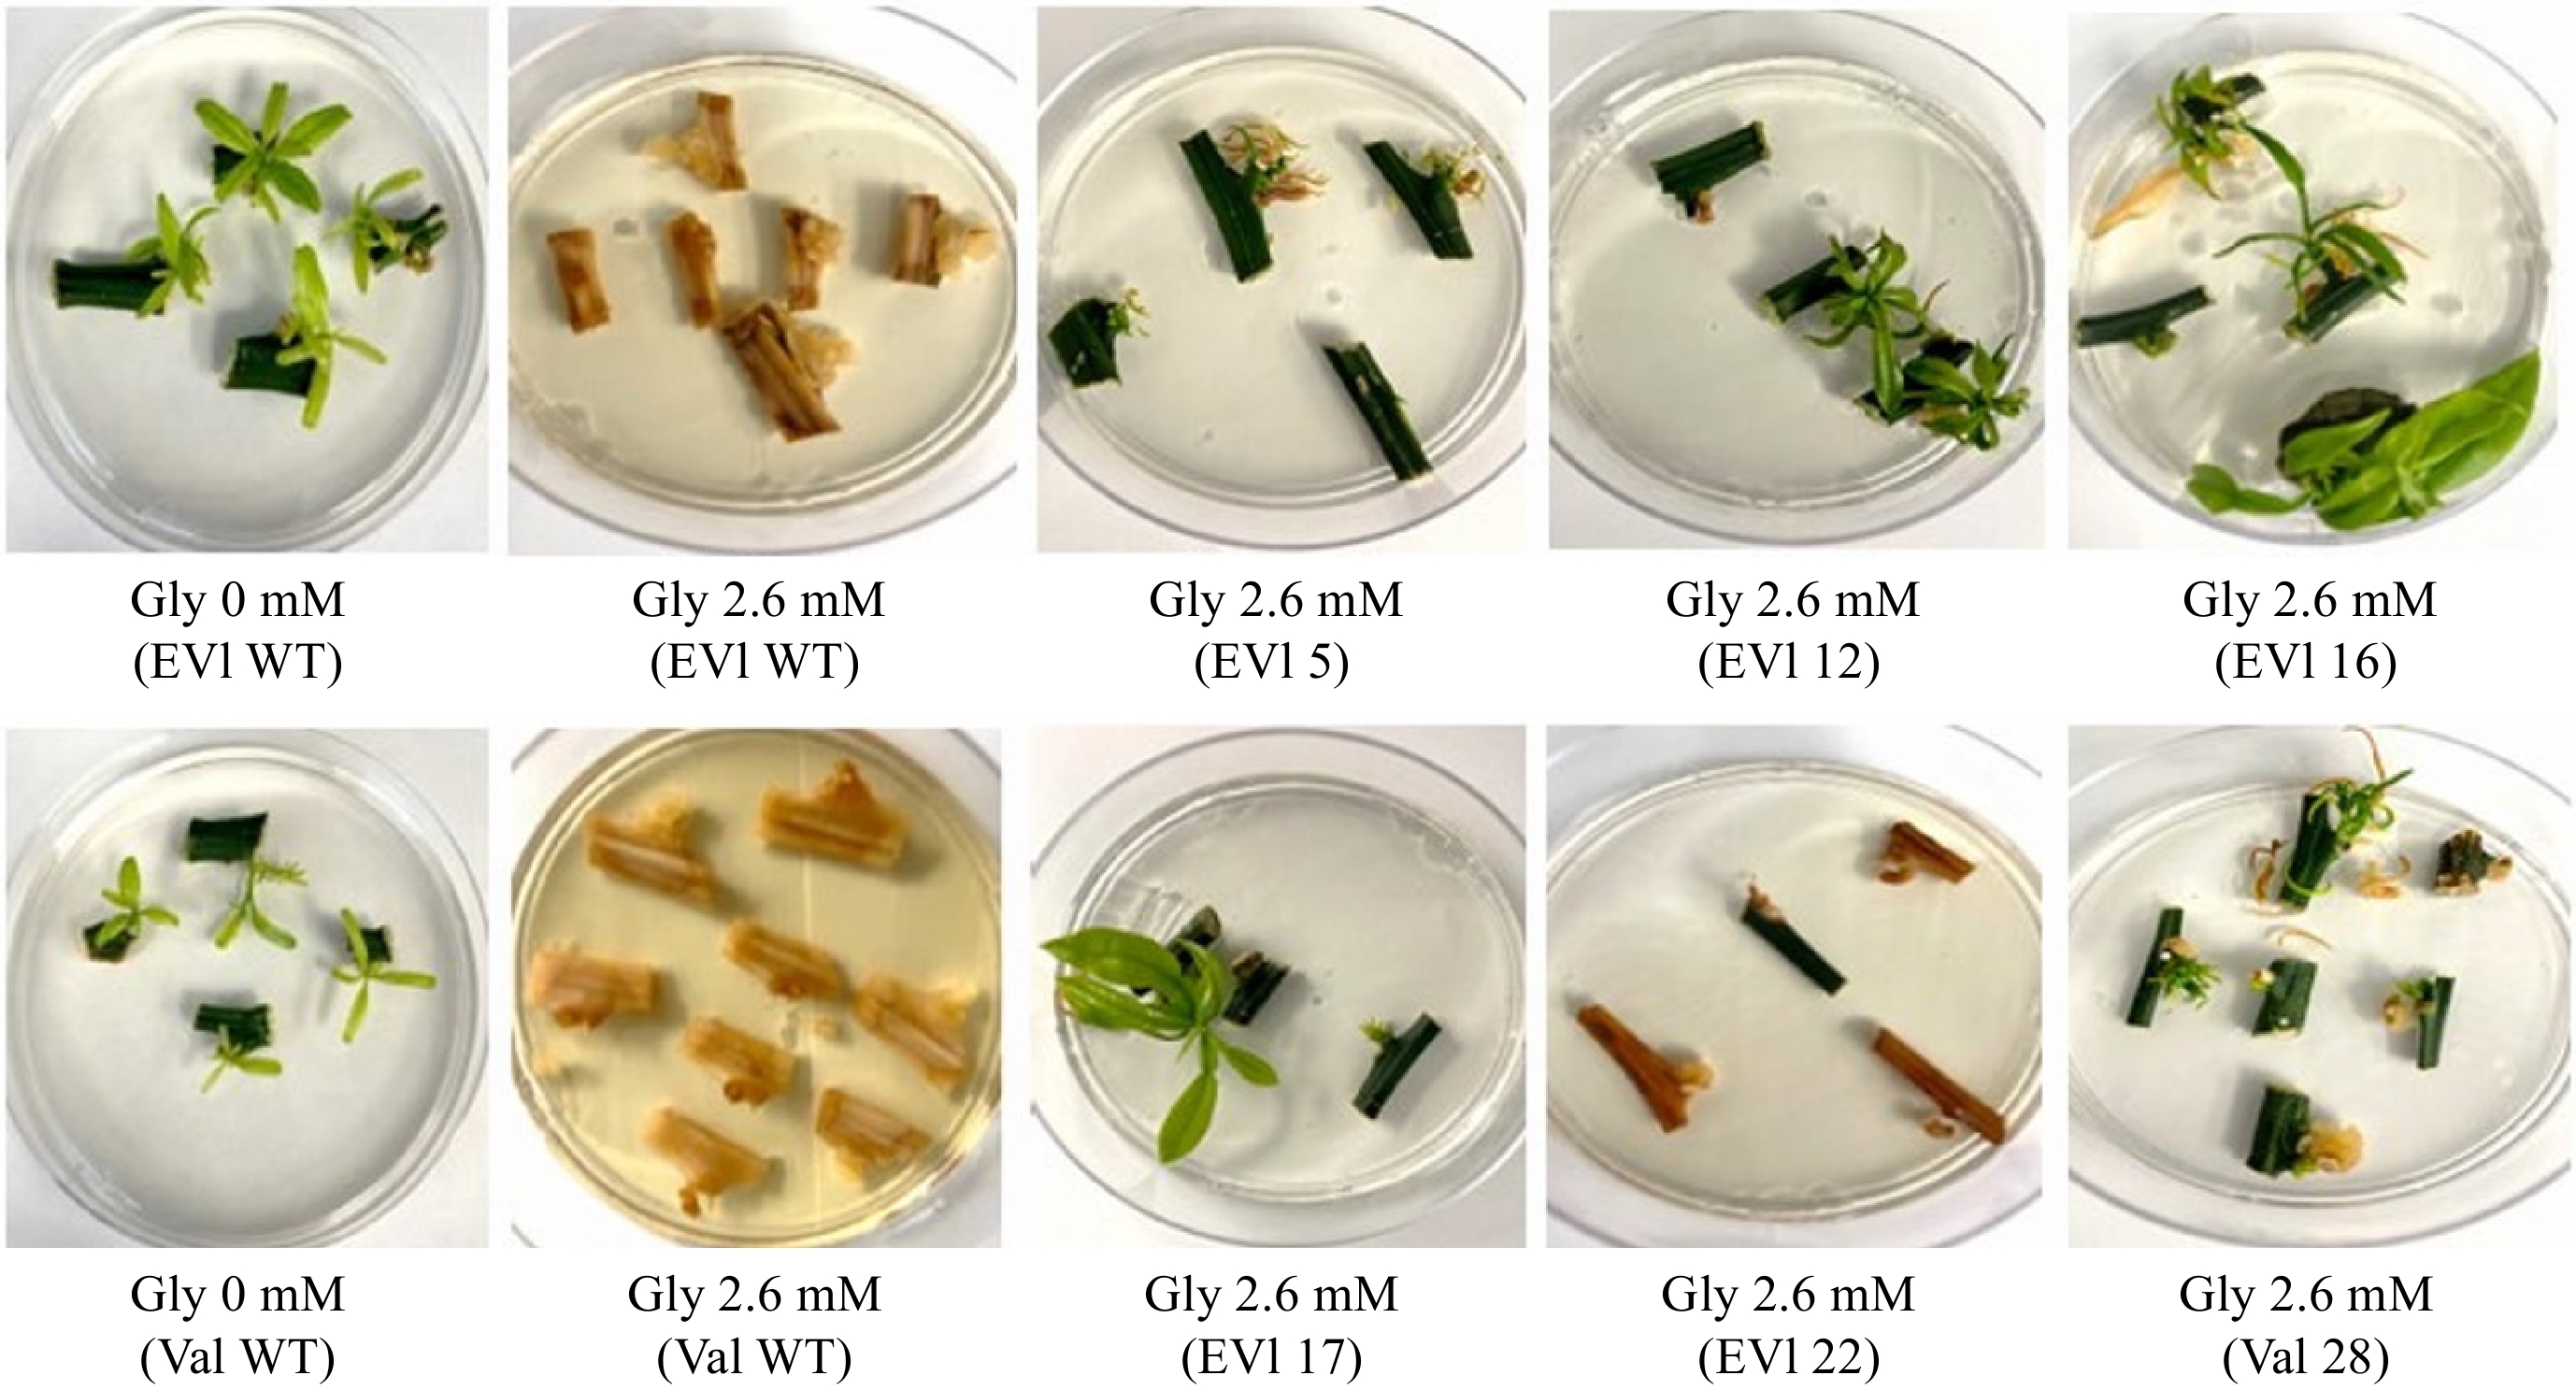
Figure 5.
Transgenic lines and wildtype (WT) nodal budsticks at two glyphosate concentrations (0 and 2.6 mM). Nodal budsticks of 'Florida EV1' (EV1) (samples 5, 12, 16, 17, 22, and WT) and 'Valencia' (Val) (samples 28 and WT) were plated on glyphosate (Gly) medium to show tolerance conferred by the TIPS-EPSPS transgene. Two additional concentrations of glyphosate were used but are not shown (Supplementary Table S1). 'Florida EV1' line 22 was later shown not to possess the EPSPS transgene.
-
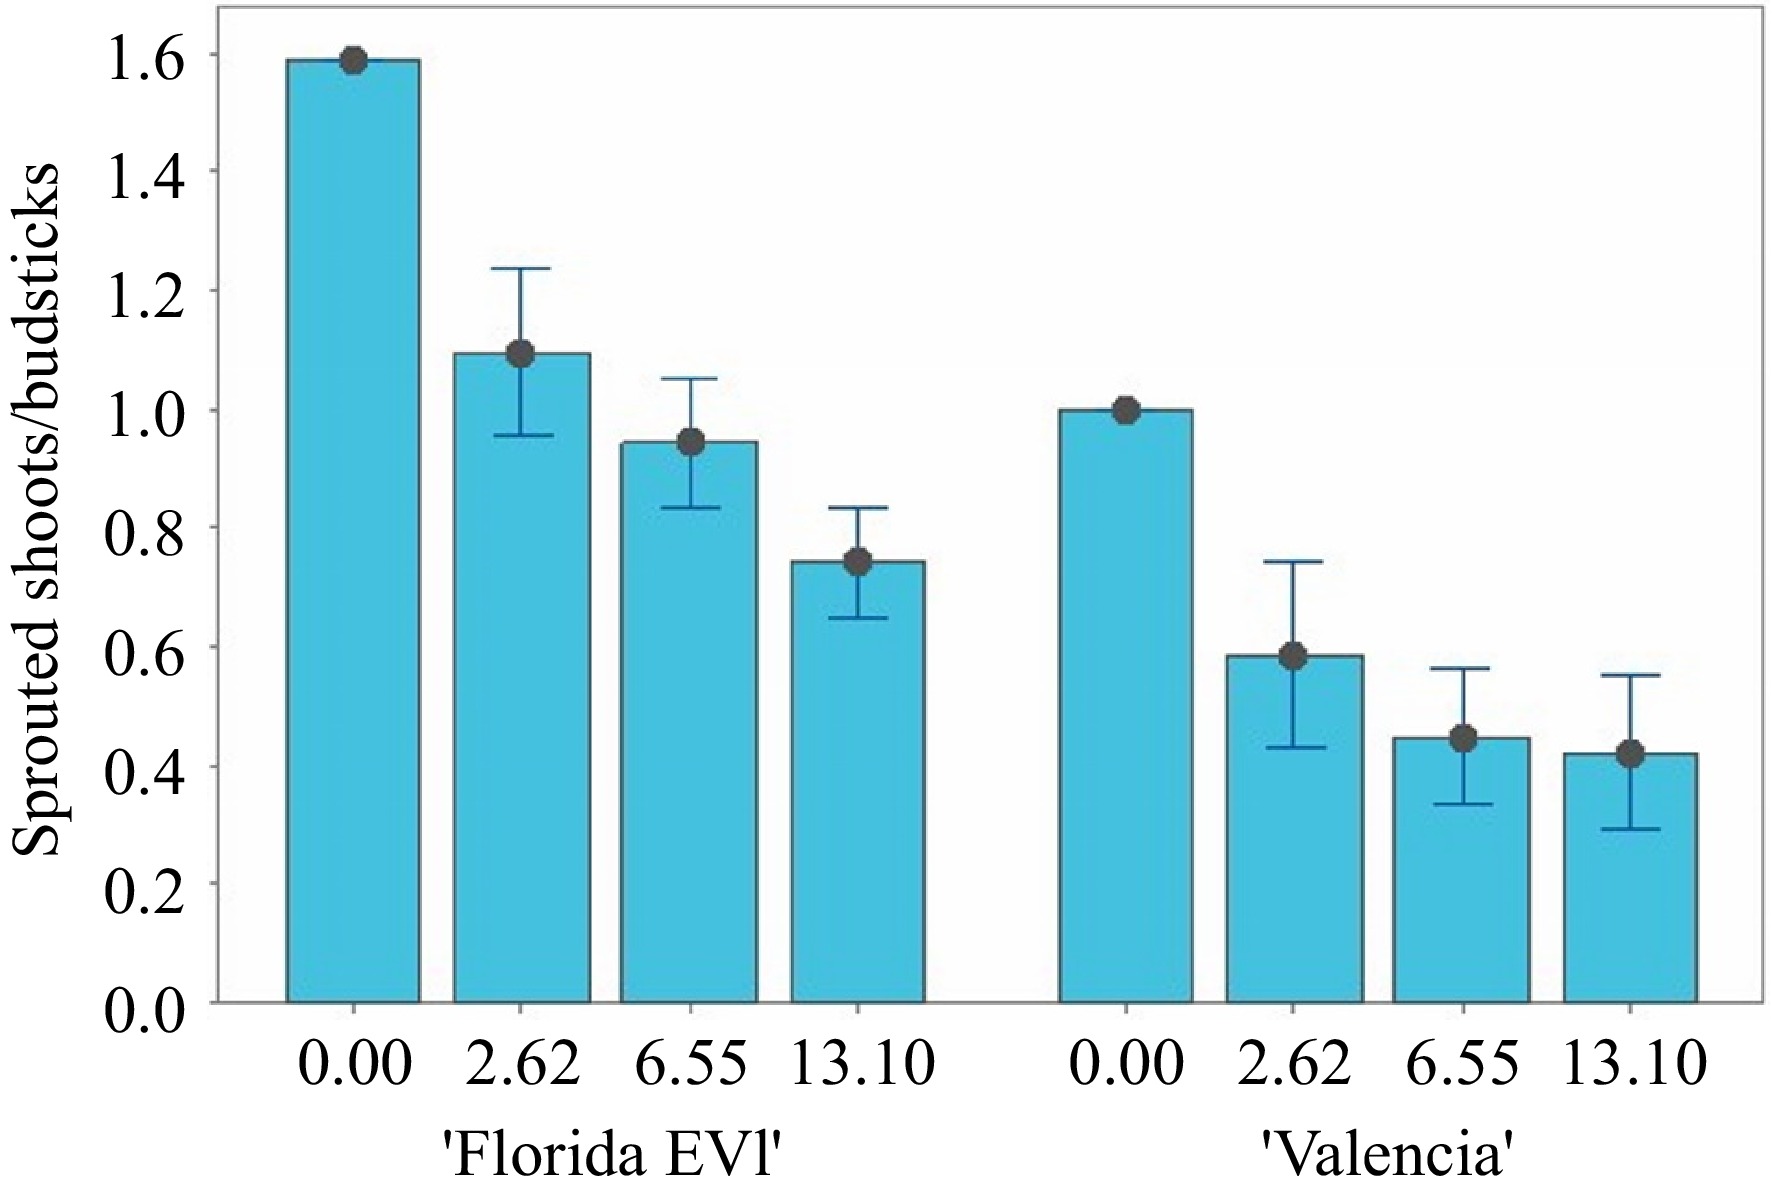
Figure 6.
Sprouted shoots per nodal budstick at four concentrations of glyphosate in semi-solid medium for 'Florida EV1' and 'Valencia'. In some treatments, 'Florida EV1' sprouted more than one shoot per nodal budstick.
-
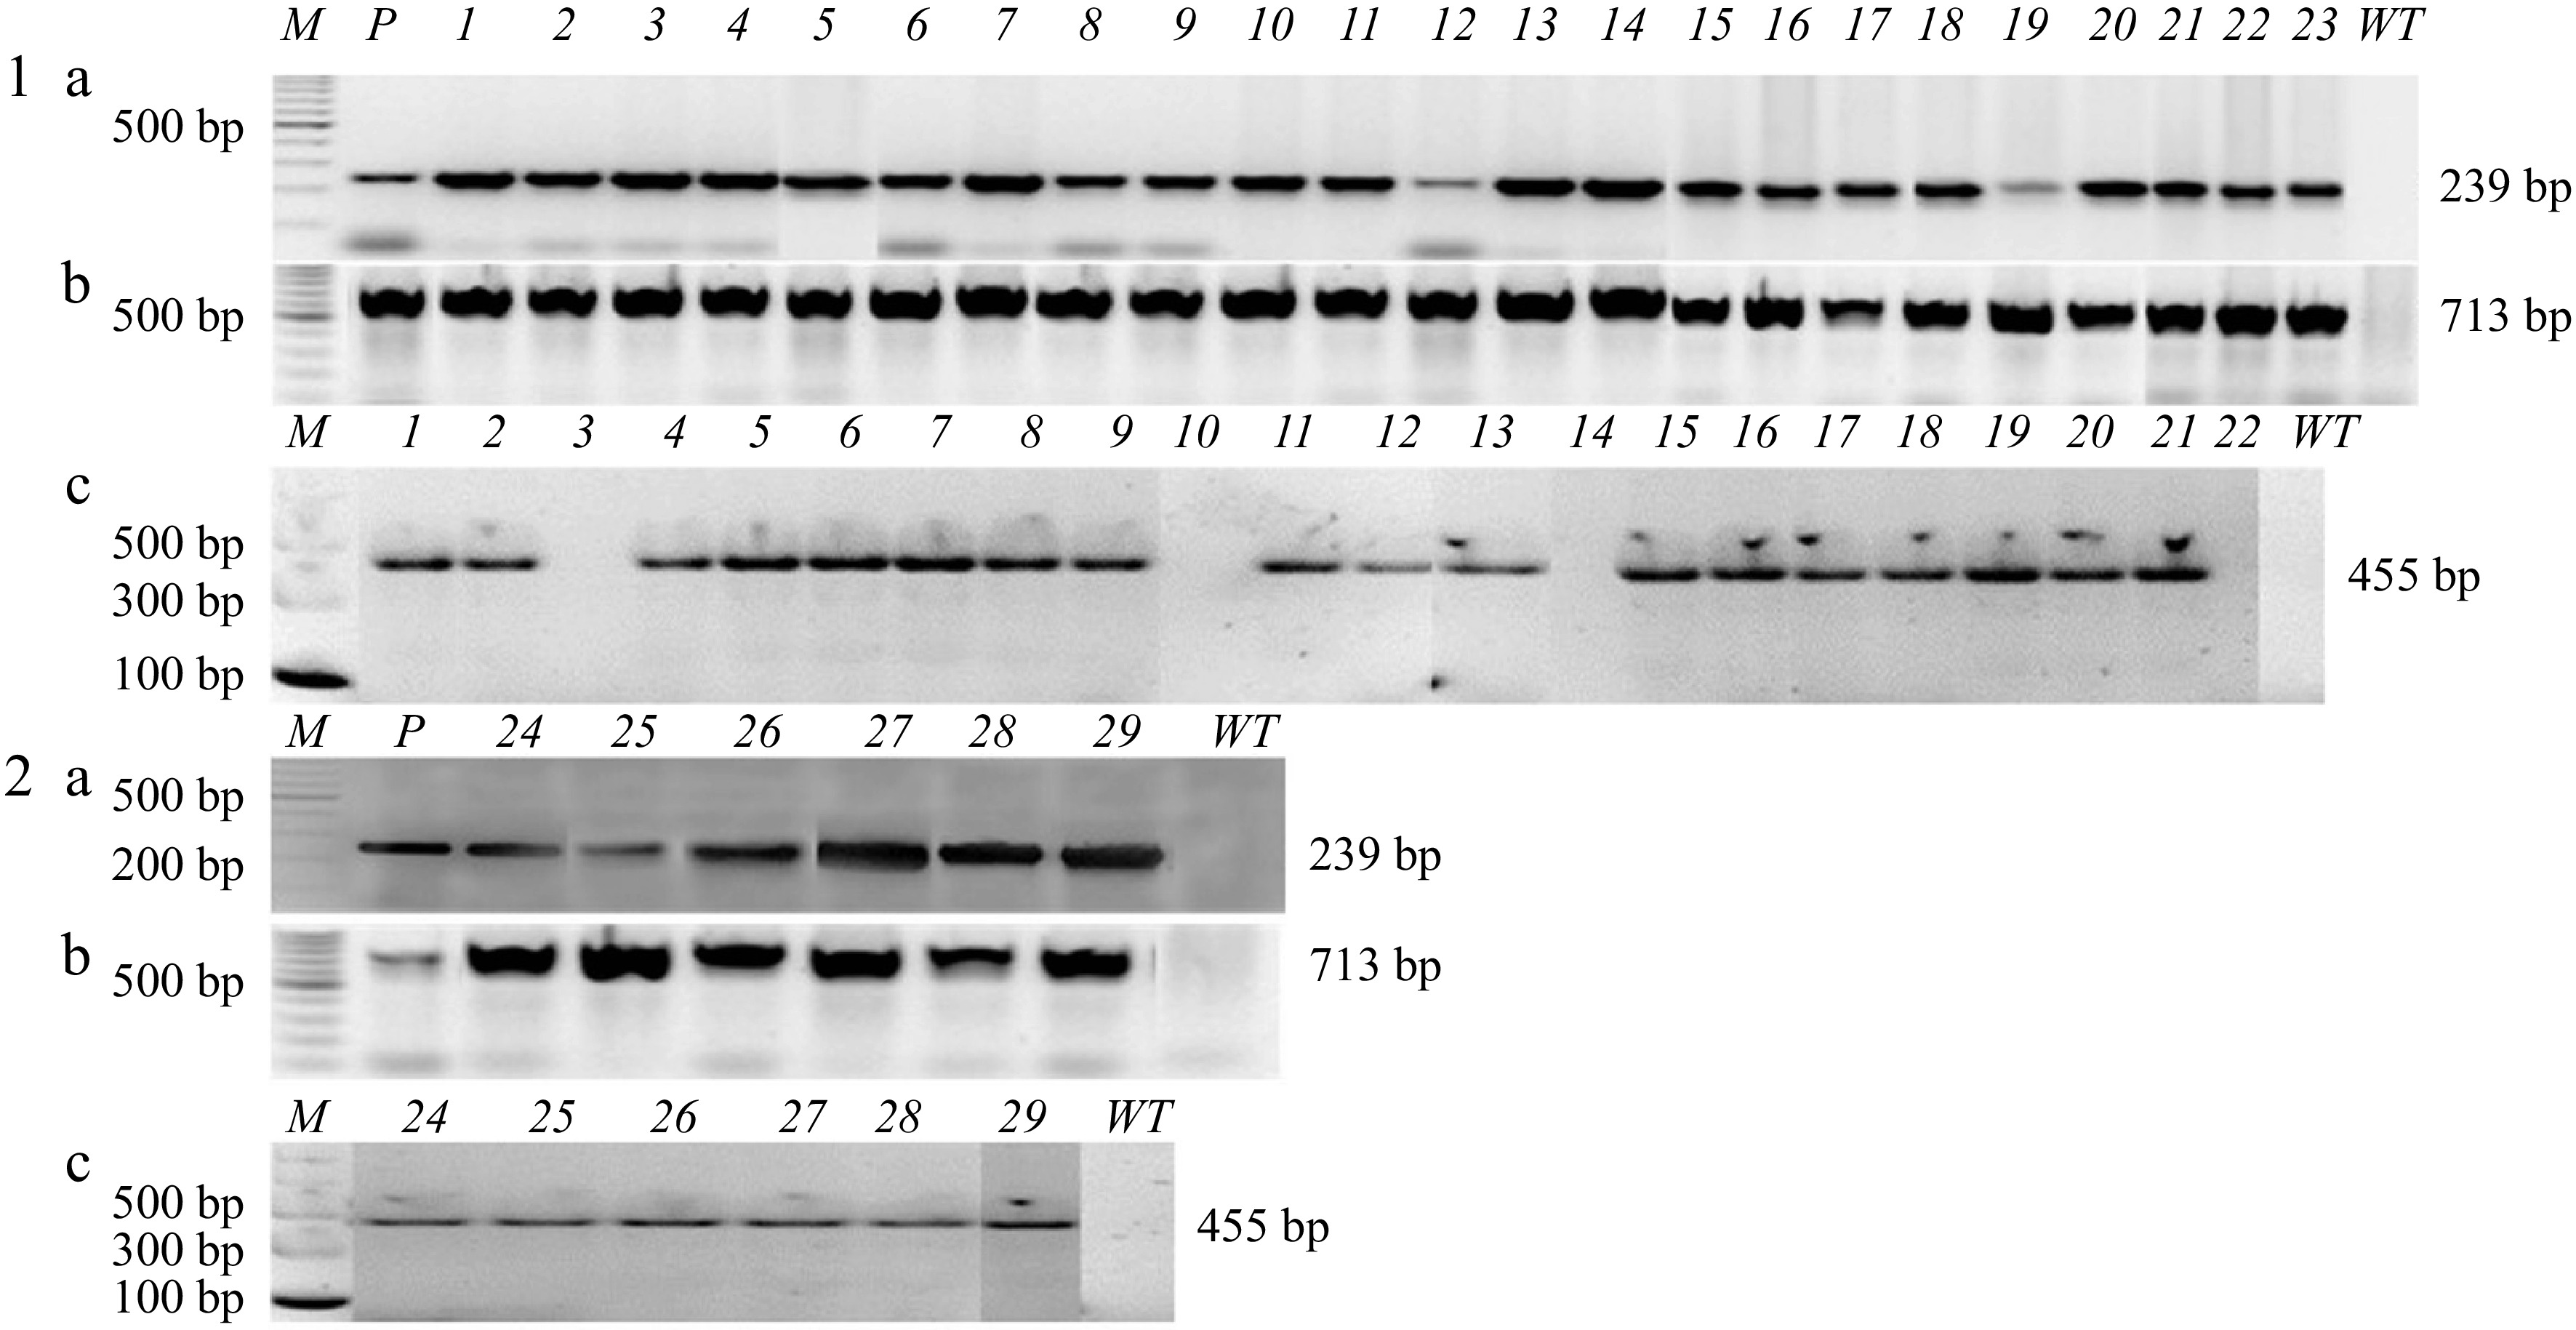
Figure 7.
PCR confirmation of transgenic lines transformed with the Mu-EPSPS vector and selected in liquid medium with gravity wells. (1a) 'Florida EV1' 1-23 samples, PCR for nptII 239 bp; (1b) egfp 713 bp; (1c) EPSPS 455 bp. Samples 3, 10, 14, and 22 contained the nptII gene but not the EPSPS gene. (2a) 'Valencia' 24-29 samples, PCR for nptII 239 bp; (2b) egfp 713 bp; (2c) EPSPS 455 bp. M: DNA ladder; P: plasmid; WT: wild-type.
-
Gene Linear range (CT) Regression equation Correlation coefficient nptII 21.07−26.16 f(x) = −3.505x + 21.987 0.999 CsLTP 21.92−25.32 f(x) = −3.491x + 21.126 0.999 Table 1.
The linear range and standard curves for endogenous CsLTP and nptII genes.
-
Cultivar1 Kanamycin
(mg·L−1)Medium Explants SL > 22 PS3 'Florida EV1' 0 Liquid 600 875 17 'Florida EV1' 100 Liquid 600 424 22 'Florida EV1' 200 Liquid 600 285 18 'Florida EV1' 100 Semi-solid 600 535 17 'Valencia' 0 Liquid 420 361 0 'Valencia' 100 Liquid 420 281 2 'Valencia' 200 Liquid 420 177 4 'Valencia' 100 Semi-solid 420 247 1 1The two cultivars were tested and analyzed separately. 2SL > 2, shoots longer than 2 mm. 3PS, GFP positive shoots. Table 2.
'Florida EV1' and 'Valencia' and the variables that were measured (shoots longer than 2 mm (SL > 2) and positive shoots (PS)) in liquid and semi-solid medium.
-
Cultivar1 Kanamycin (mg·L−1) Medium Mean PS2 ± SE3 Mean SL > 24 ± SE Mean TES5 ± SE Mean TEE6 ± SE 'Florida EV1' 0 Liquid 1.7 ± 0.4 87.5a ± 14.3 2.4b ± 0.7 2.8 ± 0.7 'Florida EV1' 100 Liquid 2.2 ± 0.6 42.4b ± 3.7 5.4ab ± 1.4 3.7 ± 1.0 'Florida EV1' 200 Liquid 1.8 ± 0.5 28.5b ± 3.2 7.9a ± 2.7 3.0 ± 0.8 'Florida EV1' 100 Semi-solid 1.7 ± 0.4 53.5b ± 8.7 2.9b ± 0.7 3.2 ± 1.0 'Valencia' 0 Liquid 0 ± 0 51.6a ± 4.4 0 ± 0 0 ± 0 'Valencia' 100 Liquid 0.3 ± 0.2 40.1b ± 2.0 0.7 ± 0.4 0.5 ± 0.3 'Valencia' 200 Liquid 0.6 ± 0.4 25.3c ± 2.7 2.4 ± 1.7 0.9 ± 0.7 'Valencia' 100 Semi-solid 0.1 ± 0.1 35.3bc ± 5.5 0.3 ± 0.3 0.2 ± 0.2 1The two cultivars were tested and analyzed separately. 2PS, GFP positive shoots. 3SE, Standard error. 4SL > 2, the number of shoots longer than 2 mm. 5TES, transformation efficiency based on the number of shoots. 6TEE, transformation efficiency based on the number of explants. Table 3.
The means for the number of positive shoots (PS), shoots with lengths greater than 2 mm (SL > 2), and transformation efficiencies (TES and TEE) at three concentrations of kanamycin in liquid and semi-solid medium for 'Florida EV1' and 'Valencia'.
Figures
(7)
Tables
(3)