-
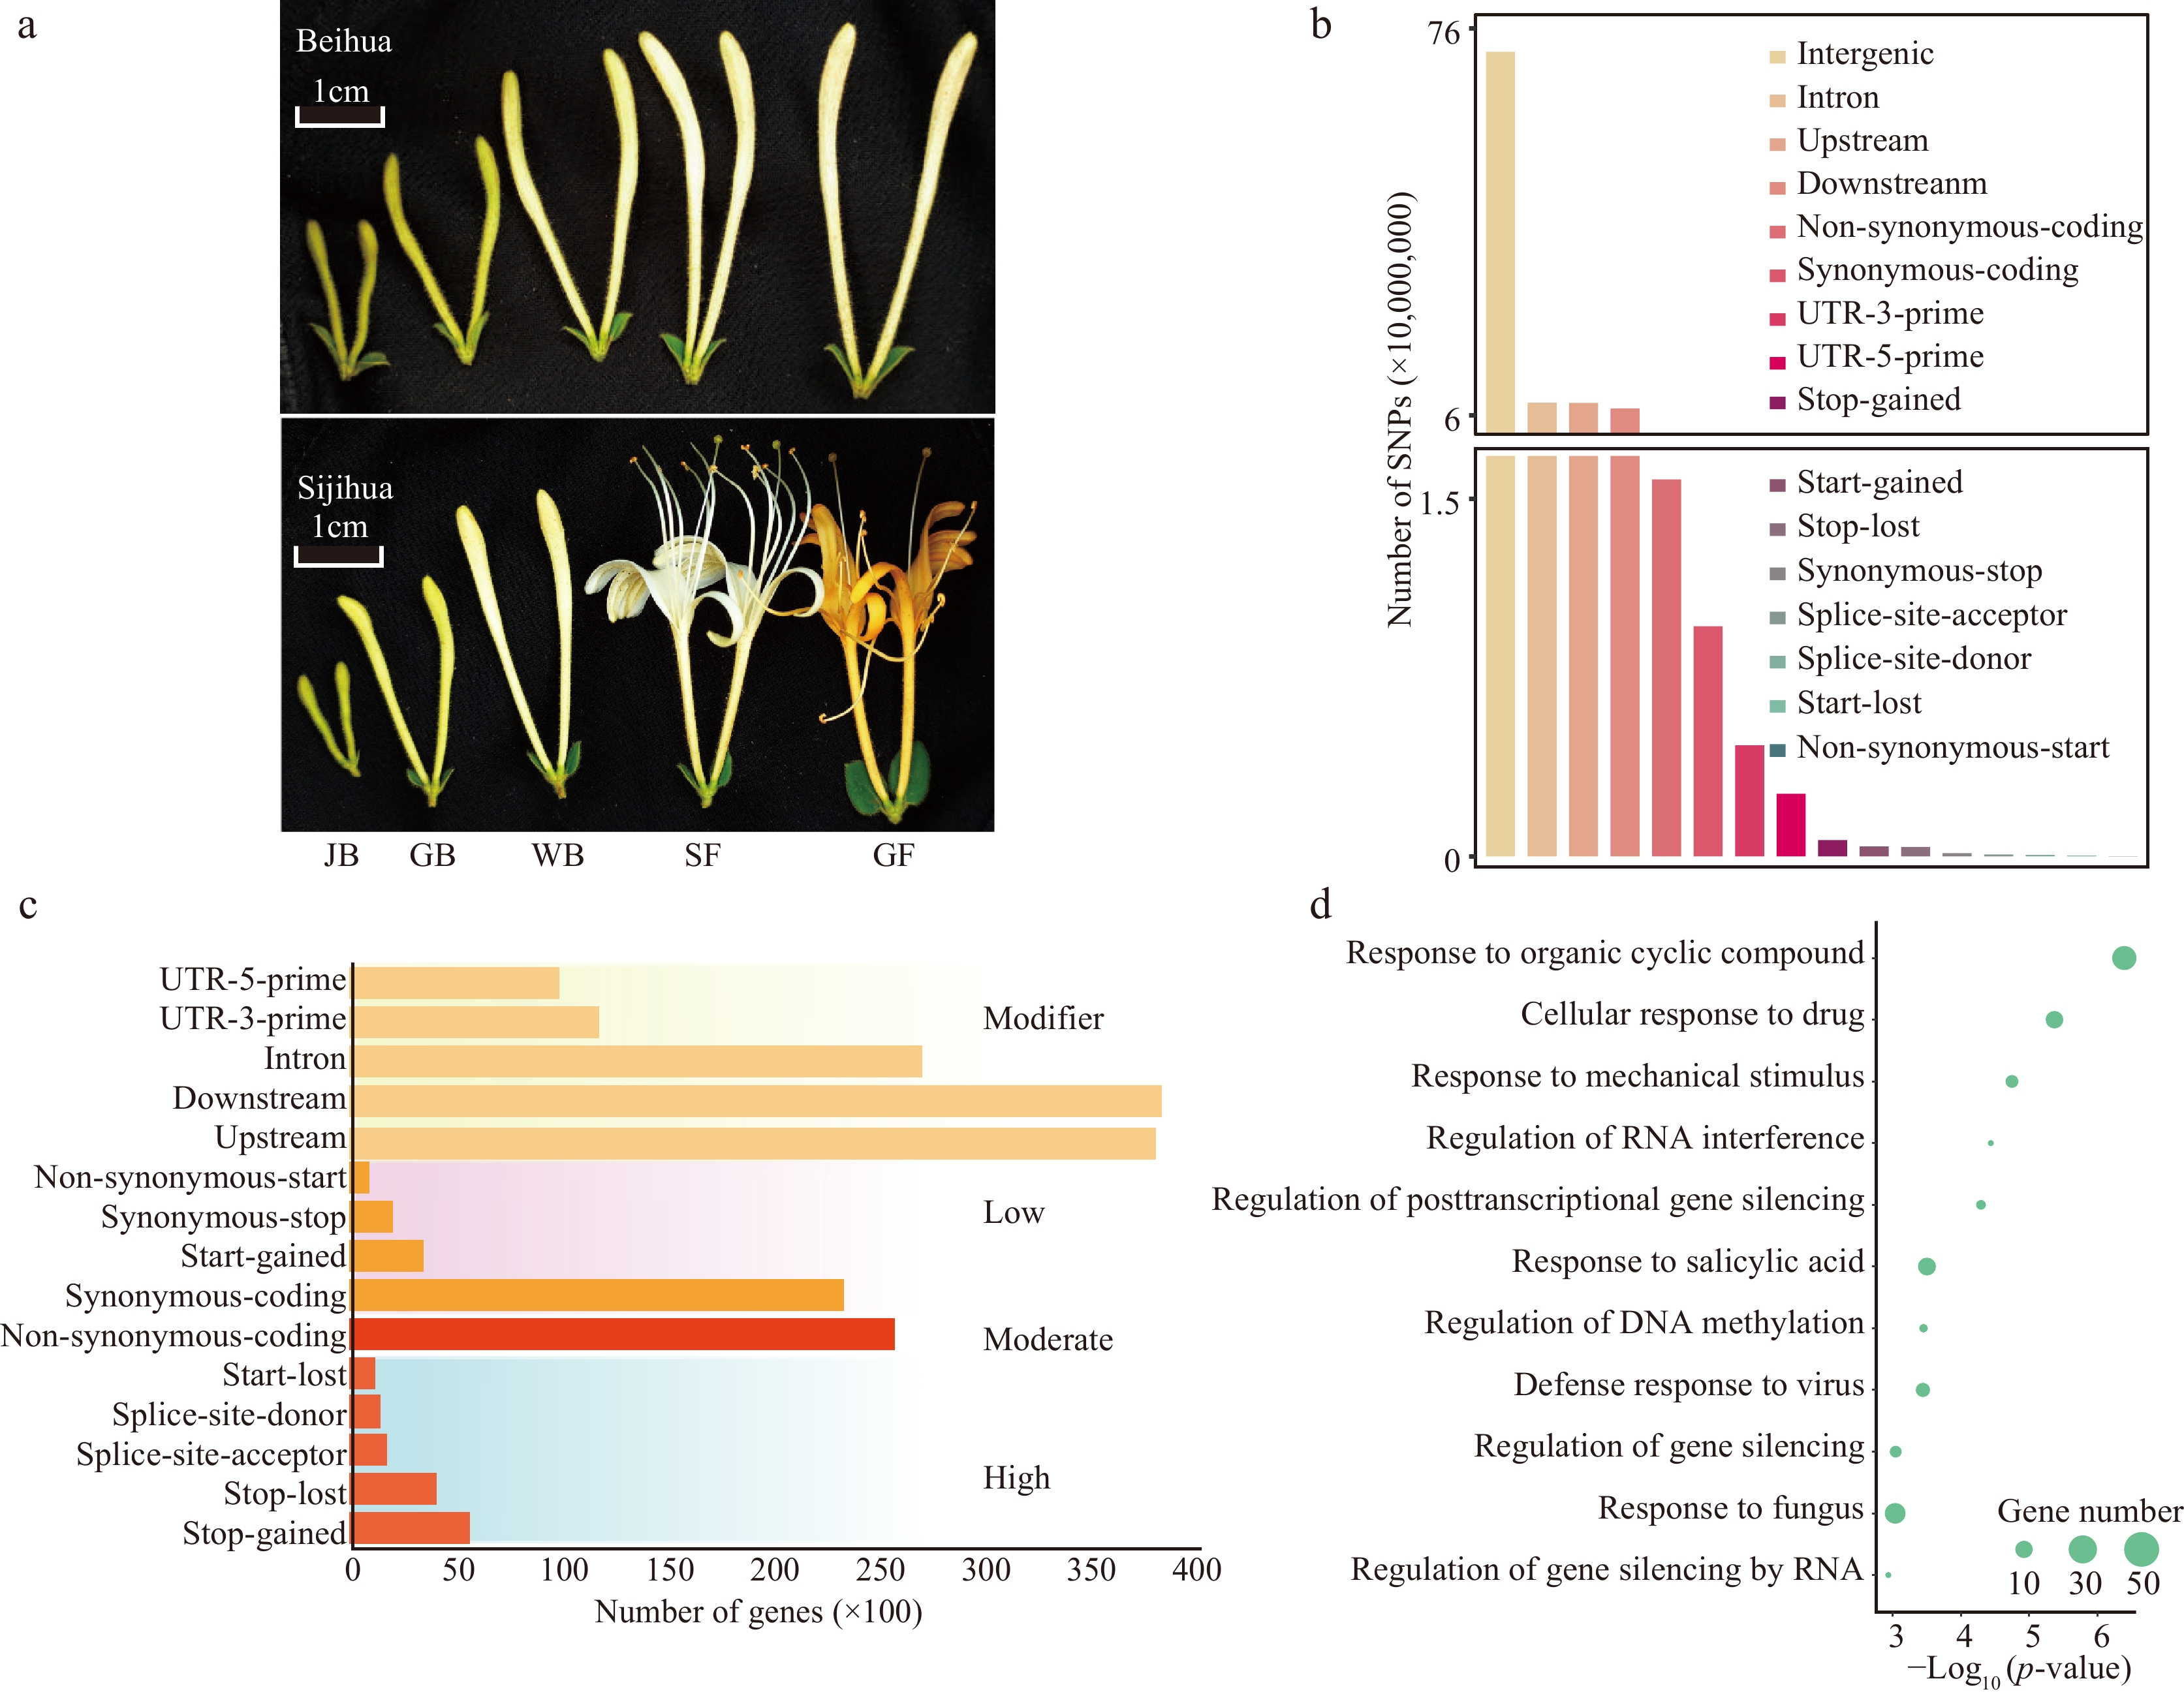
Figure 1.
Identification and classification of SNPs. (a) Different development stages of Beihua and Sijihua. Five stages are juvenile bud (JB), green bud (GB), white bud (WB), silver flower (SF), and golden flower (GF), respectively. (b) Classification of SNPs based on genome location. (c) Number of genes affected by SNPs (SNPs were divided into four impact types: high, moderate, low, and modifier). (d) GO enrichment analysis of DEGs related to high-impact SNPs.
-
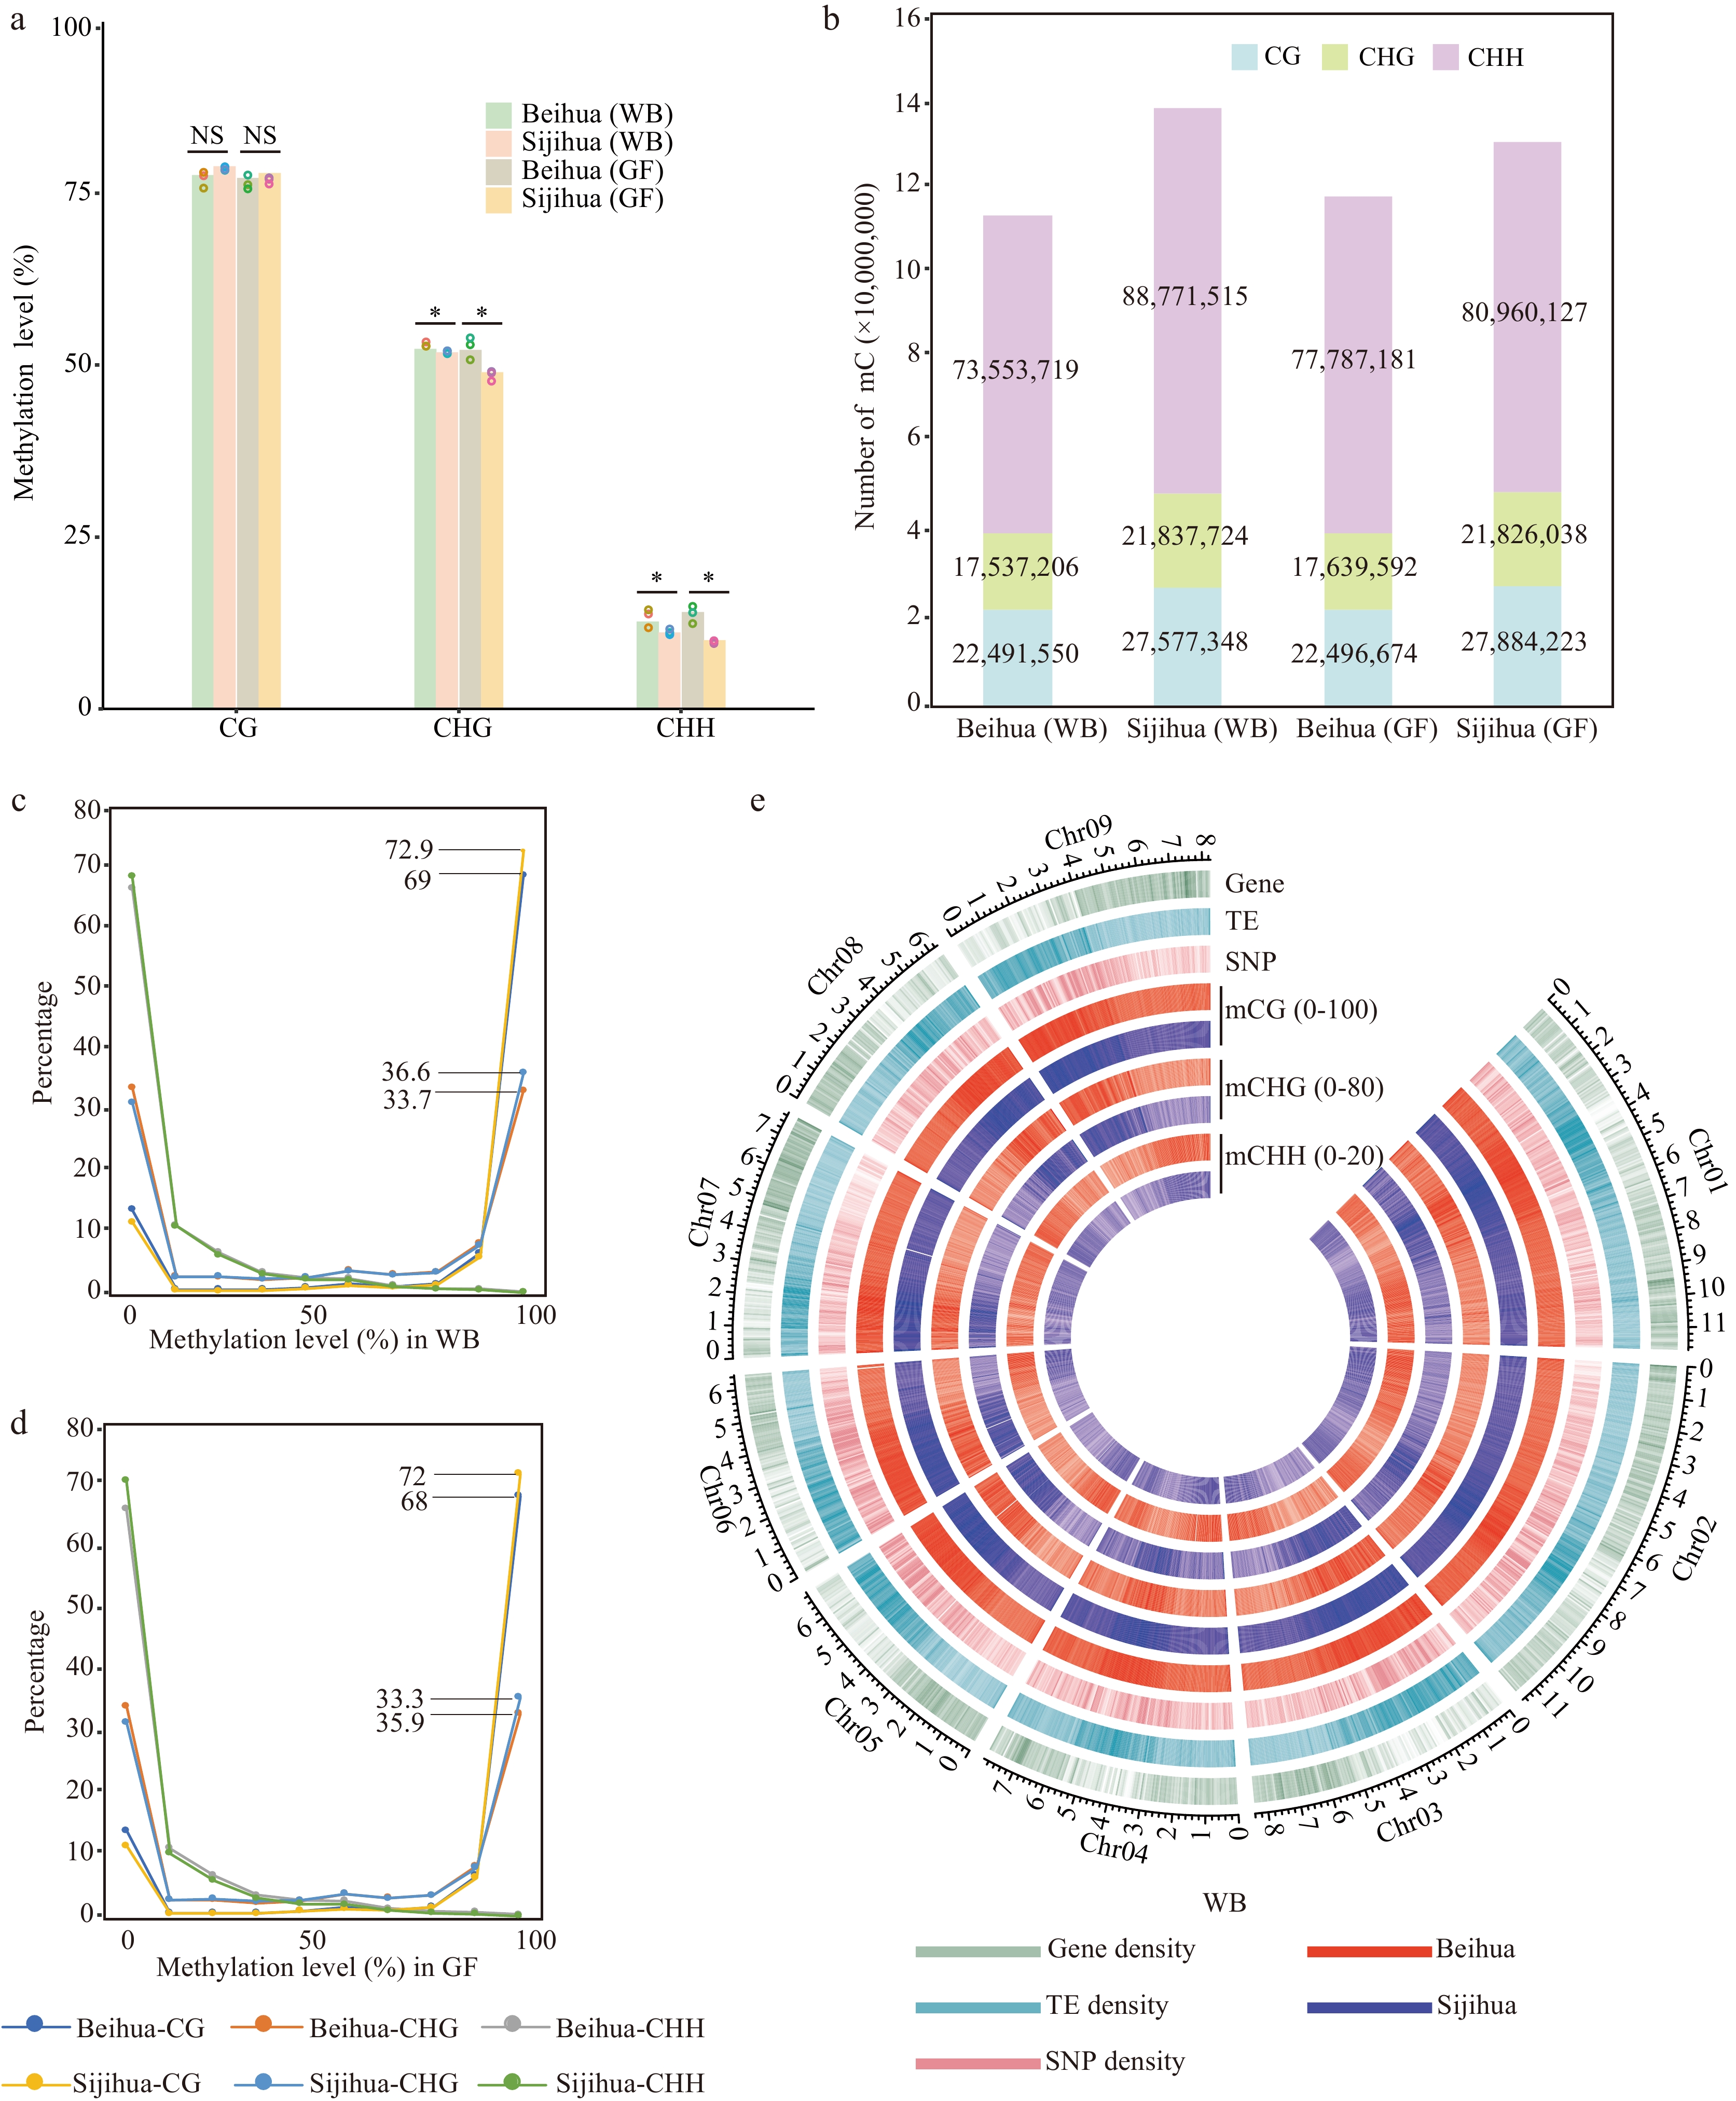
Figure 2.
DNA methylation landscape of Beihua and Sijihua. (a) Comparison of whole-genome DNA methylation levels in Beihua and Sijihua during the WB and the GF stages. Three biological replicates were calculated as dots over the bar graph (T-test, * p-value < 0.05, NS represents non-significant). (b) The relative proportions of methyl-cytosine in the contexts of CG, CHG, and CHH in Beihua and Sijihua during the WB and GF stages. (c)−(d) Distribution of methyl-cytosine methylation levels in all three sequence contexts in Beihua and Sijihua during the WB(C) and GF(D) stages were compared. (e) Circos plot showing gene density, TE density, SNP density, and DNA methylation levels for all three contexts of the WB stage.
-
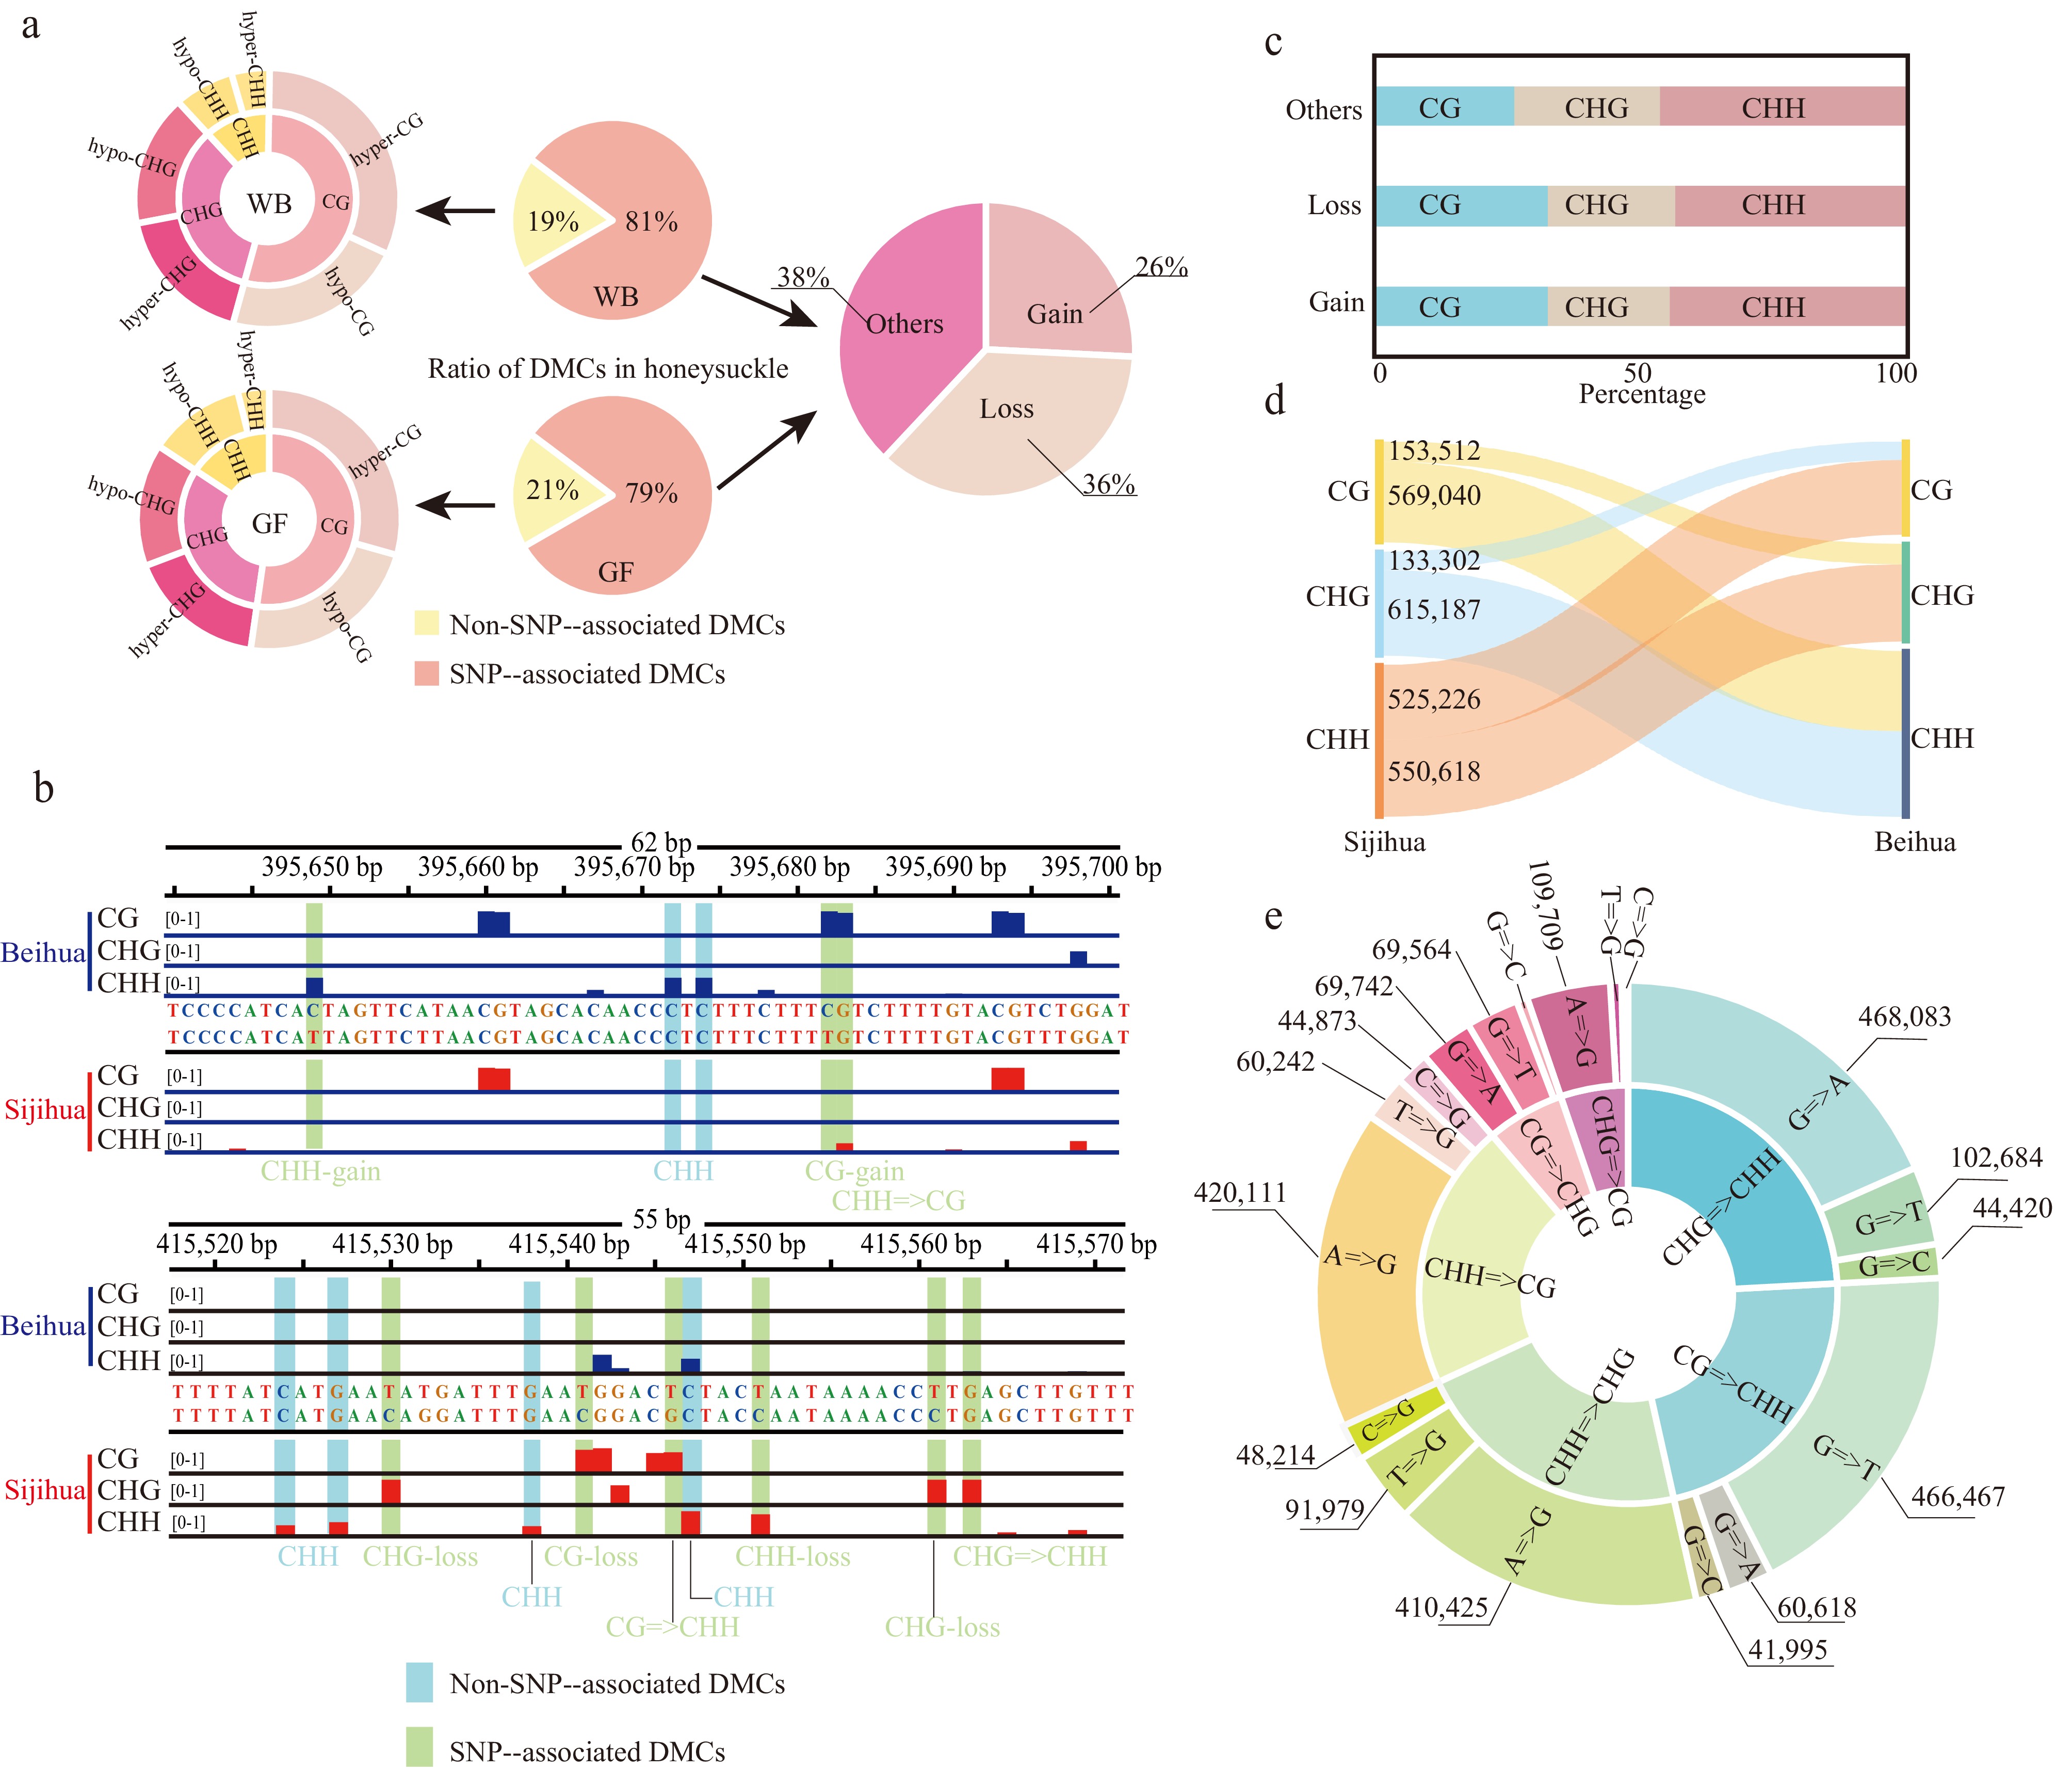
Figure 3.
Identification of differentially methylated cytosines in the honeysuckle genome. (a) The proportion of two DMC types in the honeysuckle genome, including non-SNP-associated DMCs and SNP-associated DMCs. (b) Representative screenshots of DMCs. Methylation site losses, gains, and mC context changes were indicated on the underside of the track (red: Sijihua; blue: Beihua; Light blue shading represents non-SNP-associated DMCs; Light green represents SNP-associated DMCs). (c) The proportion of methylation types of the SNP-associated DMCs. (d) Sankey diagram showing the number of changes in DNA methylation types in three contexts between Sijihua and Beihua. (e) Sunburst chart showing the number of methylation type changes caused by nucleotide mutation.
-
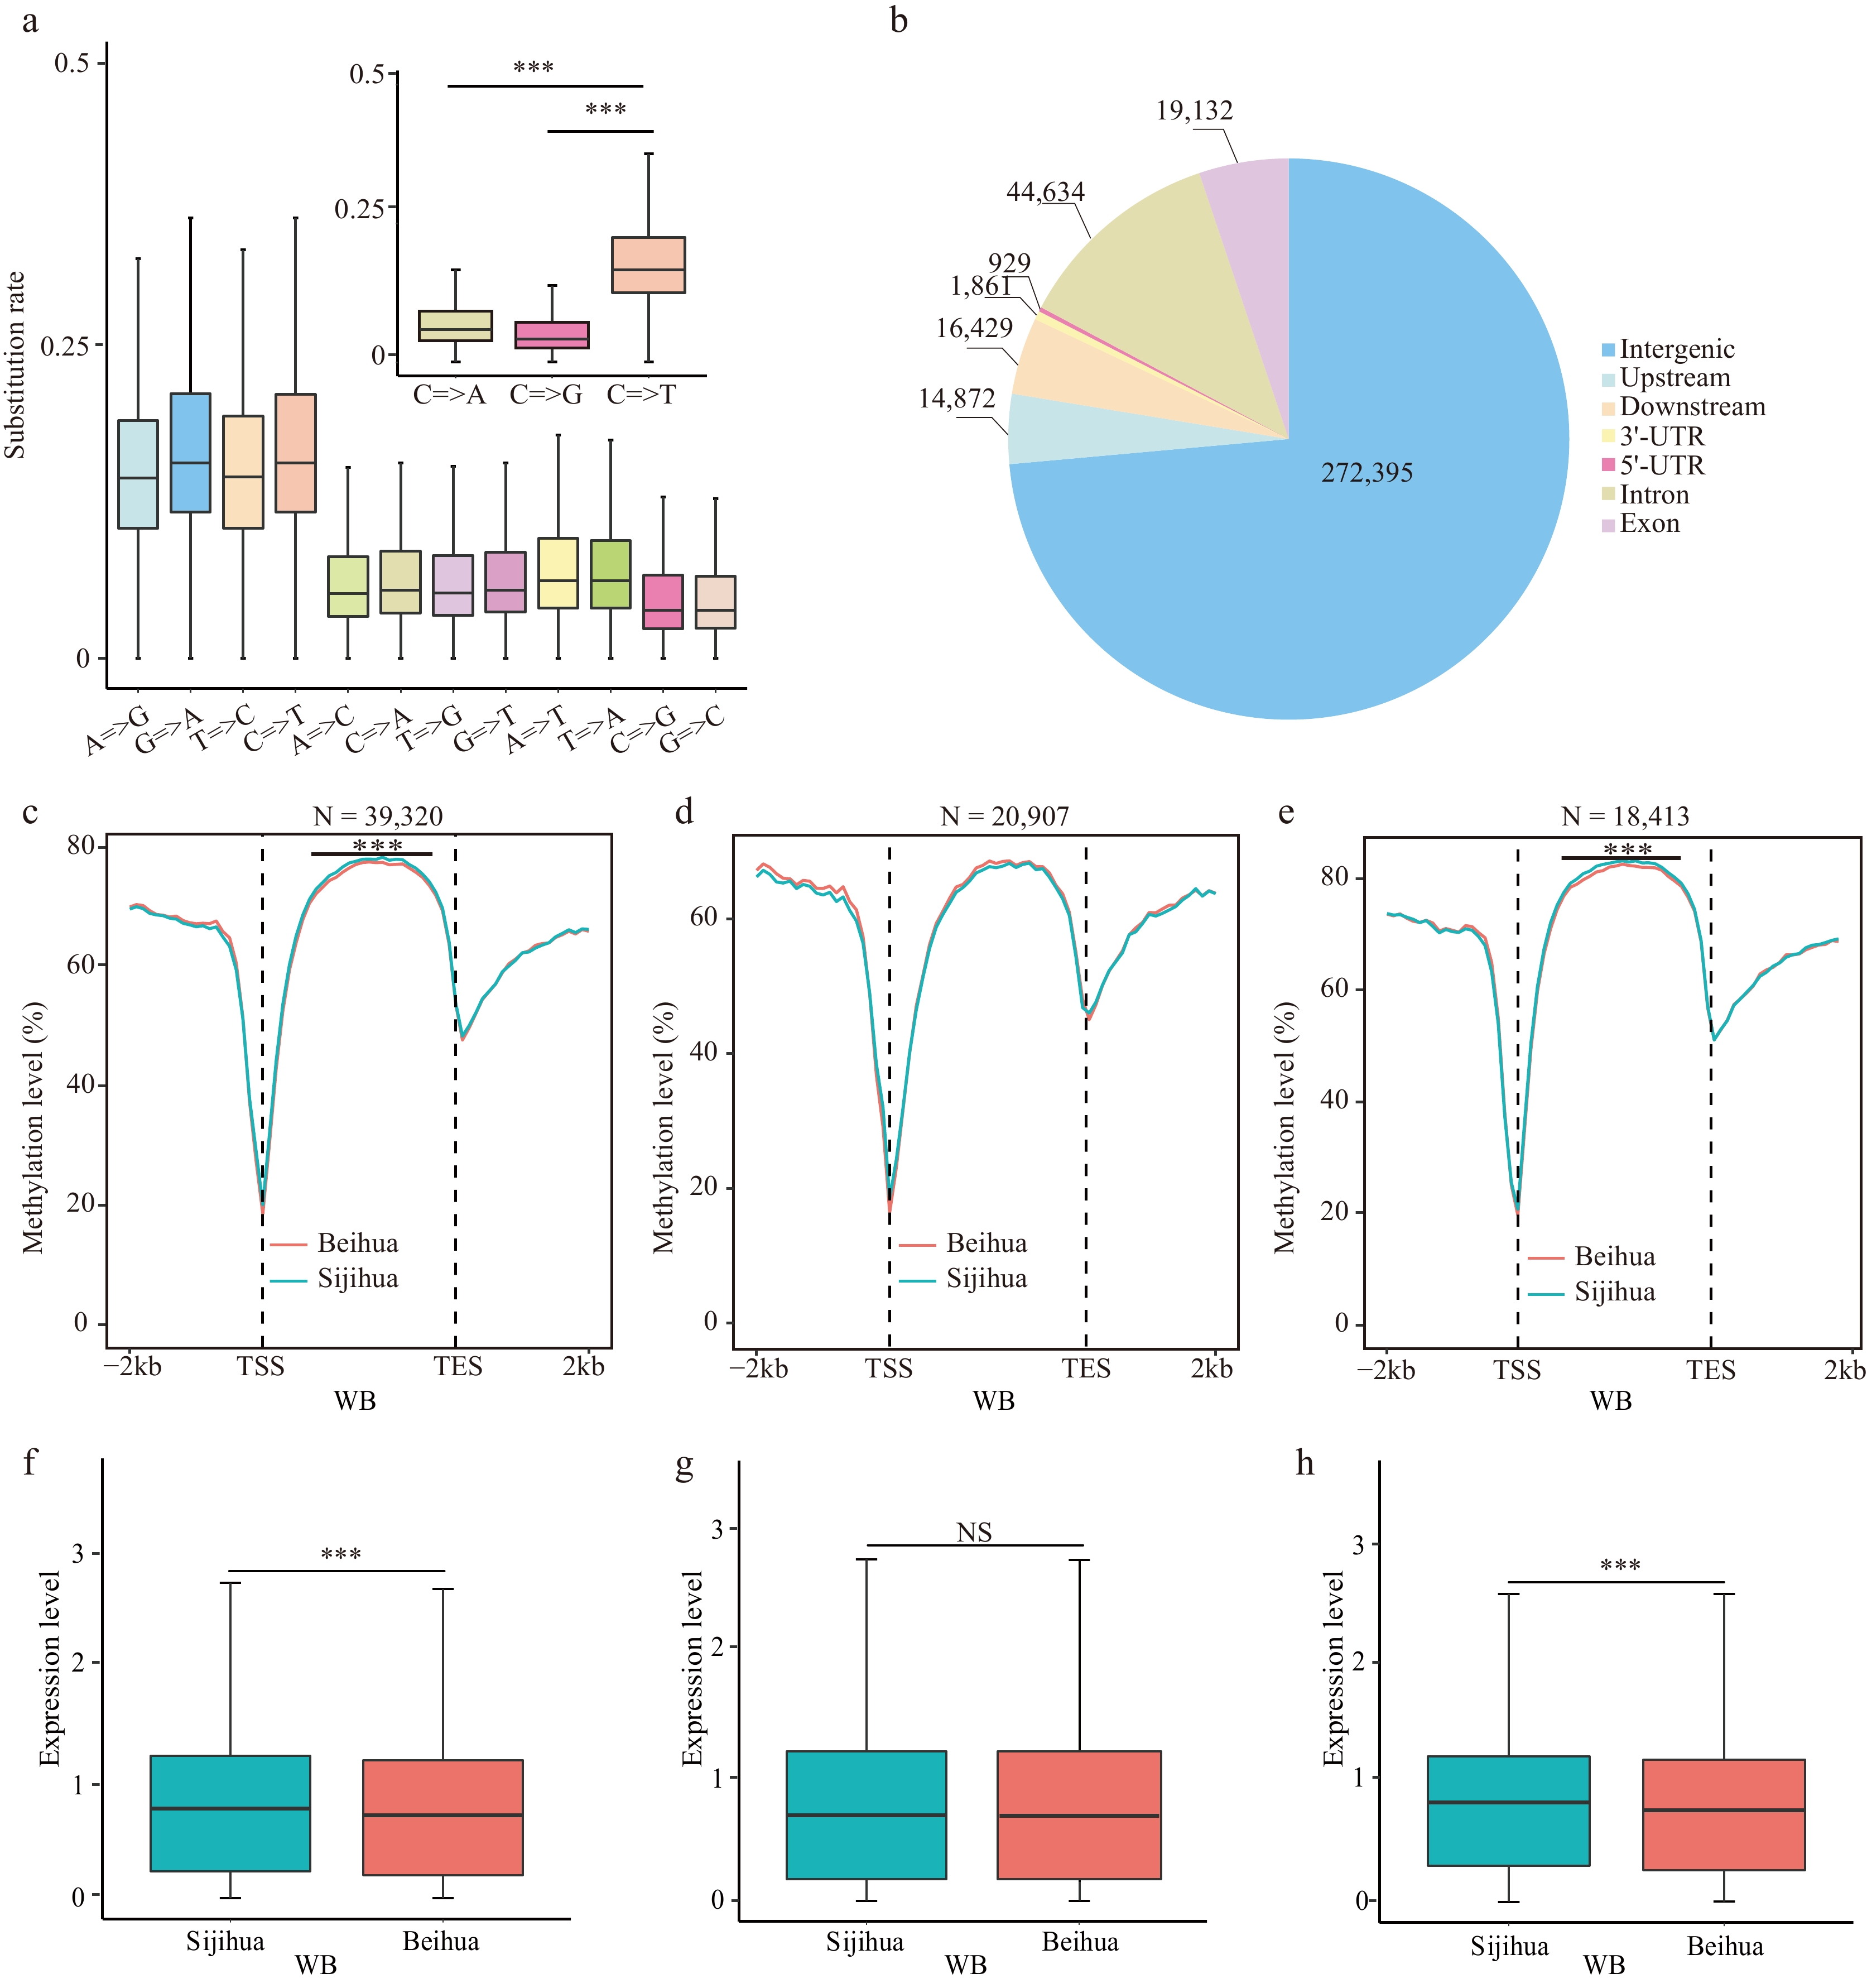
Figure 4.
Relationship of CG=>TG type mutations with CG methylation and gene expression. (a) The substitution rate of nucleotides in homologous genes between Beihua and Sijihua. (b) The distribution of CG=>TG mutation sites on the honeysuckle genome. Comparison of CG methylation levels in the body region and the flanking 2 Kb region of (c) all genes, (d) CG=>TG unrelated genes, and (e) CG=>TG-related genes during the WB stage in Sijihua and Beihua. The expression levels of (f) all genes, (g) CG=>TG unrelated genes, and (h) CG=>TG-related genes during the WB stage in Sijihua and Beihua were compared (Mann-Whitney test, *** p-value < 0.001, NS represents non-significant).
-
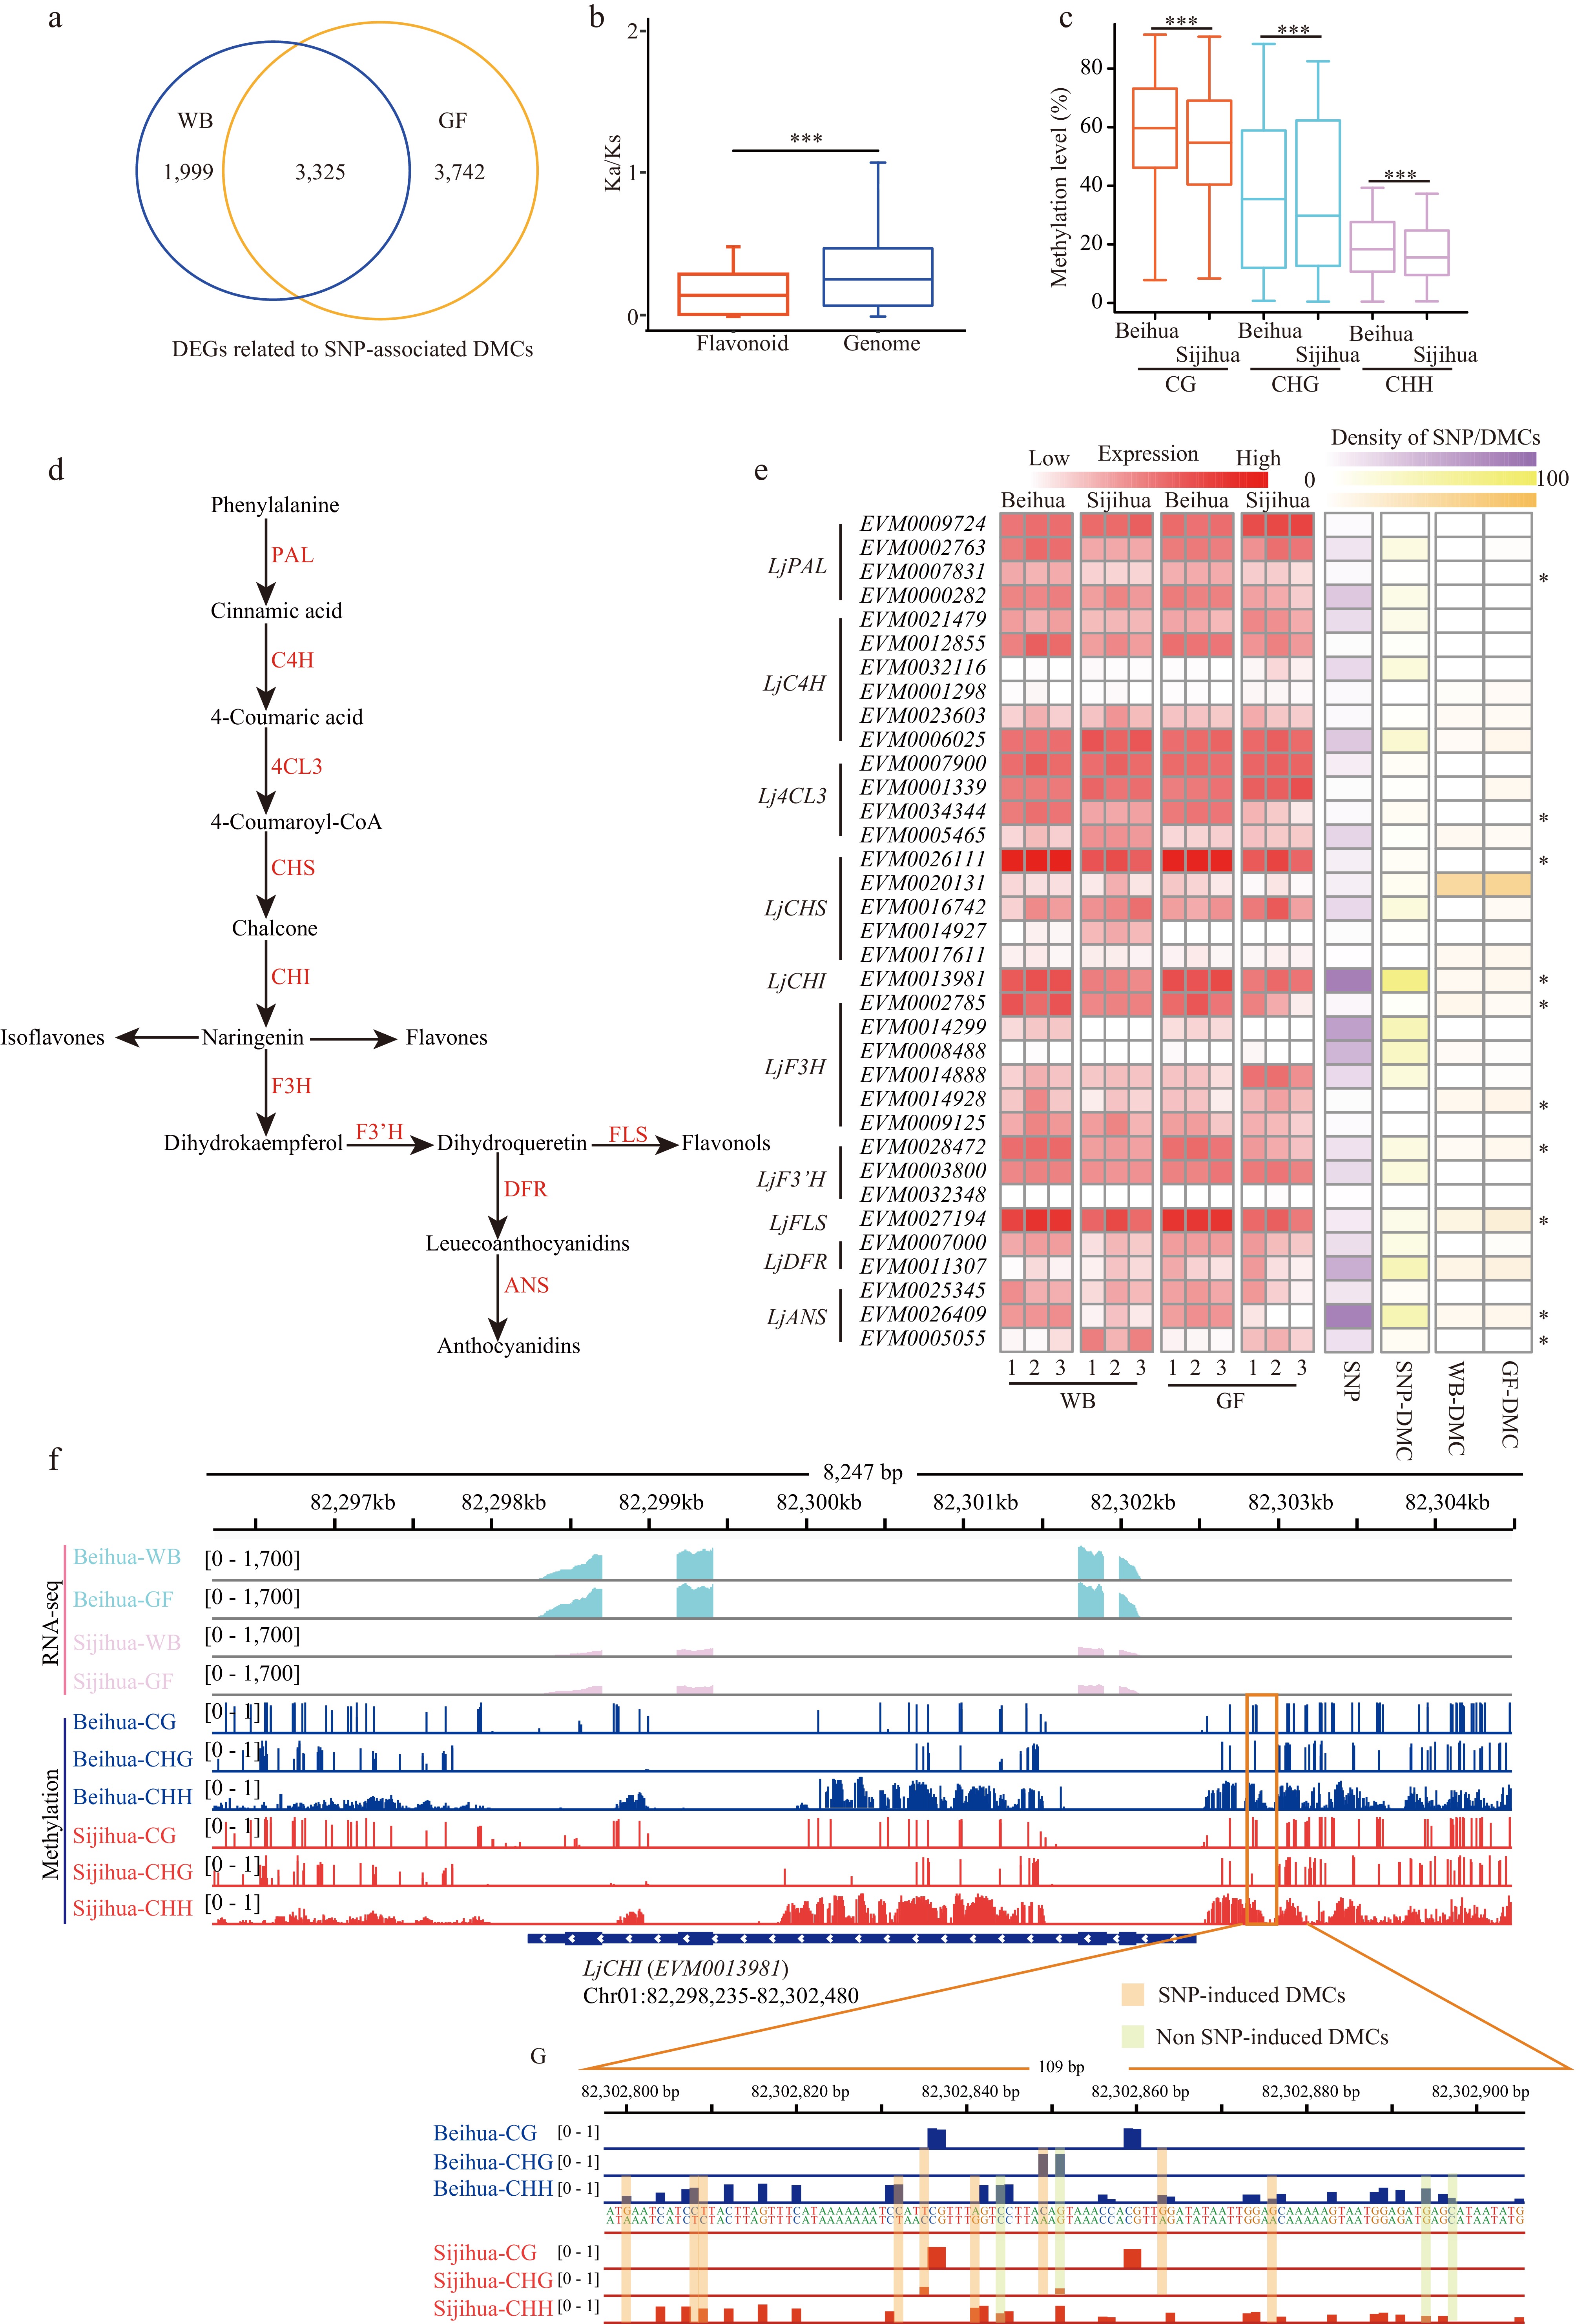
Figure 5.
The relationship between genes related to SNP-associated DMCs and the flavonoid pathway. (a) Venn diagram showing the number of overlapping differentially expressed genes (DEGs) associated with SNP-associated DMCs between WB and GF. (b) Boxplot showing Ka/Ks ratios of 35 key genes and genomes in the flavonoid pathway of honeysuckle (Mann-Whitney test. *** p-value < 0.001). (c) Boxplot showing the methylation levels of CG, CHG, and CHH in the promoter regions of 35 key genes in the flavonoid pathway during the WB in Beihua and Sijihua (Mann-Whitney test. *** p-value < 0.001). (d) The pathway of flavonoid synthesis in plants. (e) Heatmaps showing the expression levels of 35 key genes of the flavonoid pathway, the number of SNPs in the upstream region of the genes, the number of SNP-associated with DMCs, and the number of non-SNP-associated with DMCs for Beihua and Sijihua at the WB and GF (* represents DEGs in the WB and GF stages). (f) Genome browser showing DNA methylation level and expression level of LjCHI (EVM0013981). (g) Genome browser showing representative screenshots of two types of DMCs in the promoter region (Chr01: 82302800 − 82302800) of LjCHI (EVM0013981).
Figures
(5)
Tables
(0)