-
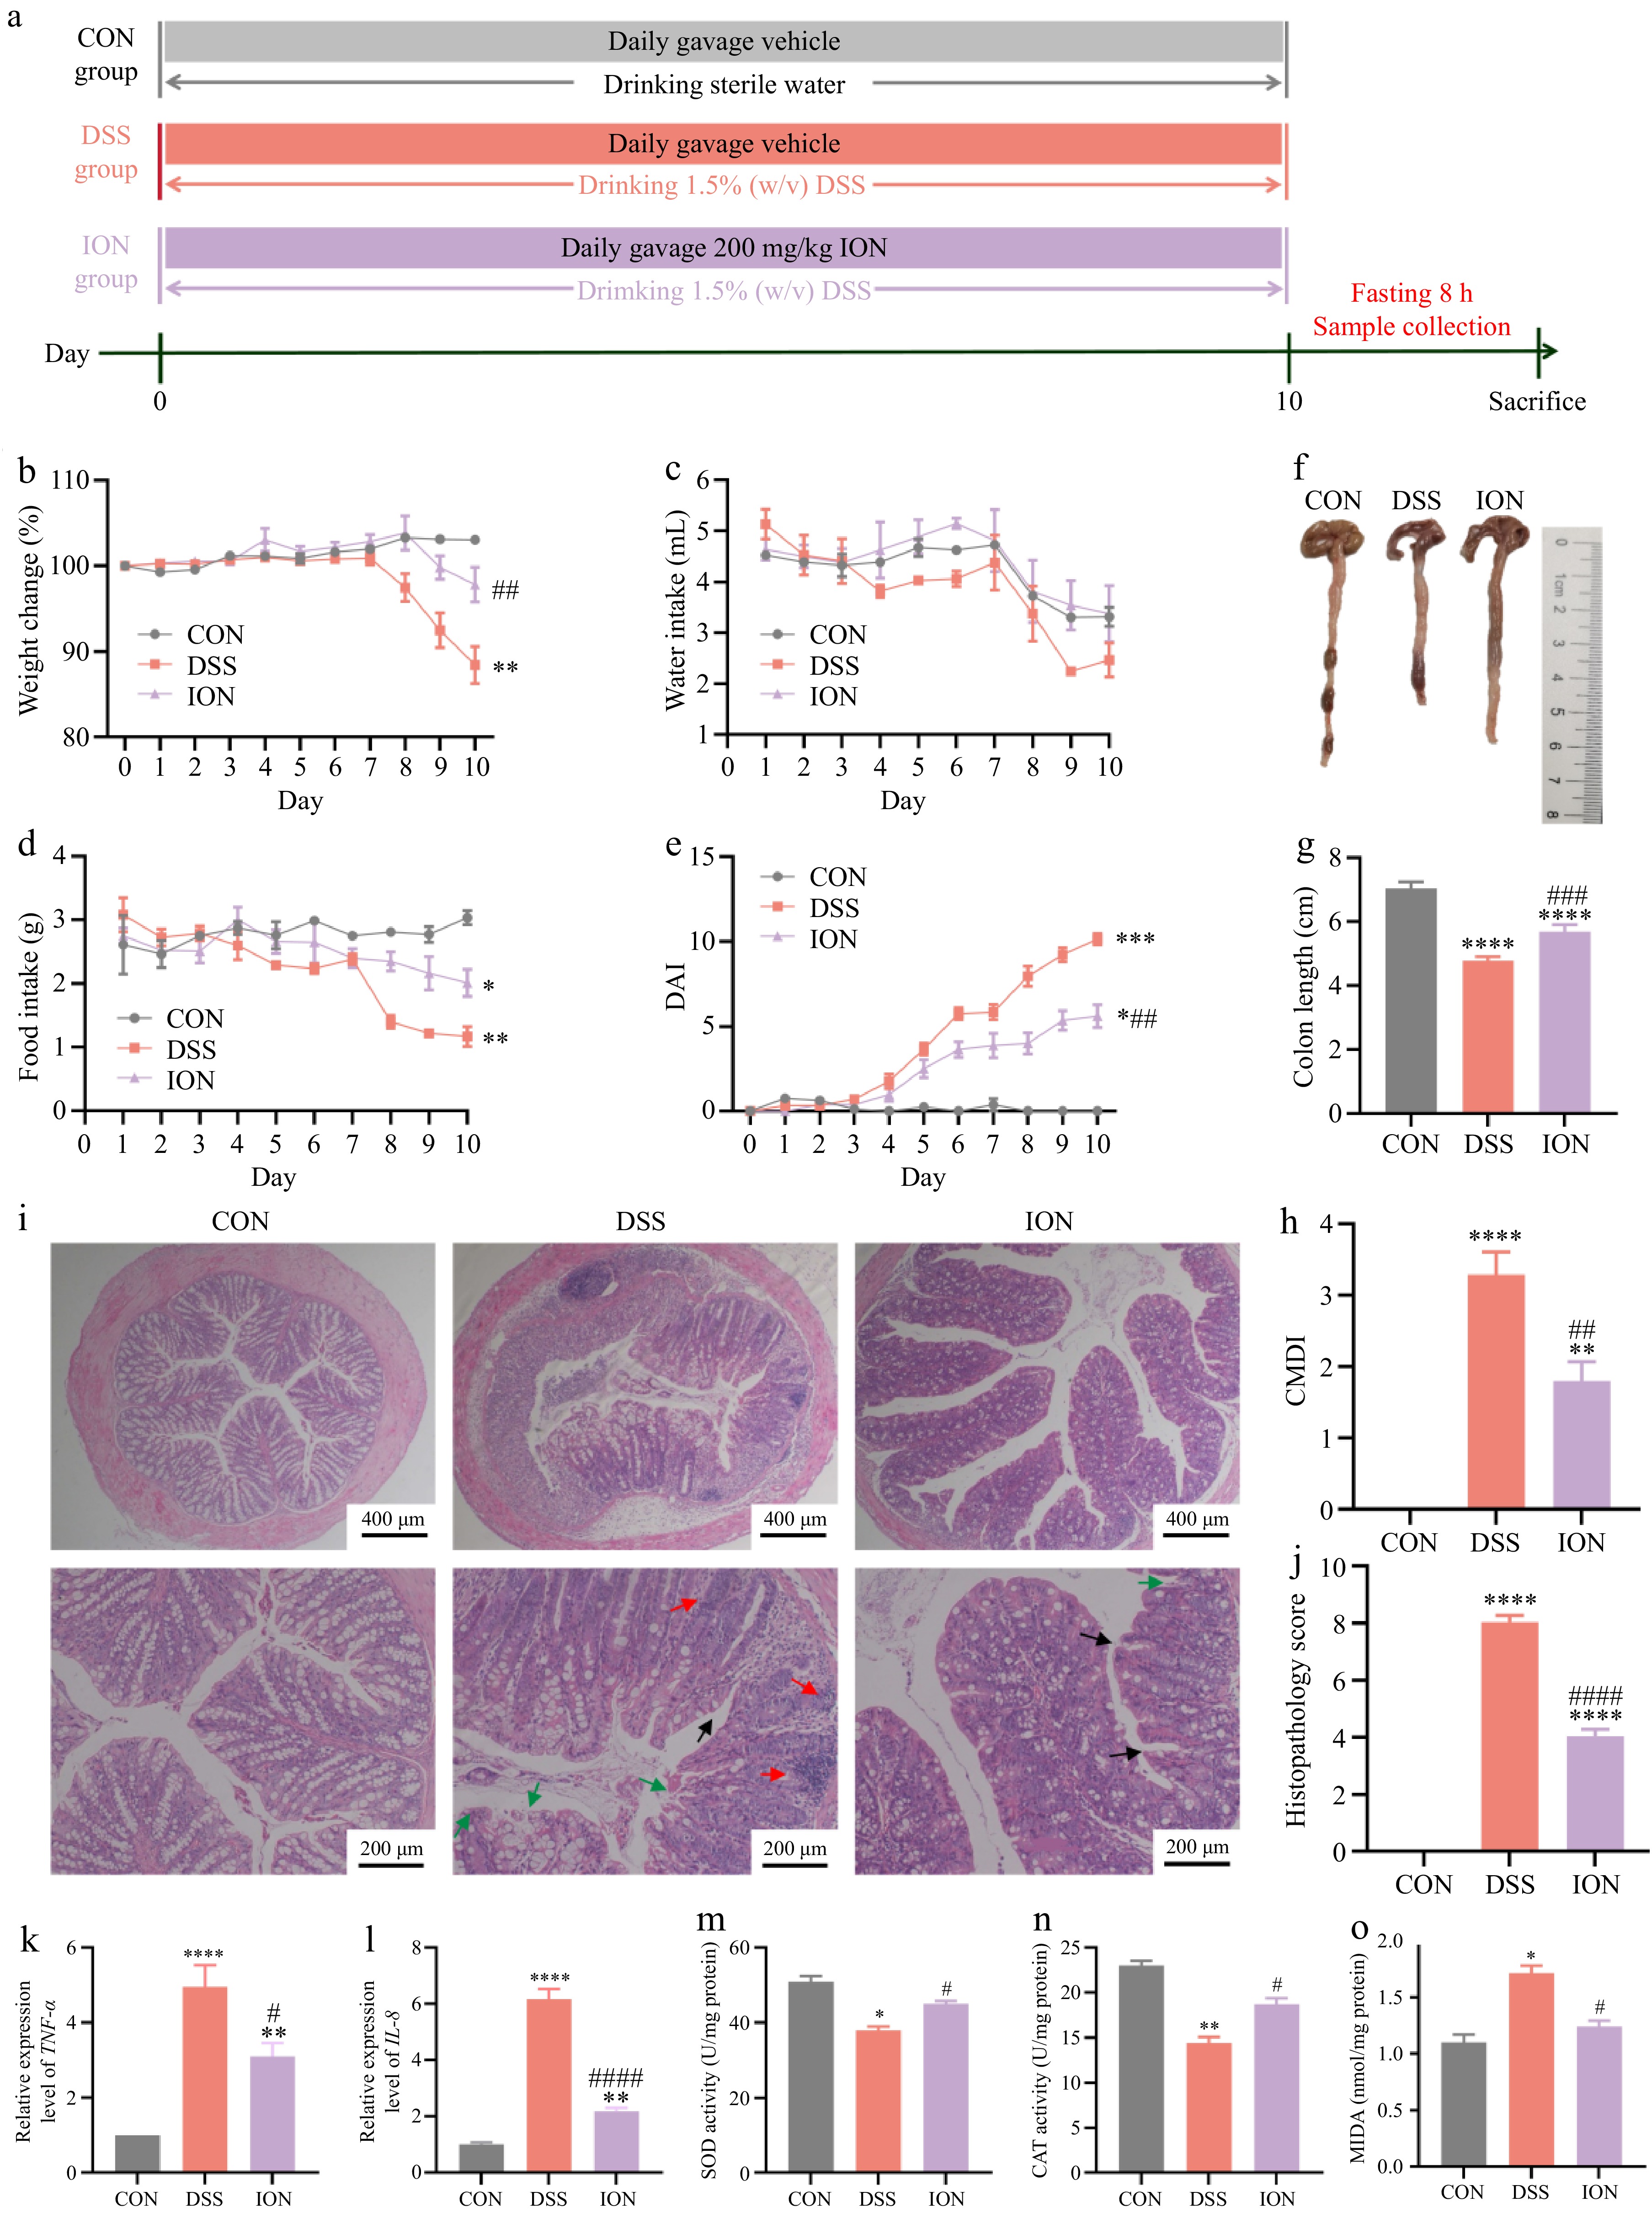
Figure 1.
ION prevents colitis symptoms, colonic damage, and oxidative stress in DSS-treated mice. (a) Design of experimental procedures for the prevention of ION on DSS-induced colitis. (b) Percentage of change in body weight. (c) Daily water intake. (d) Daily food intake. (e) The disease activity index (DAI) value. (f) Representative colon pictures. (g) Colon length. (h) Colon mucosa damage index (CMDI) value. (i) Representative images of colonic H&E staining (Upper: original magnification 40×, scale bar = 400 μm; bottom: original magnification 100×, scale bar = 200 μm. The red arrow represents the infiltration of inflammatory cells, the green arrow represents the damage of lumen surface, and the black arrow represents the destruction and bifurcation of intestinal crypt). (j) Histological scores of colons. The relative expression levels of (k) TNF-α and (l) IL-8 in colon tissues. The activities of (m) SOD and (n) CAT, and levels of (o) MDA in colon tissues. Data are shown as mean ± SEM. Statistical significance was determined by using one-way ANOVA followed by the Tukey test. * p < 0.05 vs CON, ** p < 0.01 vs CON, *** p < 0.001 vs CON, **** p < 0.0001 vs CON, # p < 0.05 vs DSS, ## p < 0.01 vs DSS, ### p < 0.001 vs DSS, #### p < 0.0001 vs DSS.
-
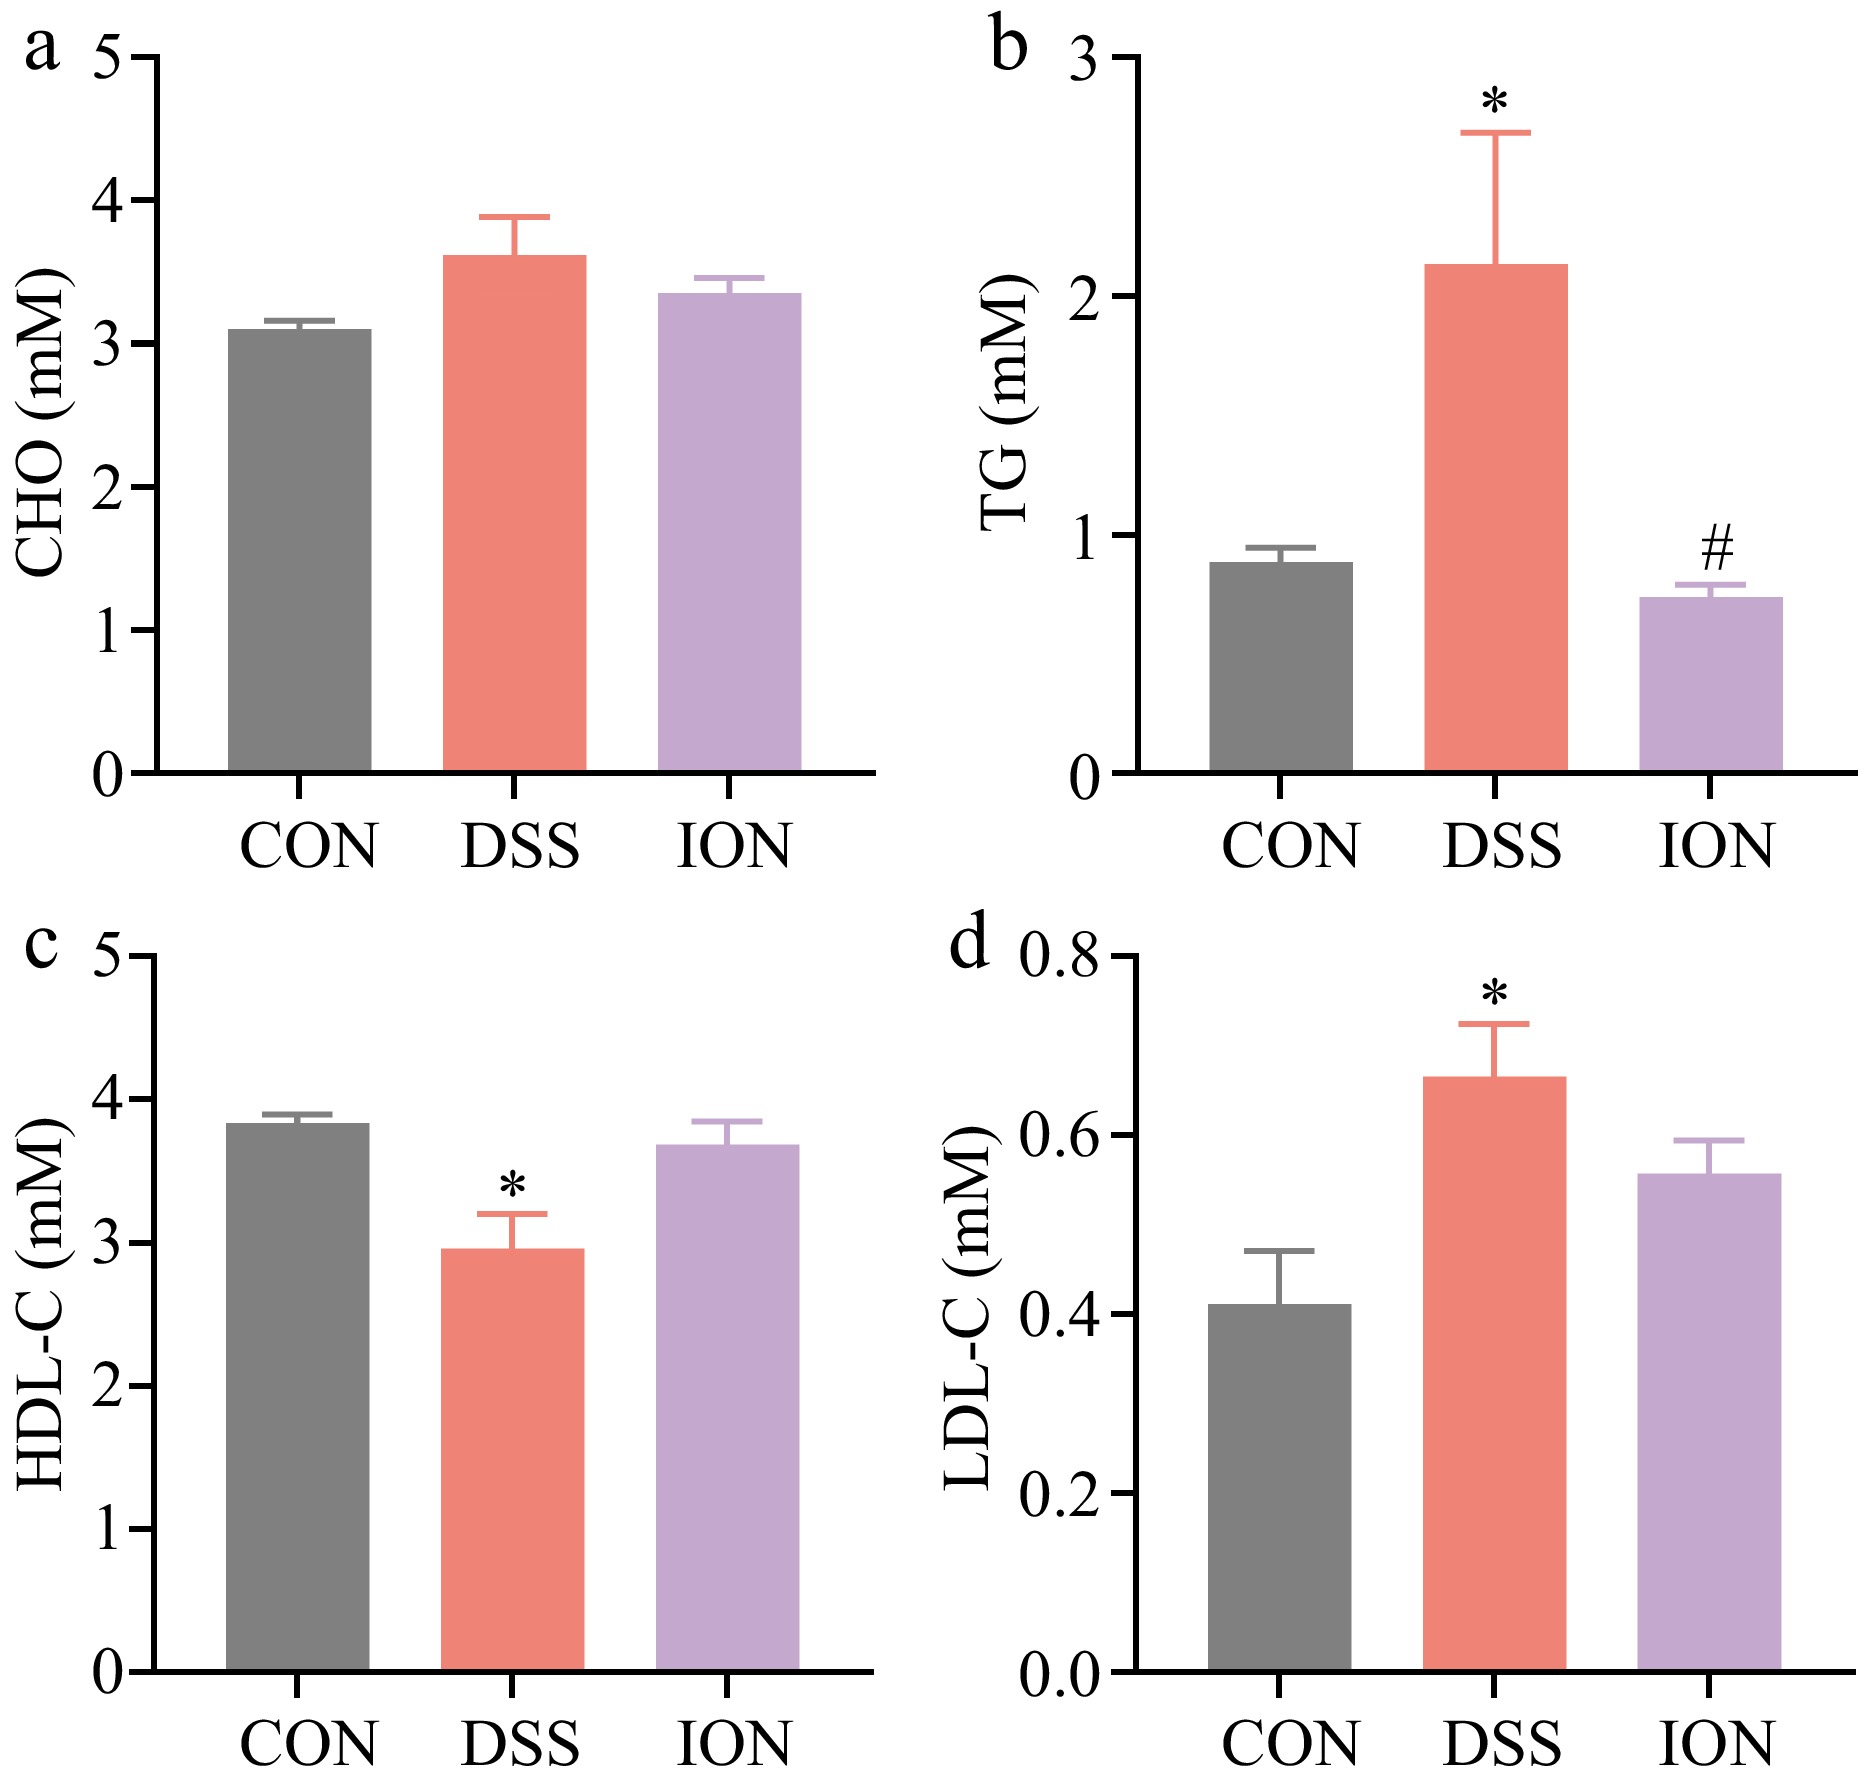
Figure 2.
Effect of ION on serum lipidemia indexes in DSS-treated mice. (a) CHO levels in serum. (b) TG levels in serum. (c) HDL-C levels in serum. (d) LDL-C levels in serum. Data are presented as mean ± SEM (n = 4). Statistical significance was determined using one-way ANOVA, followed by the Tukey test. * p < 0.05 vs CON, # p < 0.05 vs DSS.
-
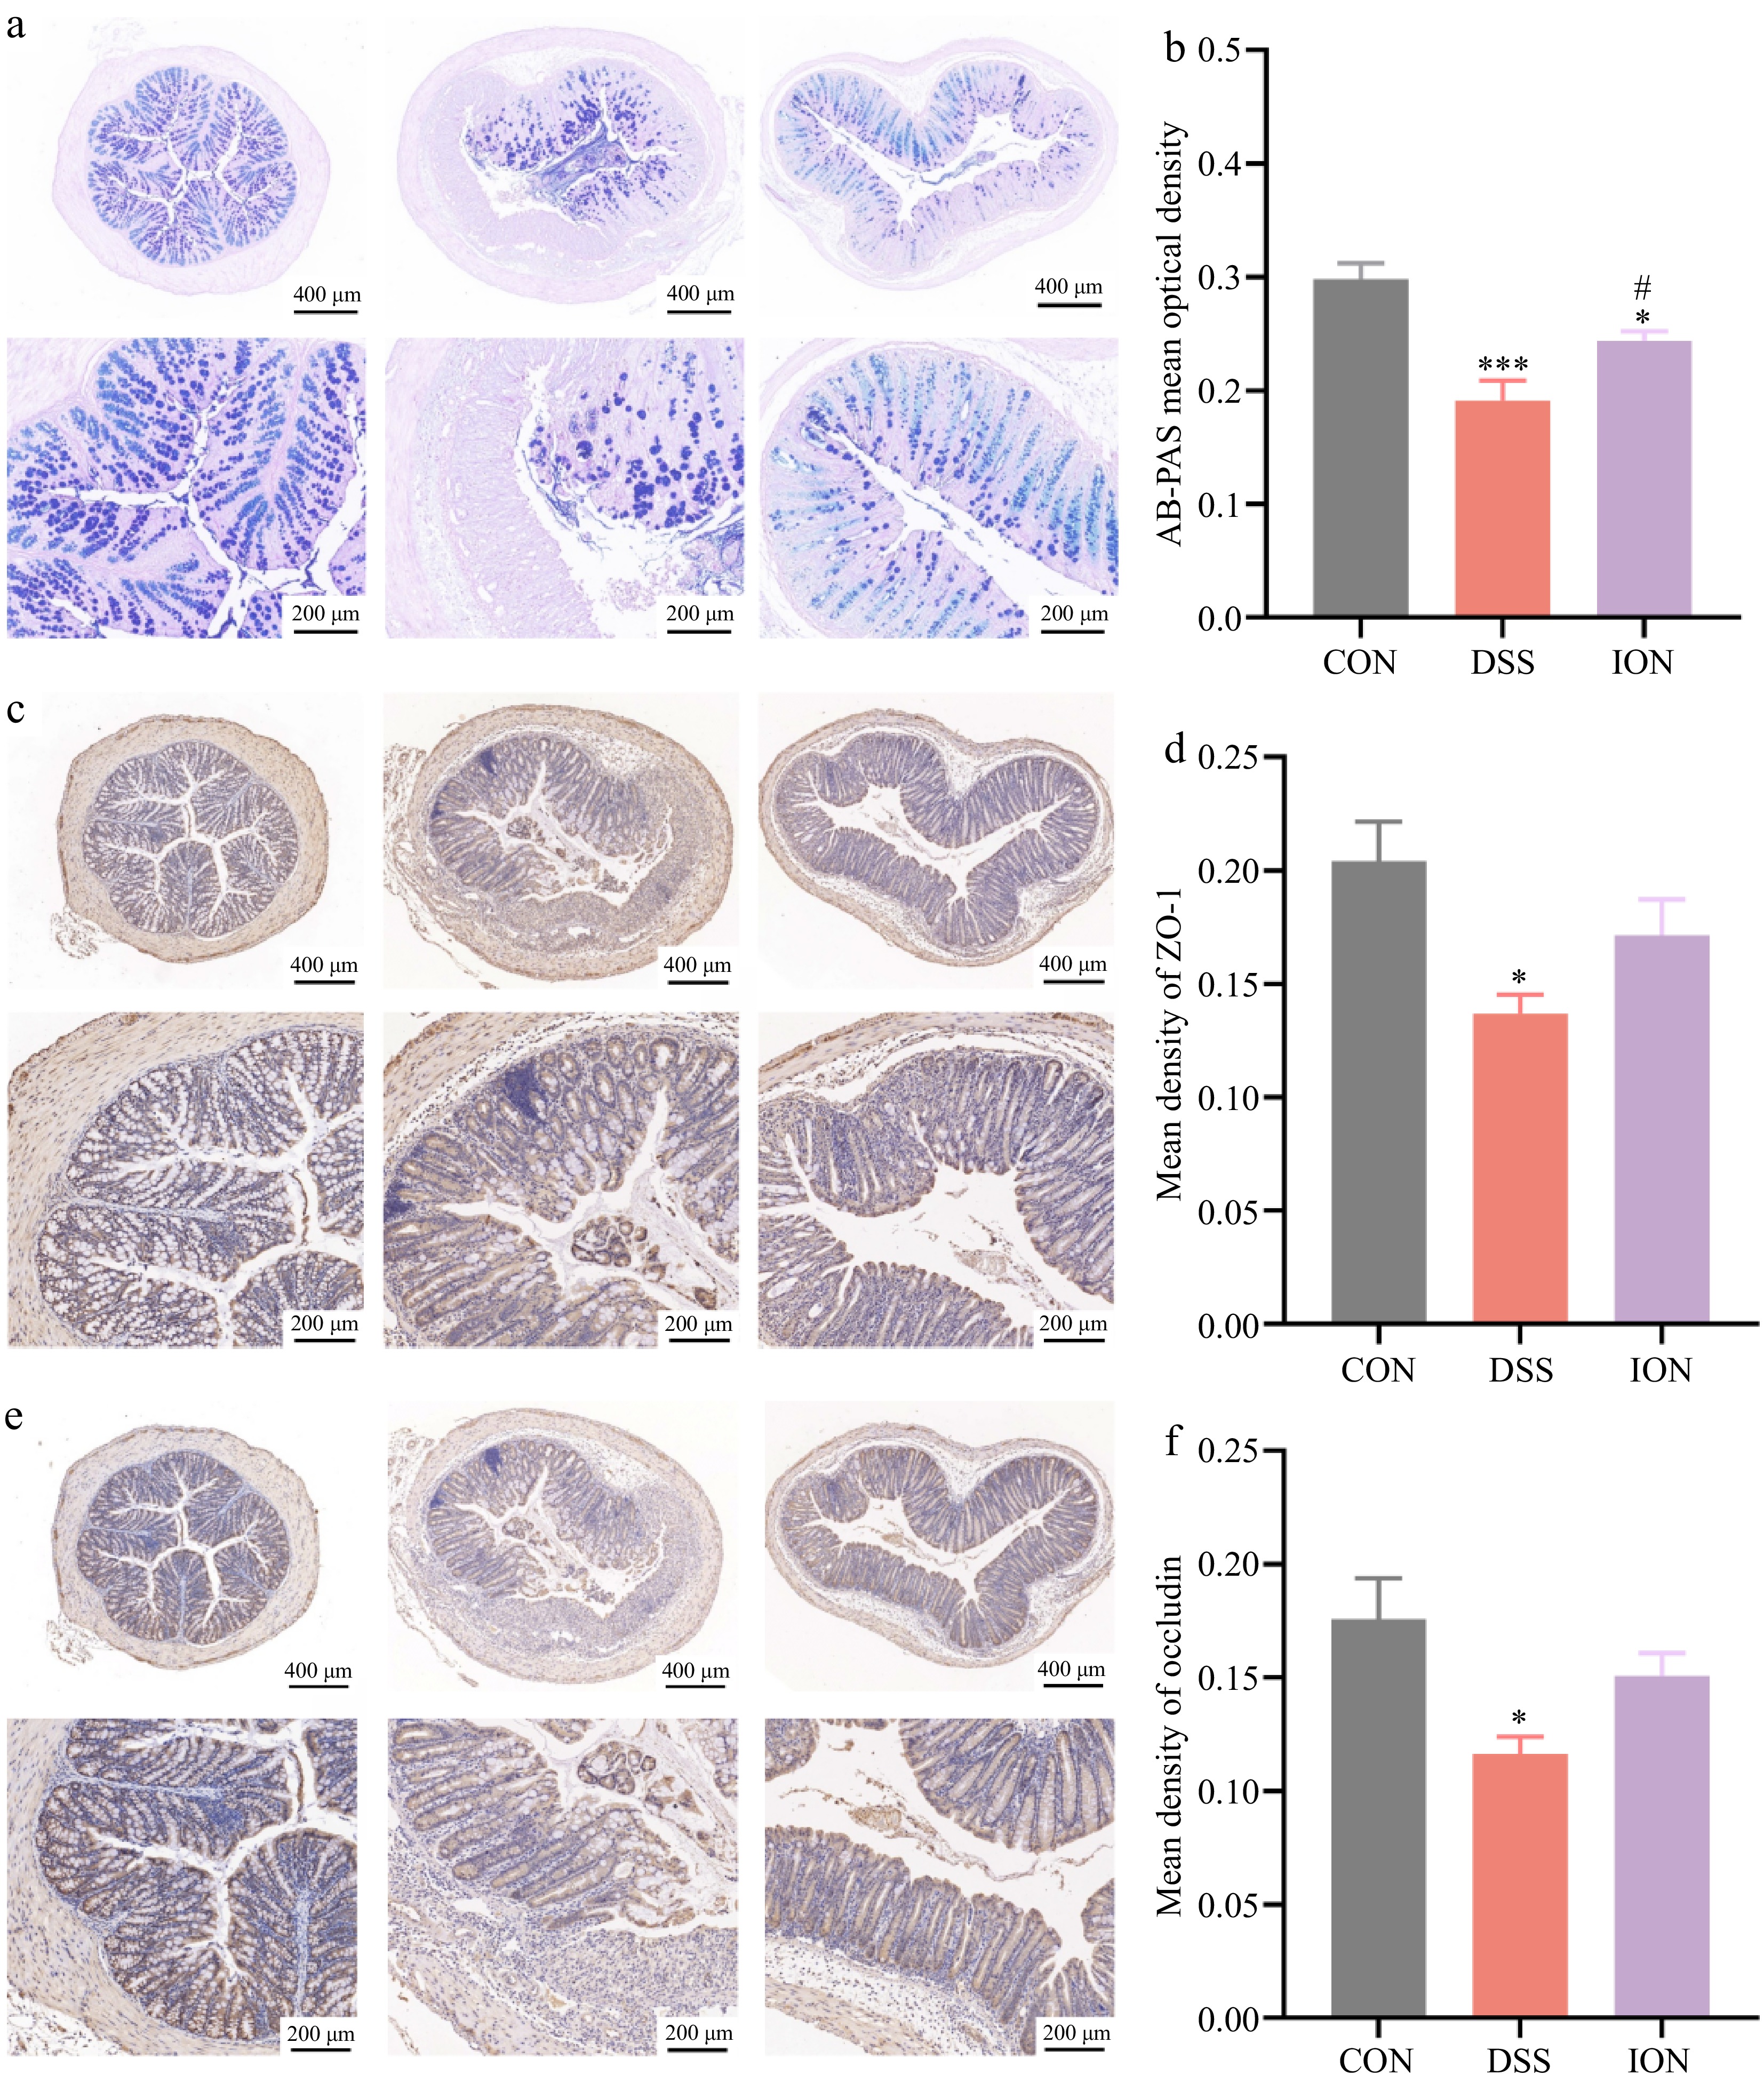
Figure 3.
ION alleviates DSS-induced impairment of colonic barrier function. (a) Representative AB-PAS-stained sections of the colon. (b) AB-PAS-stained optical density values. (c) Immunohistochemistry-stained sections of colons were stained for ZO-1. (d) Optical density values of immunohistochemistry-stained sections of ZO-1. (e) Immunohistochemistry-stained sections of the colon were stained for occludin. (f) Optical density values of immunohistochemistry-stained sections of occludin. (Upper: original magnification 40×, scale bar = 400 μm; bottom: original magnification 100×, scale bar = 200 μm). Data are shown as mean ± SEM. Statistical significance was determined by using one-way ANOVA followed by the Tukey test. * p < 0.05 vs CON, *** p < 0.001 vs CON, # p < 0.05 vs DSS.
-
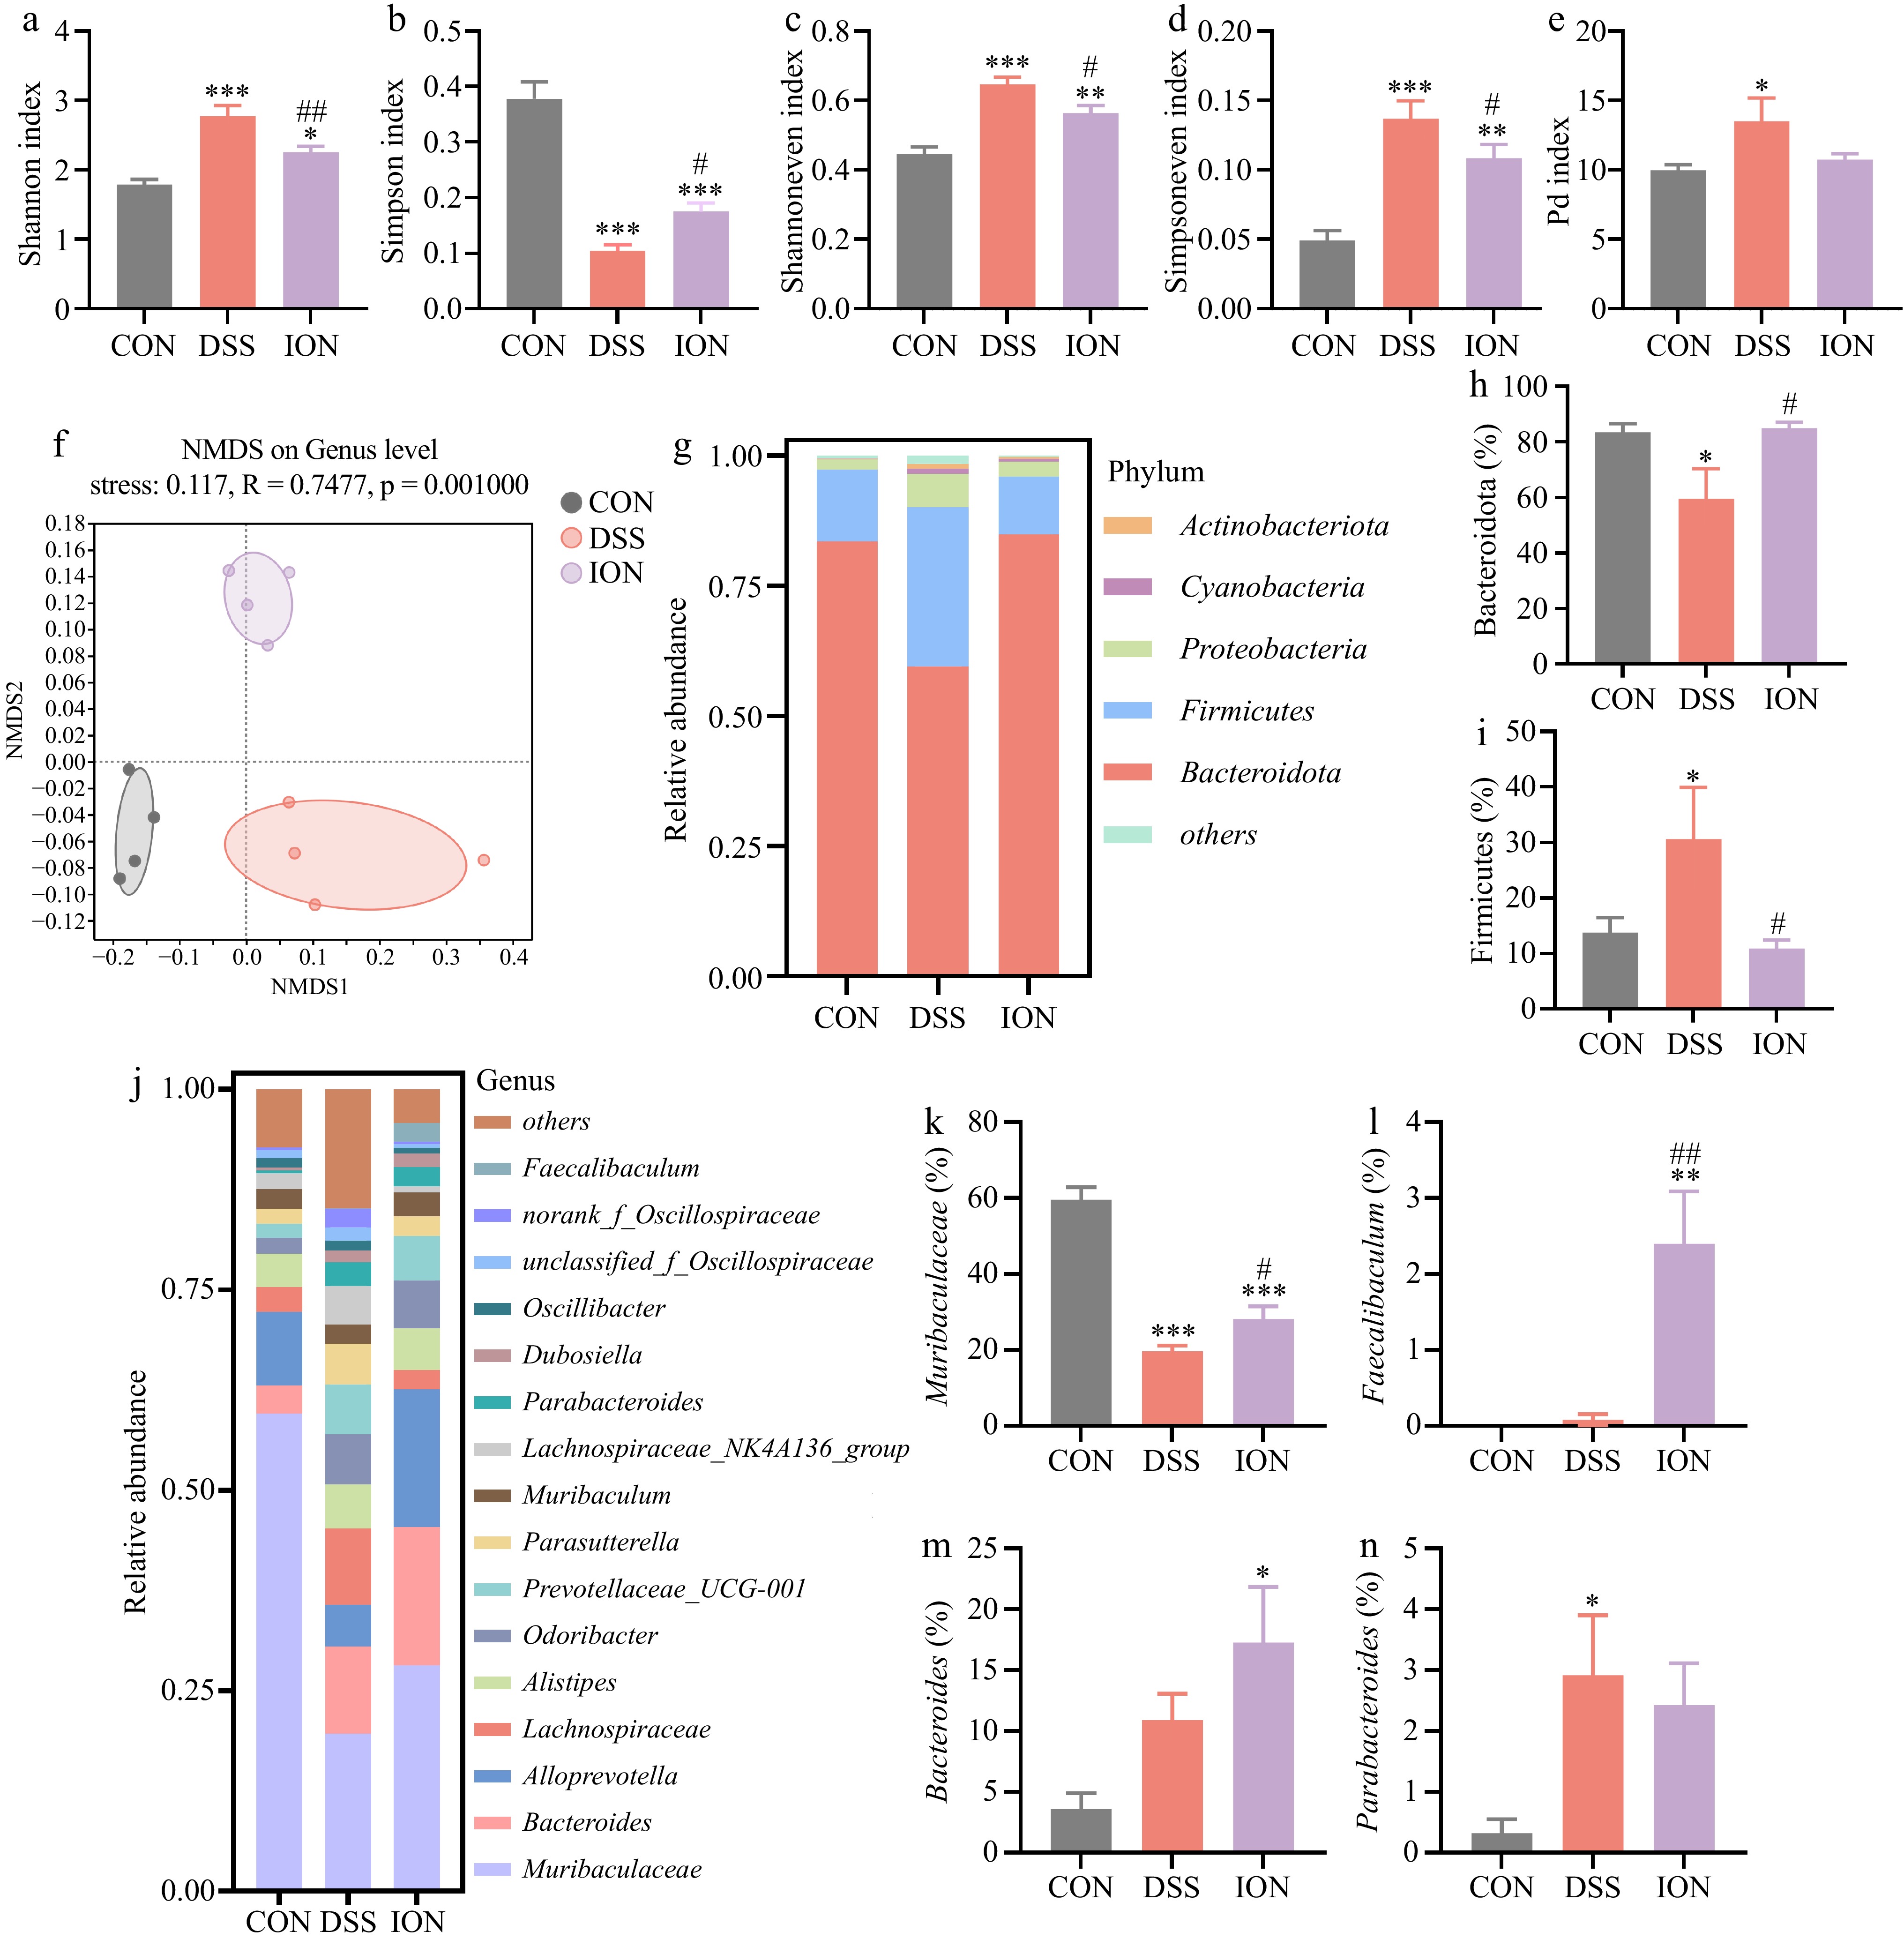
Figure 4.
ION affects the structure and relative abundance of gut microbiota in DSS-induced UC mice. (a) The level of the Shannon index. (b) The level of the Simpson index. (c) The level of the Shannoneven index. (d) The level of the Simpsoneven index. (e) The level of the Pd index. (f) The NMDS analysis on ASV level. (g) The relative abundance at the phylum level. (h) The relative abundance of Bacteroidota. (i) The relative abundance of Firmicutes. (j) The relative abundance at the genus level. (k) The relative abundance of Muribaculaceae. (l) The relative abundance of Faecalibaculum. (m) The relative abundance of Bacteroides. (n) The relative abundance of Parabacteroides. Data are shown as mean ± SEM (n = 4). Statistical significance was determined by using one-way ANOVA followed by the Tukey test. * p < 0.05 vs CON, ** p < 0.01 vs CON, *** p < 0.001 vs CON, # p < 0.05 vs DSS, ## p < 0.01 vs DSS.
-
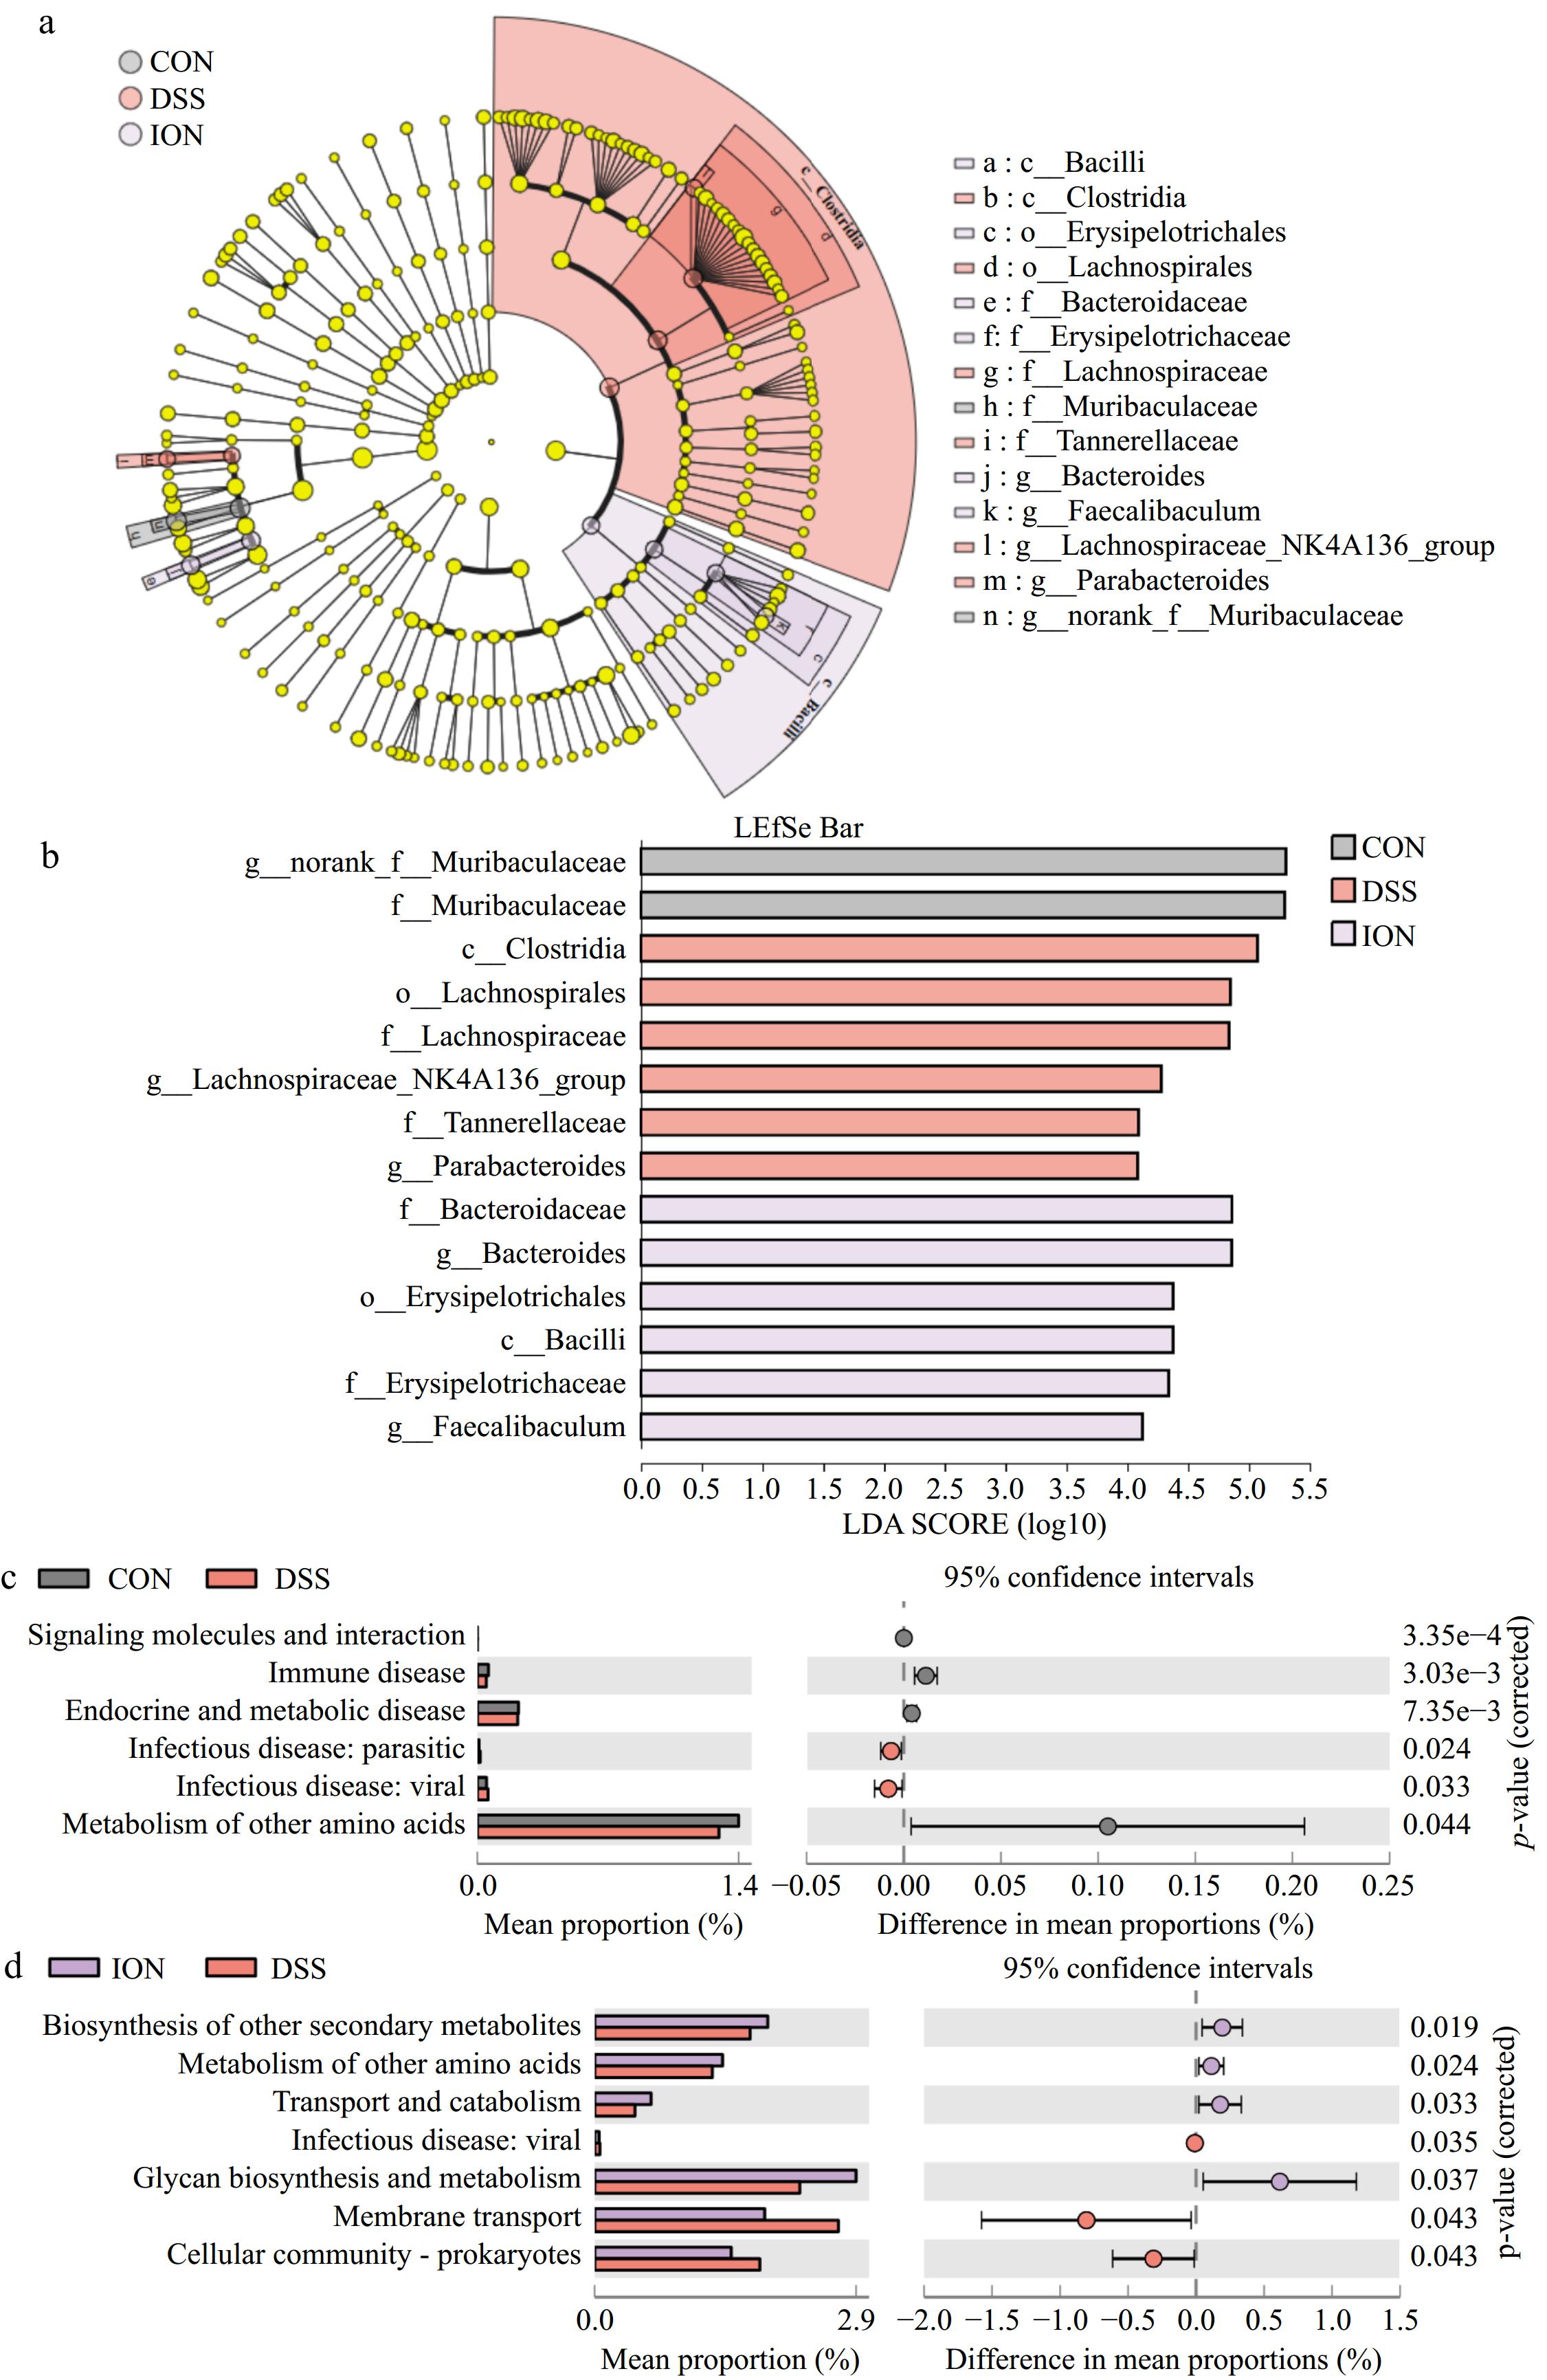
Figure 5.
ION supplementation changes the key phylotypes and function of the gut microbiota of UC mice. (a) LEfSe analysis (the rings, from inner to outer: phylum, class, order, family, and genus). (b) Gut microbiota between CON, DSS, and ION groups with LDA score > 4 and p < 0.05. (c) Comparison of KEGG pathways in the CON and DSS groups. (d) Comparison of KEGG pathways in the ION and DSS groups. Statistical differences (p < 0.05) were analyzed by using the unpaired two-tailed t-test in STAMP (n = 4).
-
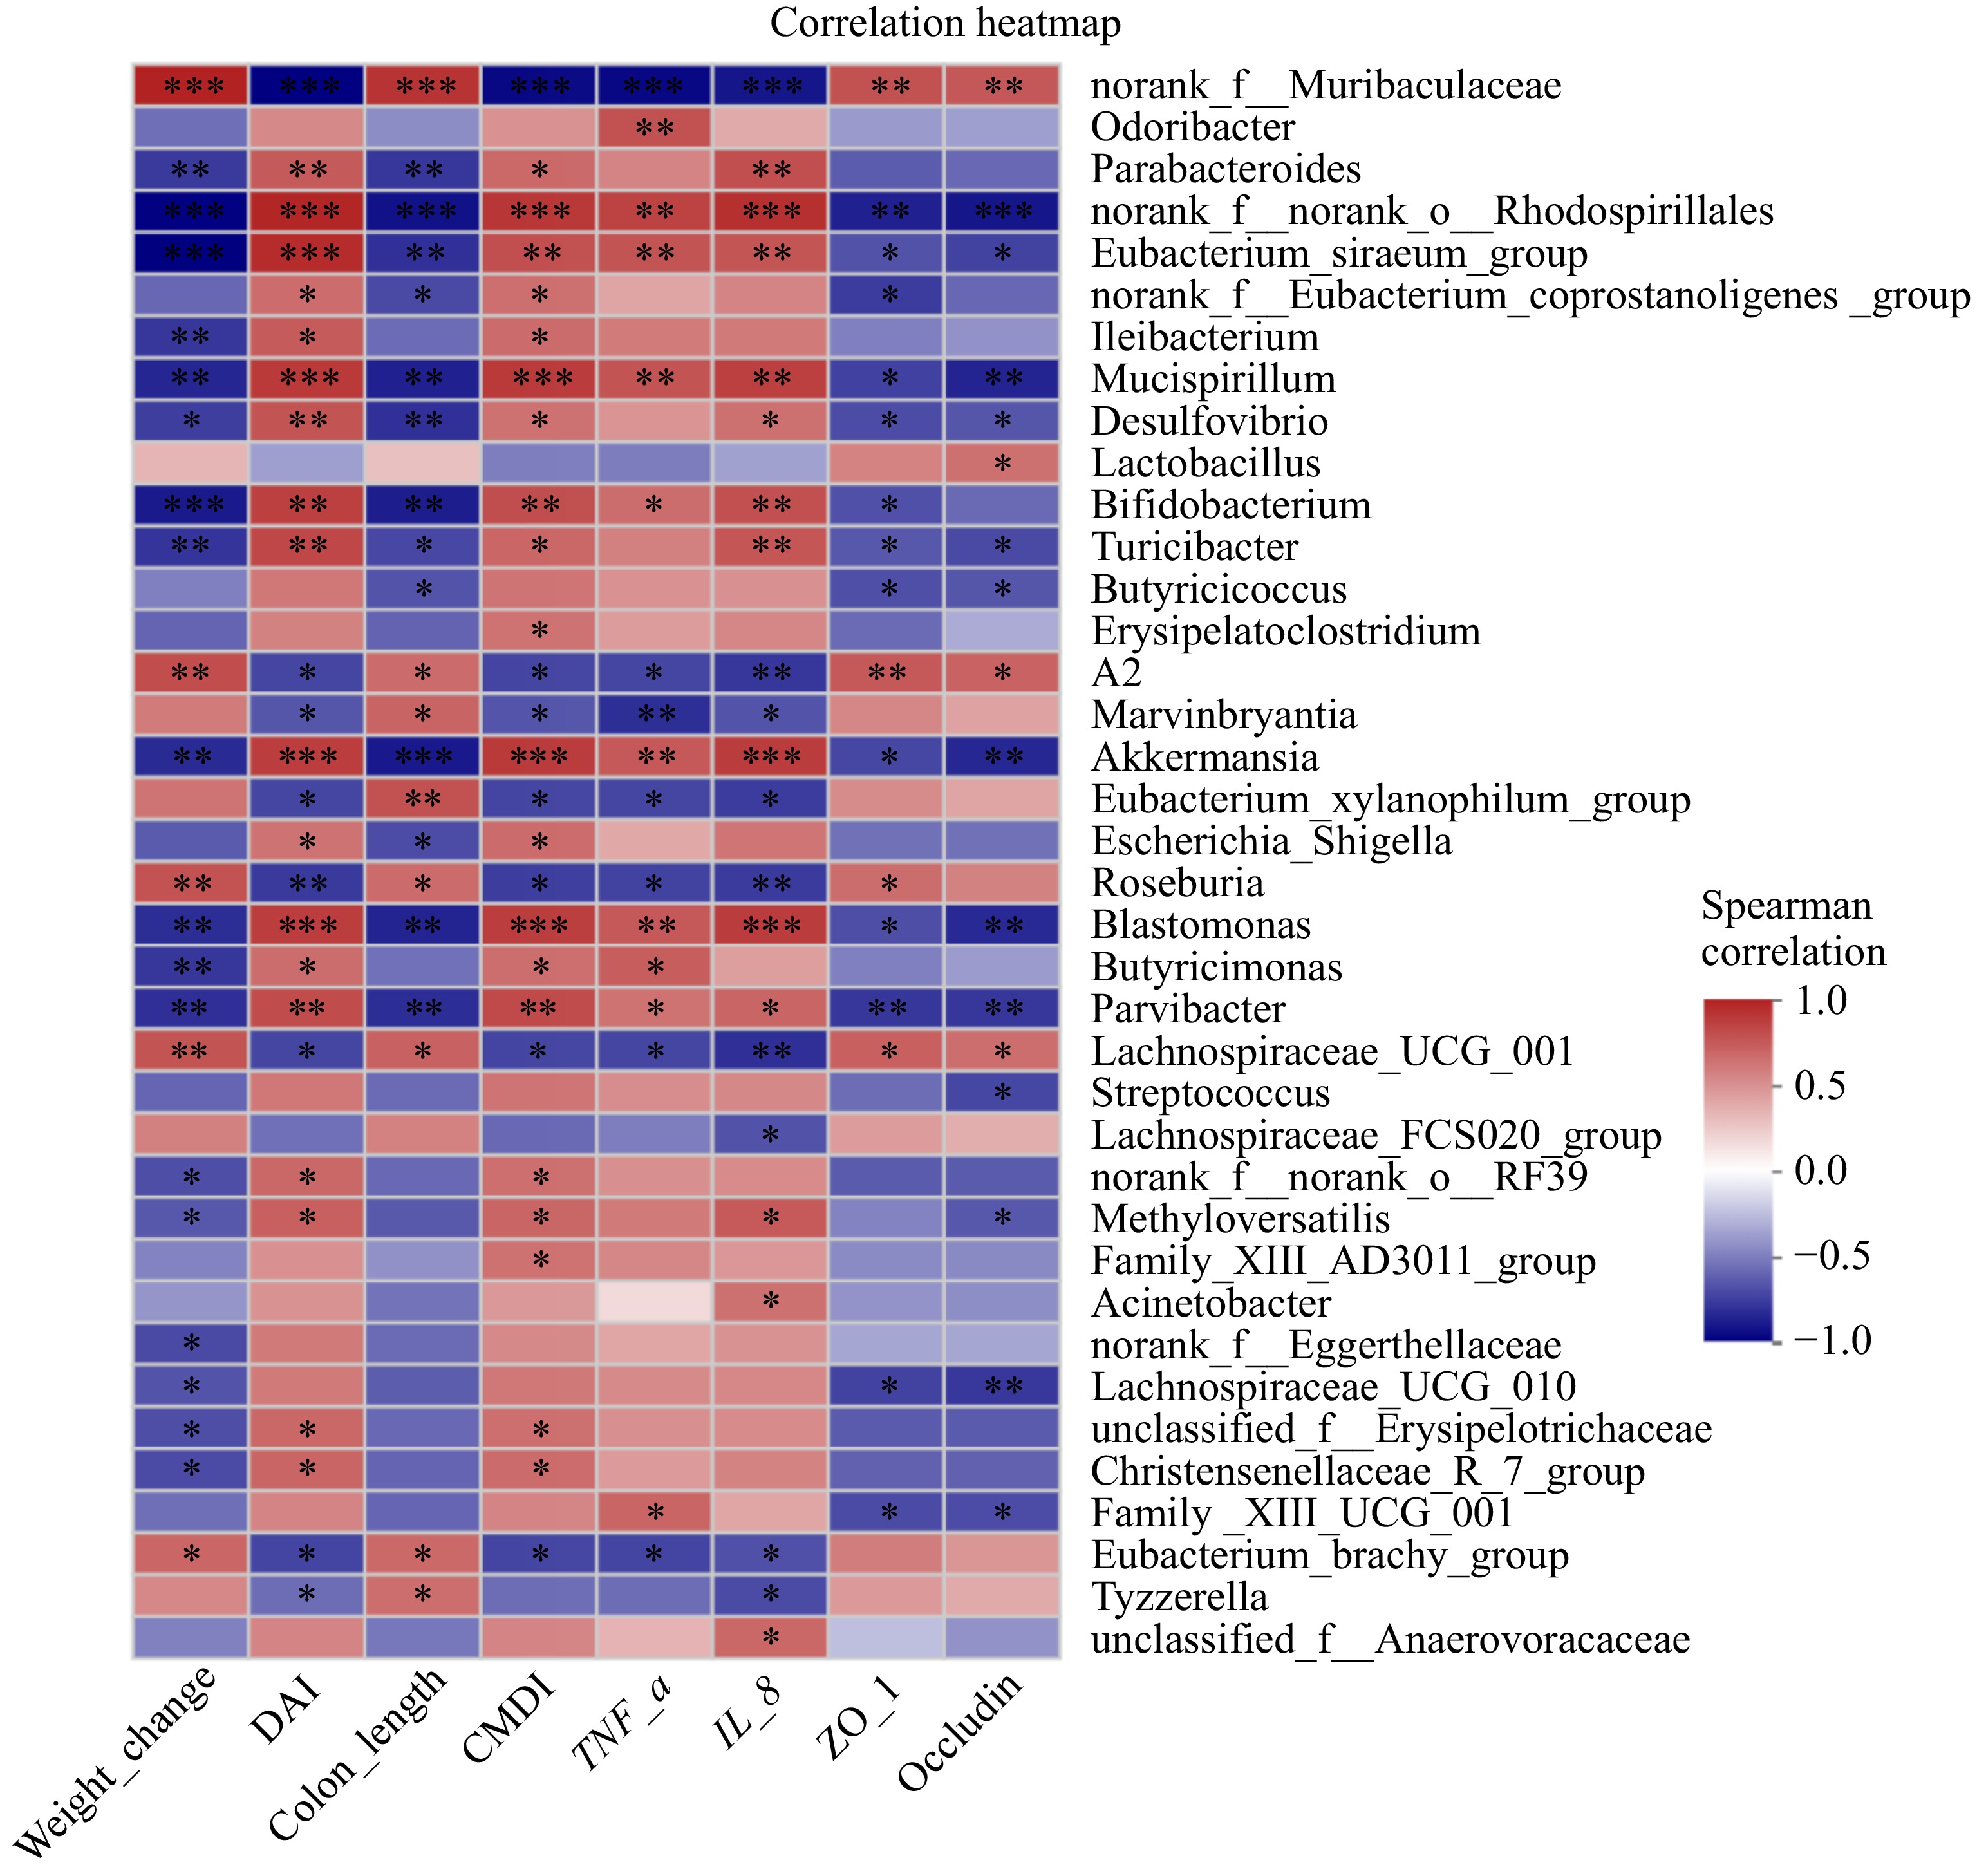
Figure 6.
Correlation analysis of gut microbiota at the genus level and UC-related indicators. Spearman correlation, showing only the genera having significant correlations with UC-related indicators using two filters: |correlation coefficient| > 0.6 and p < 0.05 (n = 4). Scale (right legend) indicates the level of positive (red) or negative (blue) correlation. The significant differences between groups are expressed as: * p < 0.05; ** p < 0.01; *** p < 0.001.
-
Gene Forward primer 5'-3' Reverse primer 5'-3' GAPDH TGTGTCCGTCGTGGATCTGA CCTGCTTCACCACCTCTTGAT TNF-α CAGGCGGTGCCTATGTCTC CGATCACCCCGAAGTTCAGTAG IL-8 ATGACTTCCAAGCTGGCCGTGGCT TCTCAGCCCTCTTCAAAAACTTCTC Table 1.
RT-qPCR experiment primer information comparison table.
-
Tissue Serum (μM) Colonic contents (mM/kg) ION levels 1.65 ± 0.70 5.71 ± 1.95 Table 2.
Content of ION in serum and colonic contents of mice.
-
Levels Species name W-value Significance
(detected_0.7)CON vs DSS Phylum Deferribacterota 11 Insignificant Eubacterium_
siraeum_group113 Significant Genus Marvinbryantia 102 Significant Mucispirillum 86 Insignificant ION vs DSS Phylum Deferribacterota 11 Insignificant Verrucomicrobiota 10 Insignificant Genus Faecalibaculum 117 Significant Mucispirillum 85 Insignificant Table 3.
ANCOM analysis among the CON, DSS, and ION groups.
Figures
(6)
Tables
(3)