-

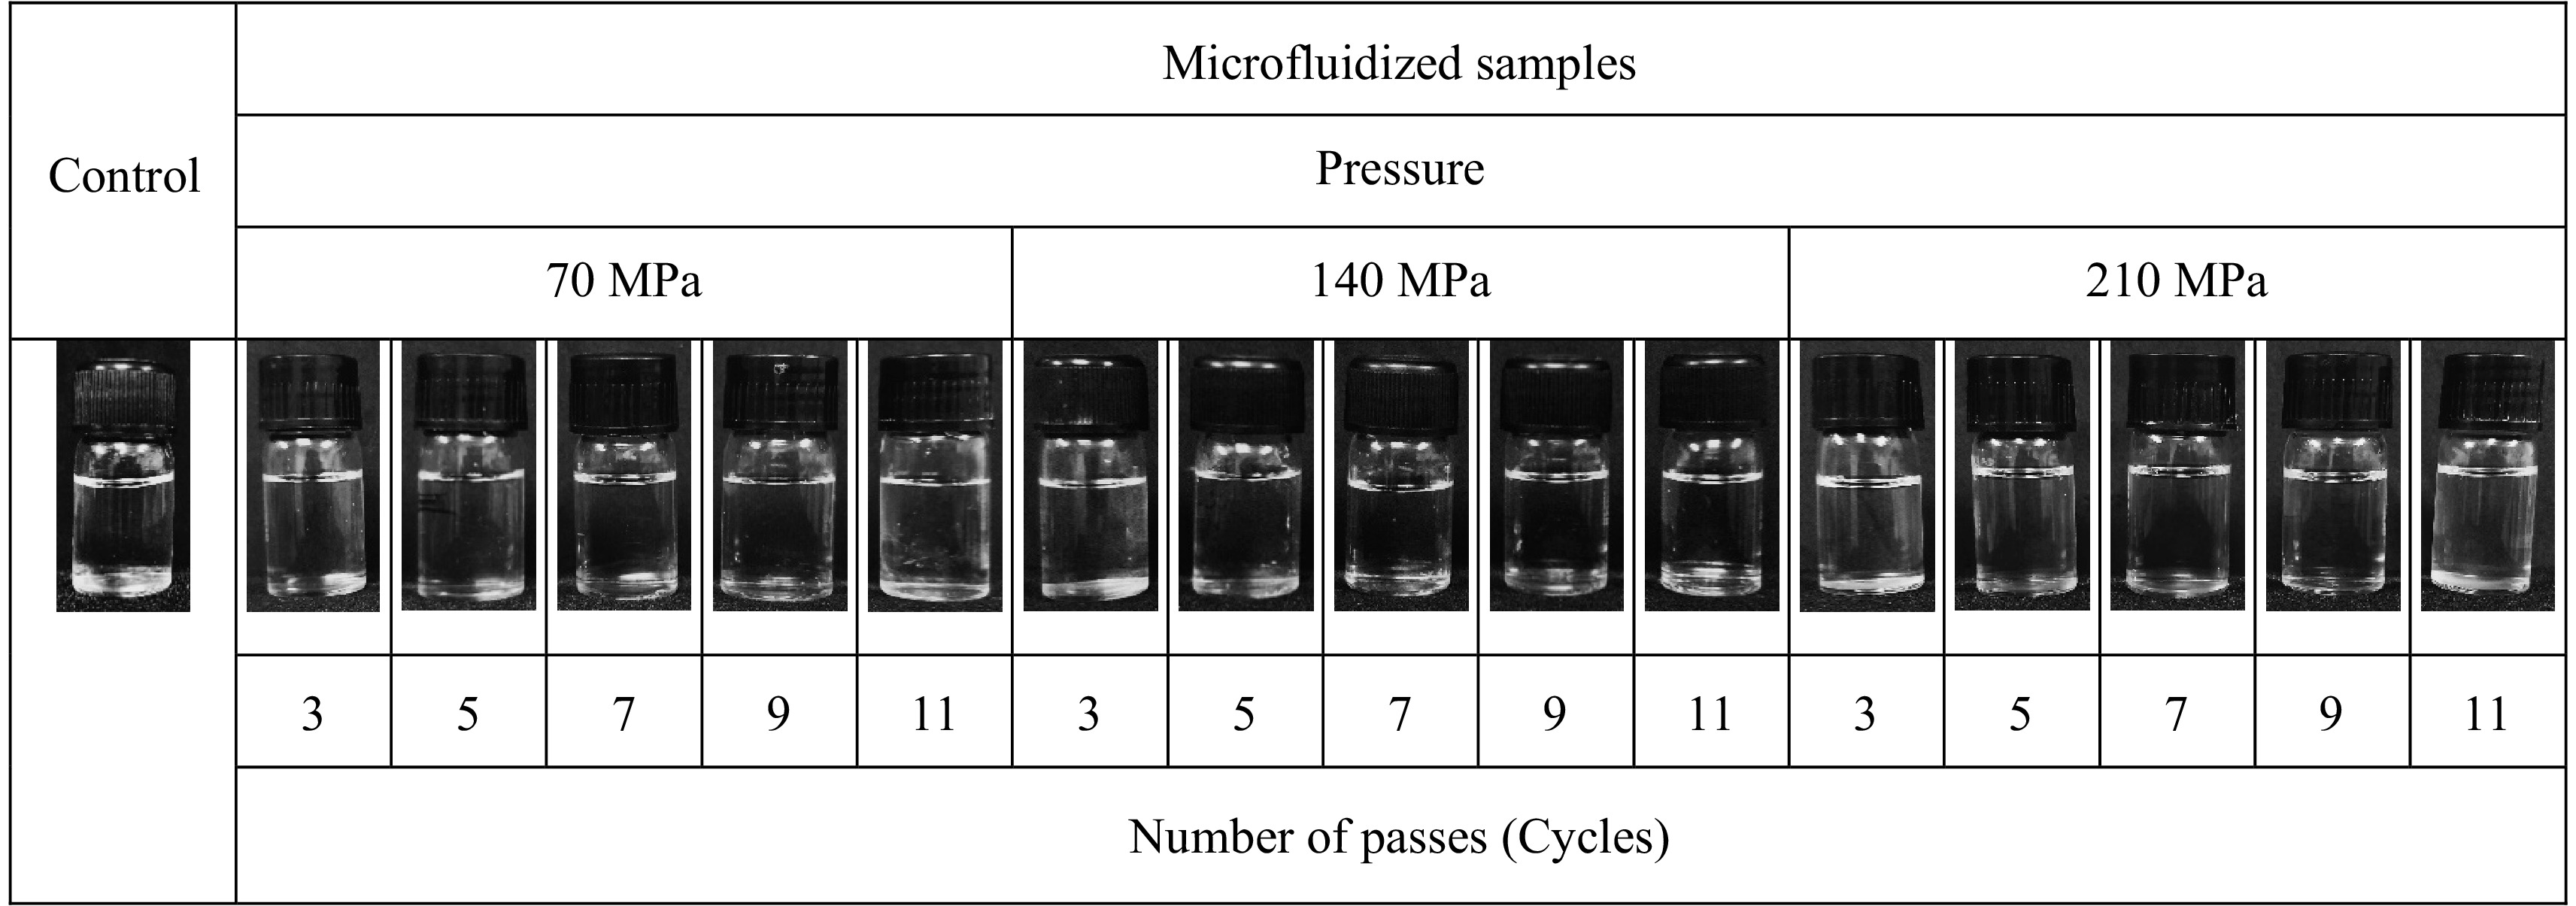
Figure 1.
Images of control (without microfluidization treatment) and microfludized TCW samples, showing insignificant visual changes.
-

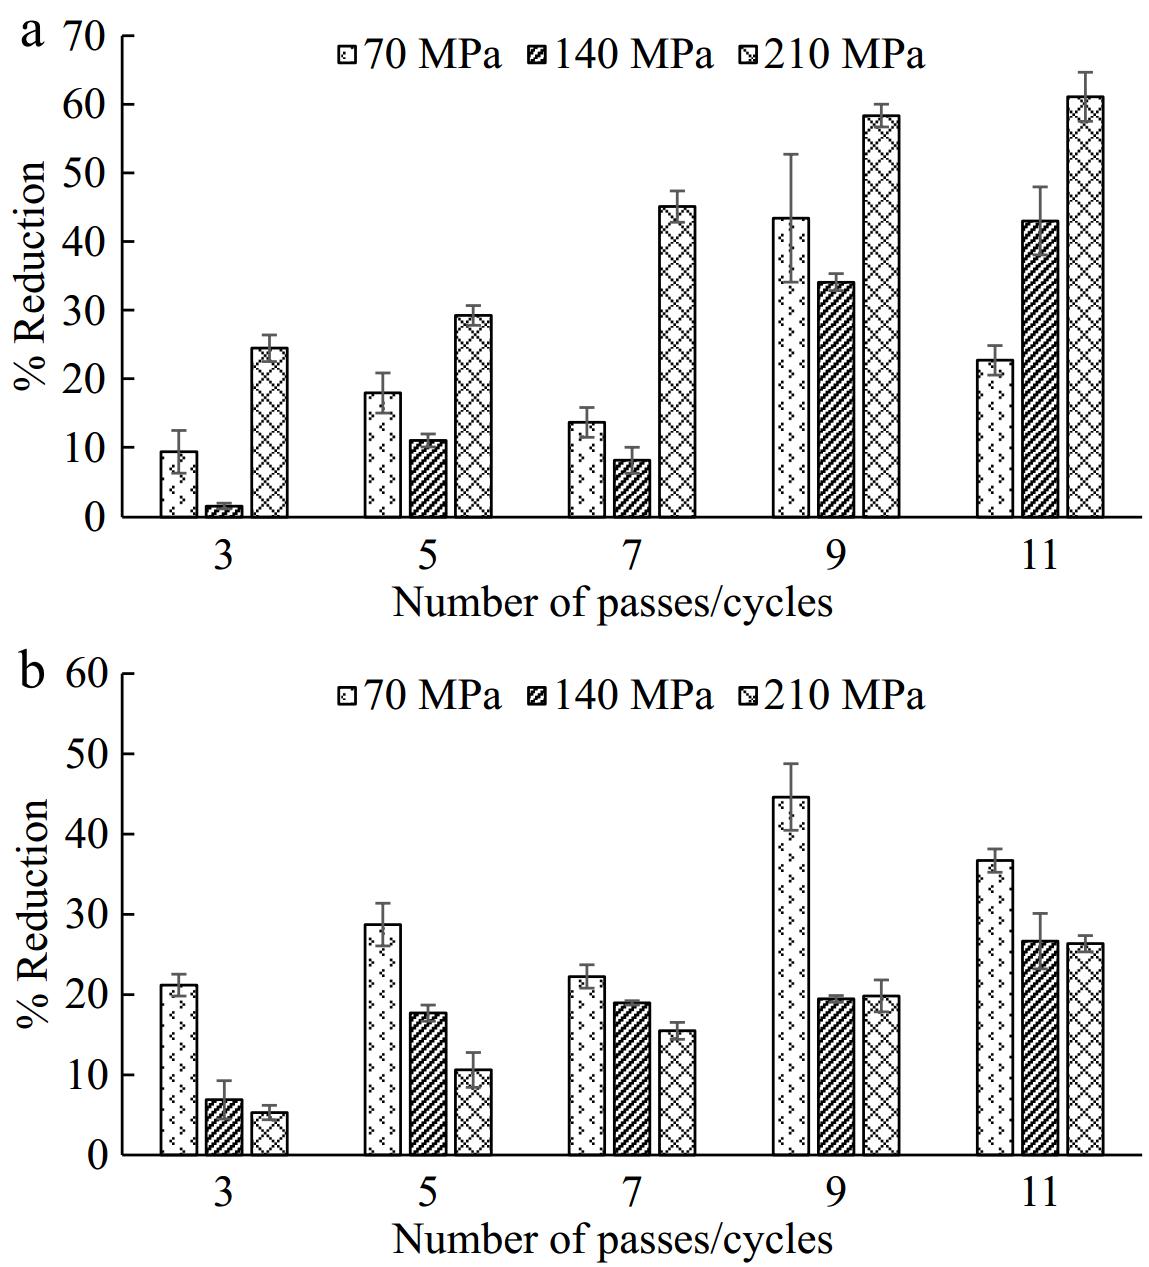
Figure 2.
Influence of microfluidization on (a) PPO, and (b) POD activity in TCW samples.
-

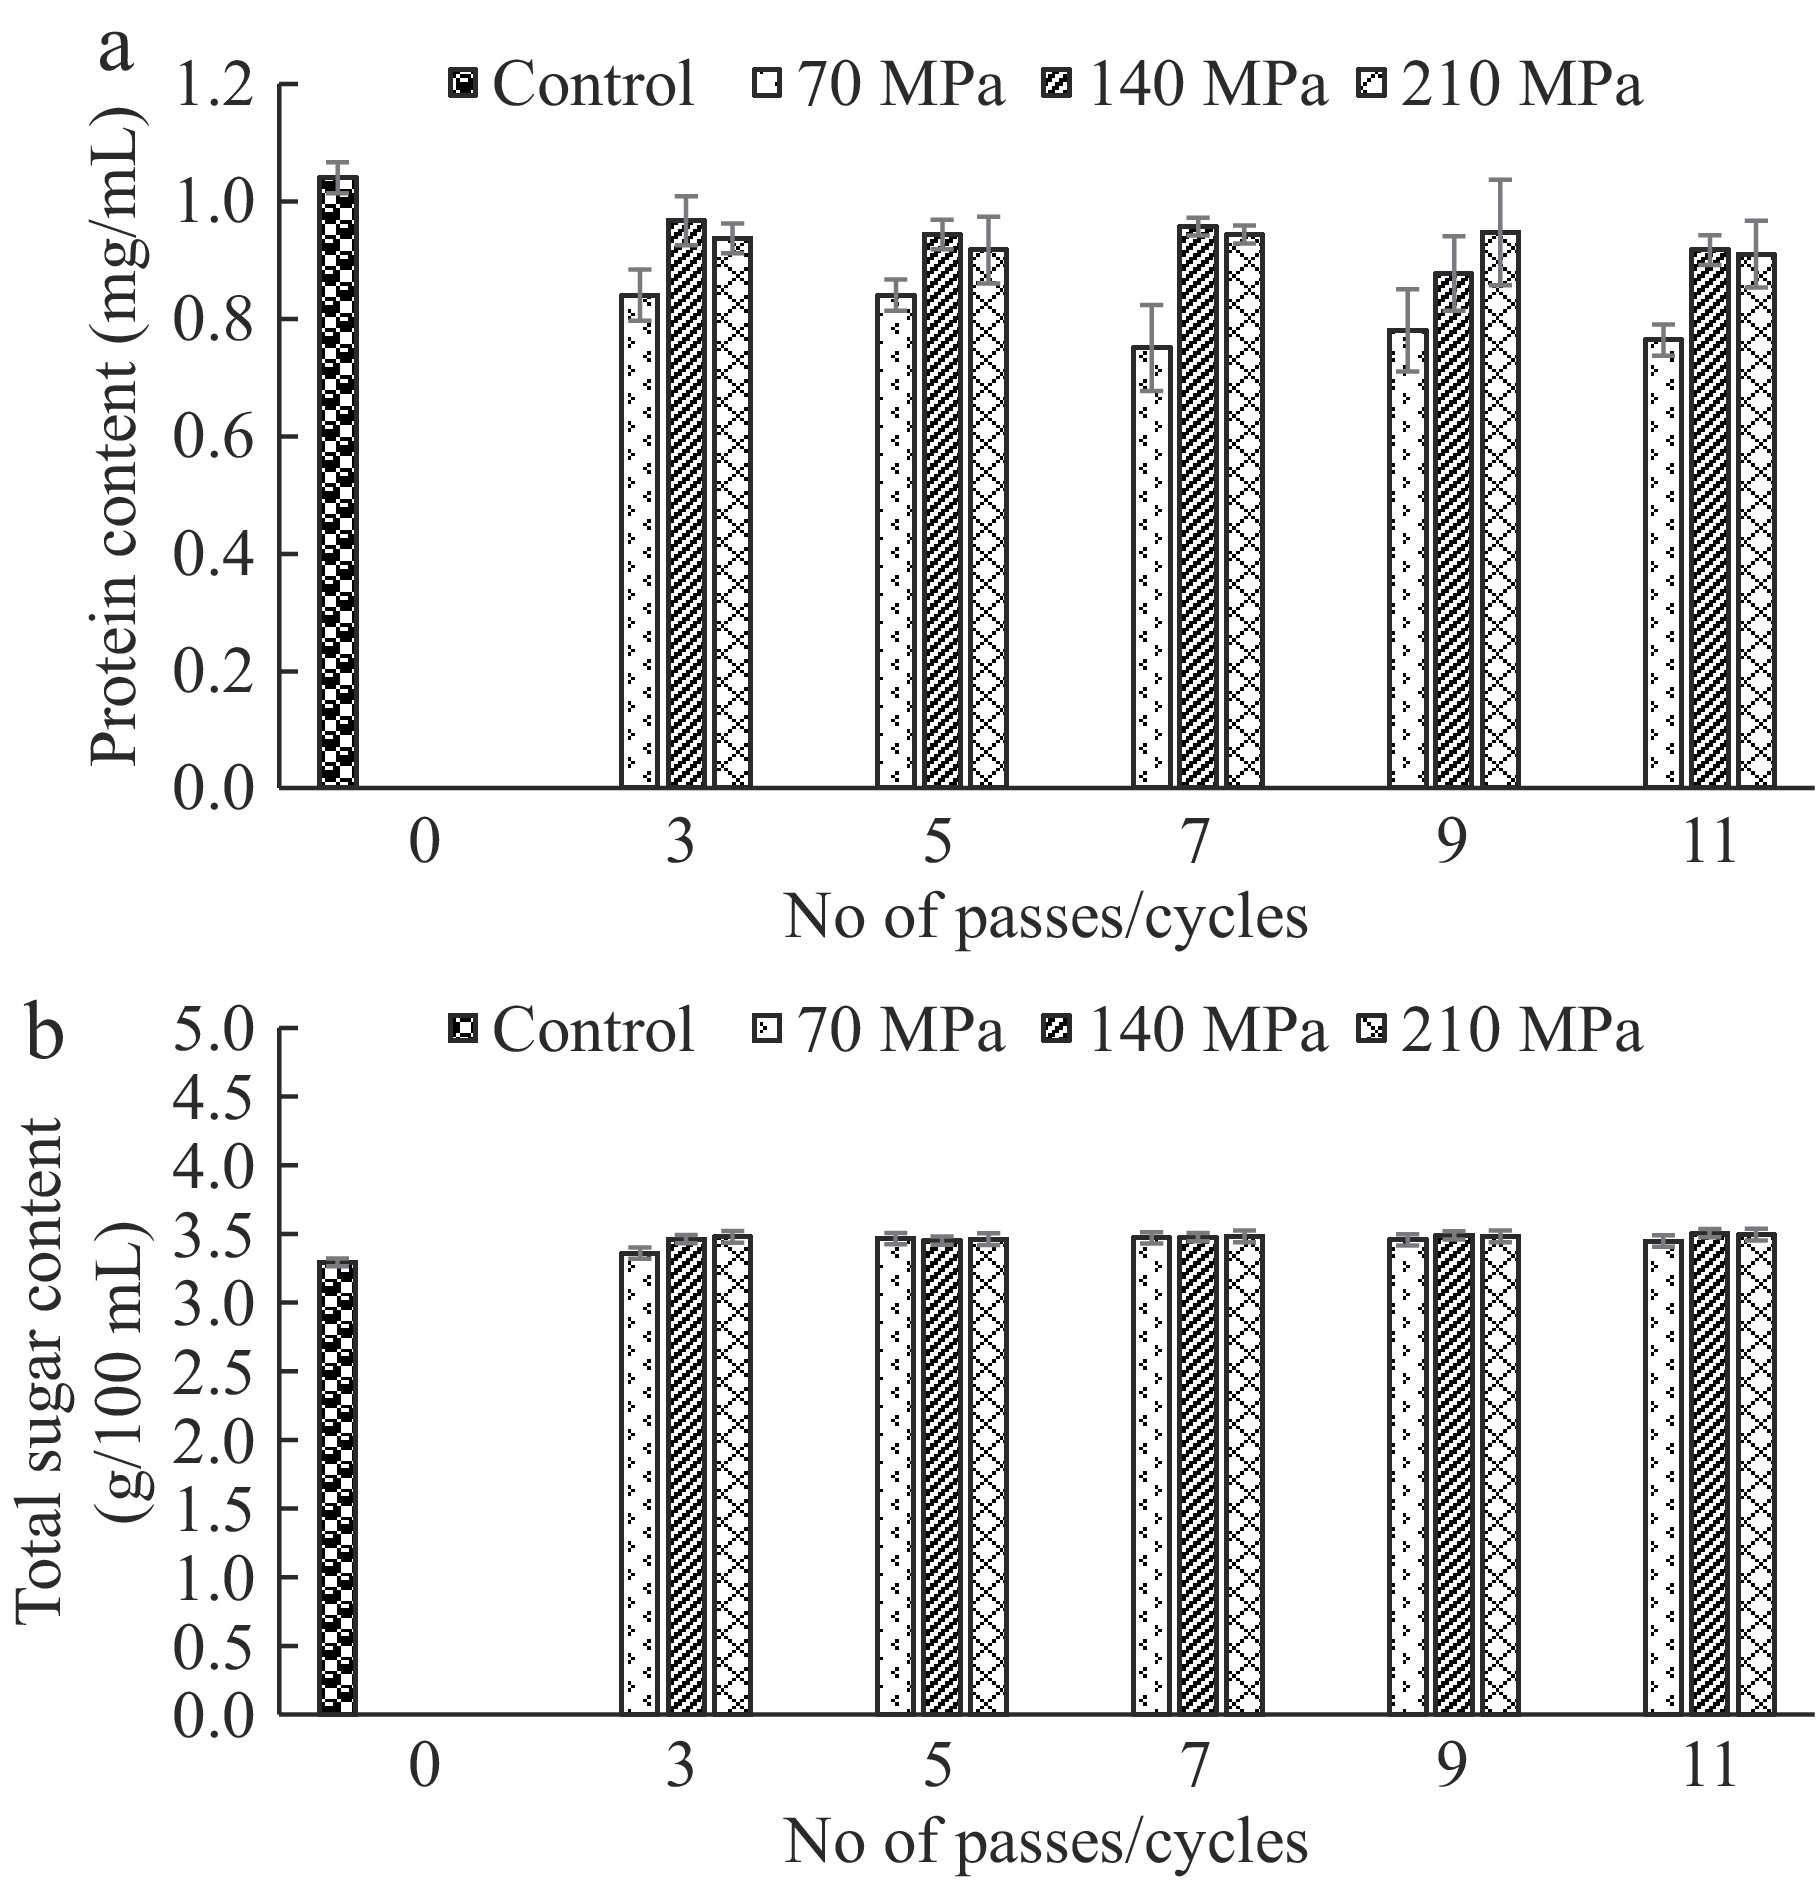
Figure 3.
(a) Protein content, and (b) total sugar content of control and microfluidized TCW samples.
-

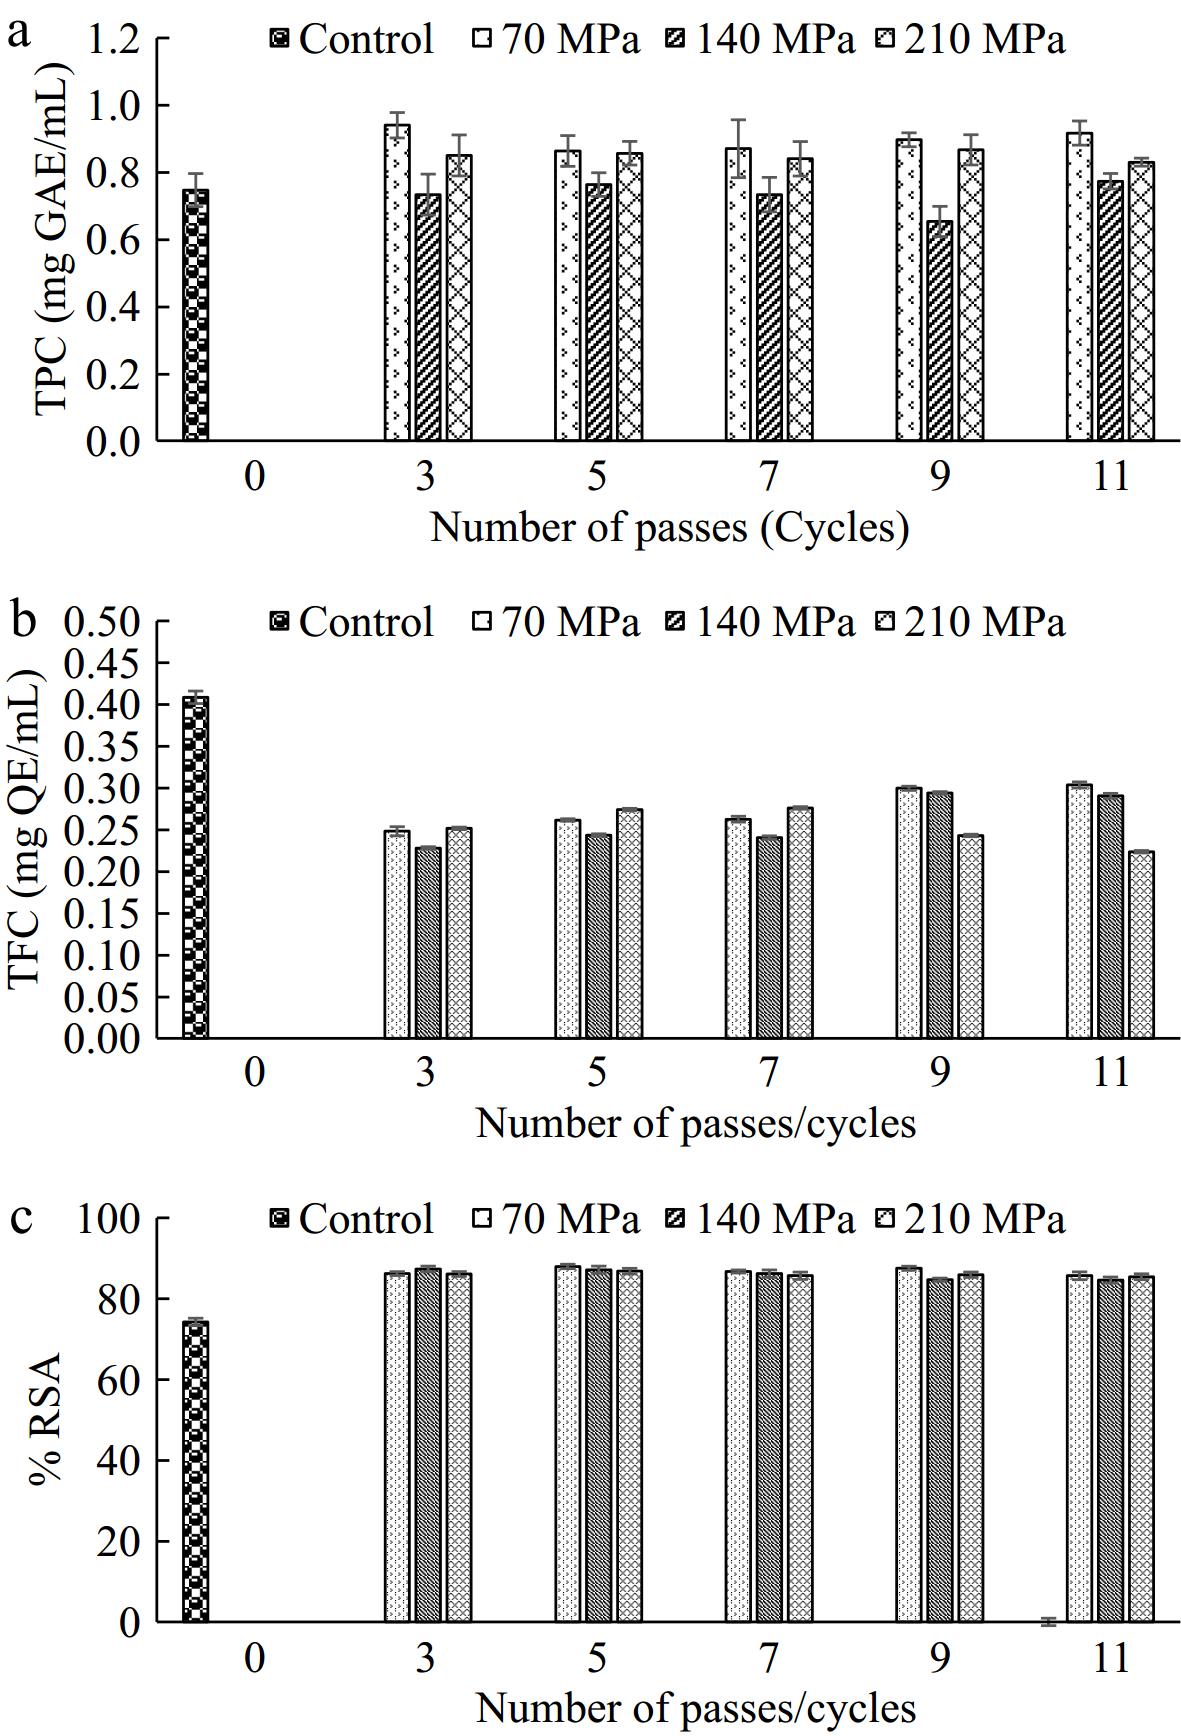
Figure 4.
(a) Total phenolic content (TPC), (b) total flavonoid content (TFC), and (c) % radical scavenging activity (RSA) of control and microfluidized TCW samples.
-
Model Pressure
(MPa)PPO POD k (pass−1) R2 k (pass−1) R2 Zero order 70 3.0079 ± 0.2043 0.48 4.0982 ± 0.2052 0.65 140 3.1576 ± 0.2266 0.89 2.4915 ± 0.1483 0.84 210 6.085 ± 0.1999 0.96 2.2642 ± 0.1068 0.99 First order 70 0.0352 ± 0.0026 0.49 0.0518 ± 0.0034 0.64 140 0.0359 ± 0.0028 0.88 0.0294 ± 0.0014 0.85 210 0.0866 ± 0.0037 0.96 0.0252 ± 0.0013 0.99 Table 1.
PPO and POD inactivation kinetic parameters and coefficient of determination (R2) of zero-order and first-order models at different microfluidization pressures.
-
Sample Color (ΔE) L* a* b* Turbidity (%) TSS (°Brix) pH TA (%) Control/untreated TCW NA 5.770 ± 0.670Aa −0.320 ± 0.05Aa −1.970 ± 0.060Aa 2.59 ± 0.14Aa 5.20 ± 0.00Aa 5.50 ± 0.01Aa 0.06 ± 0.00Aa Pressure (MPa) No. of passes/cycles 70 3 0.26 ± 0.025Aa 6.035 ± 0.007Bb −0.335 ± 0.106Ab −1.745 ± 0.035Ba 3.22 ± 0.28Ba 5.05 ± 0.40Aa 5.50 ± 0.01Ab 0.06 ± 0.004Aa 5 0.34 ± 0.017Ac 6.465 ± 0.035Bb −0.335 ± 0.035Ac −2.210 ± 0.041Bb 3.54 ± 0.20Bb 5.00 ± 0.04Aa 5.51 ± 0.01Ab 0.05 ± 0.006Aa 7 0.55 ± 0.004Ab 6.390 ± 0.028Bc −0.330 ± 0.014Abc −2.165 ± 0.035Bcf 5.31 ± 0.25Bc 5.01 ± 0.23Aa 5.49 ± 0.01Aab 0.05 ± 0.001Aa 9 0.61 ± 0.011Ab 6.565 ± 0.021Bd −0.375 ± 0.007Ac −2.180 ± 0.042Bdf 6.19 ± 0.03Bd 5.00 ± 0.32Aa 5.50 ± 0.00Aab 0.04 ± 0.001Aa 11 0.72 ± 0.032Ad 7.480 ± 0.042Be −0.385 ± 0.007Abc −2.230 ± 0.057Be 6.24 ± 0.06Be 5.00 ± 0.39Aa 5.47 ± 0.02Aa 0.05 ± 0.001Aa 140 3 0.92 ± 0.033Ba 5.660 ± 0.014Ab −0.335 ± 0.106Bb −1.610 ± 0.077Ca 3.77 ± 0.11Ca 5.03 ± 0.04Aa 5.55 ± 0.06Ab 0.05 ± 0.004Aca 5 1.46 ± 0.044Bc 6.110 ± 0.007Ab −0.500 ± 0.035Bc −1.740 ± 0.007Cb 4.93 ± 0.08Cb 5.01 ± 0.01Aa 5.51 ± 0.00Ab 0.05 ± 0.003Aca 7 1.55 ± 0.019Bb 6.740 ± 0.021Ac −0.430 ± 0.007Bbc −1.680 ± 0.014Ccf 5.02 ± 0.06Cc 5.01 ± 0.01Aa 5.48 ± 0.01Aab 0.05 ± 0.006Aca 9 1.61 ± 0.010Bb 5.900 ± 0.014Ad −0.410 ± 0.021Bc −1.590 ± 0.014Cdf 5.28 ± 0.03Cd 5.00 ± 0.00Aa 5.47 ± 0.03Aab 0.04 ± 0.010Aca 11 2.42 ± 0.015Bd 6.090 ± 0.028Ae −0.320 ± 0.021Bbc −1.800 ± 0.014Ce 7.22 ± 0.08Ce 5.00 ± 0.00Aa 5.45 ± 0.03Aa 0.04 ± 0.013Aca 210 3 1.59 ± 0.221Ba 15.870 ± 0.537Cb −0.490 ± 0.014Cb 0.460 ± 0.014Da 4.23 ± 0.16Da 5.43 ± 0.53Aa 5.52 ± 0.01Bb 0.03 ± 0.030BCa 5 2.43 ± 0.521Bc 15.020 ± 0.255Cb −0.550 ± 0.014Cc −0.400 ± 0.071Db 5.64 ± 0.07Db 5.30 ± 0.42Aa 5.51 ± 0.01Bb 0.03 ± 0.028BCa 7 2.98 ± 0.031Bb 10.460 ± 0.070Cc −0.610 ± 0.007Cbc −0.770 ± 0.028Dcf 6.88 ± 0.15Dc 5.41 ± 0.56Aa 5.48 ± 0.01Bab 0.03 ± 0.028BCa 9 3.16 ± 0.076Bb 9.010 ± 0.007Cd −0.620 ± 0.028Cc −0.960 ± 0.021Ddf 7.41 ± 0.13Dd 5.40 ± 0.57Aa 5.49 ± 0.00Bab 0.02 ± 0.023BCa 11 4.61 ± 0.018Bd 10.680 ± 0.028Ce −0.620 ± 0.021Cbc −0.880 ± 0.014De 8.62 ± 0.39De 5.35 ± 0.49Aa 5.46 ± 0.00Ba 0.02 ± 0.026BCa Uppercase letters (A, B and C) and lowercase letters (a, b, c, d, and e) indicate significant differences between pressure and number of passes/cycles, respectively, at a 5% level of significance (p < 0.05). Table 2.
Effect of microfluidization on physicochemical properties of TCW.
Figures
(4)
Tables
(2)