-

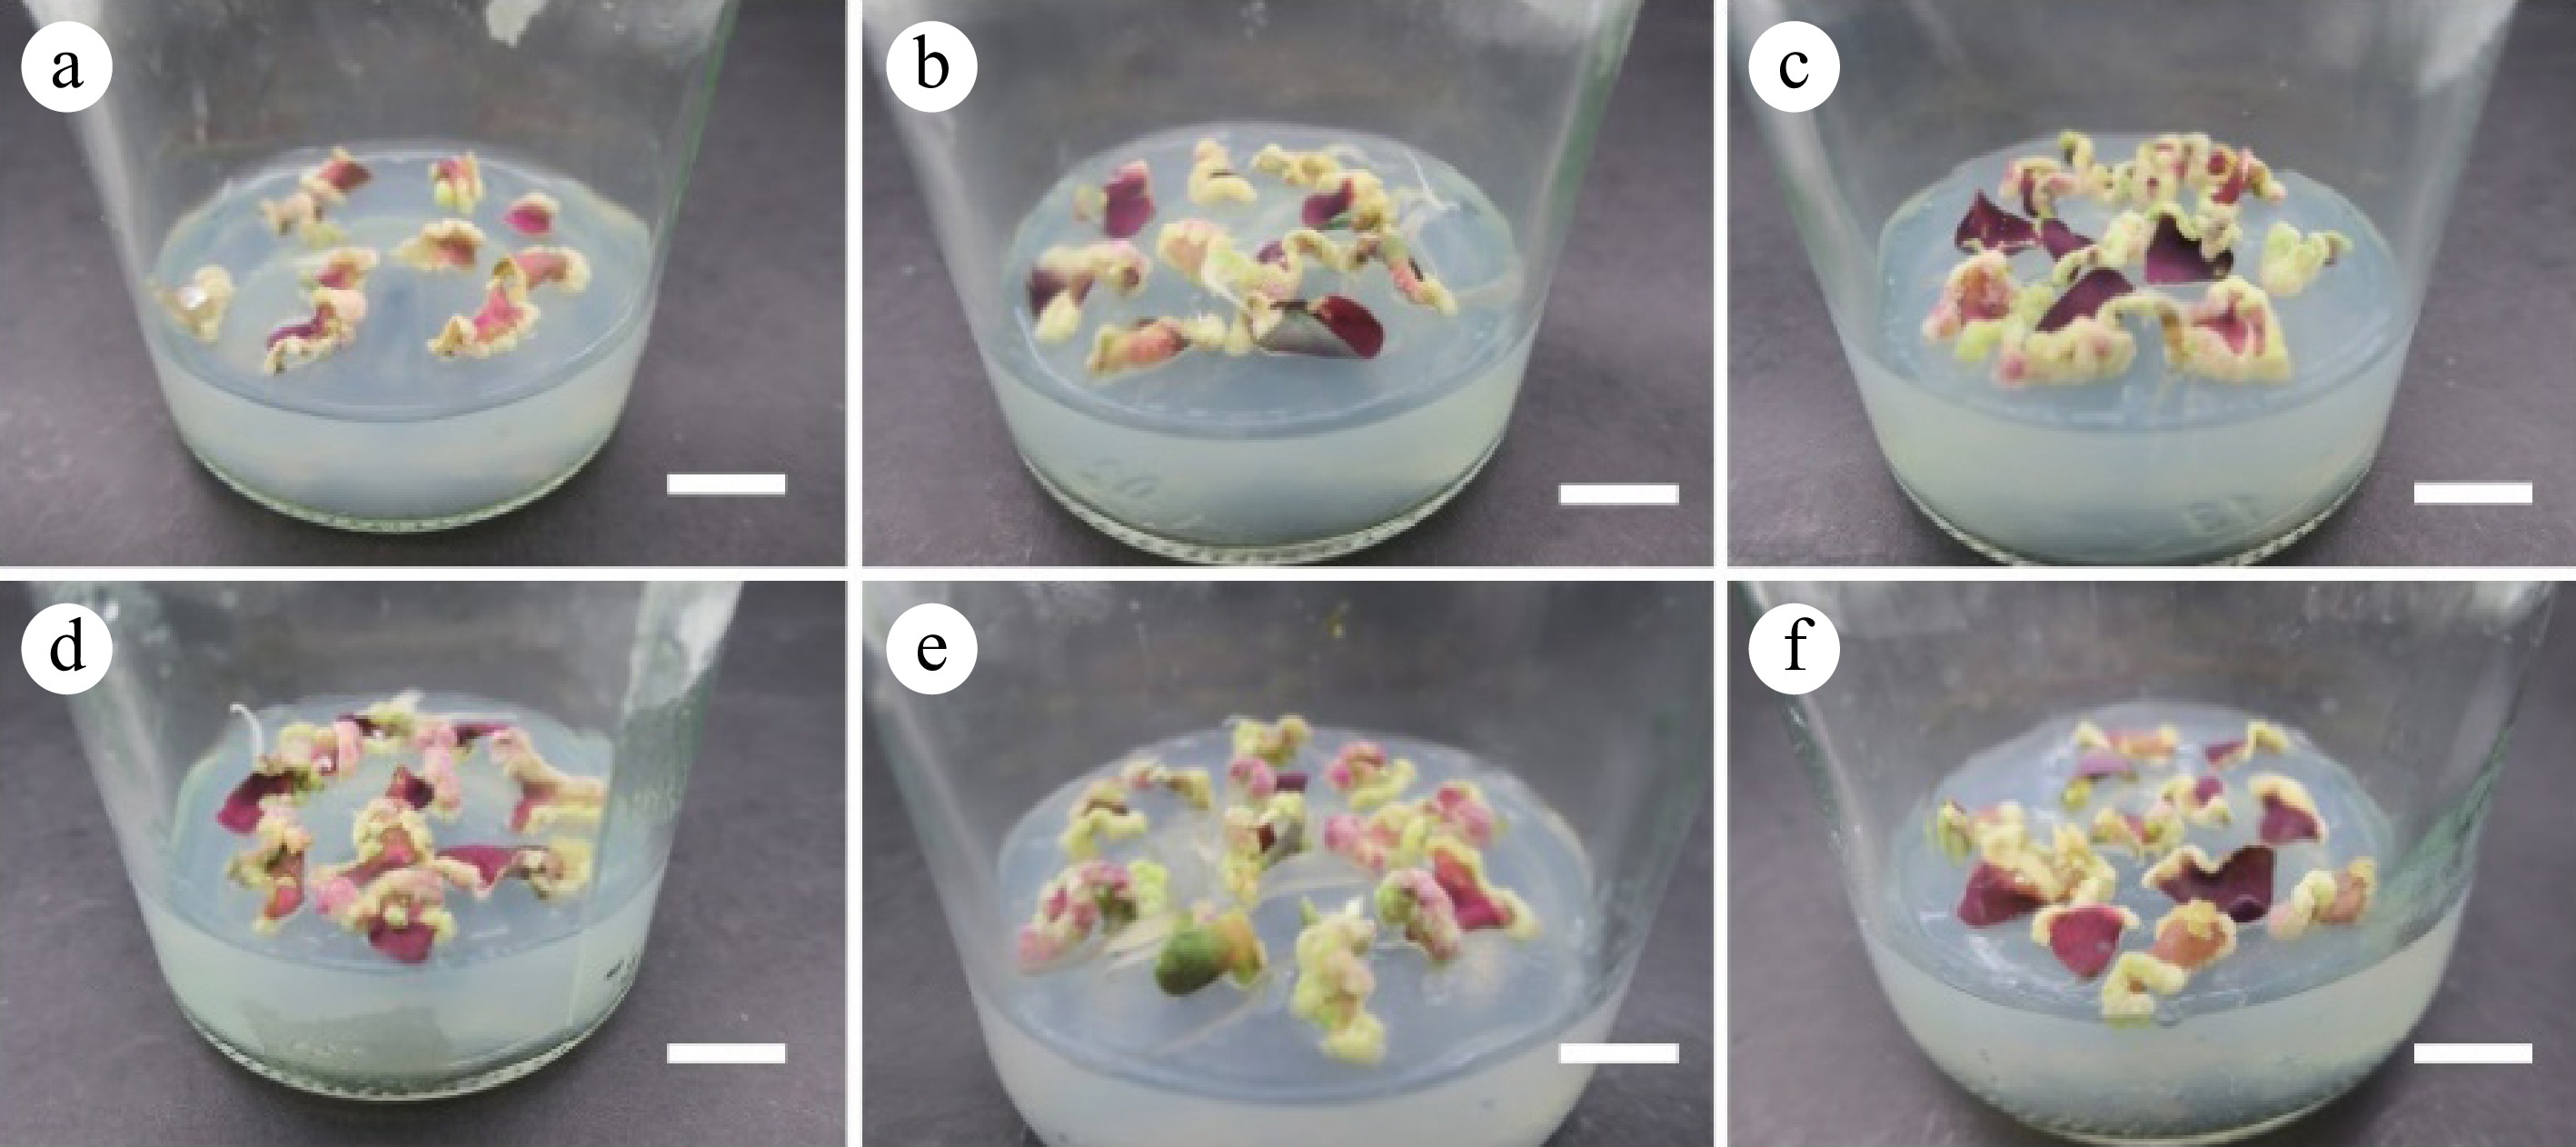
Figure 1.
Callus cultivated from petiole. (a)−(f) Corresponding to the results of petiole induction callus in the T1−T6 group, respectively; (g), (h) Green granular callus. Scale bar = 1 cm.
-

Figure 2.
Calli cultivated from leaves. (a)−(f) Corresponding to the results of leaf induction callus in the T1−T6 group. Scale bar = 1 cm.
-

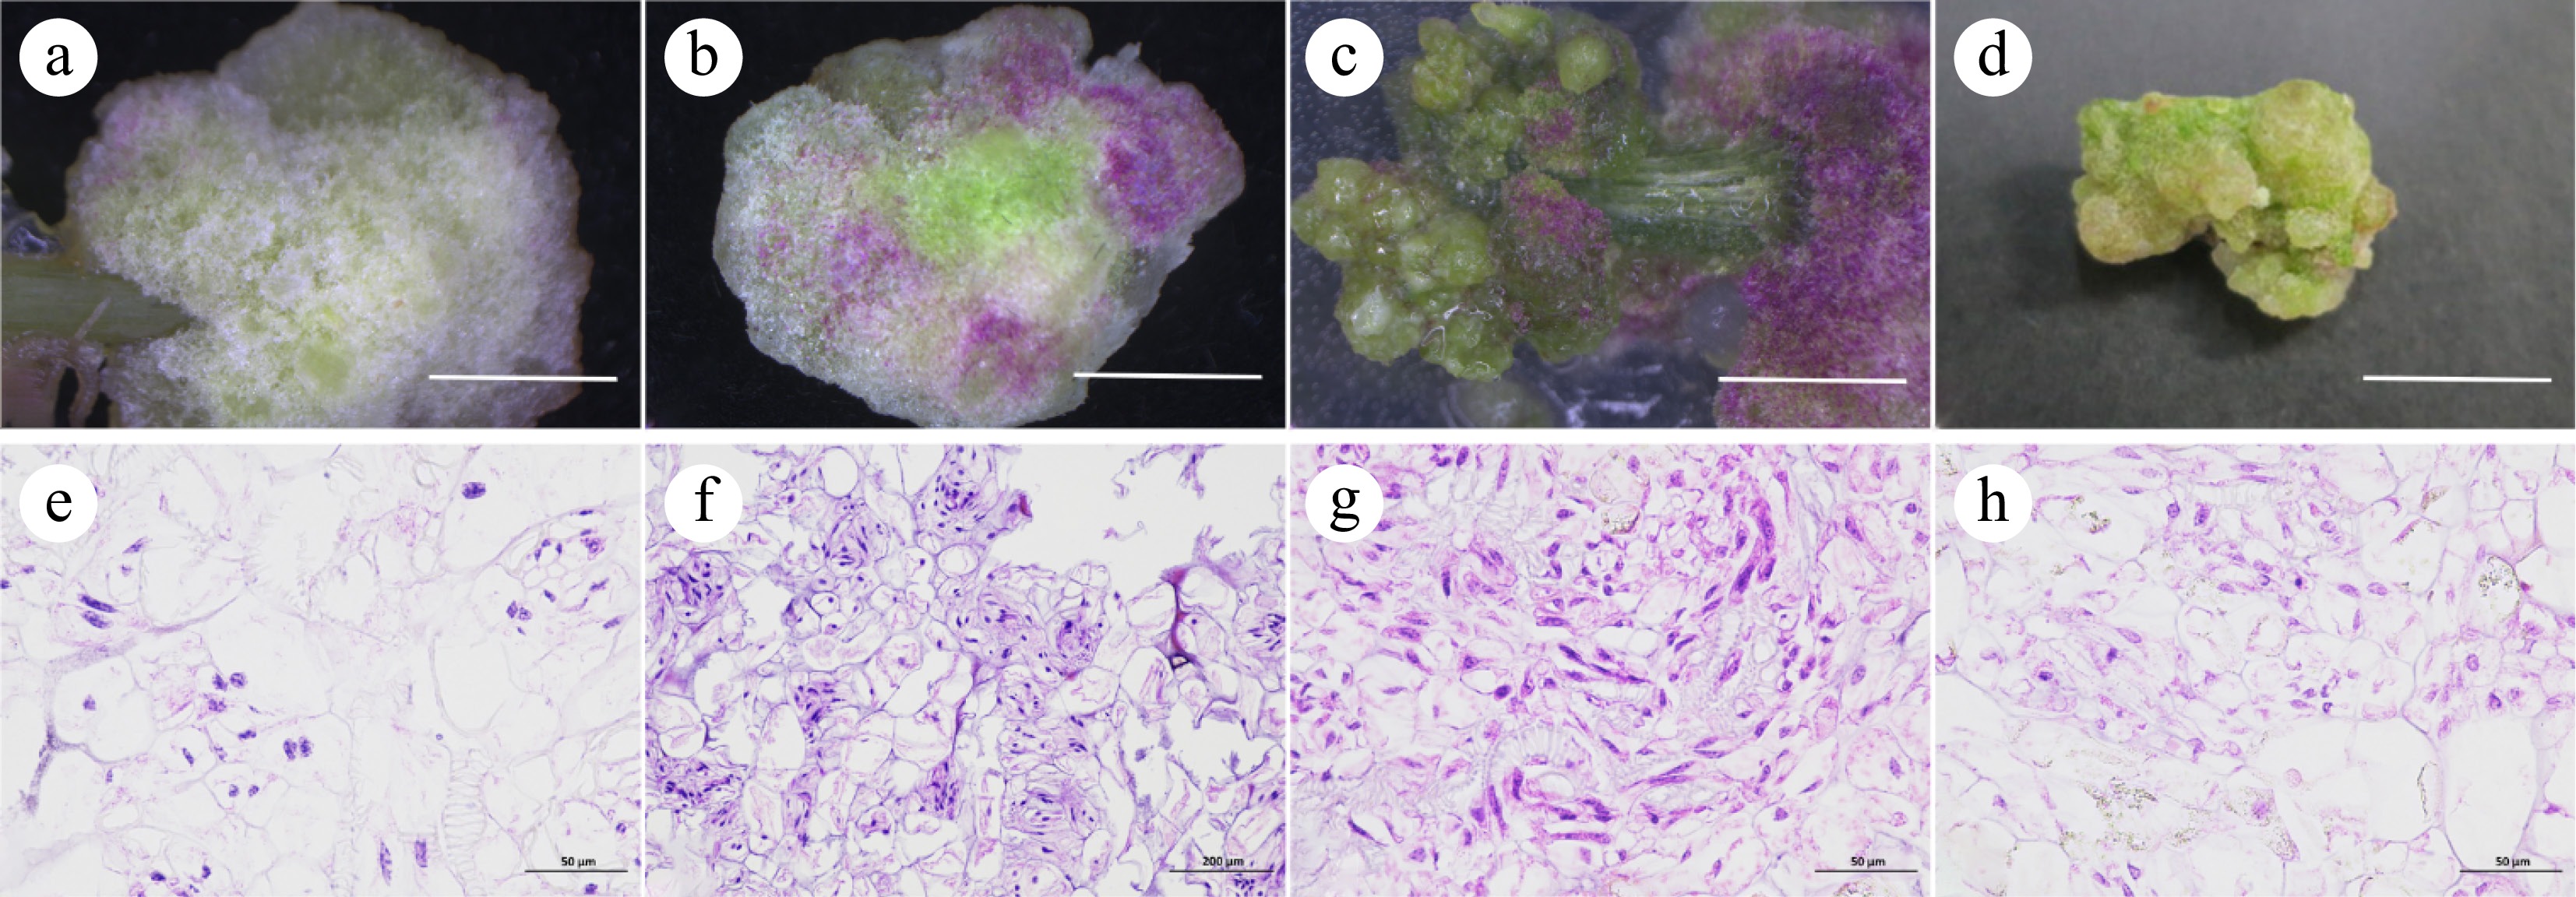
Figure 3.
Induction and histological observation of callus from petioles and leaves. (a), (e) Callus I. (b), (f) Callus II. (c), (g) Callus III. (d), (h) Callus IV, scale bar = 1 cm.
-

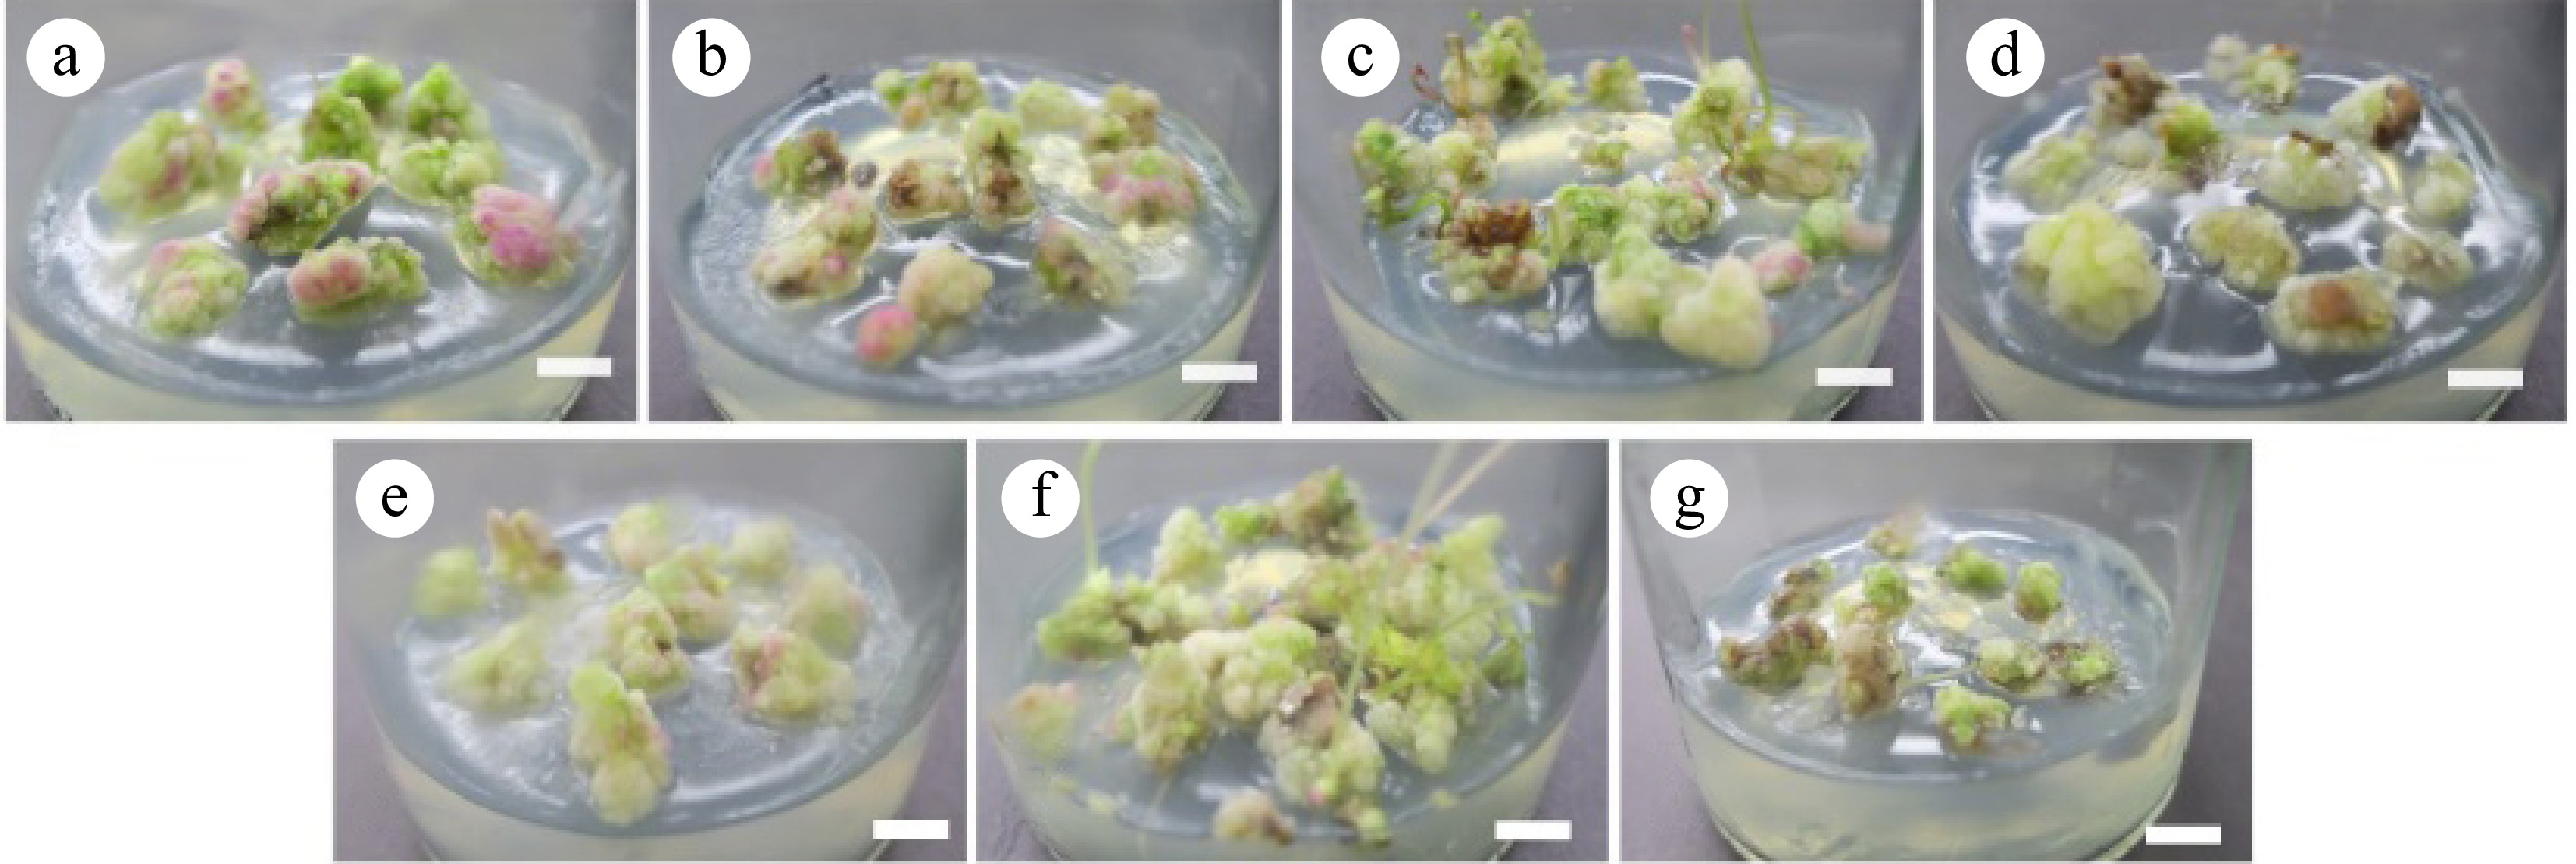
Figure 4.
Callus proliferation effect. (a)−(g) Correspond to the results of callus-induced callus proliferation in D1−D6 and CK groups for 30 d. Scale bar = 1 cm.
-

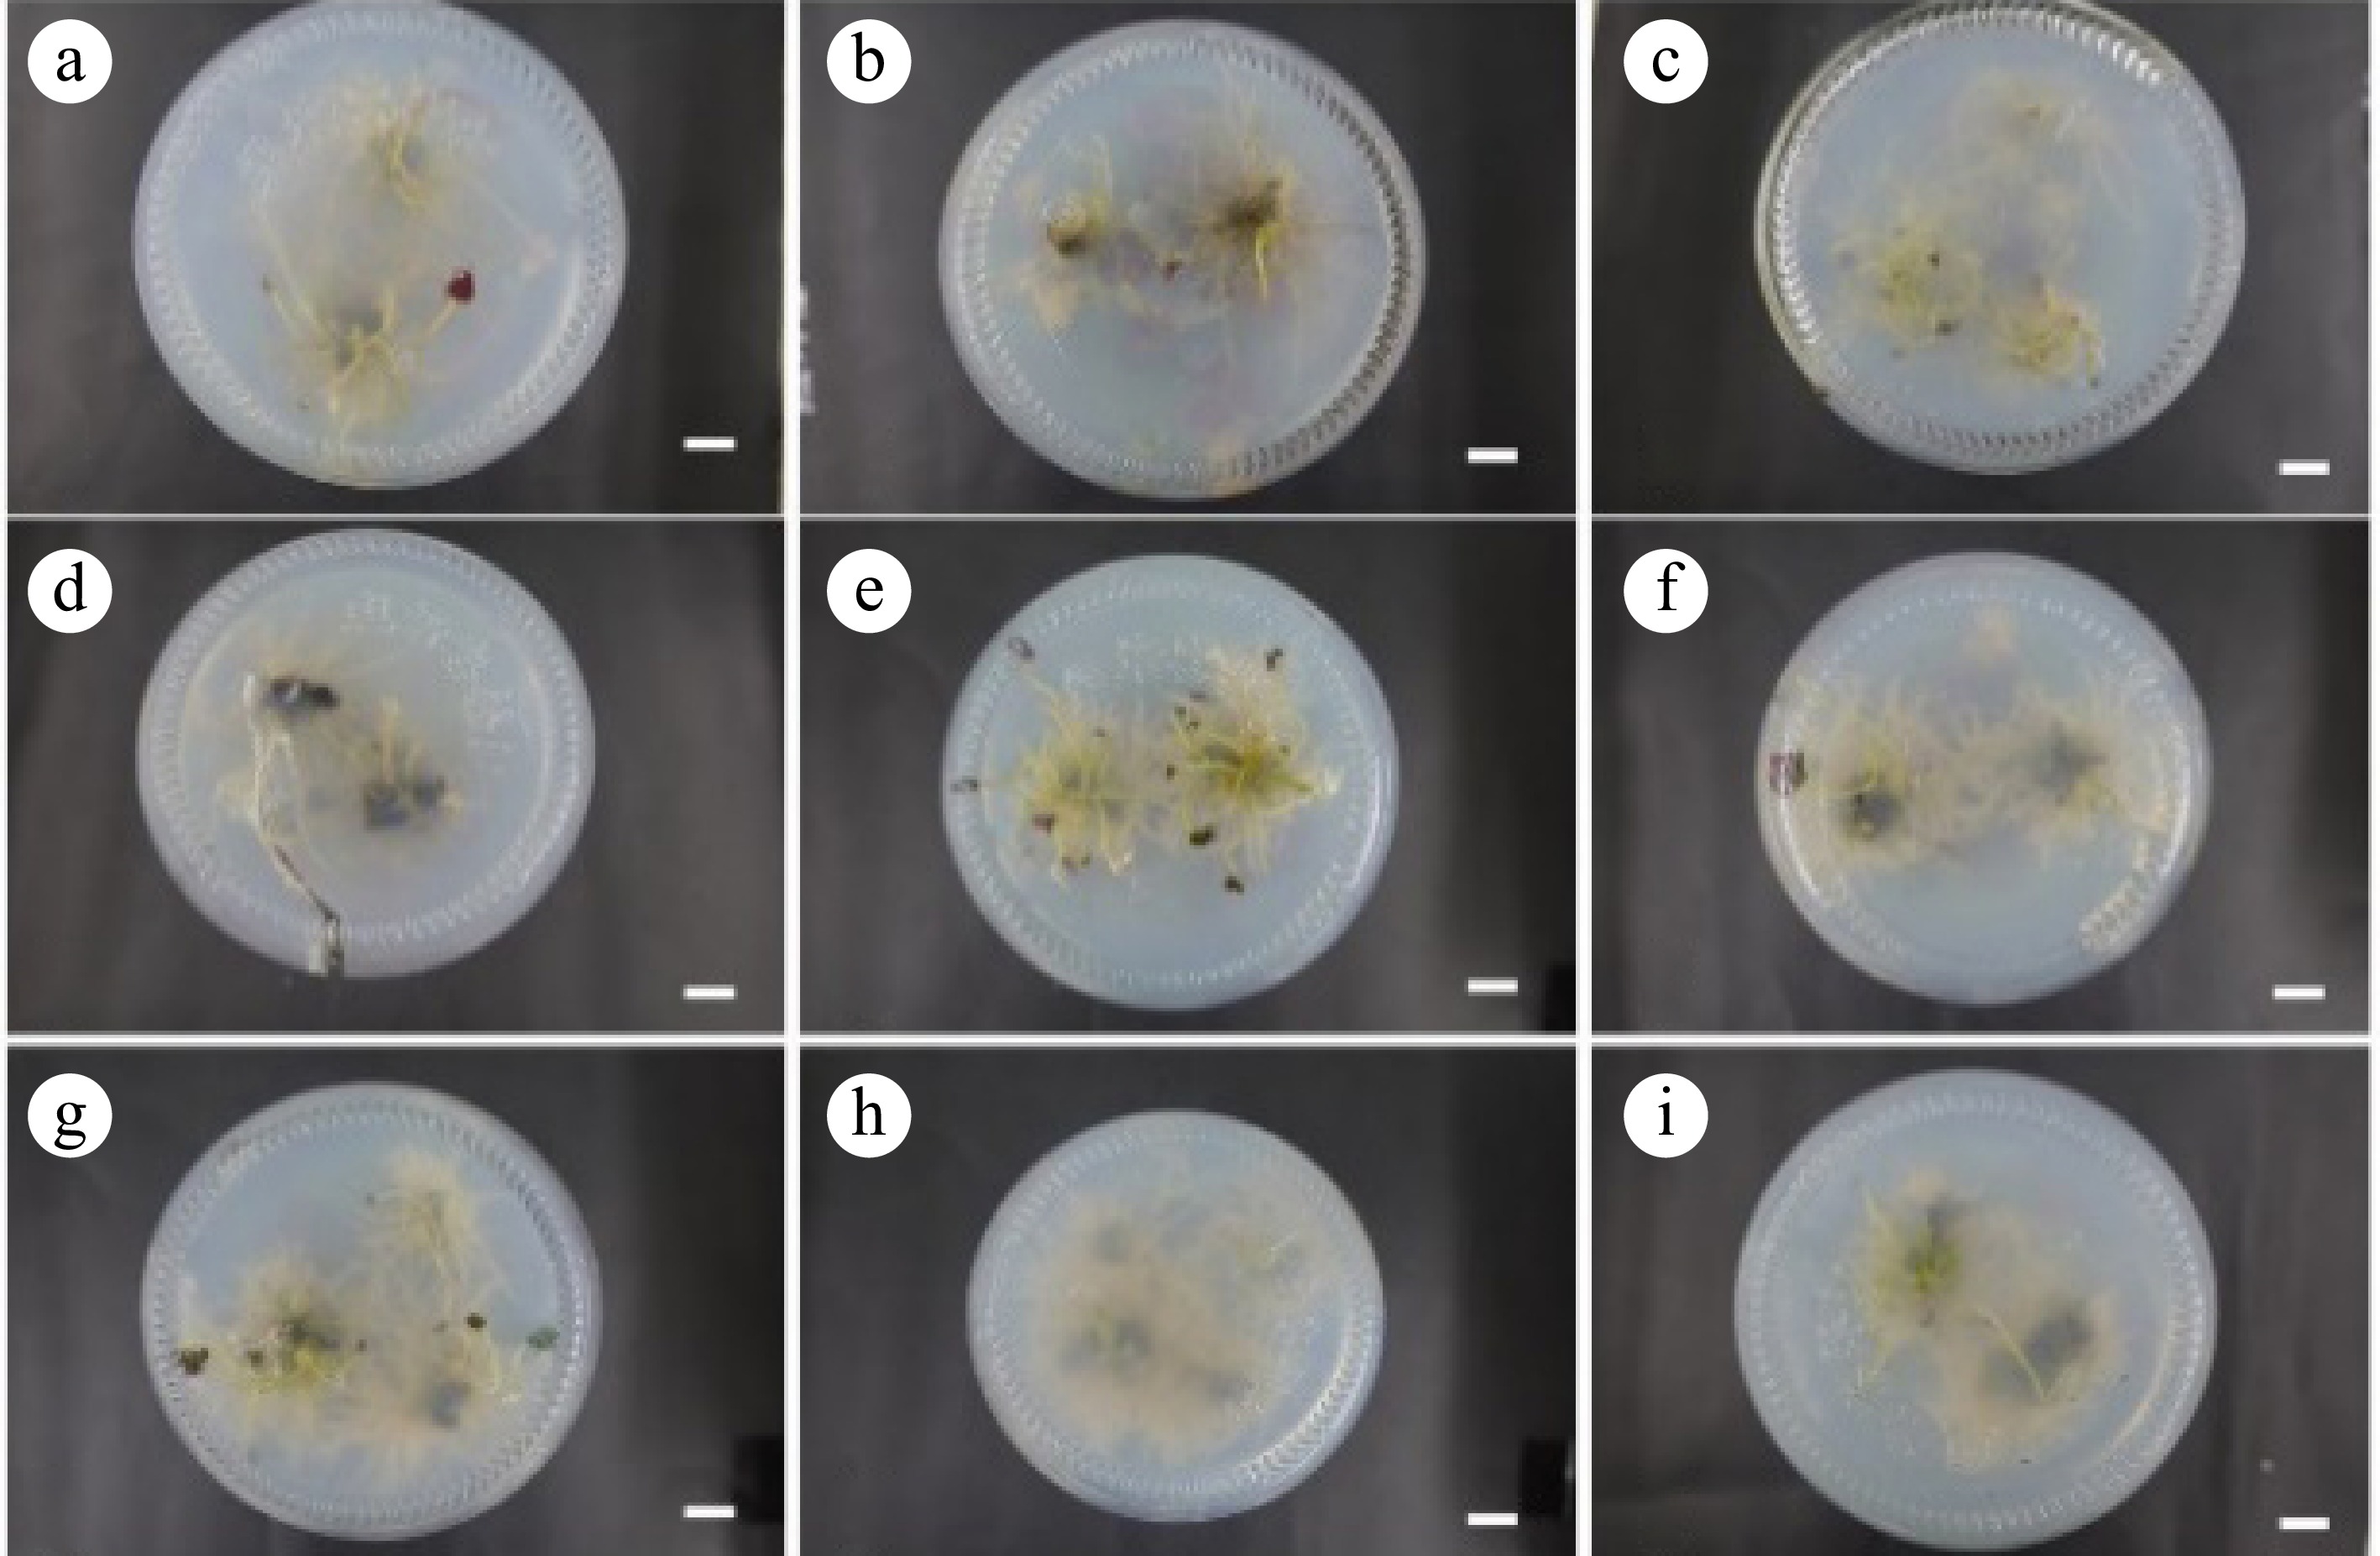
Figure 5.
Rooting results at 30 d. (a)−(i) Correspond to the 30 d rooting results of the R1−R9 groups, respectively. Scale bar = 1 cm.
-

Figure 6.
Transplanting of sterile bulbs. (a) Sterile bulbs of different sizes. (b) Growth state of sterile bulbs transplanted for 20 d. (c) Growth state of sterile bulbs transplanted for 45 d. Scale bar = 1 cm.
-
Treatment TDZ concentrations (mg·L−1) Callus status Callus volume Granular callus induction rate (%) Differentiation rate/% Differentiation coefficient T1 0.00 White, loose Only produced at both ends
of the wound15.43 ± 5.05de 98.67 ± 1.44a 11.19 ± 0.45a T2 0.50 Purple, granular, loose Produced at whole petioles 45.48 ± 5.07ab 65.00 ± 5.00b 3.19 ± 0.27b T3 1.00 Purple, granular Produced at whole petioles 53.33 ± 7.64a 58.33 ± 2.89c 3.06 ± 0.35b T4 1.50 Purple, granular Produced at whole petioles 32.87 ± 9.31bc 43.33 ± 0.06e 2.39 ± 0.32c T5 2.00 Purple, granular,
partial white looseProduced at whole petioles 7.78 ± 7.69f 52.22 ± 1.93d 2.40 ± 0.18c T6 2.50 Purple, granular,
partial white looseProduced at whole petioles 27.78 ± 1.92cd 52.22 ± 13.88d 3.39 ± 0.49b The data are mean ± standard deviation. Different letters after the same column of numbers indicate significant differences between different treatments (p < 0.05). Table 1.
Effects of different TDZ concentrations on callus induction and differentiation of petiole.
-
Treatment TDZ concentrations (mg·L−1) Callus volume Initial induction of callus (d) Differentiation rate (%) Differentiation coefficient T1 0.00 Only produced around the wound 24 97.38 ± 2.27a 9.23 ± 0.64a T2 0.50 Produced at whole leaves 15 25.56 ± 7.70b 4.26 ± 0.52bc T3 1.00 Produced at whole leaves 15 11.11 ± 1.93cd 4.33 ± 2.75bc T4 1.50 Produced at whole leaves 15 8.33 ± 2.89d 1.5 ± 0.50c T5 2.00 Produced at whole leaves 15 13.33 ± 7.64cd 5.33 ± 3.21b T6 2.50 Produced at whole leaves 15 29.47 ± 32.21bc 2.67 ± 0.95bc The data are mean ± standard deviation, and different letters after the same column of numbers indicate significant differences between different treatments (p < 0.05). Table 2.
Effects of different TDZ concentrations on callus induction and differentiation of leaf leaves.
-
Treatment 6-BA concentration (mg·L−1) NAA concentration (mg·L−1) Biomass gain multiple Callus multiplier multiple Callus texture and color D1 0.50 0.20 3.23 ± 0.14b 3.22 ± 0.18a Purple, loose D2 1.50 0.20 4.23 ± 0.16a 3.47 ± 0.12a White, green, few bud points D3 2.50 0.20 3.37 ± 0.16b 3.29 ± 0.15a White, green, few bud points of granular callus D4 0.50 0.40 3.54 ± 0.67b 3.19 ± 0.10a White D5 1.50 0.40 3.43 ± 0.14b 3.33 ± 0.08a White, dense partial bud points D6 2.50 0.40 4.05 ± 0.37a 3.39 ± 0.29a Green, multiple differentiation numbers CK 0.00 0.00 1.93 ± 0.09c 1.86 ± 0.07b Green, browning on the lower part, low proliferation numbers The data are mean ± standard deviation, and different letters after the same column of numbers indicate significant differences between different treatments (p < 0.05). Table 3.
Effects of different 6-BA and NAA concentrations on adventitious bud rooting.
-
Treatment Concentrations of IBA
(mg·L−1)Biomass gain multiple Plant status CK 0.00 4.51 ± 0.94e Slender petioles C1 0.10 6.92 ± 0.46c Slender and long petioles green leaves C2 0.20 11.60 ± 0.40b Purple petoiles big leaves C3 0.30 13.52 ± 0.41a Green petioles and leaves granular calli C4 0.40 5.95 ± 0.50cd Short plants C5 0.50 5.88 ± 0.41cd Short plants The data are mean ± standard deviation, and different letters after the same column of numbers indicate significant differences between different treatments (p < 0.05). Table 4.
Effects of different IBA concentrations on the induction of adventitious buds.
-
Treatment Concentrations
of IBA
(mg·L−1)Concentrations
of NAA
(mg·L−1)Rooting
rate (%)Average number of roots
(bar·plant−1)Average root length (cm) Height (cm) Average bulb quantity
(pcs)Root growth
statusR1 0.00 0.00 91.11 ± 2.48f 7.11 ± 0.08f 1.82 ± 0.15abc 5.71 ± 0.31bcd 0.51 ± 0.32cd Lateral roots on the taproot, large leaves R2 0.10 0.00 92.22 ± 3.06e 5.33 ± 0.49g 1.53 ± 0.41abcde 5.10 ± 0.46d 0.95 ± 0.93bcd Few roots, long taproots R3 0.30 0.00 91.11 ± 2.48f 7.05 ± 0.91f 1.43 ± 0.25bcde 6.13 ± 0.10abc 0.00 ± 0.00d Few roots, thick taproots, no lateral root R4 0.00 0.30 93.33 ± 2.36d 6.33 ± 0.49fg 1.18 ± 0.10de 5.52 ± 0.63cd 0.37 ± 0.19d Thick taproots, no lateral root R5 0.10 0.30 91.11 ± 2.48f 12.89 ± 0.87d 1.63 ± 0.12abcd 6.46 ± 0.16ab 1.99 ± 0.79a Very thick taproots, no lateral root R6 0.30 0.30 100 ± 0.0a 28.16 ± 0.51a 1.96 ± 0.16a 6.62 ± 0.55ab 2.12 ± 0.44a Thick roots, no lateral roots,
numerous rootsR7 0.00 0.50 95.56 ± 3.42b 26.08 ± 0.33b 1.88 ± 0.06ab 7.04 ± 0.30a 2.24 ± 0.30a Thick taproots, no lateral root R8 0.10 0.50 94.44 ± 5.48c 28.25 ± 0.80a 1.40 ± 0.11cde 6.63 ± 0.18ab 1.50 ± 0.84abc Numerous and dense roots, but short, no lateral root R9 0.30 0.50 95.56 ± 6.34b 19.85 ± 0.40c 1.15 ± 0.14e 6.84 ± 0.37a 1.85 ± 0.46ab Thin, short, numerous root The data are mean ± standard deviation, and different letters after the same column of numbers indicate significant differences between different treatments (p < 0.05). Table 5.
Effects of different concentrations of IBA and NAA on rooting.
Figures
(6)
Tables
(5)